AWS QuickSight
Introduction
Scalable, serverless, embeddable, ML-powered BI Service built for the cloud
Amazon QuickSight is a scalable, serverless, embeddable, machine learning-powered business intelligence (BI) service built for the cloud. QuickSight lets you easily create and publish interactive BI dashboards that include Machine Learning-powered insights. QuickSight dashboards can be accessed from any device, and seamlessly embedded into your applications, portals, and websites.
QuickSight is serverless and can automatically scale to tens of thousands of users without any infrastructure to manage or capacity to plan for. It is also the first BI service to offer pay-per-session pricing, where you only pay when your users access their dashboards or reports, making it cost-effective for large scale deployments.
With QuickSight, you can ask business questions of your data in plain language and receive answers in seconds.

Data Patterns
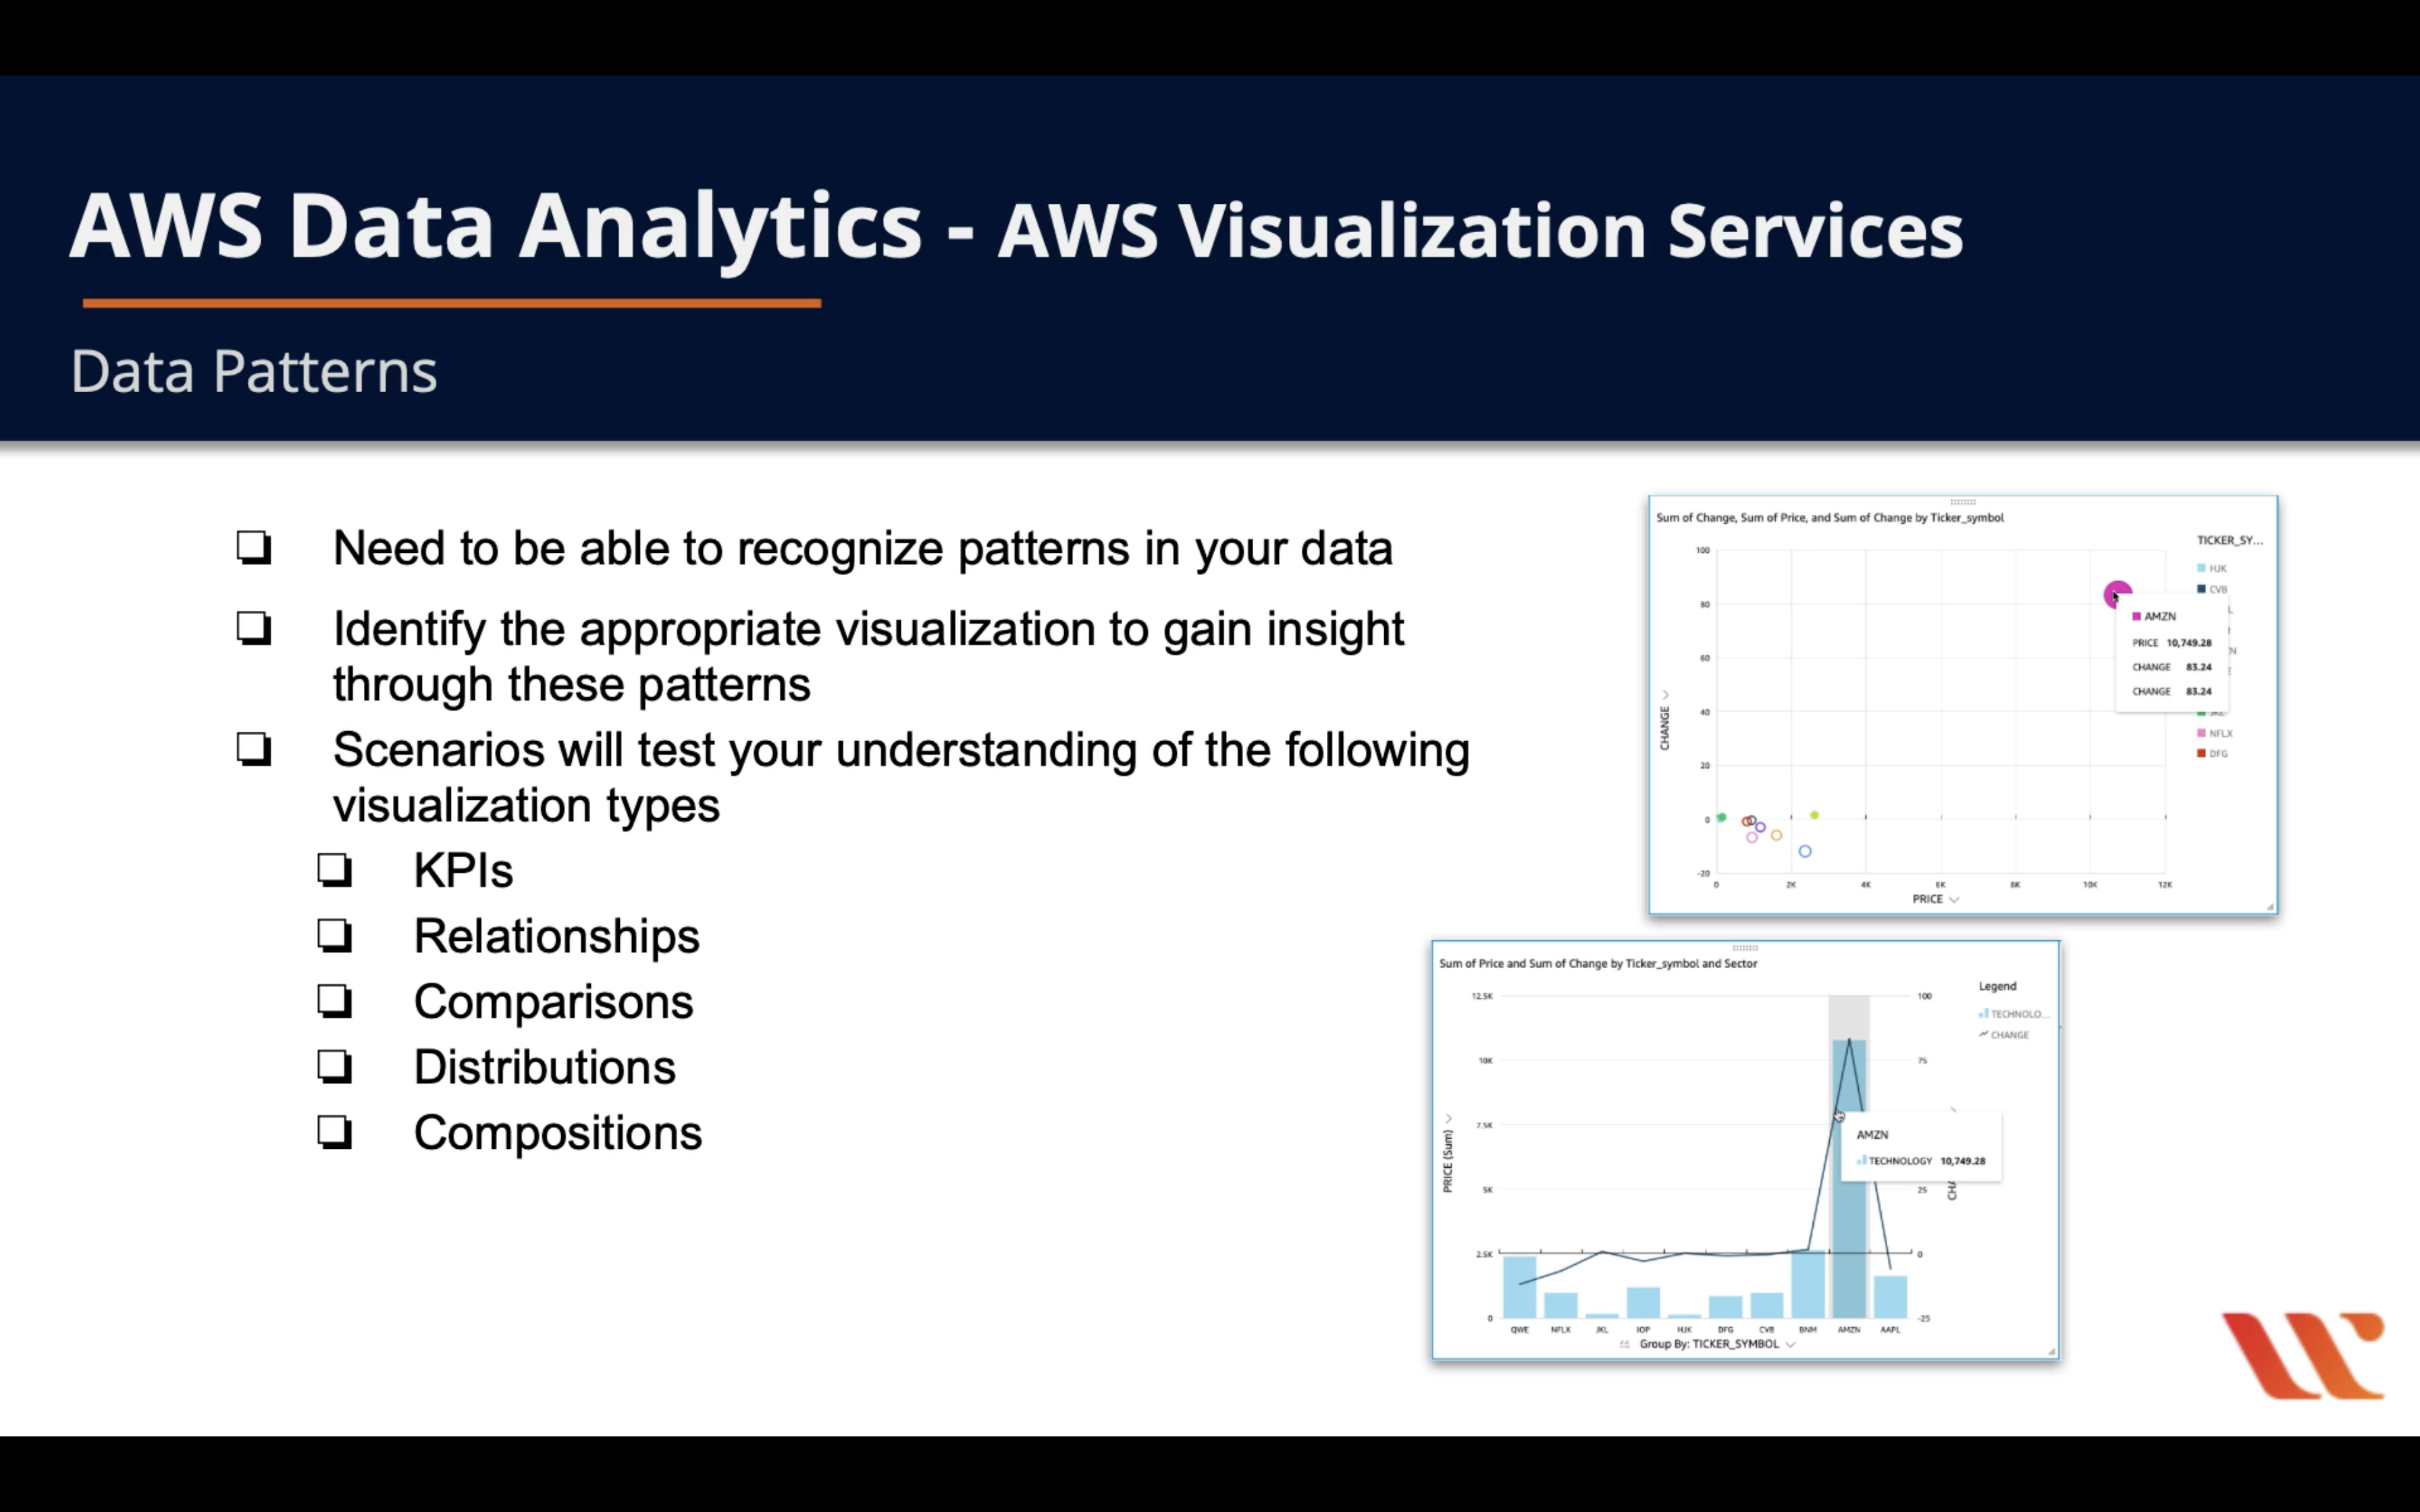
- Need to able to recognize patterns in your data
- Identify the appropriate visualization to gain insight through these patterns
- Scenarios will test your understanding of the following visualization types
- KPIs
- Relationships
- Comparisons
- Distributions
- Compositions
Data Visualizations - KPIs
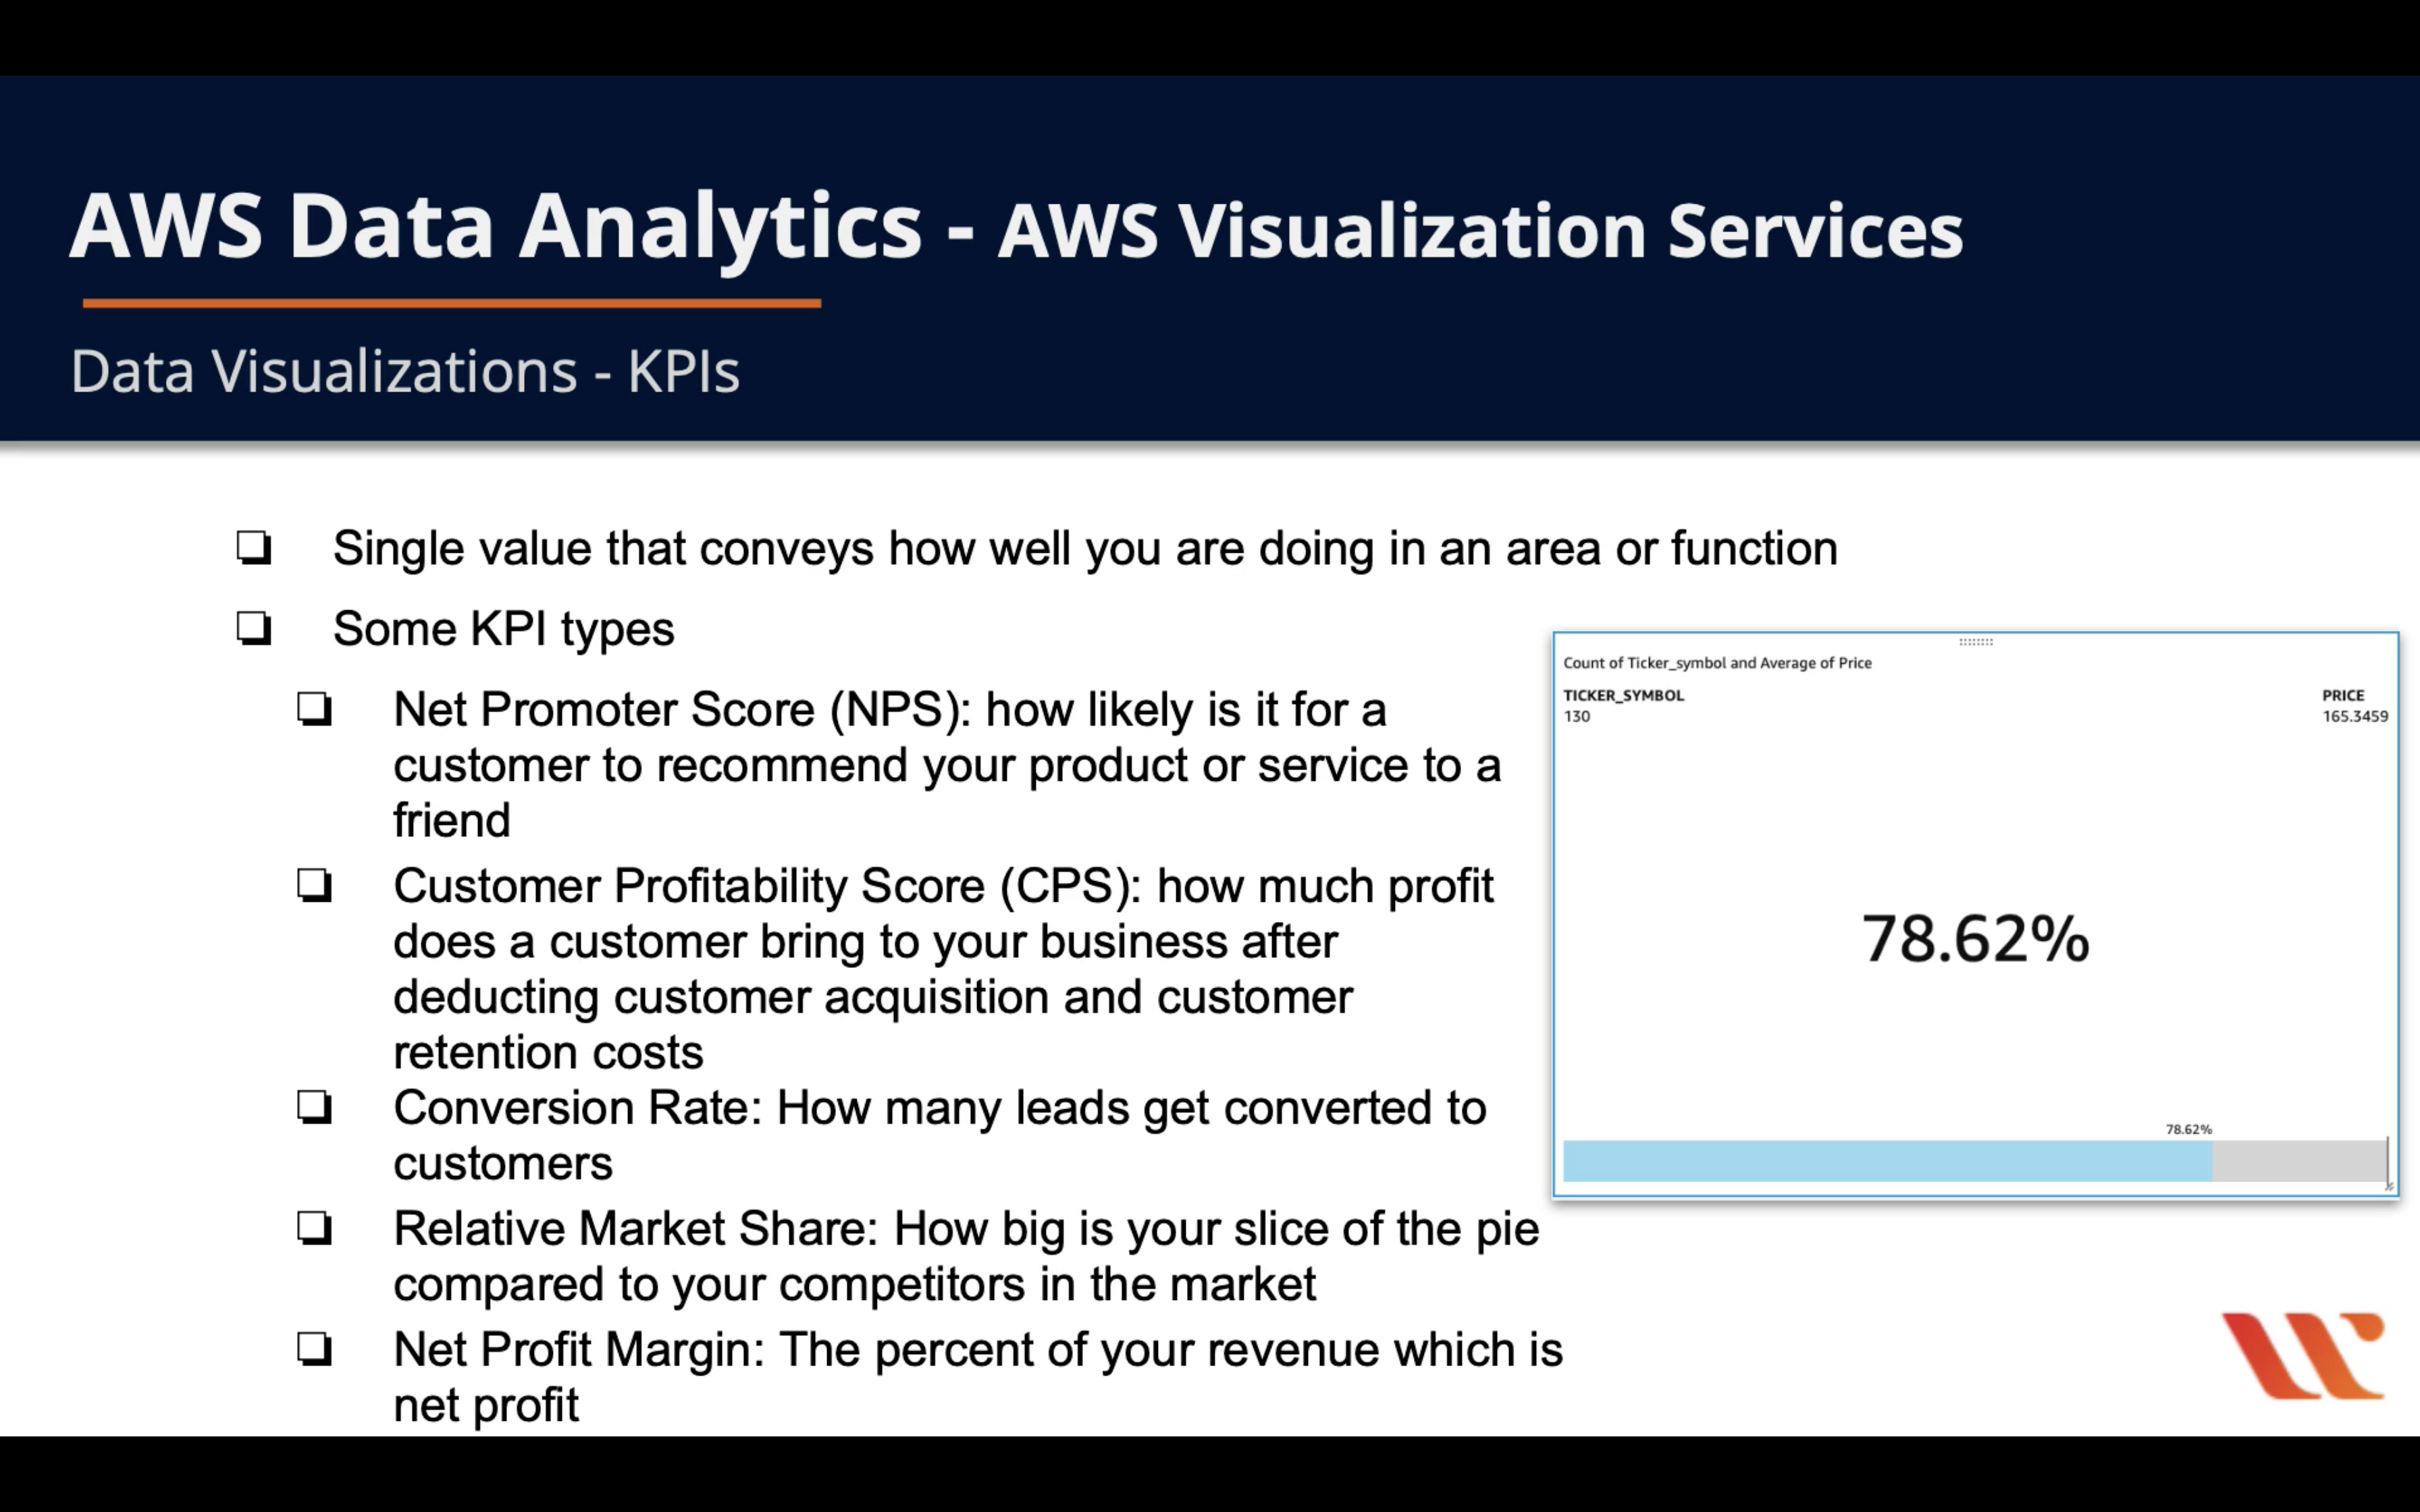
- Single value that conveys how well you are doing in an area or function
- Some KPI types
- Net Promoter Score (NPS): How likely is it for a customer to recommend your product or service to a friend
- Customer Profitability Score (CPS): How much profit does a customer bring to your business after deducting customer acquisition and customer retention costs
- Conversion Rate: How many leads get converted to customers
- Relative Market Share: How big is your slice of the pie compared to your competitors in the market
- Net Profit Margin: The percent of your revenue which is net profit
Data Visualization - Relationships
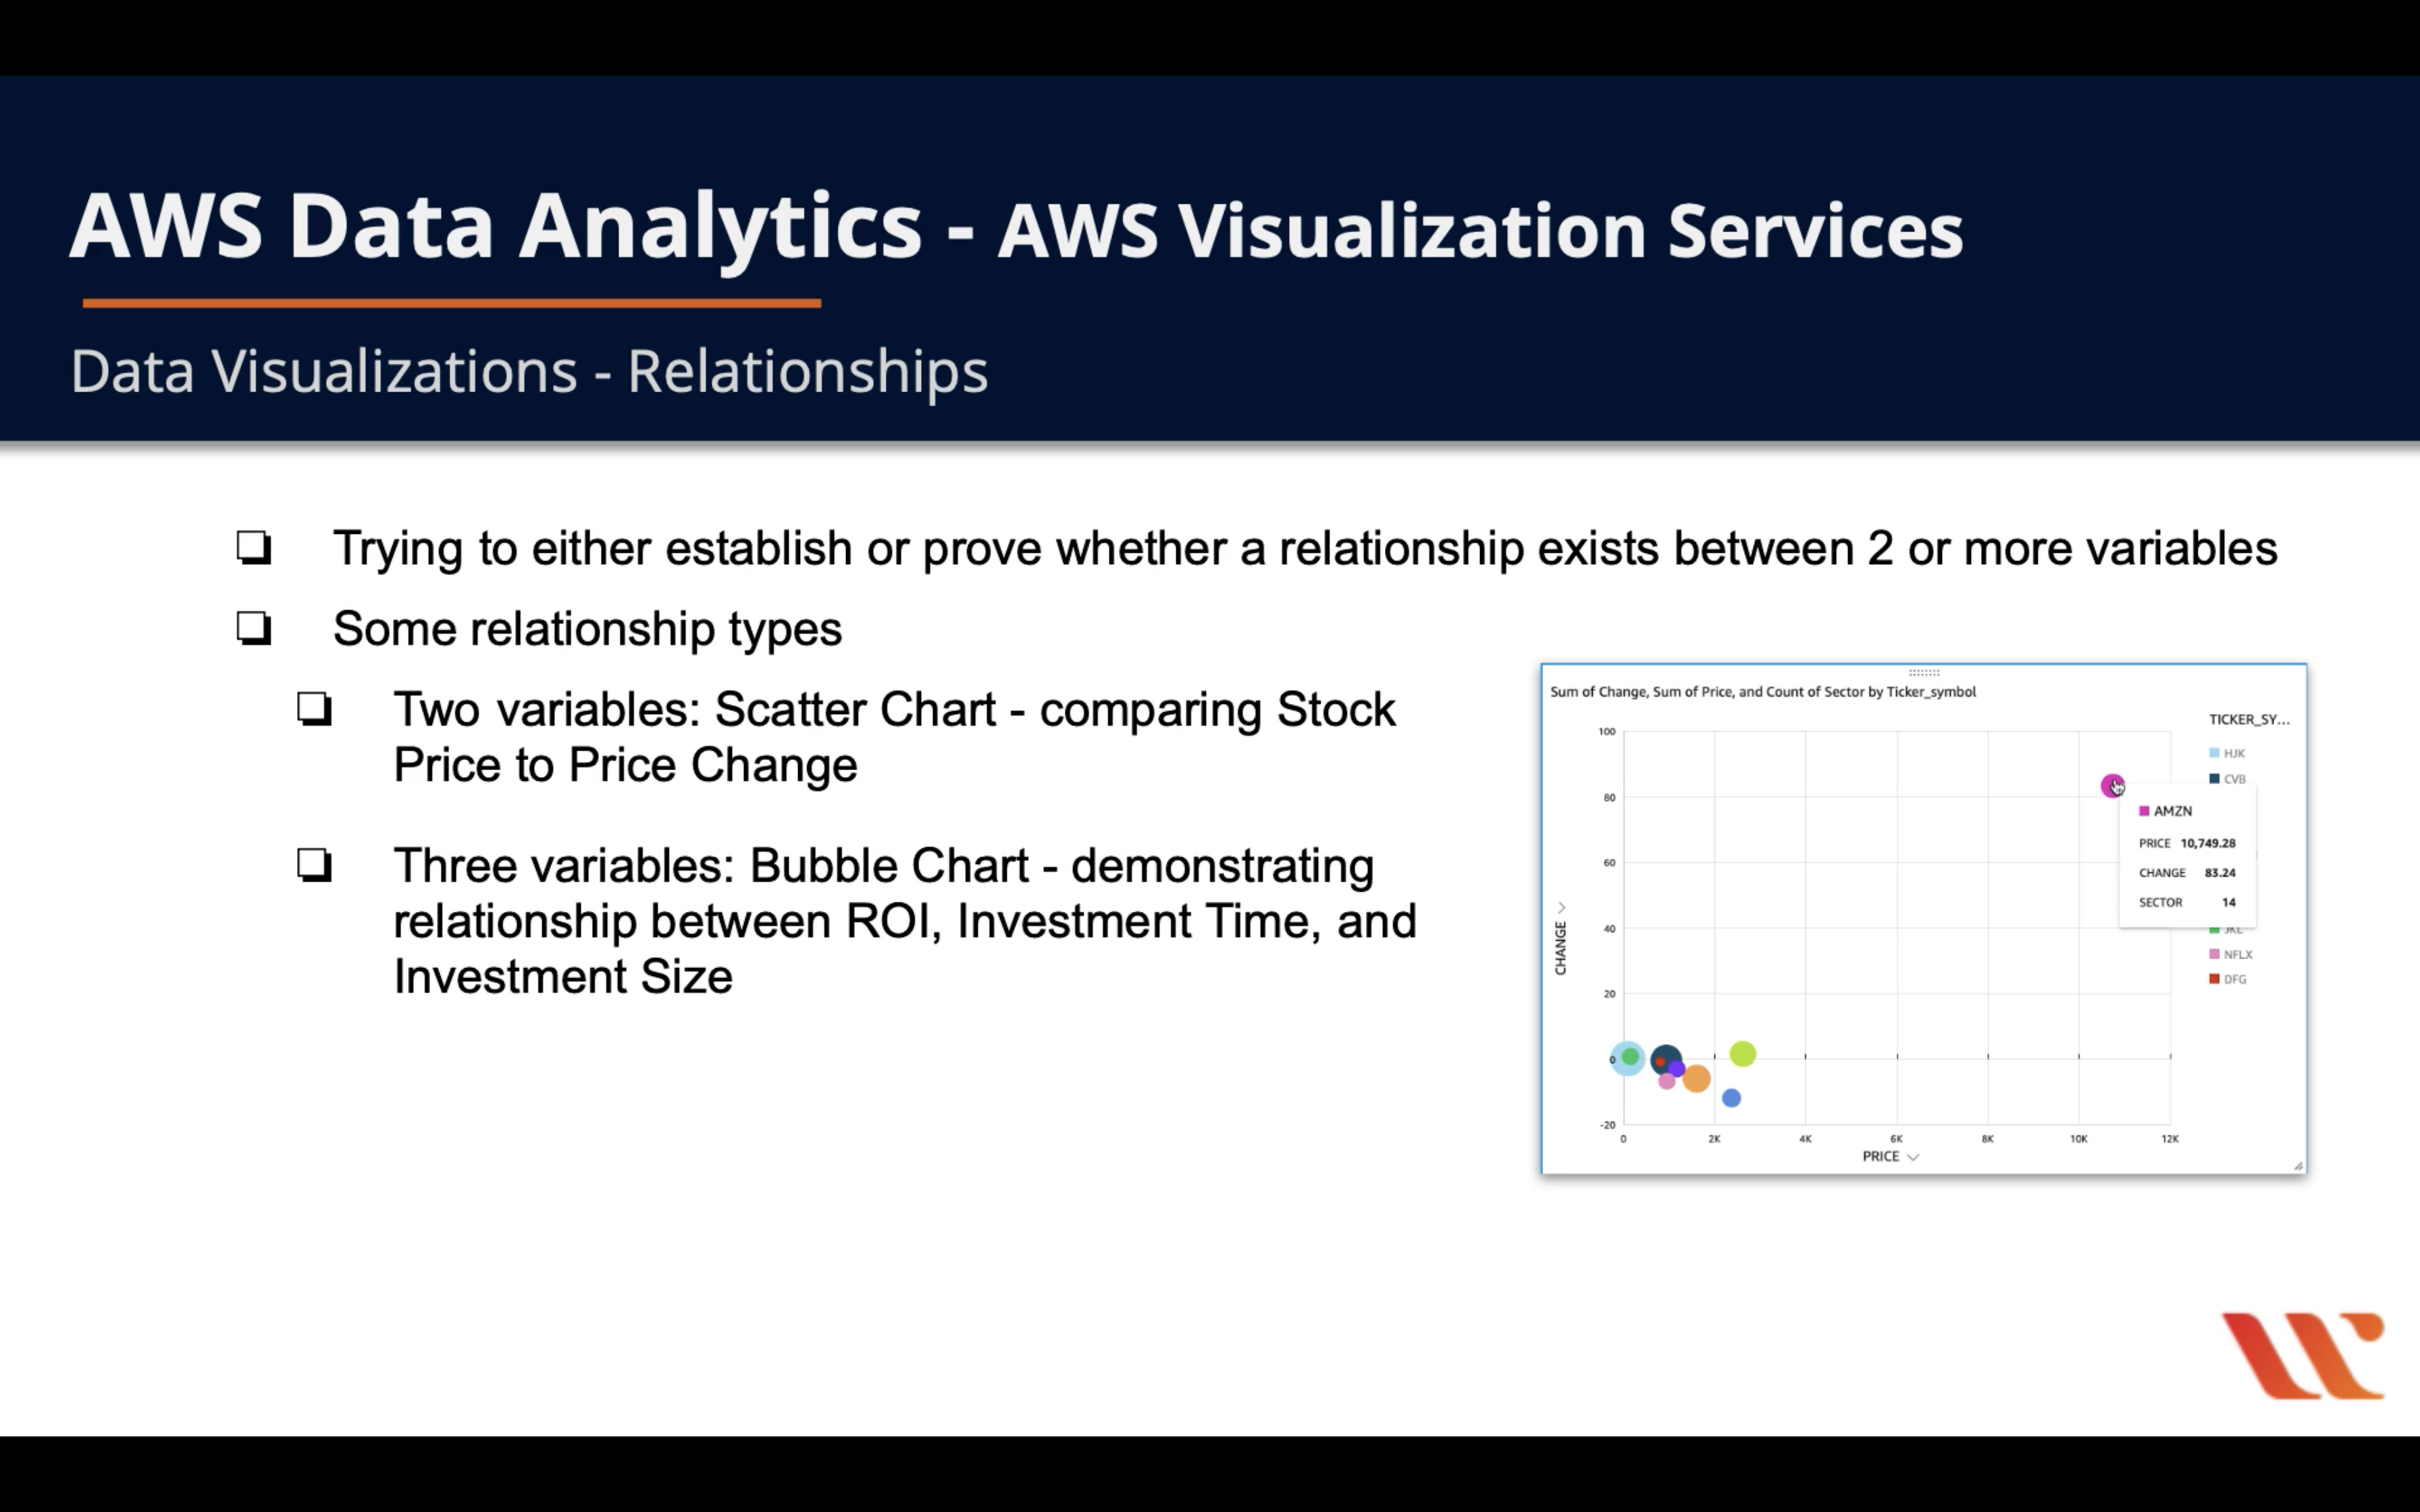
- Trying to either establish or prove whether a relationship exists between 2 or more variables
- Some relationship types
- Two variables: Scatter Chart - comparing Stock Price to Price Change
- Three variables: Bubble Chart - demonstrating relationship between ROI, Investment Time, and Investment Size
Data Visualization - Comparisons
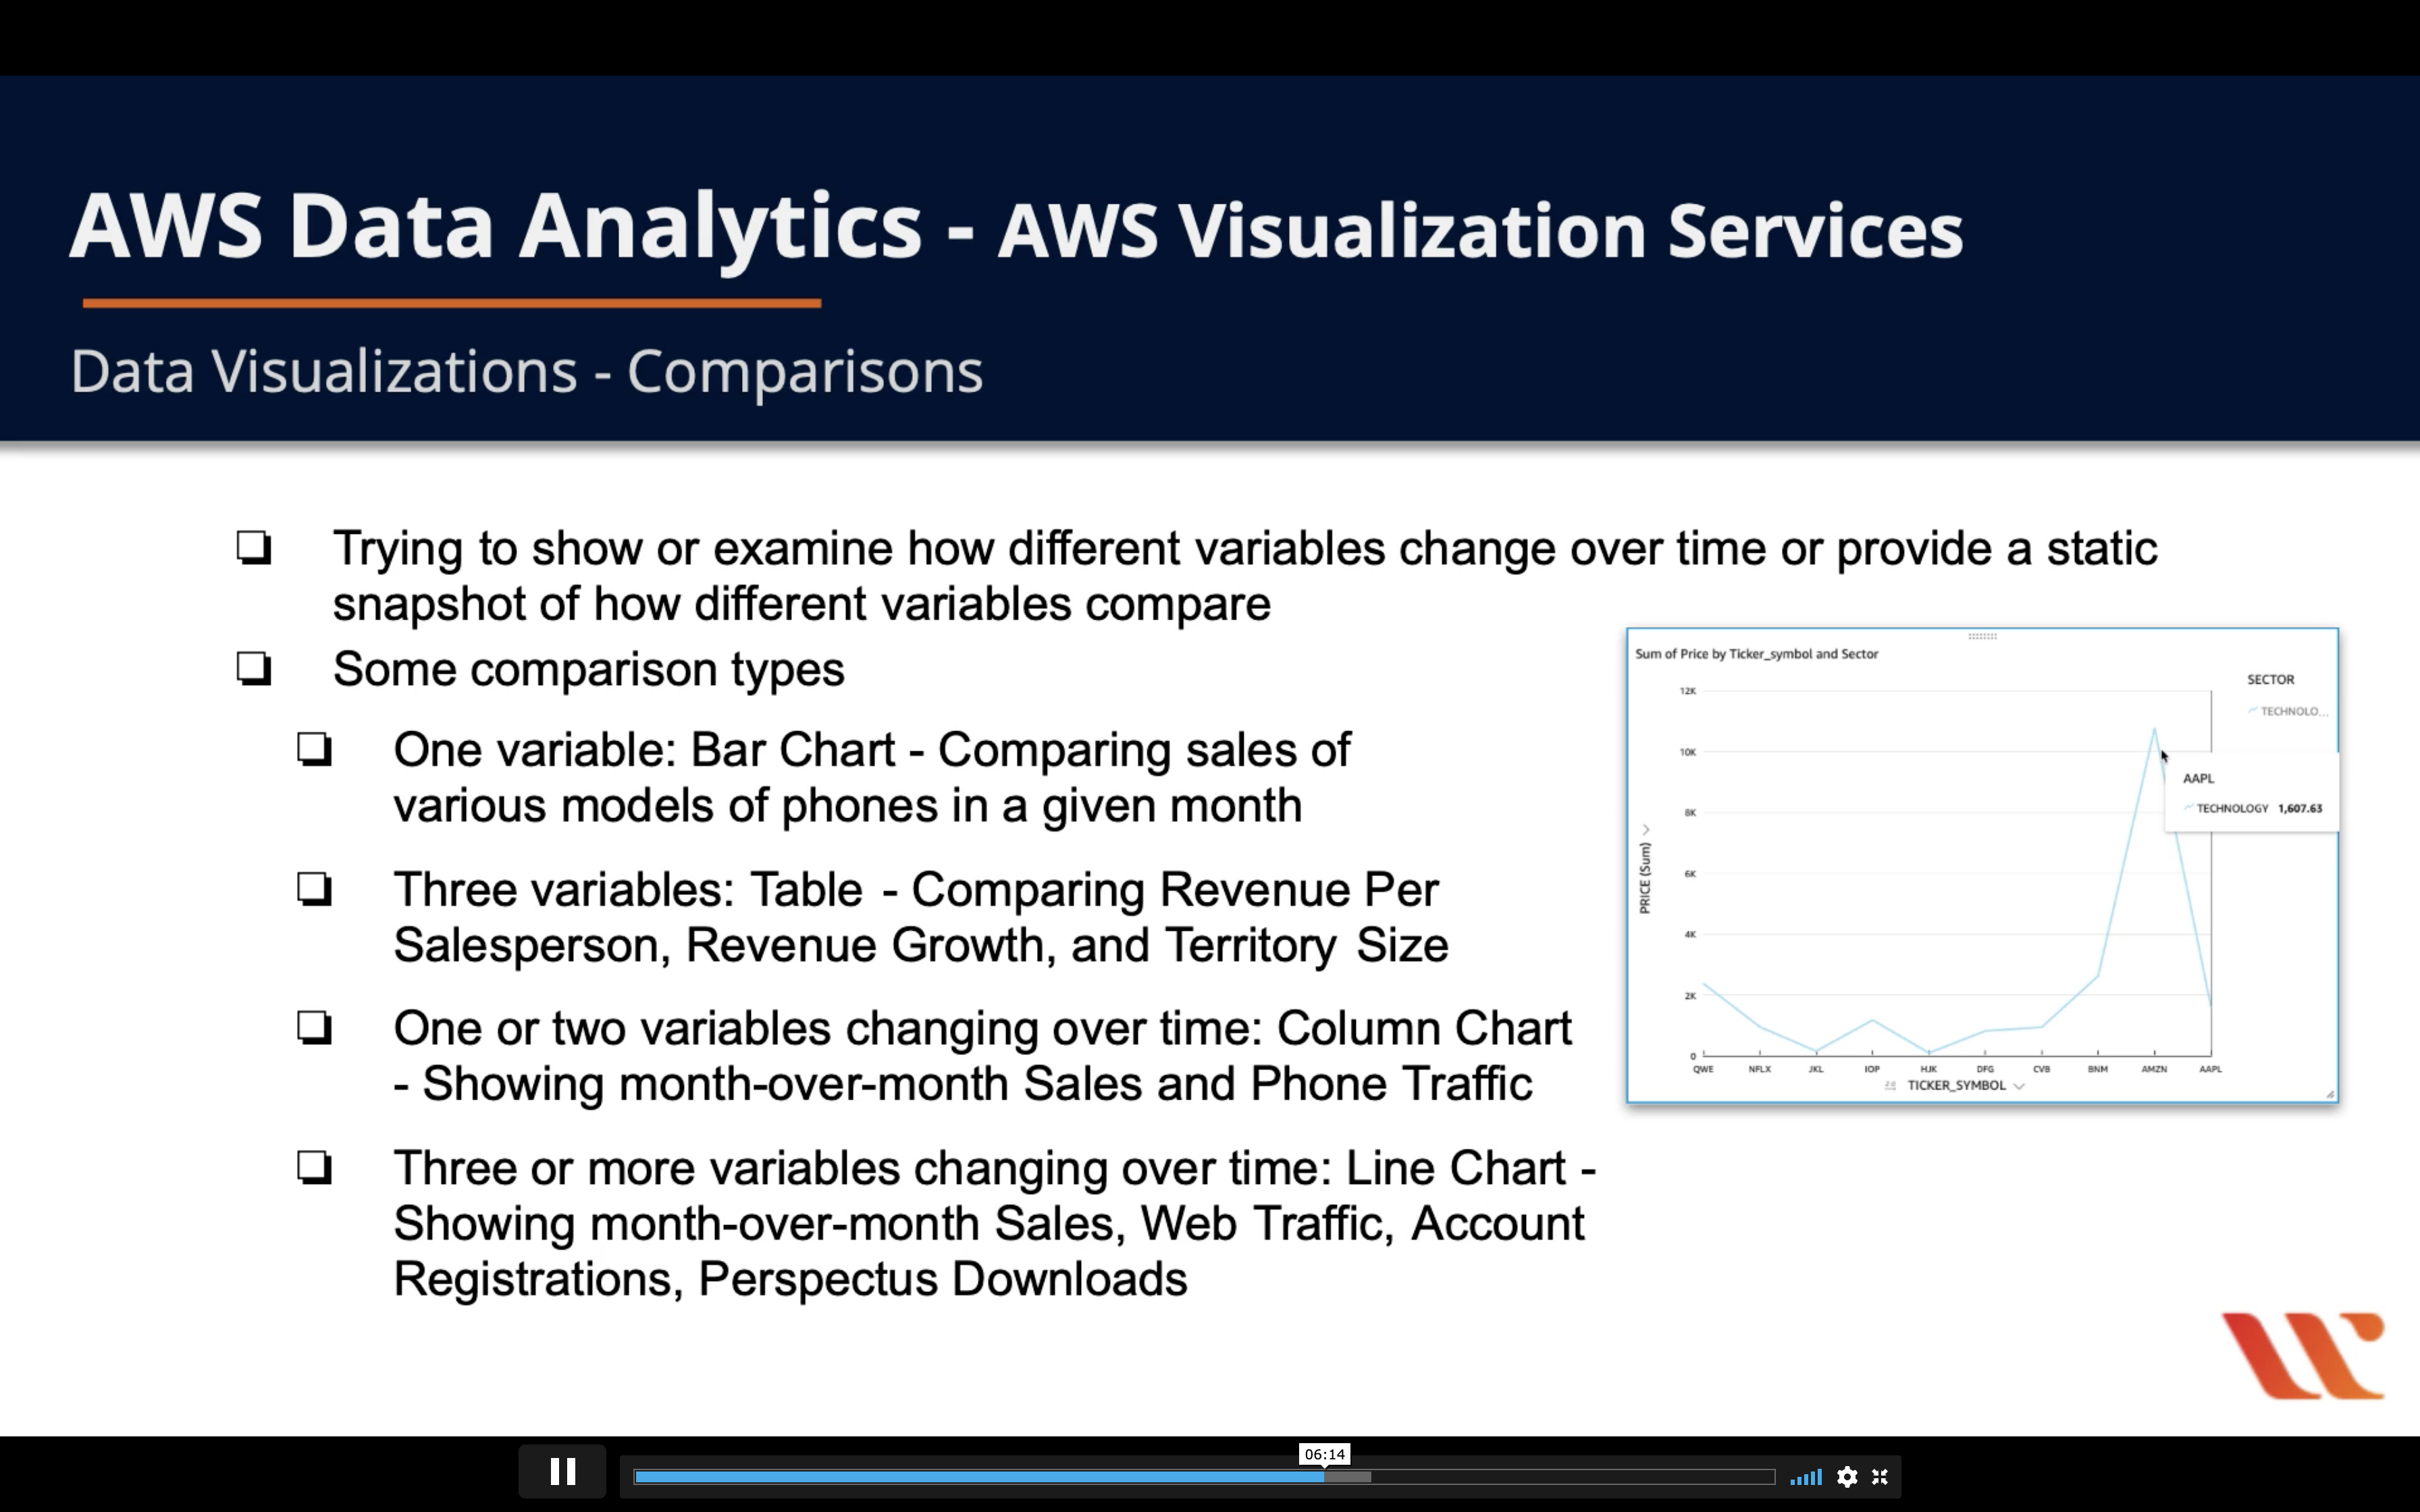
- Trying to show or examine how different variables change over time or provide a static snapshot of how different variables compare
- Some comparison types
- One variable: Bar chart - Comparing sales of various models of phones in a given month
- Three variables: Table - Comparing Revenue per Salesperson, Revenue Growth, and Territory Size
- One or two variables changing over time: Column Chart - Showing month-over-month Sales and Phone Traffic
- Three or more variables changing over time: Line Chart - Showing month-over-month Sales, Web Traffic, Account Registrations, Porspectus Downloads
Data Visualization - Distributions
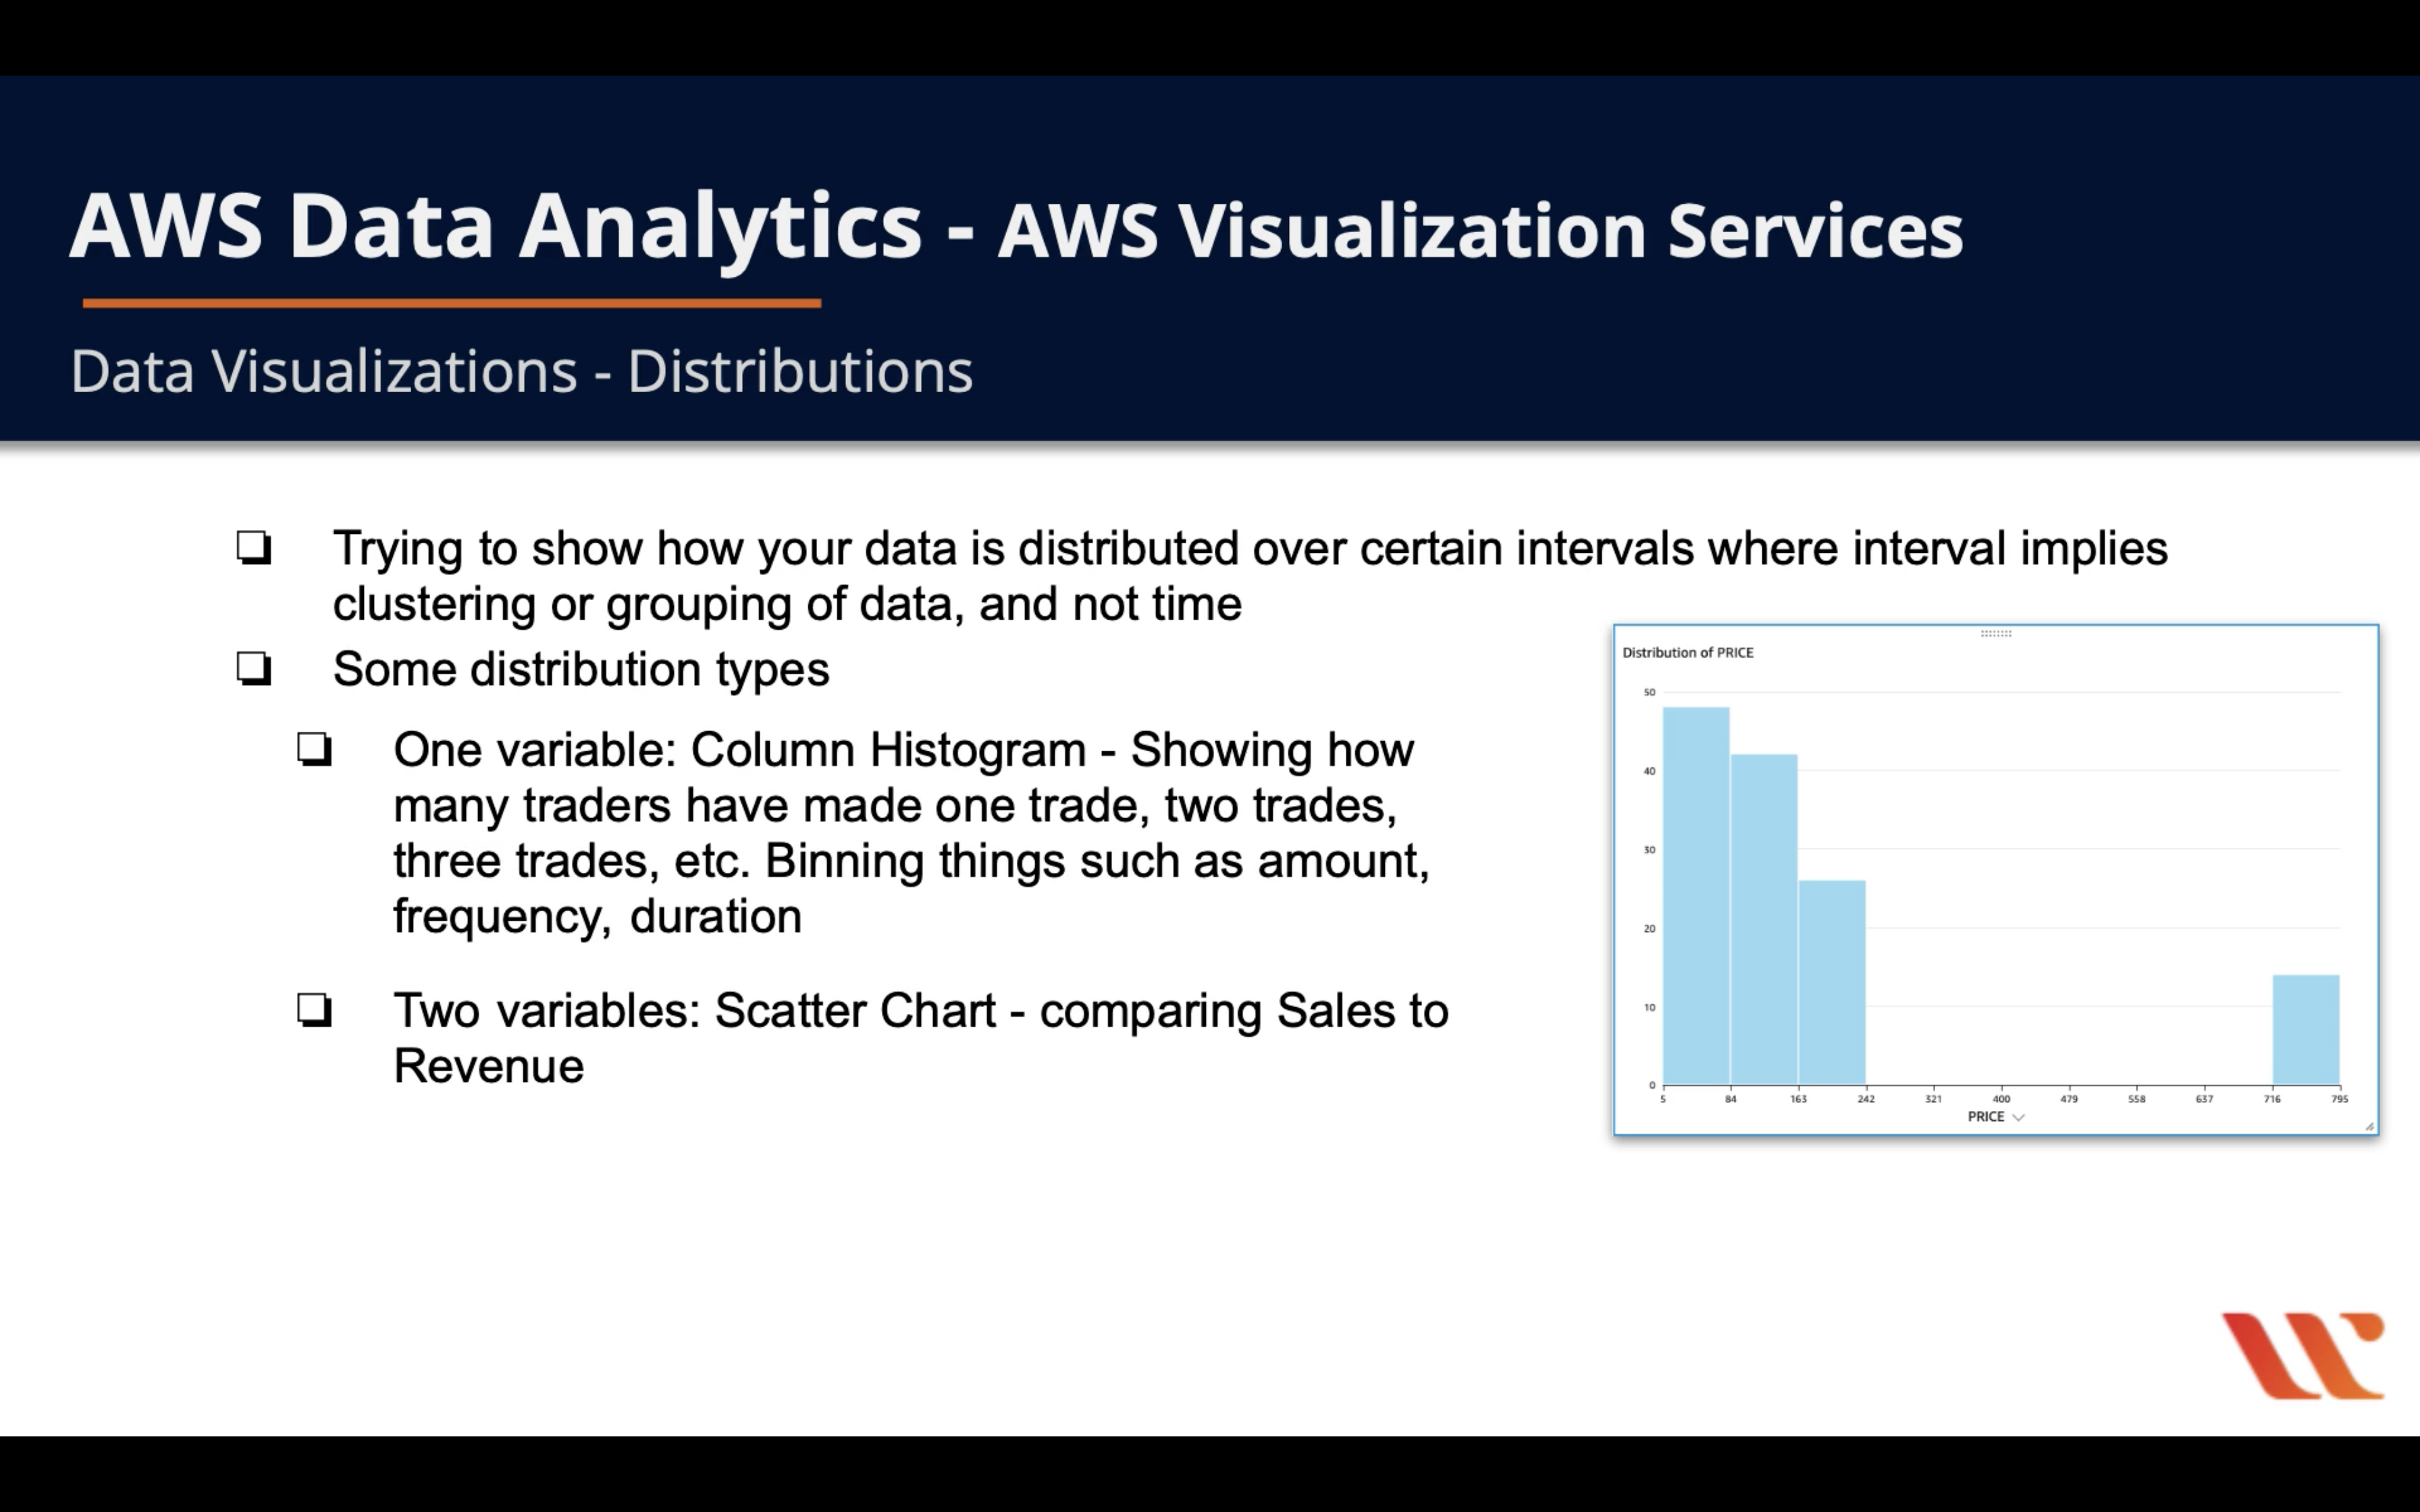
- Trying to show how your data is distributed over certain intervals where interval implies clustering or grouping of data, and not time
- Some distribution types
- One variables: Column Histogram - Showing how many traders have made one trade, two trades, three trades, etc. Binning things such as amount frequency, duration
- Two variables: Scatter Chart - comparing Sales to Revenue
Data Visualizations - Compositions
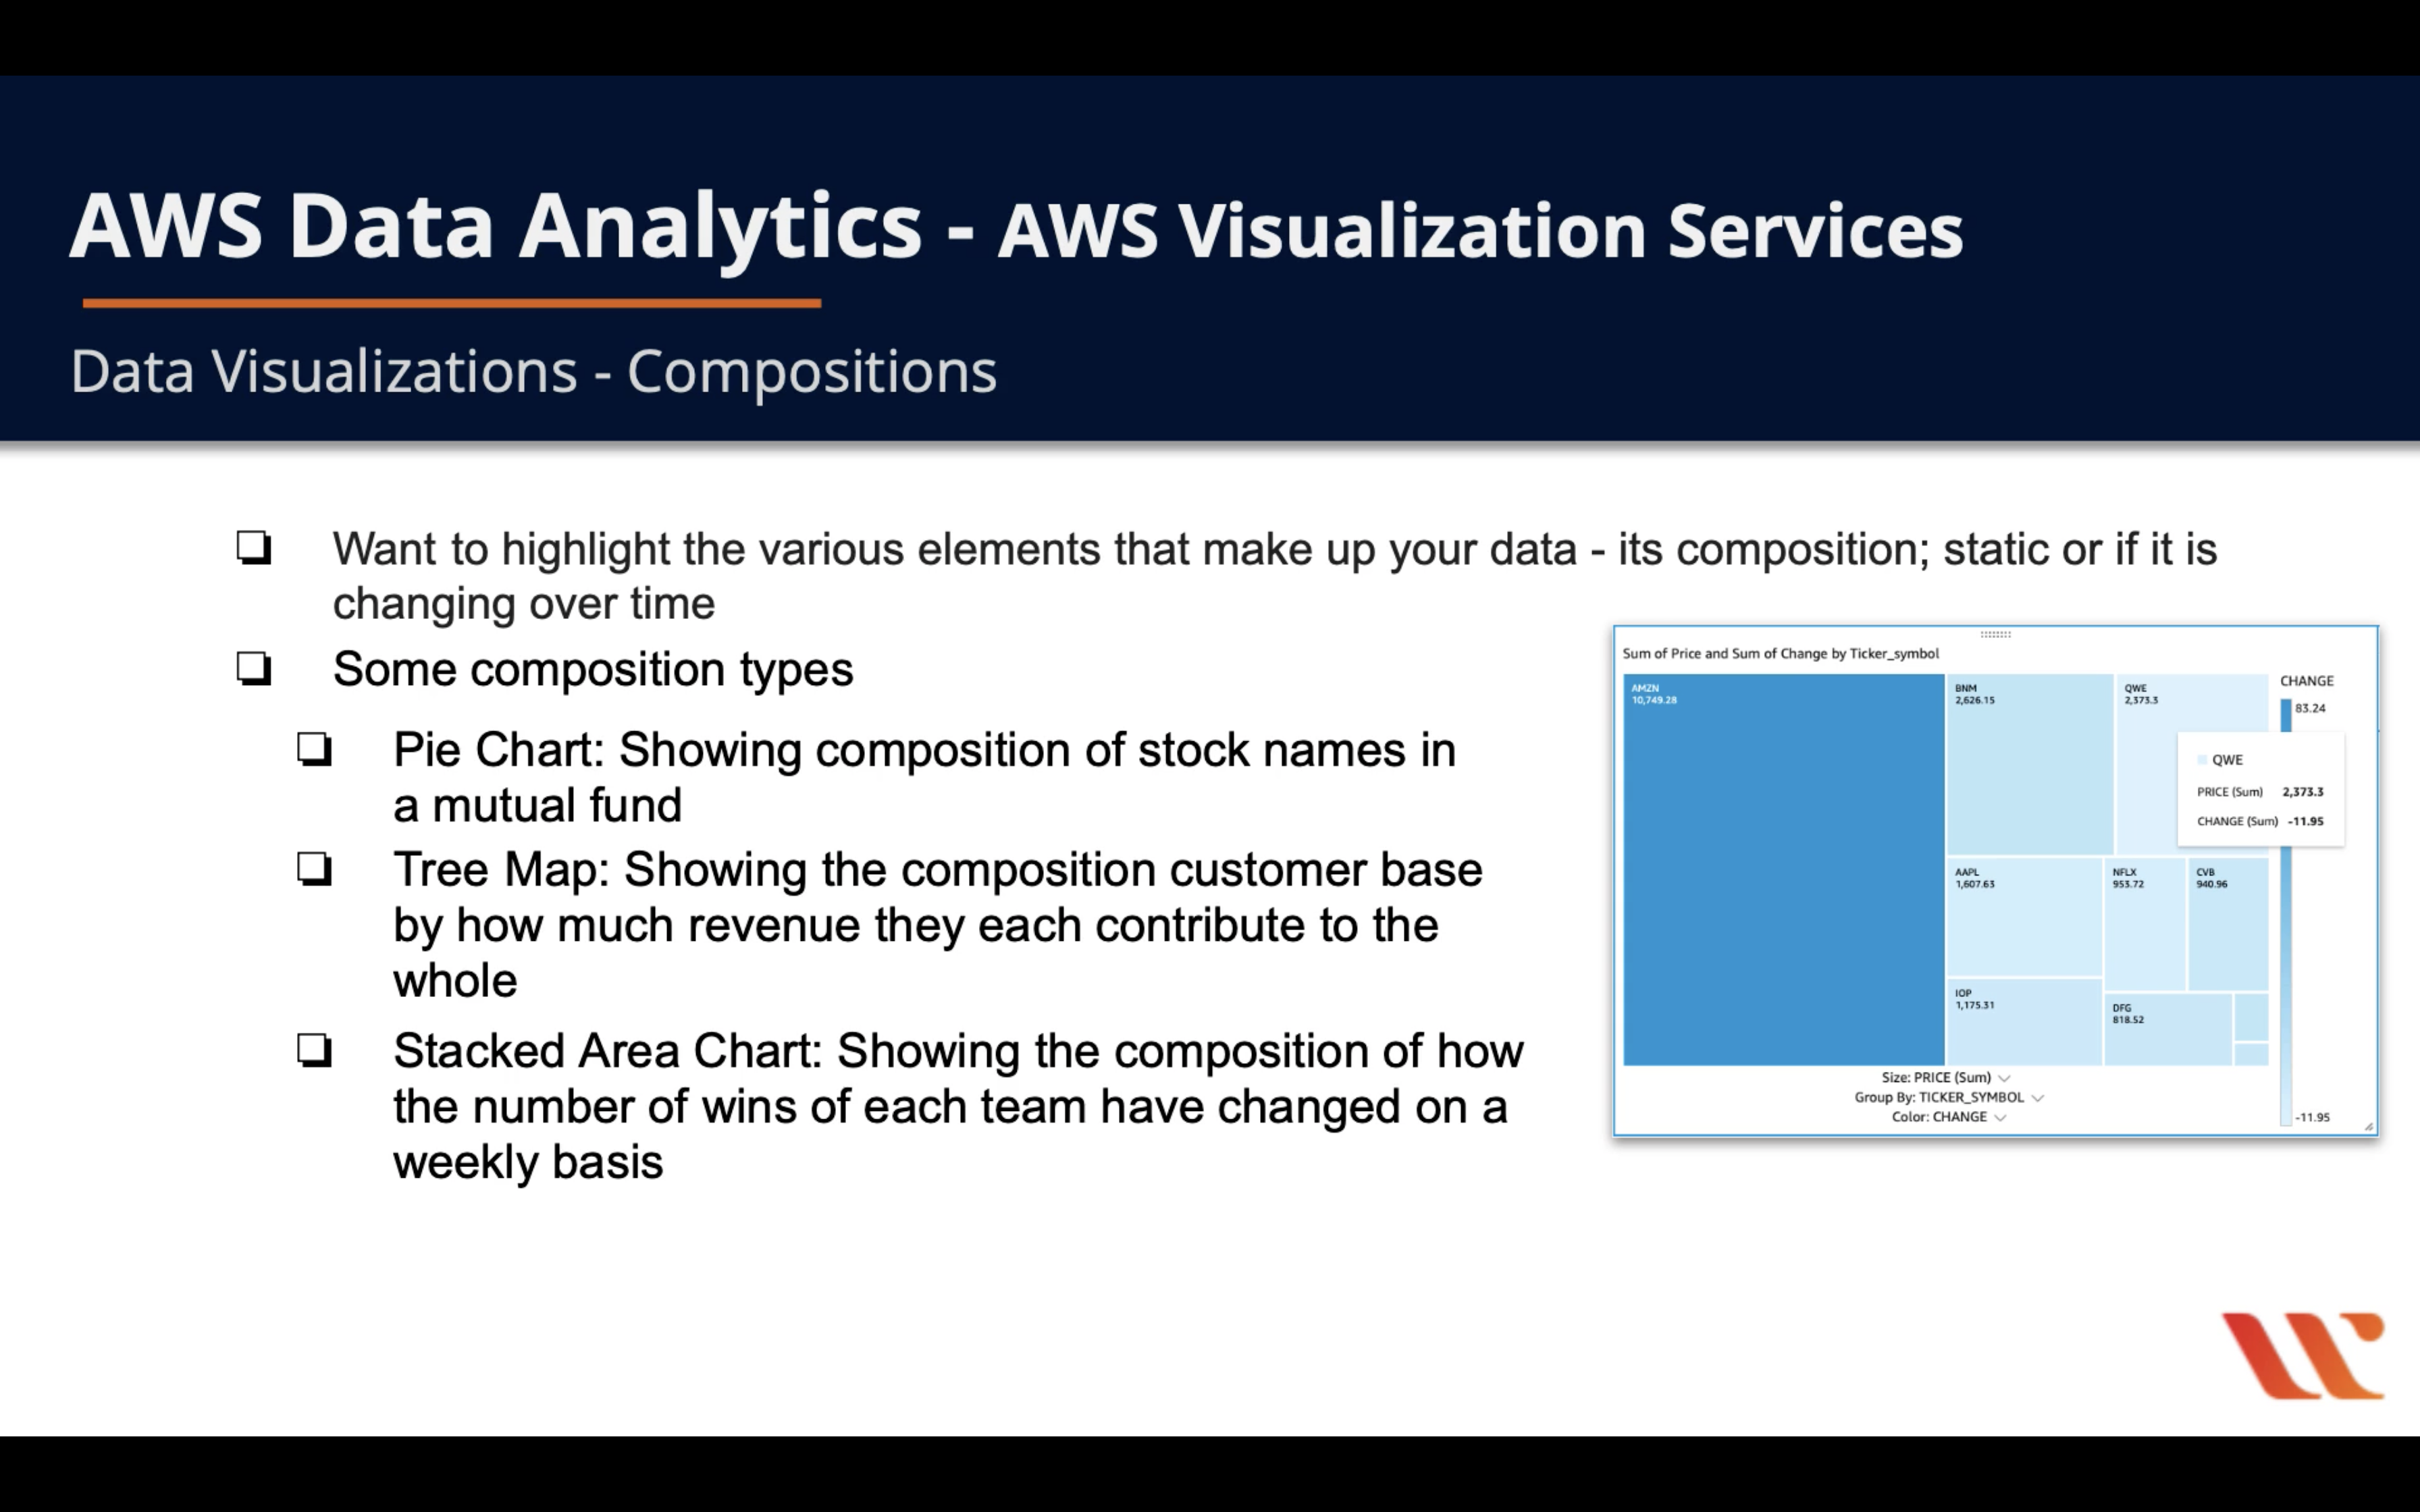
- Want to highlight the various elements that make up your data - its composition; static or if it is changing over time
- Some composition types
- Pie Chart: Showing composition of stock names in a mutual fund
- Tree Map: Showing the compositions customer base by how much revenue they each contribute to the whole
- Stacked Area Chart: Showing the composition of how the number of wins of each team have changed on a weekly basis
QuickSight Capabilities
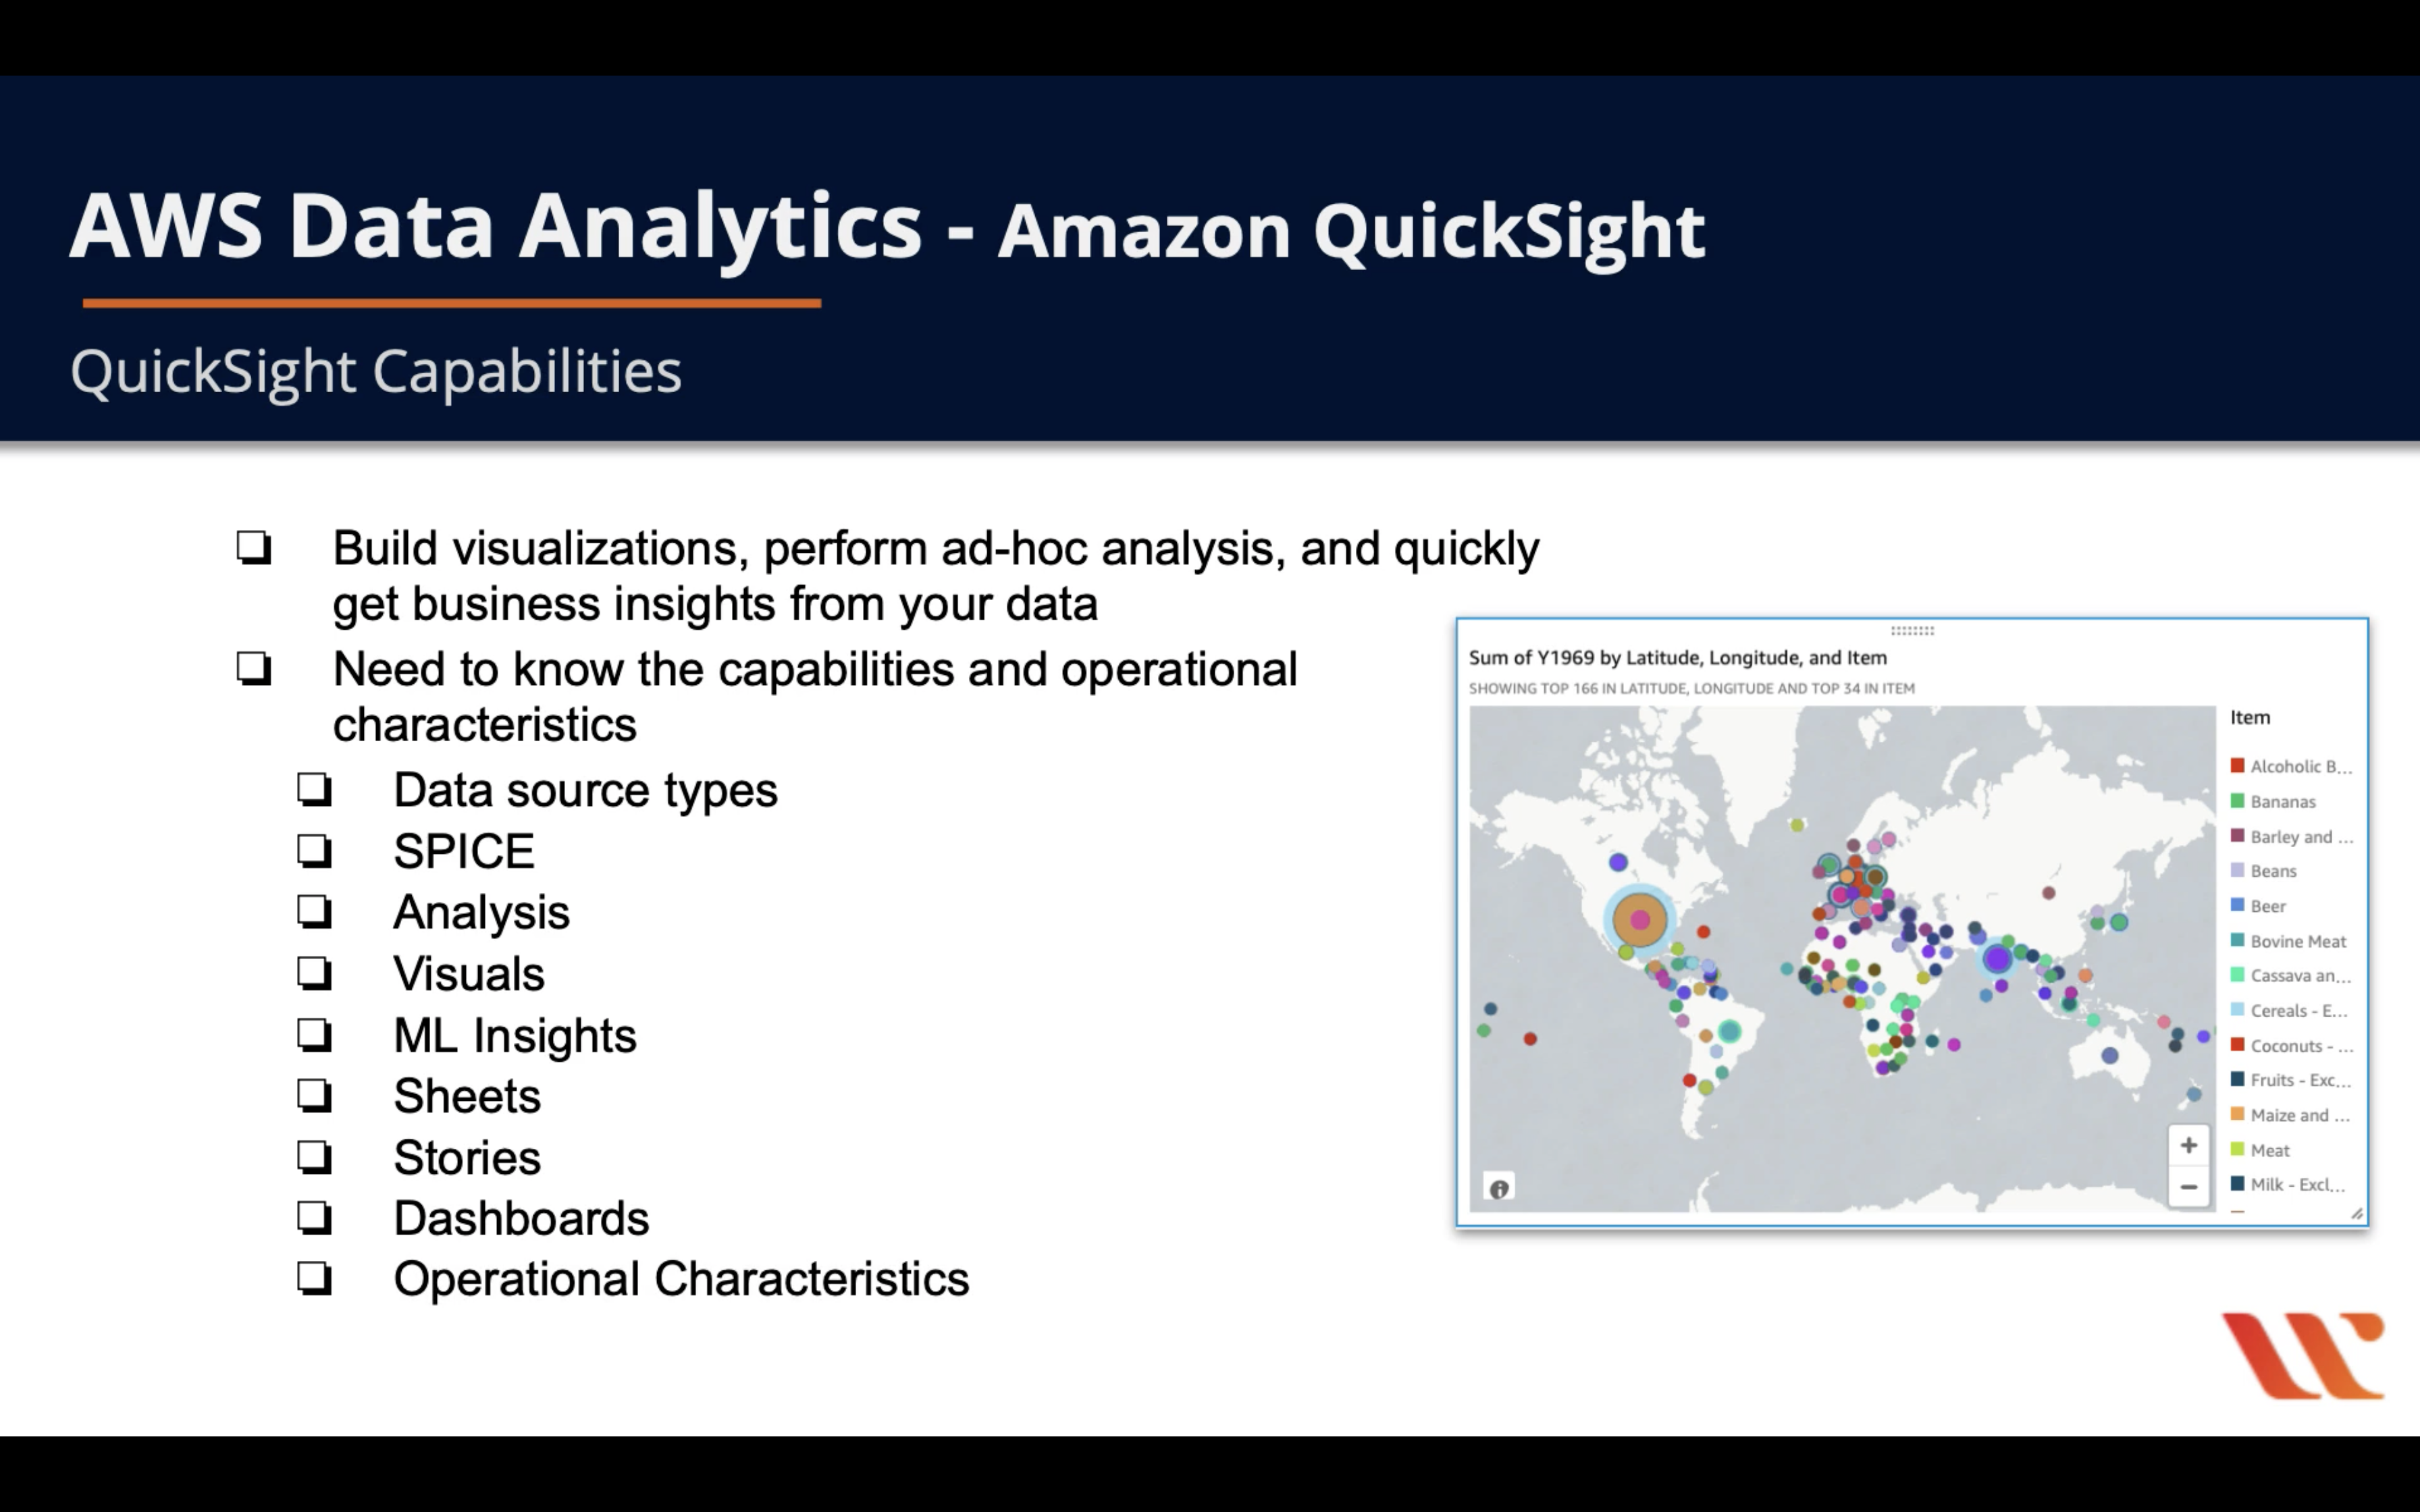
- Build visualizations, perform ad-hoc analysis, and quickly get business insights from your data
- Need to know the capabilities and operational characteristics
- Data source type
- SPICE
- Analysis
- Visuals
- ML Insights
- Sheets
- Stories
- Dashboards
- Operational Characteristics
QuickSight - Data Source Type
- Use many sources for data analysis, including files, AWS services, and on-premises
- Athena, Aurora, Redshift and Redshift Spectrum, S3 and S3 Analytics, Apache Spark, IoT Analytics, RDS, Presto
- Use other data sources by linking or importing them through supported data sources
- Redshift clusters, Athena databases, and RDS instances must be in AWS
- Other data sources must be in one of the following
- EC2, on-premises databases and file systems
- Supported file types: .CSV, .TSV, .CLF, .ELF, .XLSX, .JSON
- So that’s why we need to let QuickSight connects to Athena for grabbing .parquet files.
FORM NEW DATA SOURCES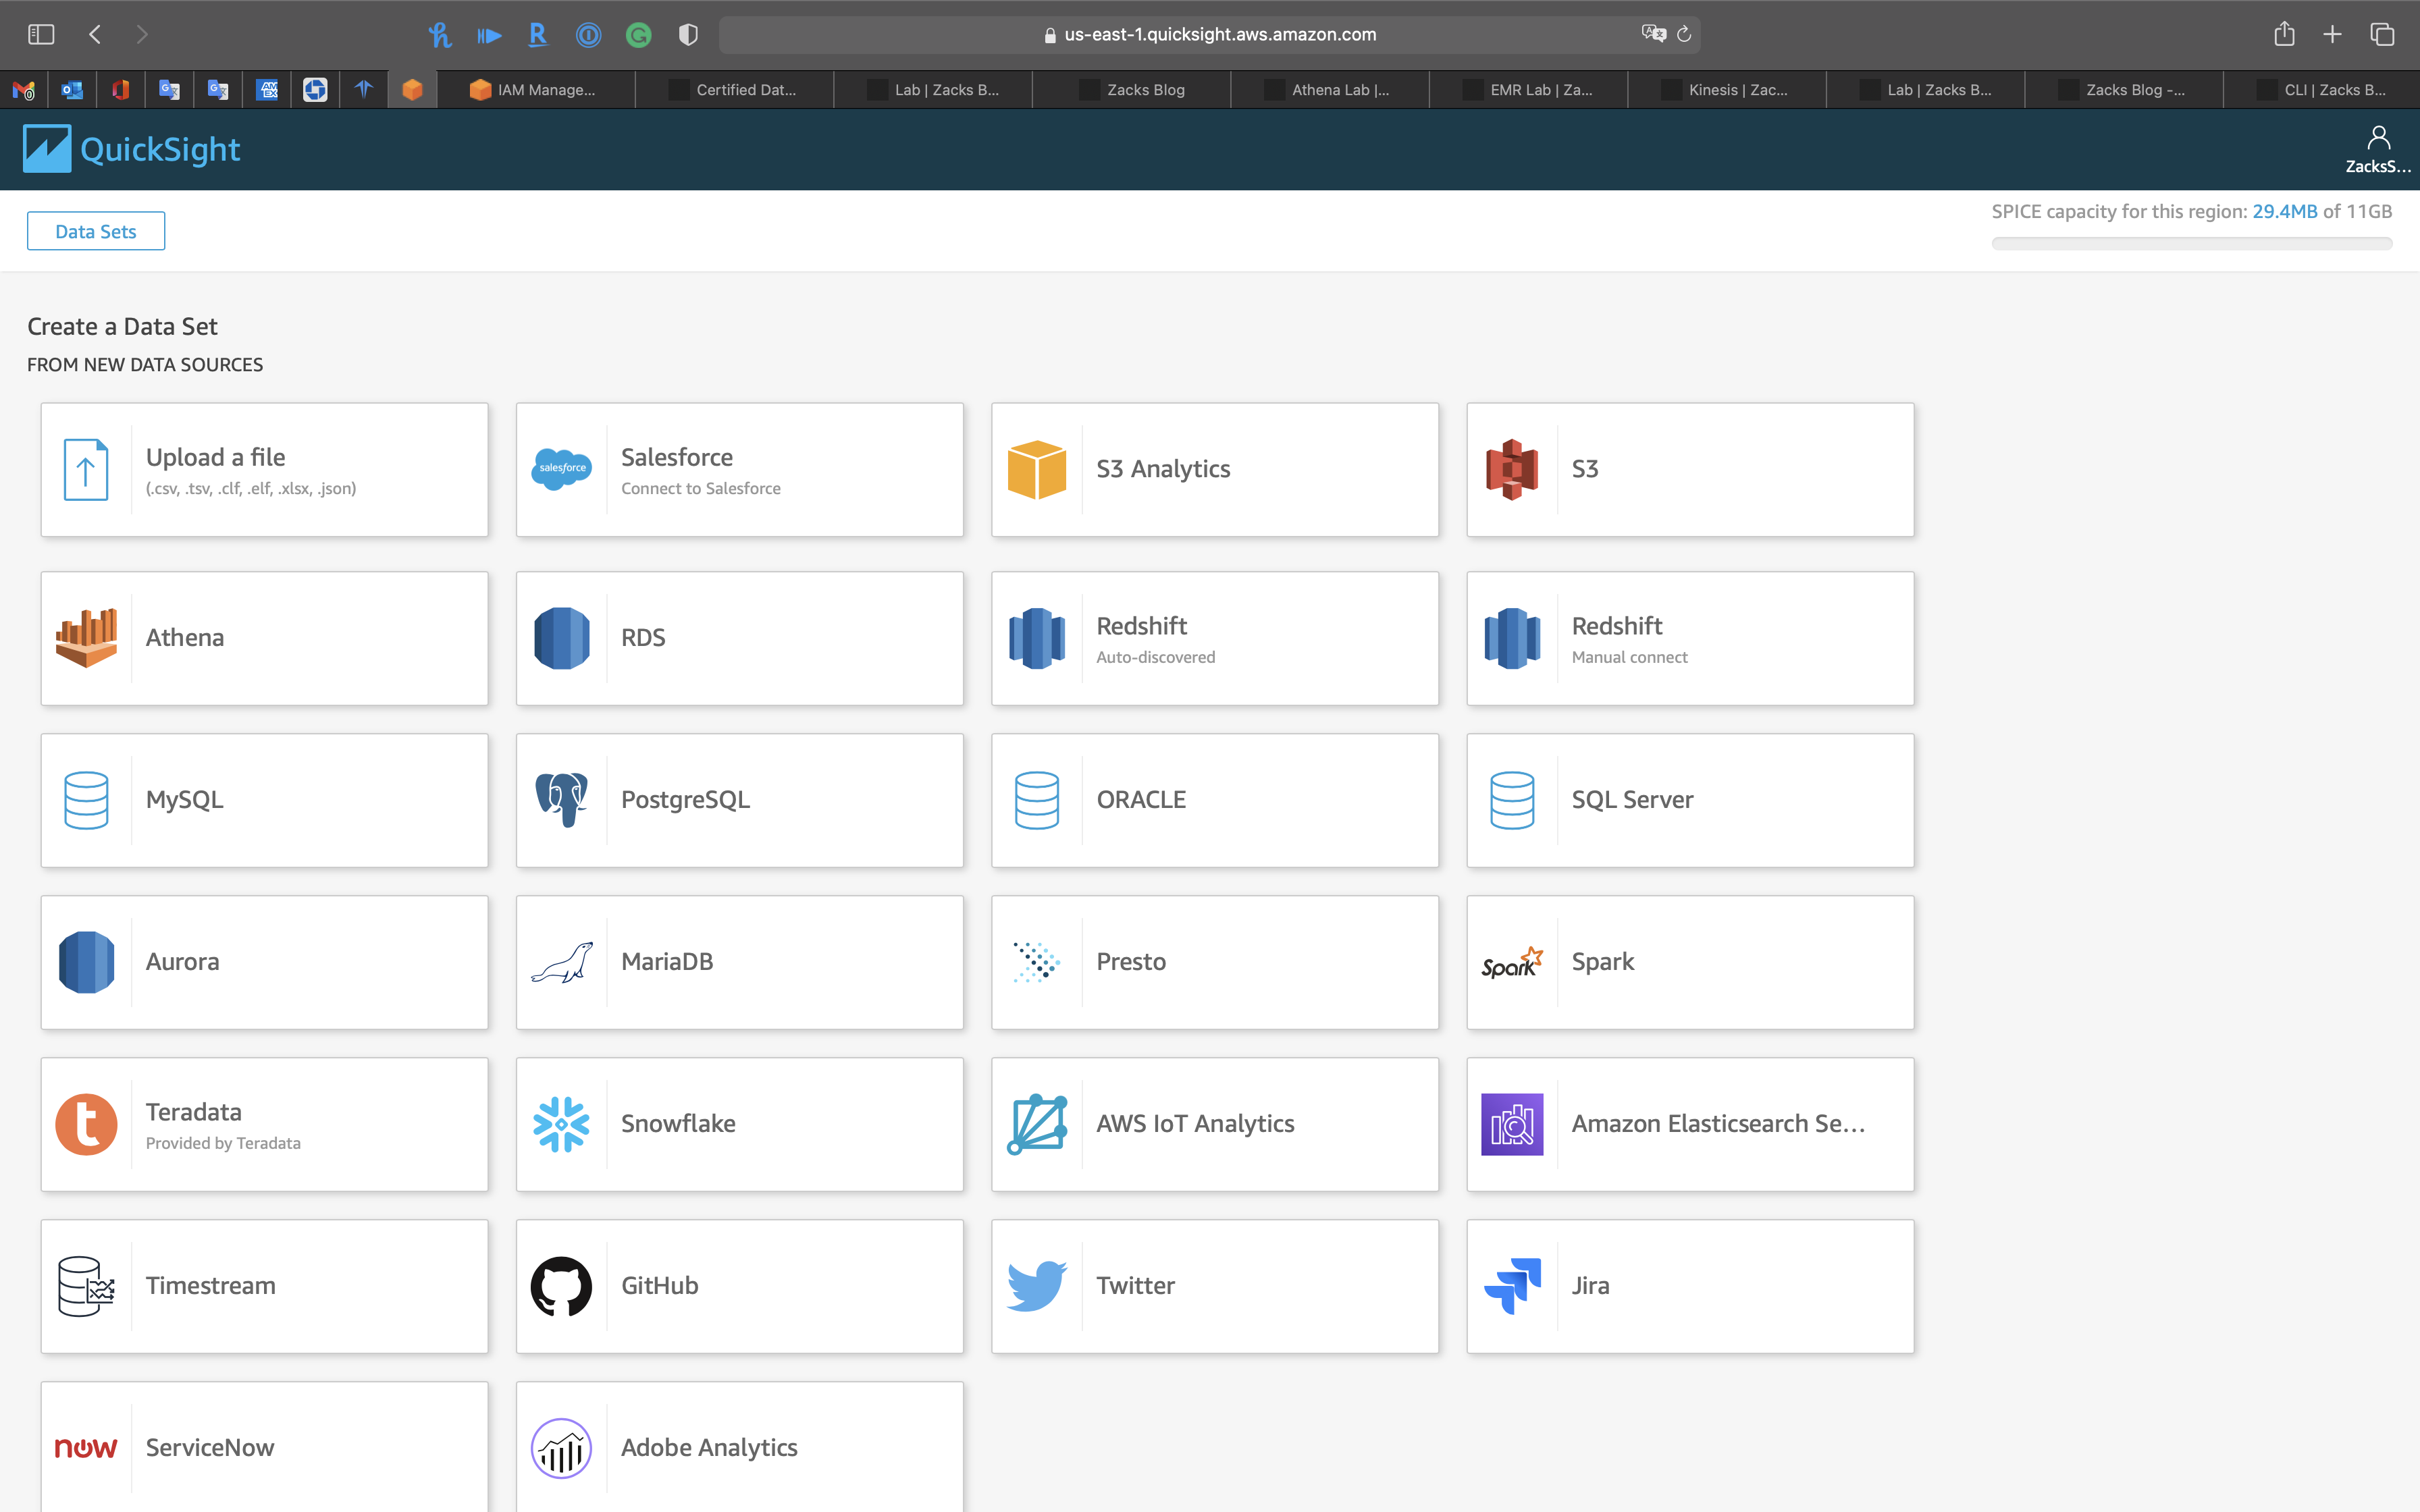
FROM EXISTING DATA SOURCES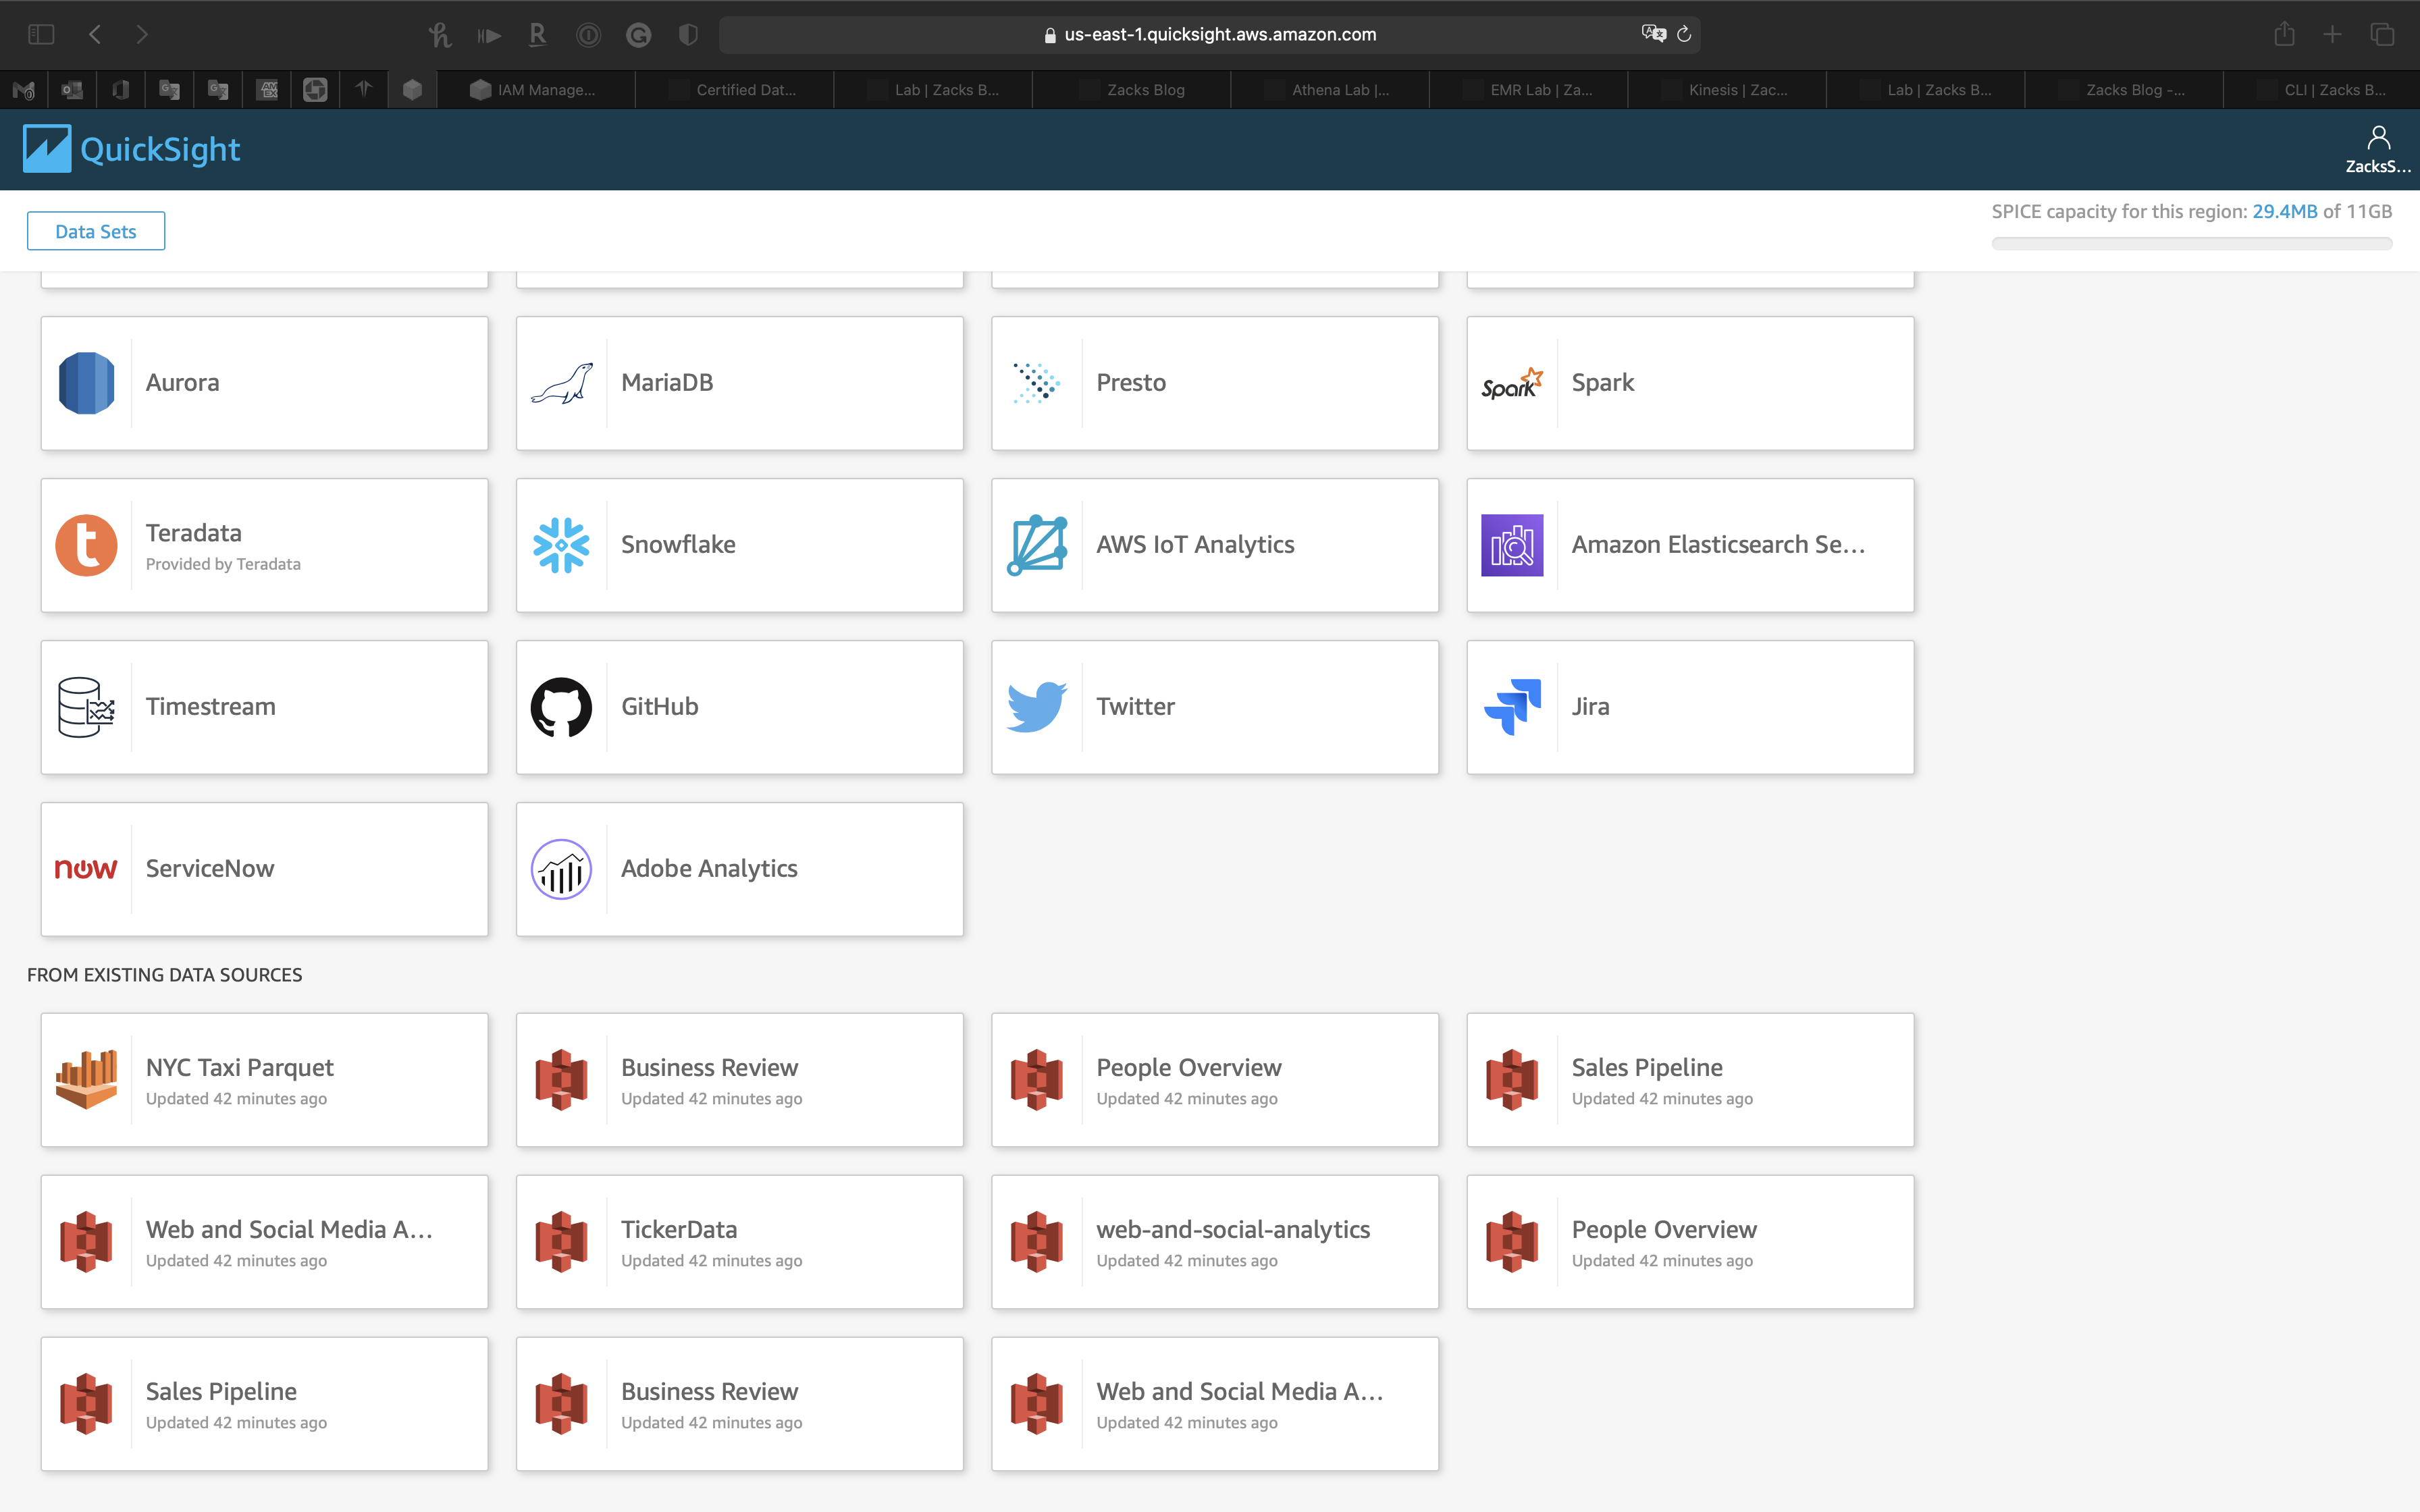
QuickSight - SPICE
- Super-fast, Parallel, In-memory Calculation Engine: engineered to rapidly perform advanced calculations and serve data; in the Enterprise edition data in SPICE is encrypted at rest
- SPICE capacity allocated separately per AWS Region
- Can release unused SPICE capacity
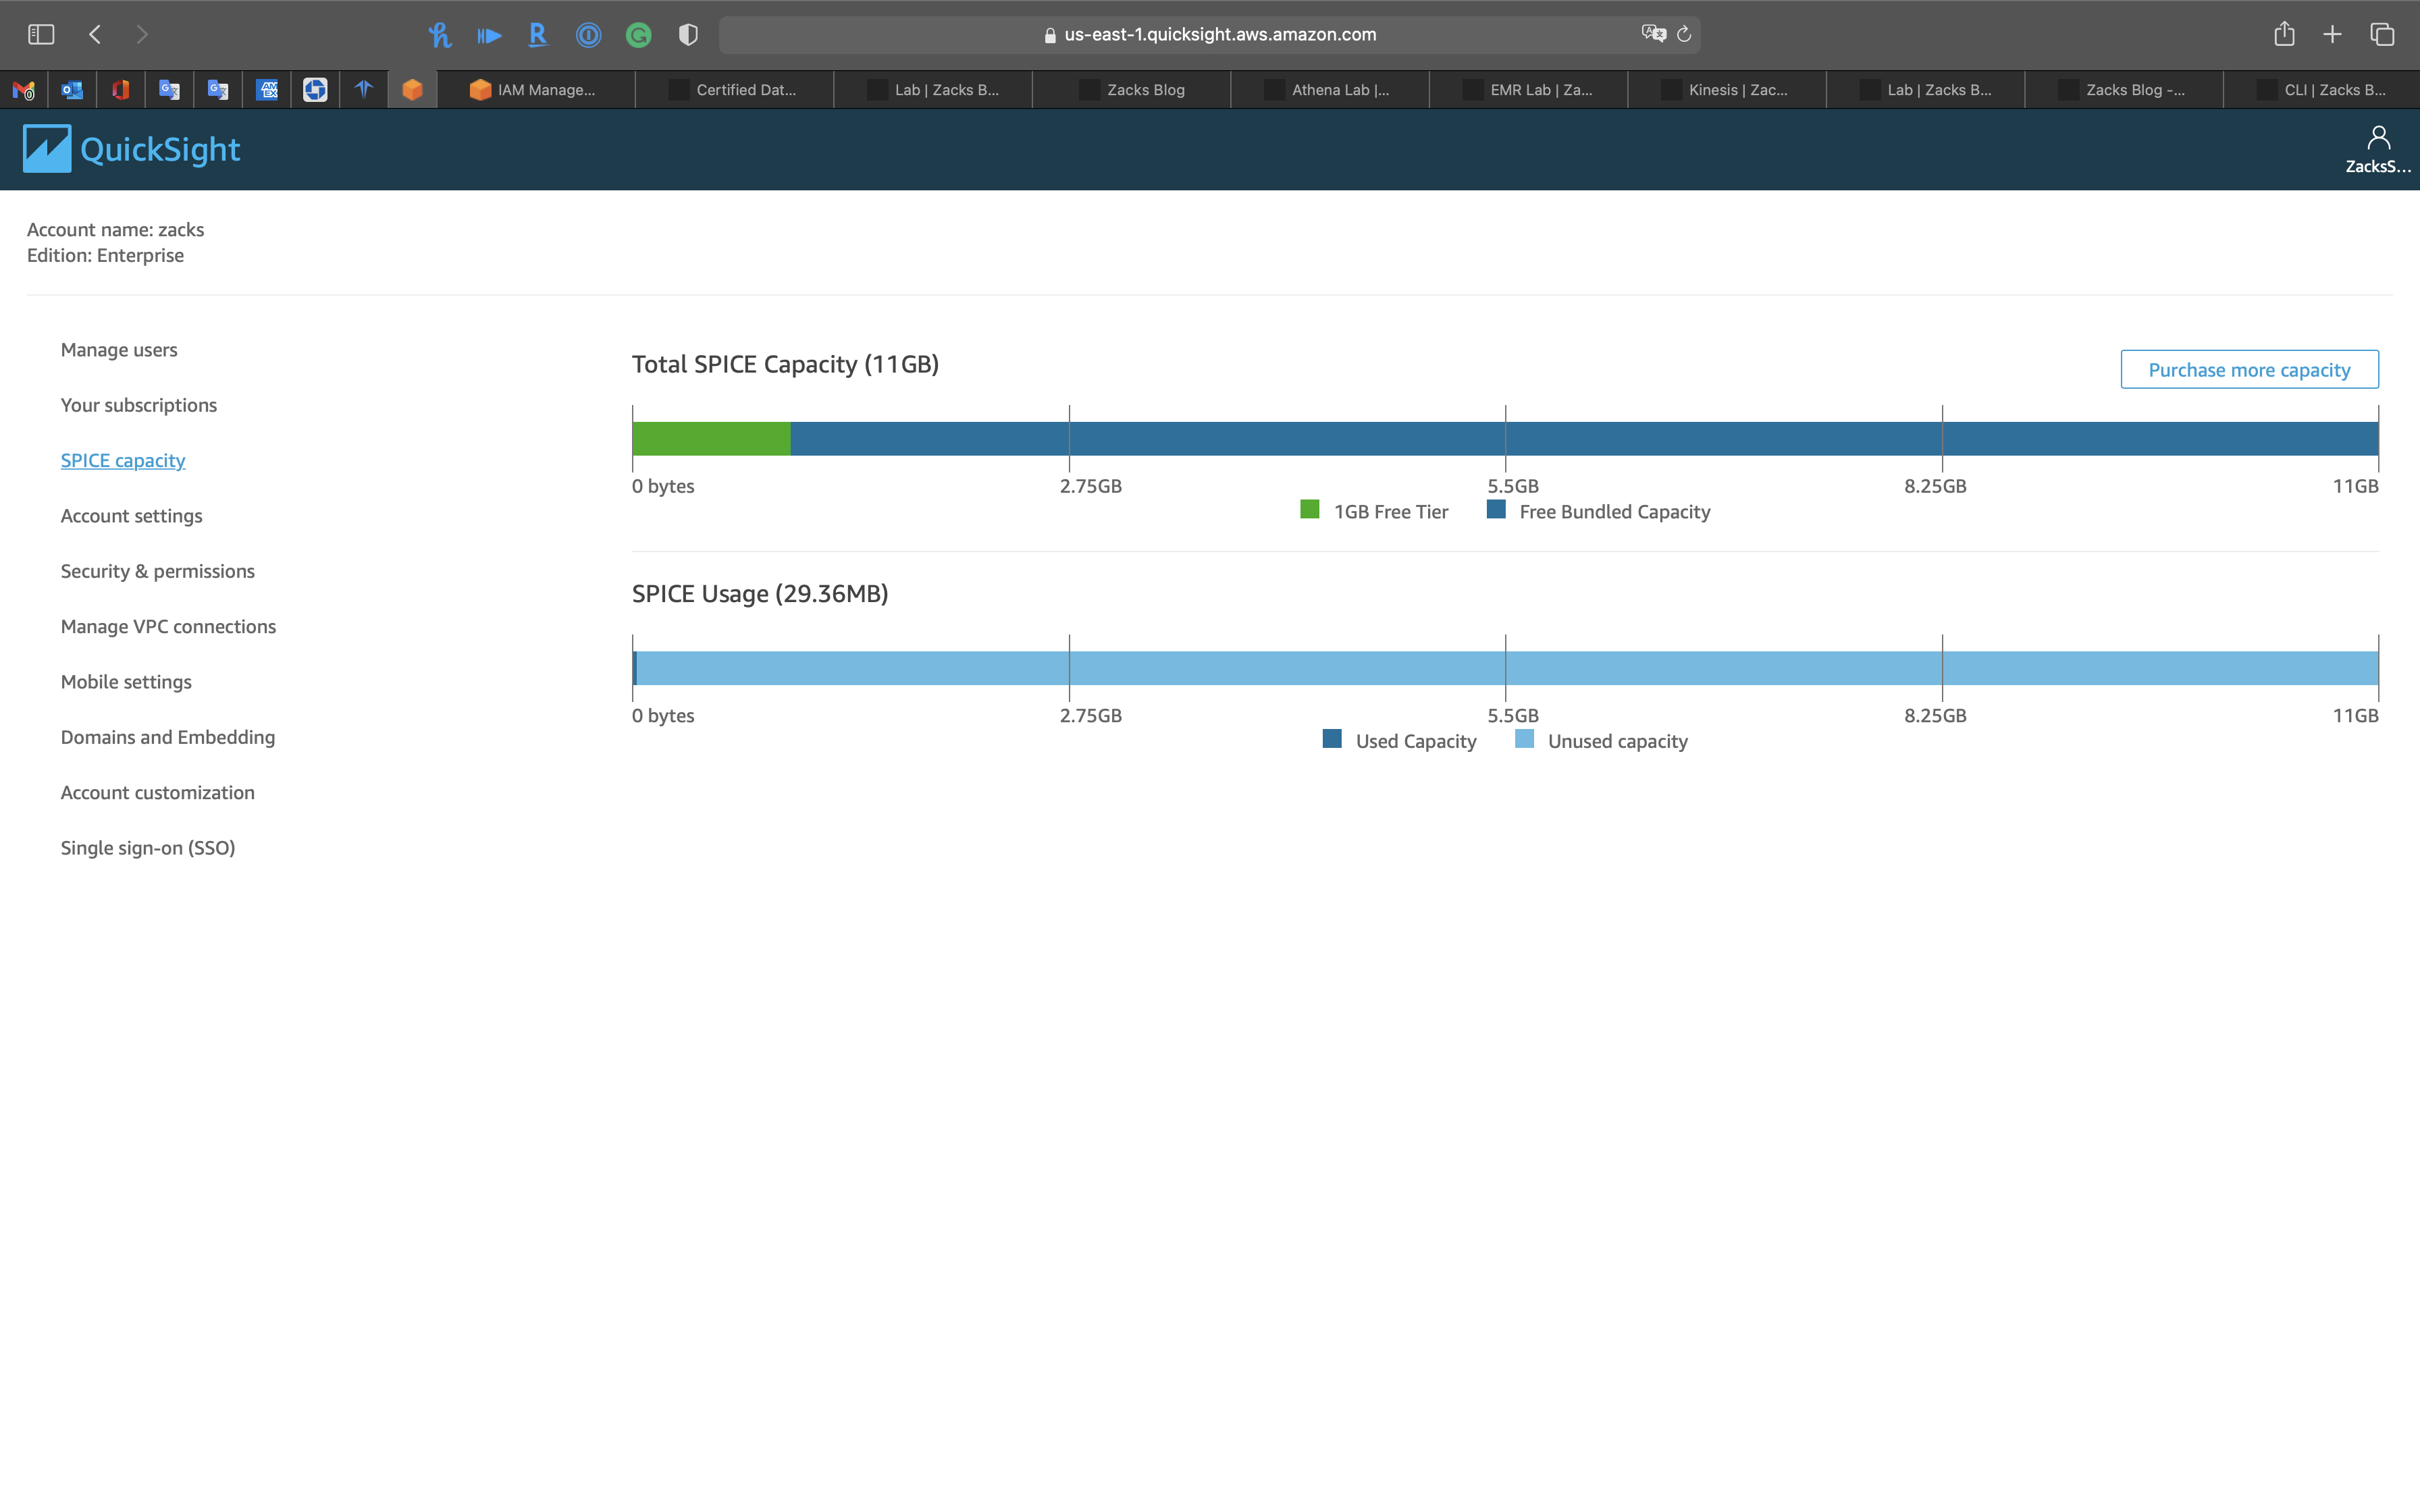
To calculate the SPICE capacity allocation you use the following math: ((integer fields * 8 bytes) + (date fields * 8 bytes) + (string fields * (8 bytes + length of field)) * number of records. Therefore, your calculation is ((358) + (208) + (10*(8+100)))*18,000,000. This equals 27,360,000,000. Divide this by 1,073,741,824 to get the number of GBs, which equals approximately 25 GB.
(208)+(358)+(10*(8+100))*18000000/1024/1024
QuickSight - Analysis
- Use analysis to create and interact with visuals and stories, a container for a set of related visuals and stories
- Use multiple data sets in an analysis, but any given visual can only use one dataset
- Share an analysis with other users by emailing them a link; can only share analysis with other uses in your QuickSight account
- Use calculated fields to transform your data
- Many functions, such as extract, formatDate, etc.
- Aggregate functions
QuickSight - Visuals
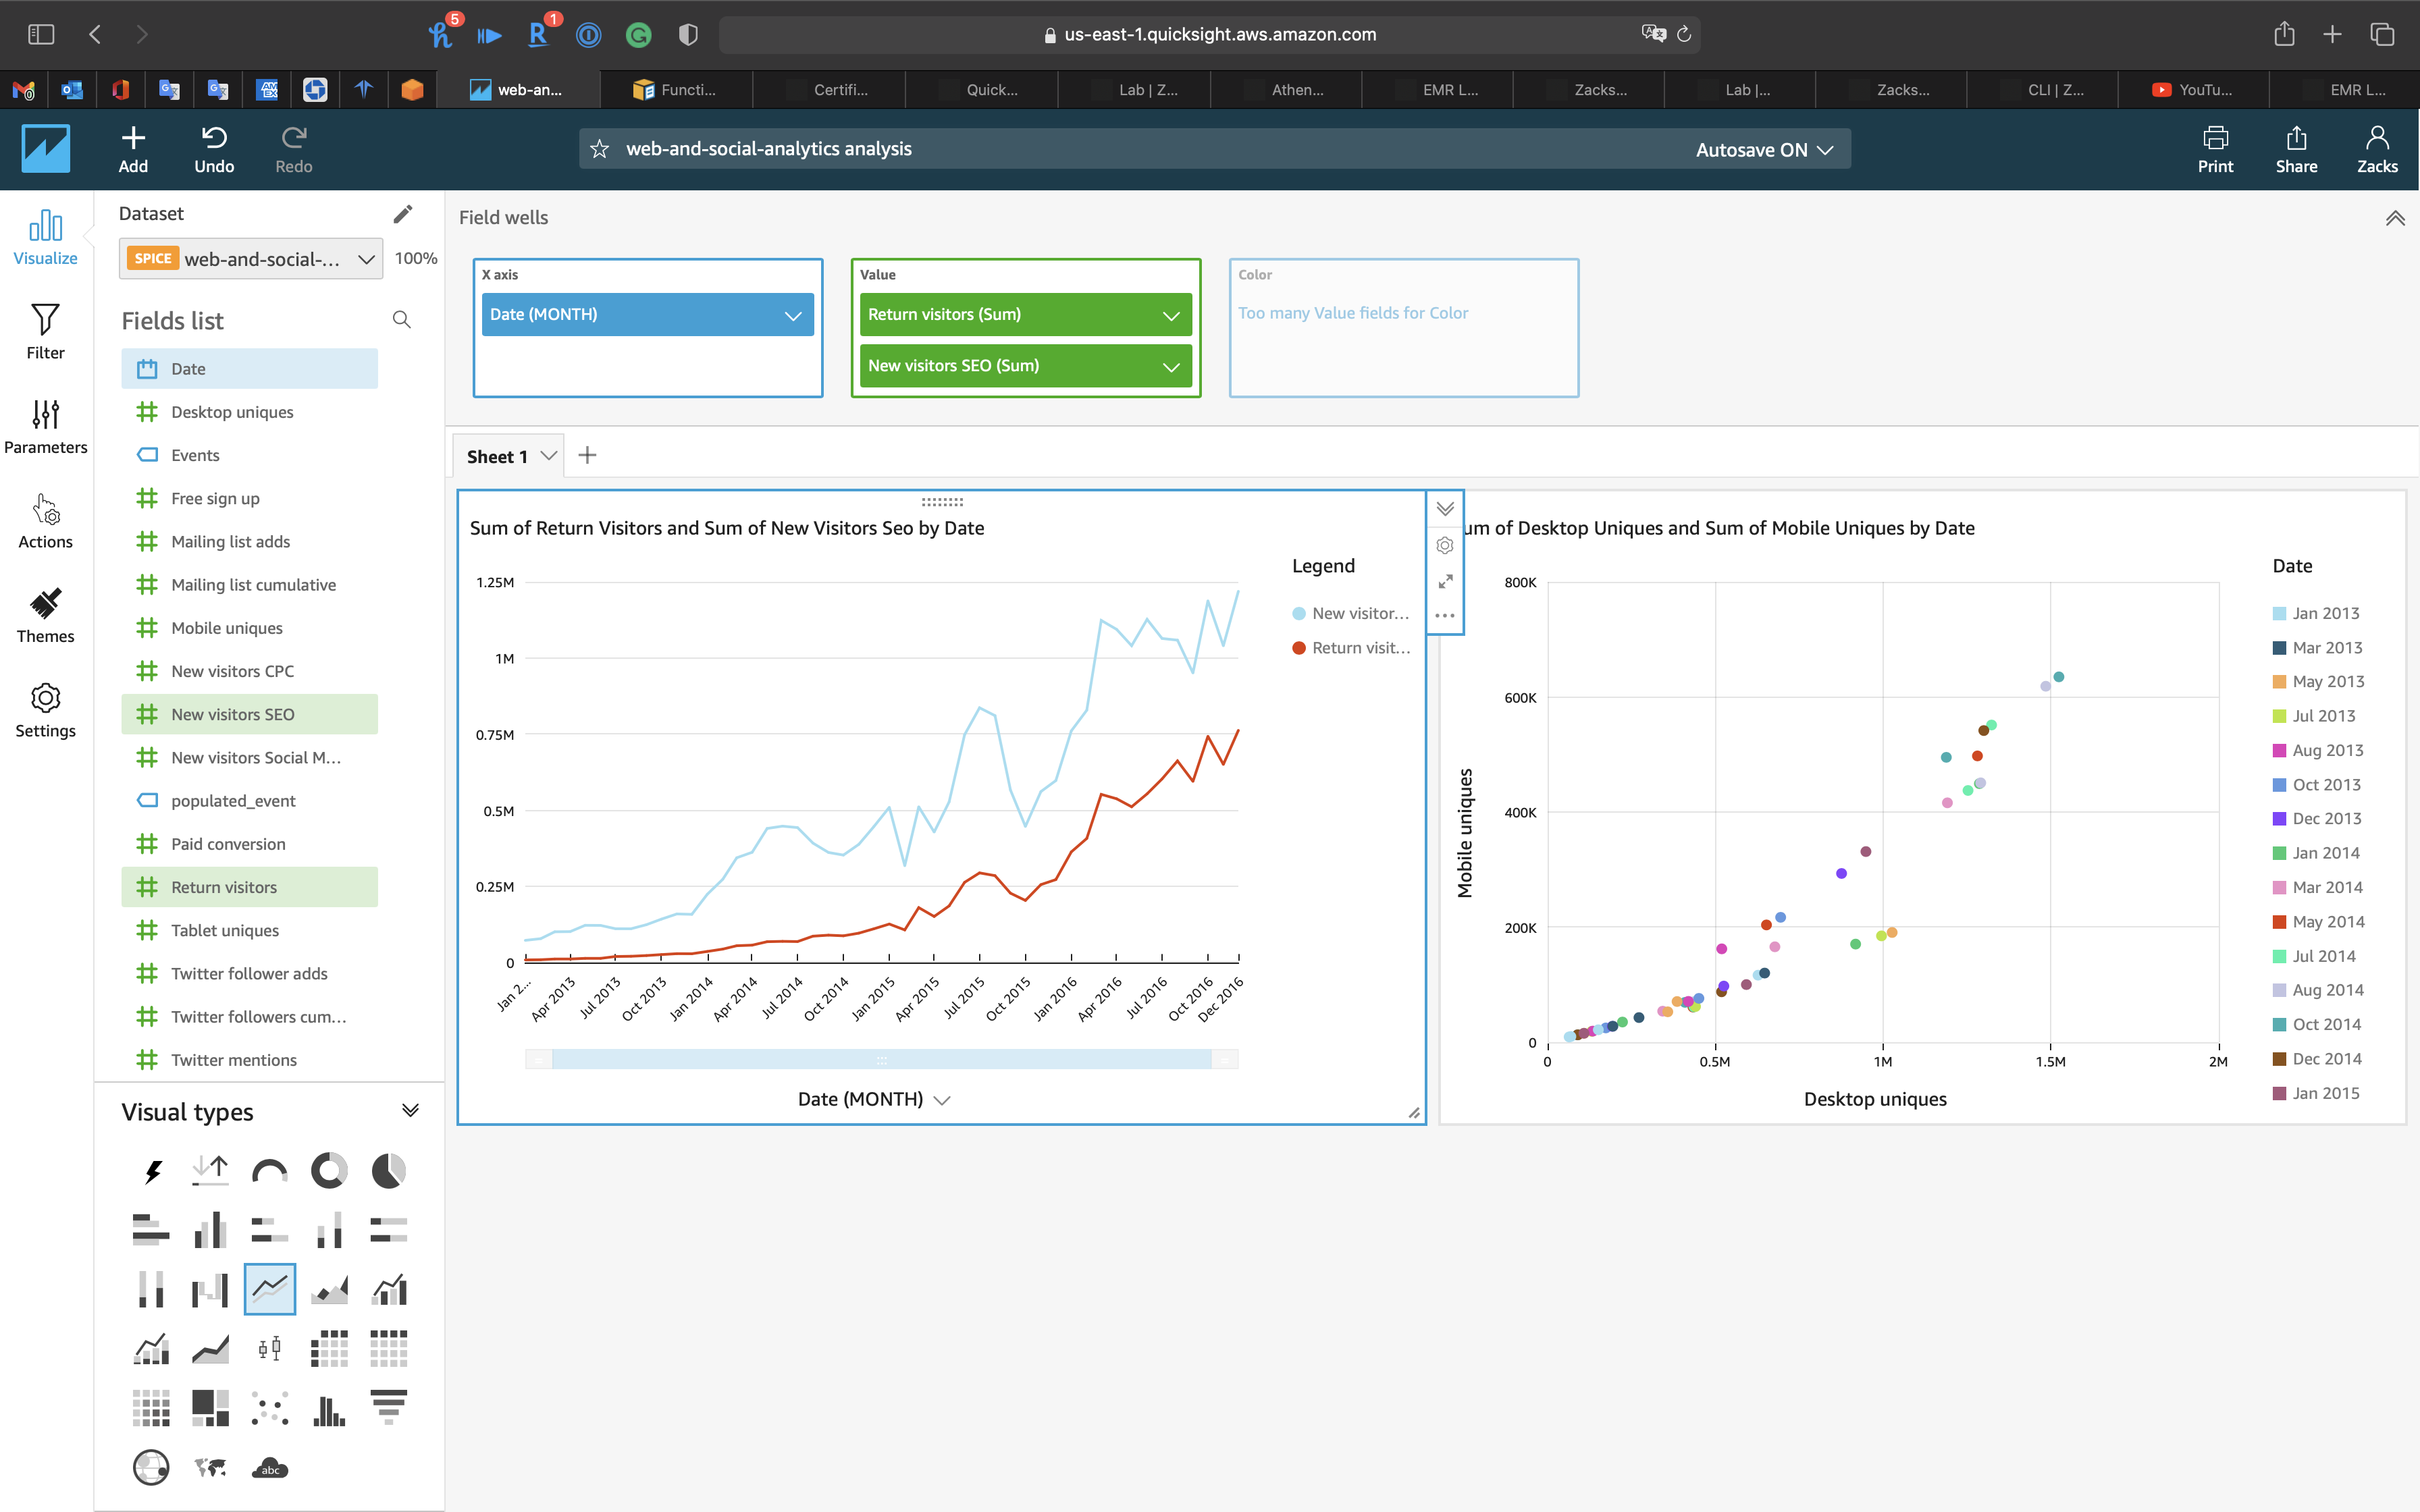
- Graphical representation of a data set using a diagram, chart, graph, or table
- Supports up to 30 datasets in a single analysis, and up to 30 visuals in a single sheet, and a limit of 20 sheets per analysis
QuickSight - ML Insights
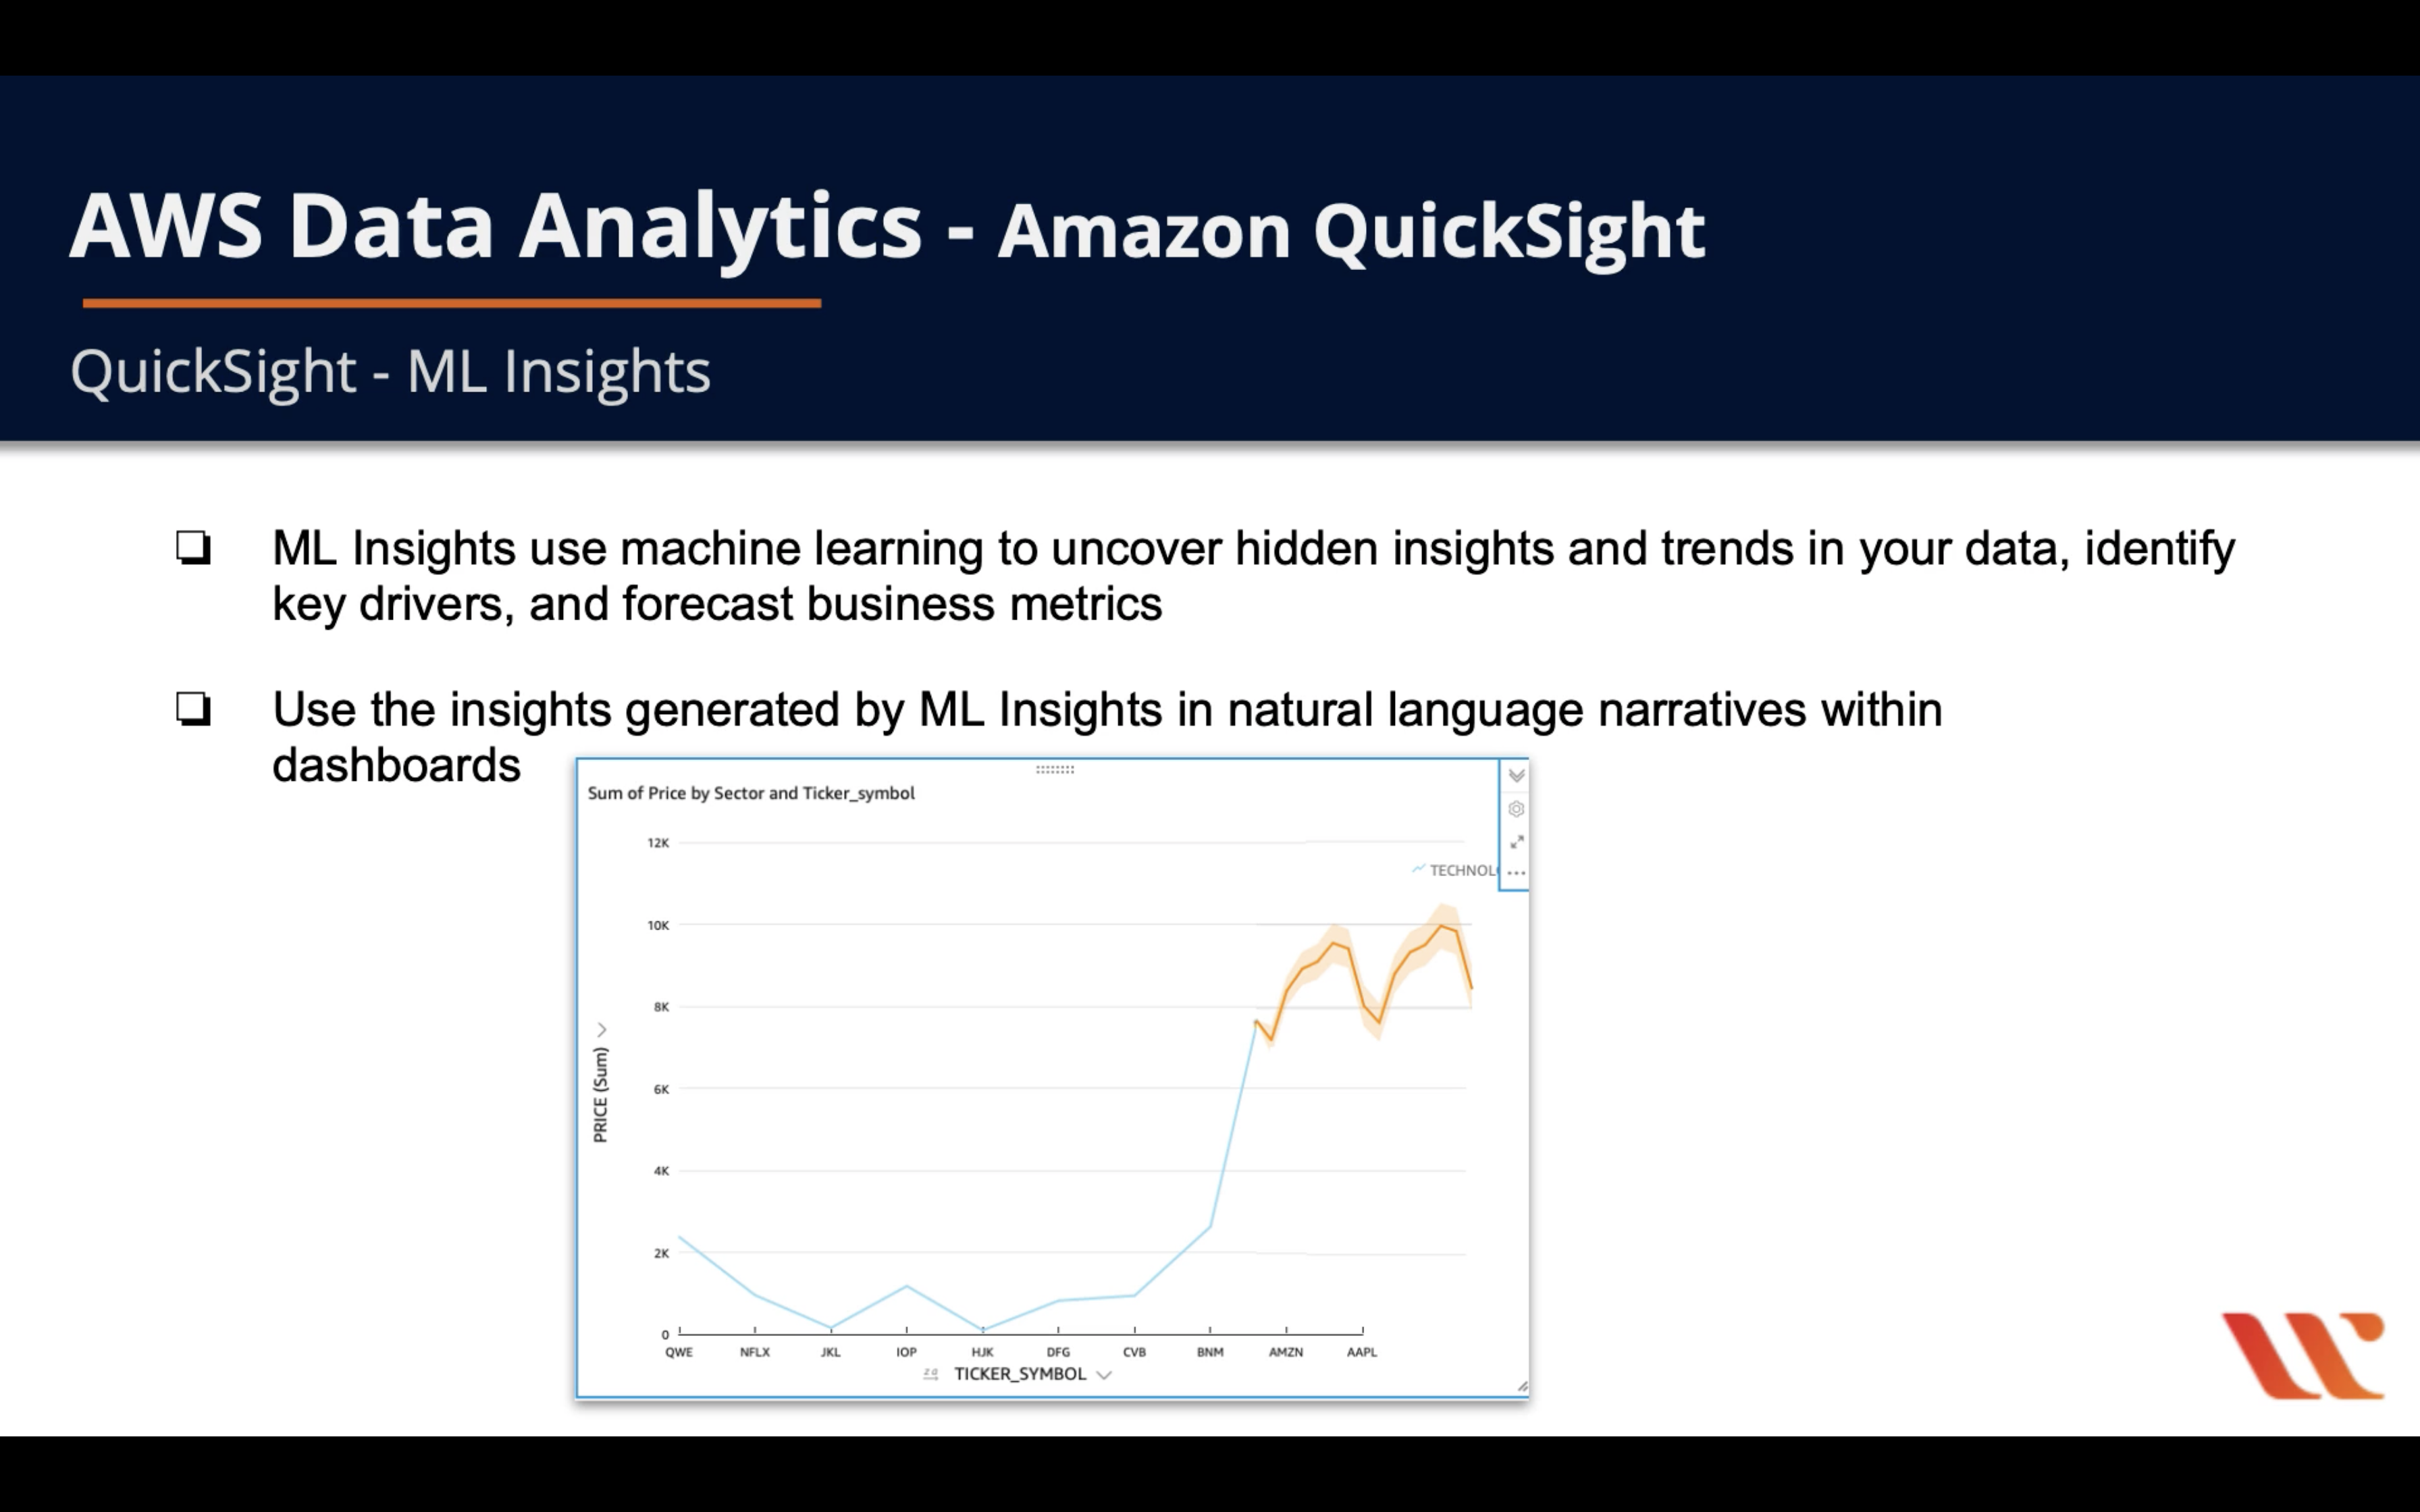
- ML Insights use machine learning to uncover hidden insights and trends in your data, identify key drivers, and forecast business metrics
- Use the insights generated by ML Insights in natural language narratives within dashboards
QuickSight - Sheets
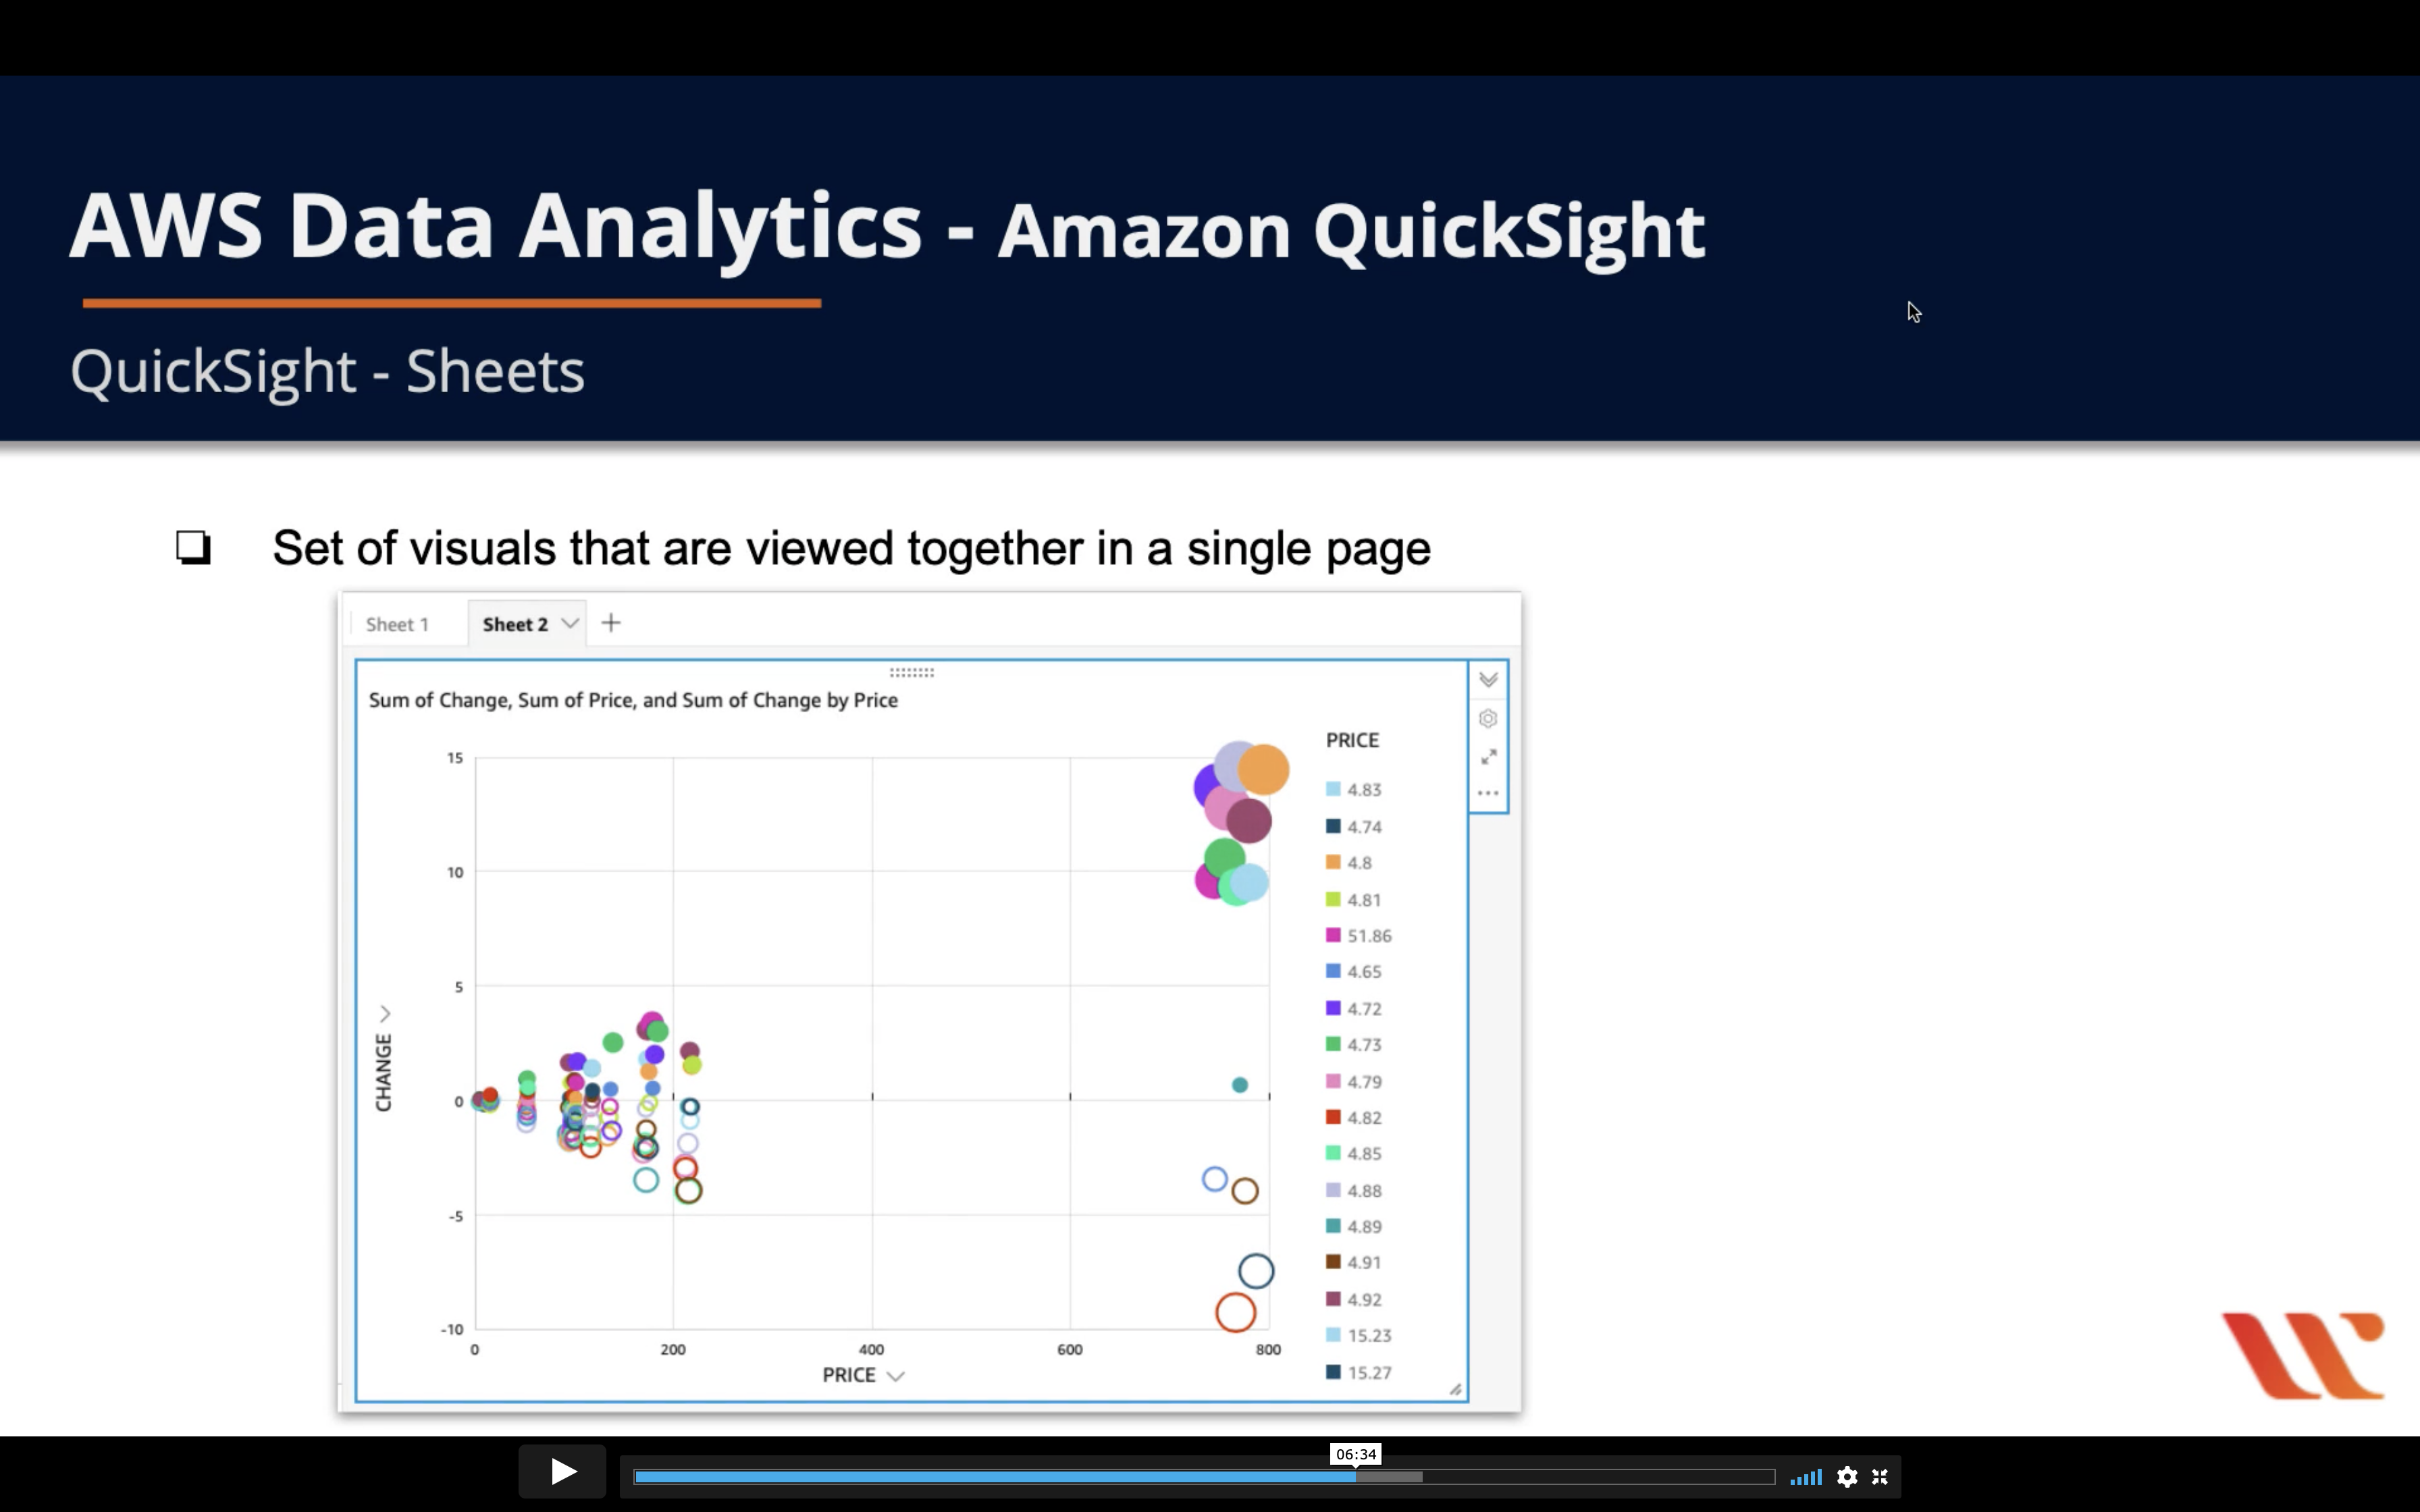
- Set of visuals that are viewed together in a single page
QuickSight - Stories
- Use a story to play multiple iterations of an analysis sequentially to provide a narrative about the analysis data
- On Sep 30, 2020, AWS permanently removed all existing stories from QuickSight
- AWS suggest that your recreate stories as visuals that are side-by-side in an analysis as an alternative
QuickSight - Dashboards
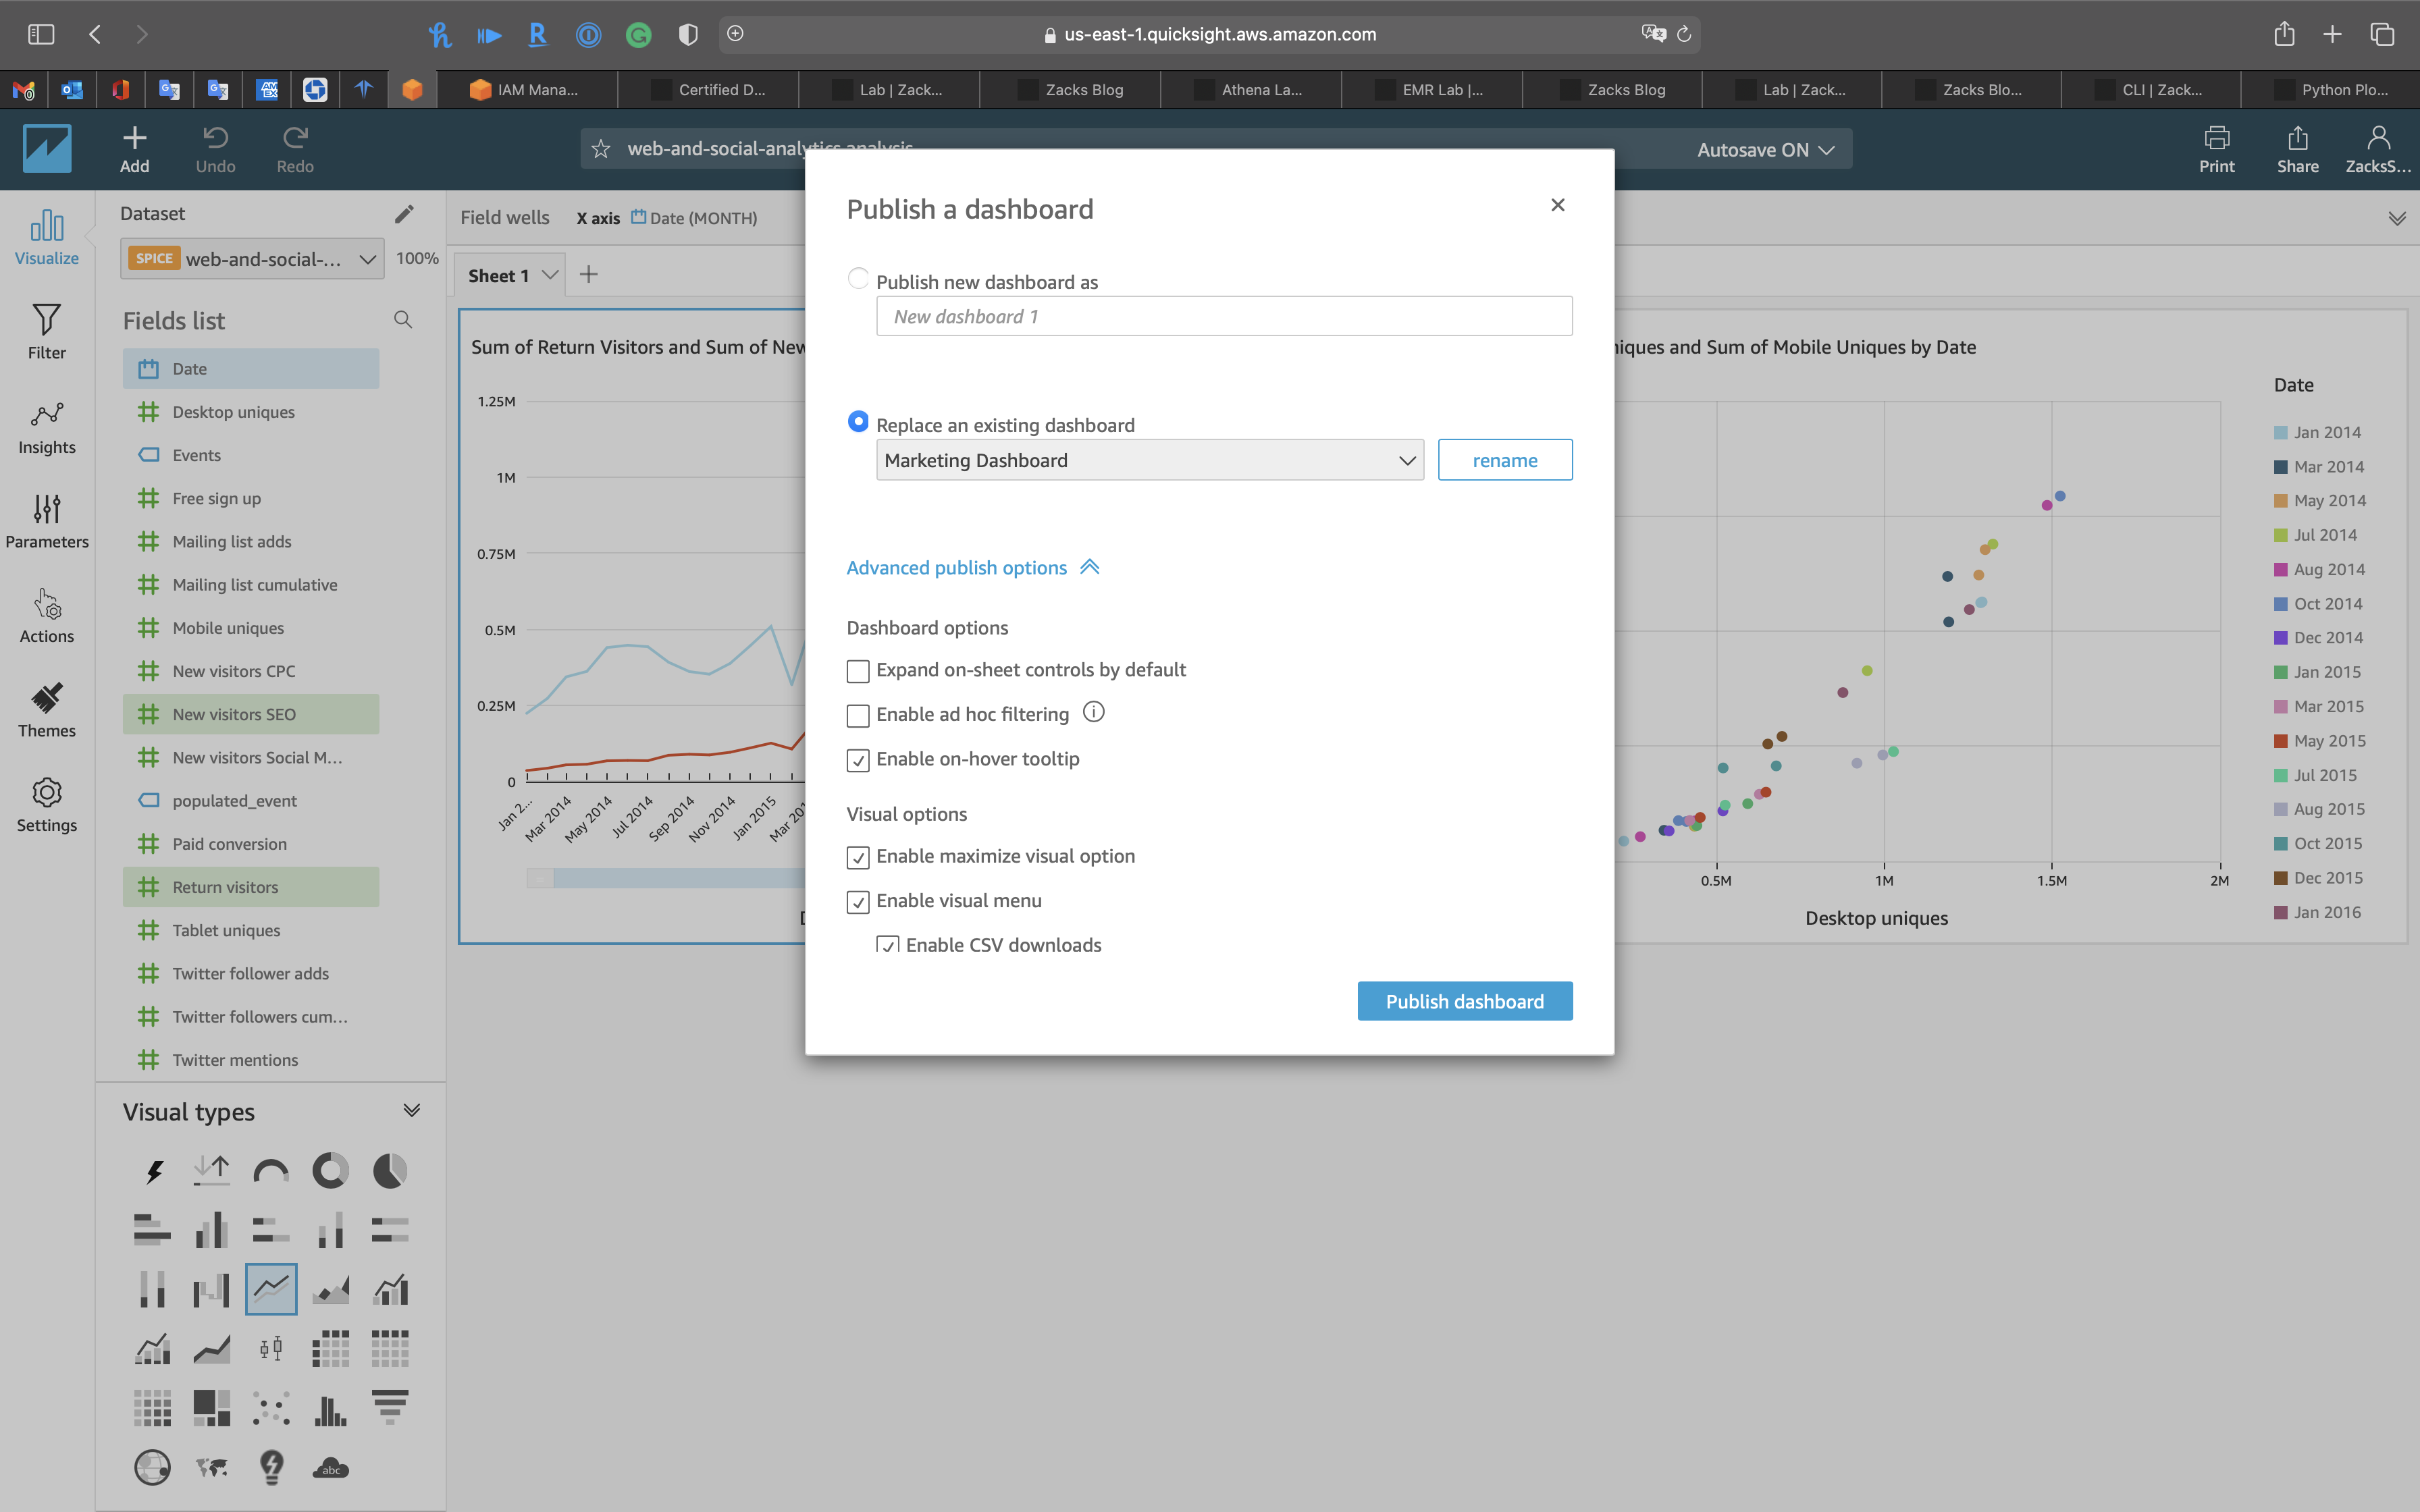
- Read-only snapshot of an analysis that you can share with other users for reporting
- Preserves the configuration of the analysis at the time of publishing, including filtering, parameters, controls, and sort order
- When a user views the dashboard, it reflects the current data in the data sets used by the analysis
- With the enterprise edition a shared dashboard can also be embedded in a website or app
- Drill up/down into data points
- Enable ad hoc filtering: Enable dashboard users to focus or exclude datapoints, use filter panel, see which visuals are filtered, and see what filters are applied in each visual.
QuickSight - Operational Characteristics
- Cost
- Standard edition and Enterprise edition with annual subscription
- Get additional SPICE capacity for a monthly add on cost
- Performance
- SPICE uses a combination of columnar storage, in-memory technologies
- Durability and Availability
- SPICE automatically replicates data and enables QuickSight to scale to hundreds of thousands of uses who can all simultaneously perform interactive analysis across many AWS data sources
- Scalability and Elasticity
- Fully managed service that scales to meet user demands
- Can grow your data to many terabytes
- Interfaces
- Athena, Aurora, Redshift and Redshift Spectrum, S3 and S3 Analytics, Apache Spark, IoT Analytics, RDS, Presto
QuickSight Visual Data
Filters
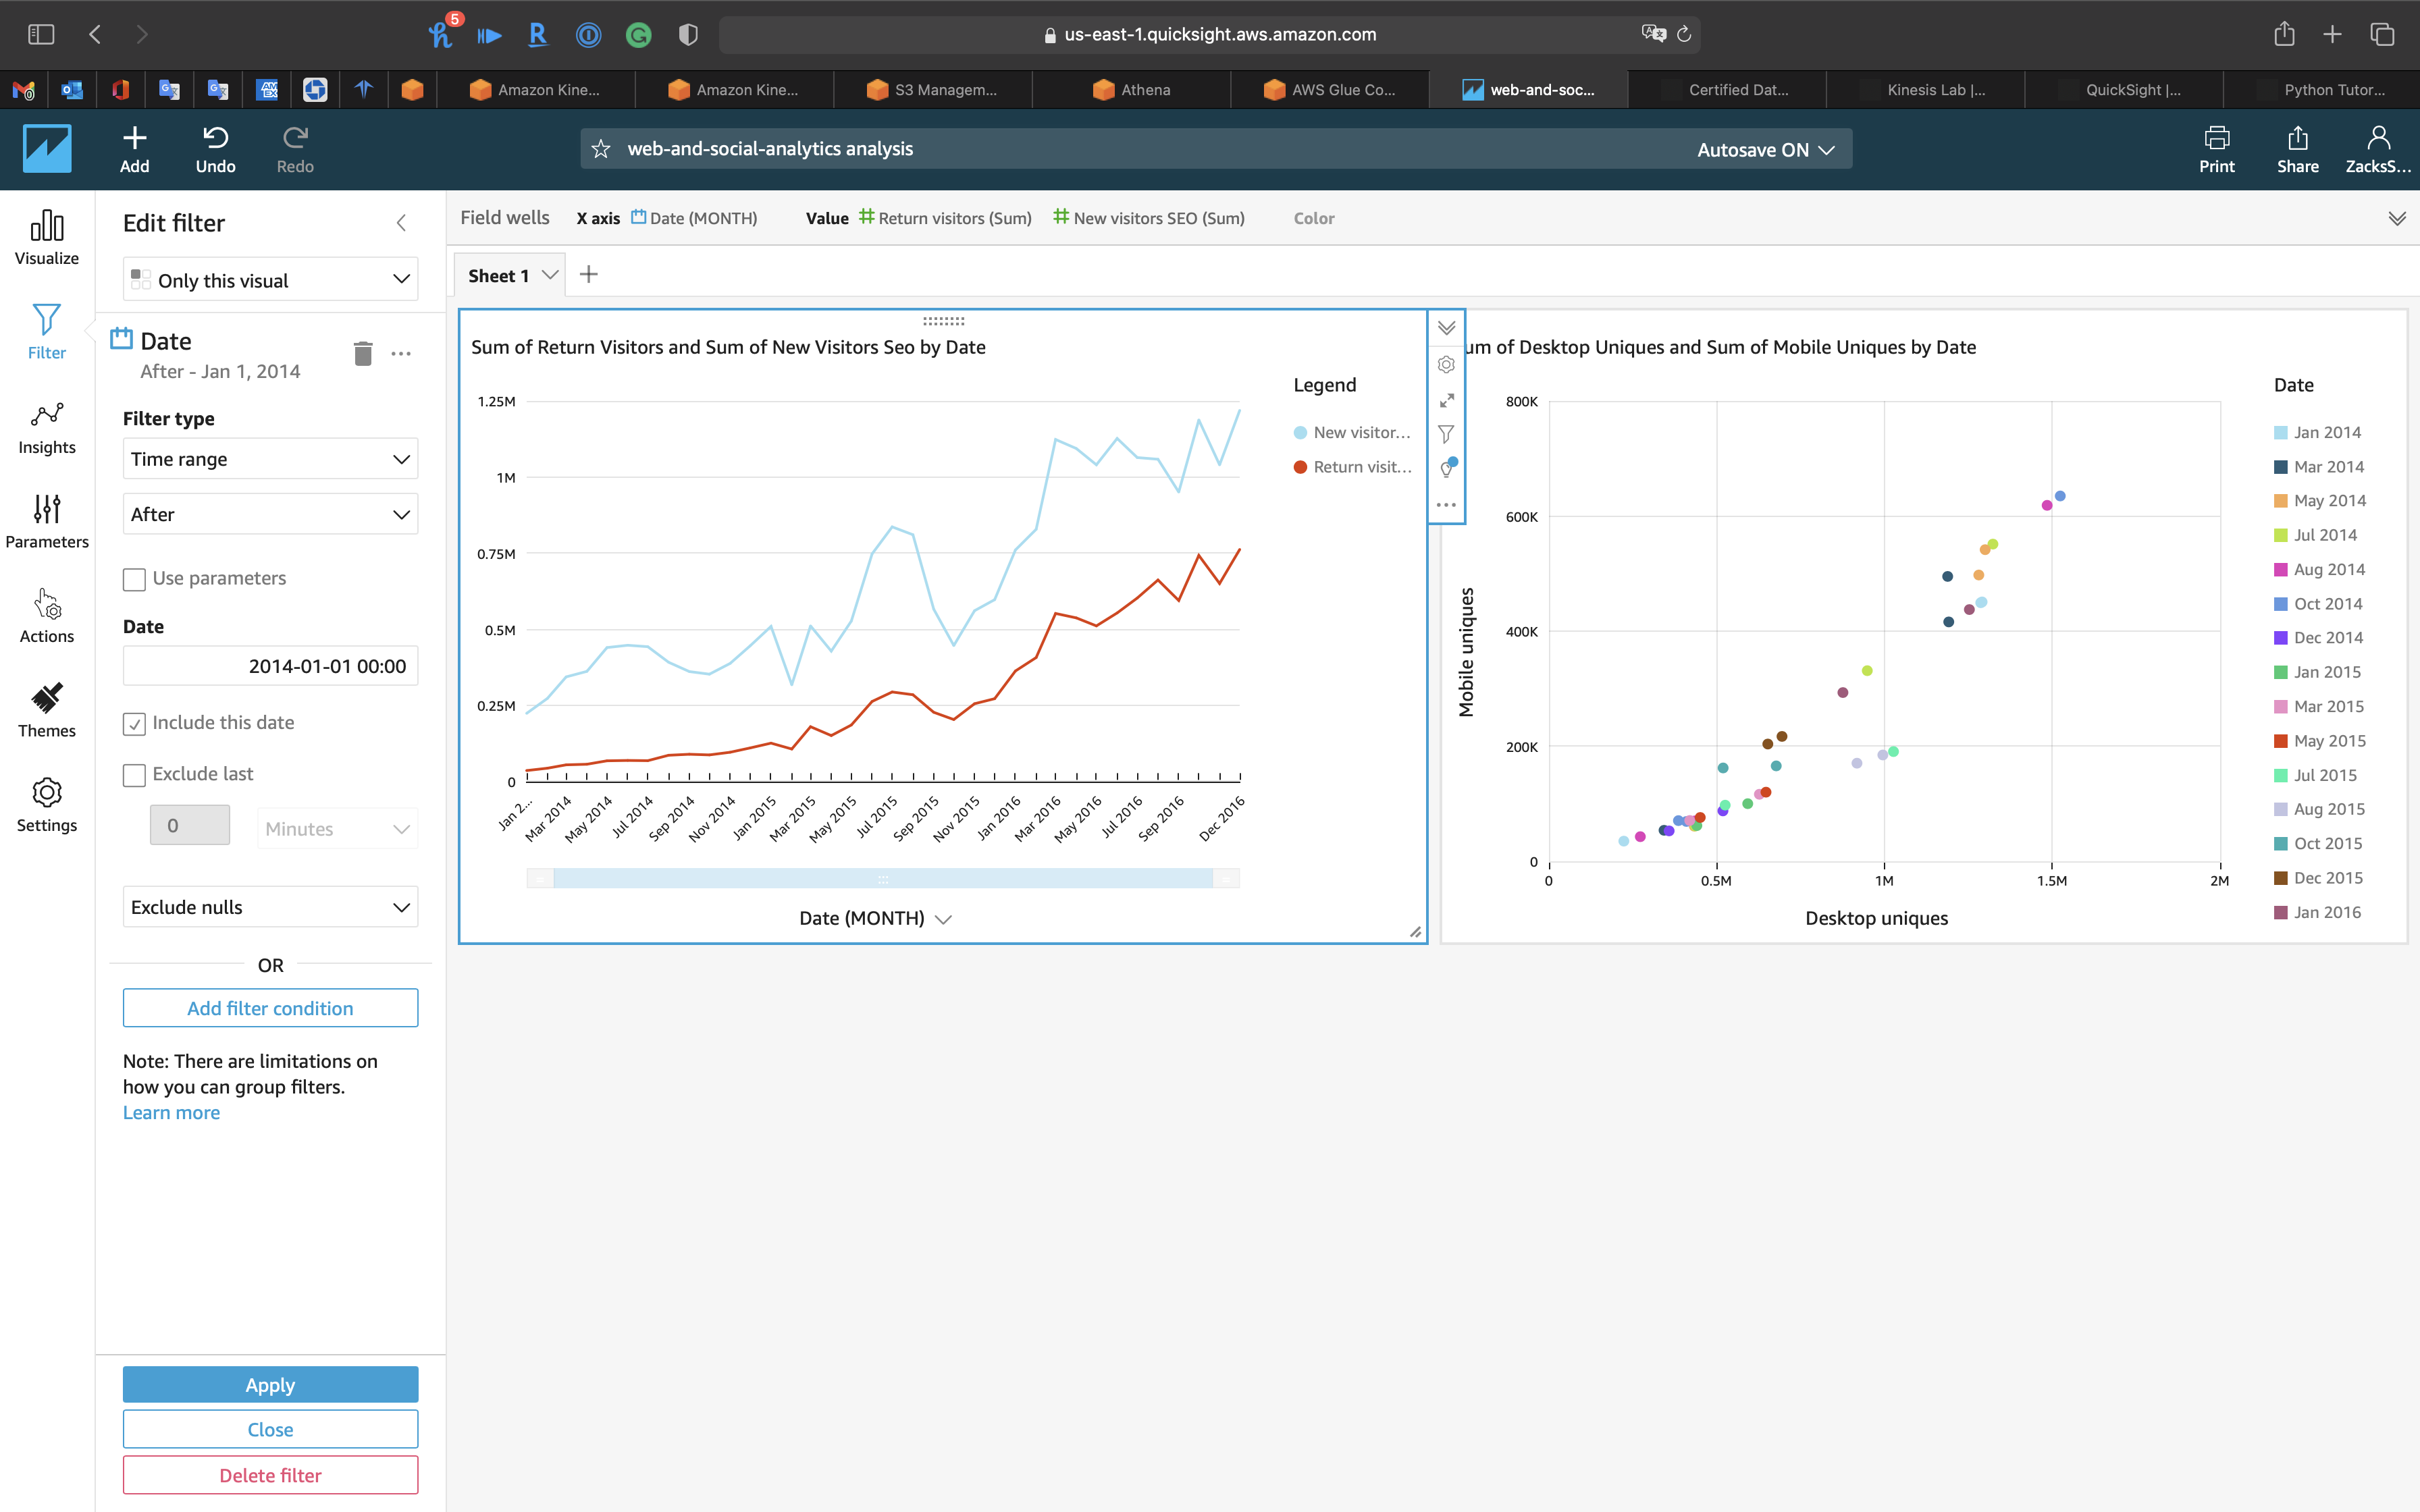
- QuickSight filter options for data interaction
- Filtering: used to focus on or exclude a visual element representing a particular value
- Associated with a single dataset in an analysis
- Scope to one, several or all visuals in a dataset’s analysis
- Applies only to a single field, calculated or regular
- Make sure multiple filters applied to the same field aren’t mutually exclusive
- Filtering: used to focus on or exclude a visual element representing a particular value
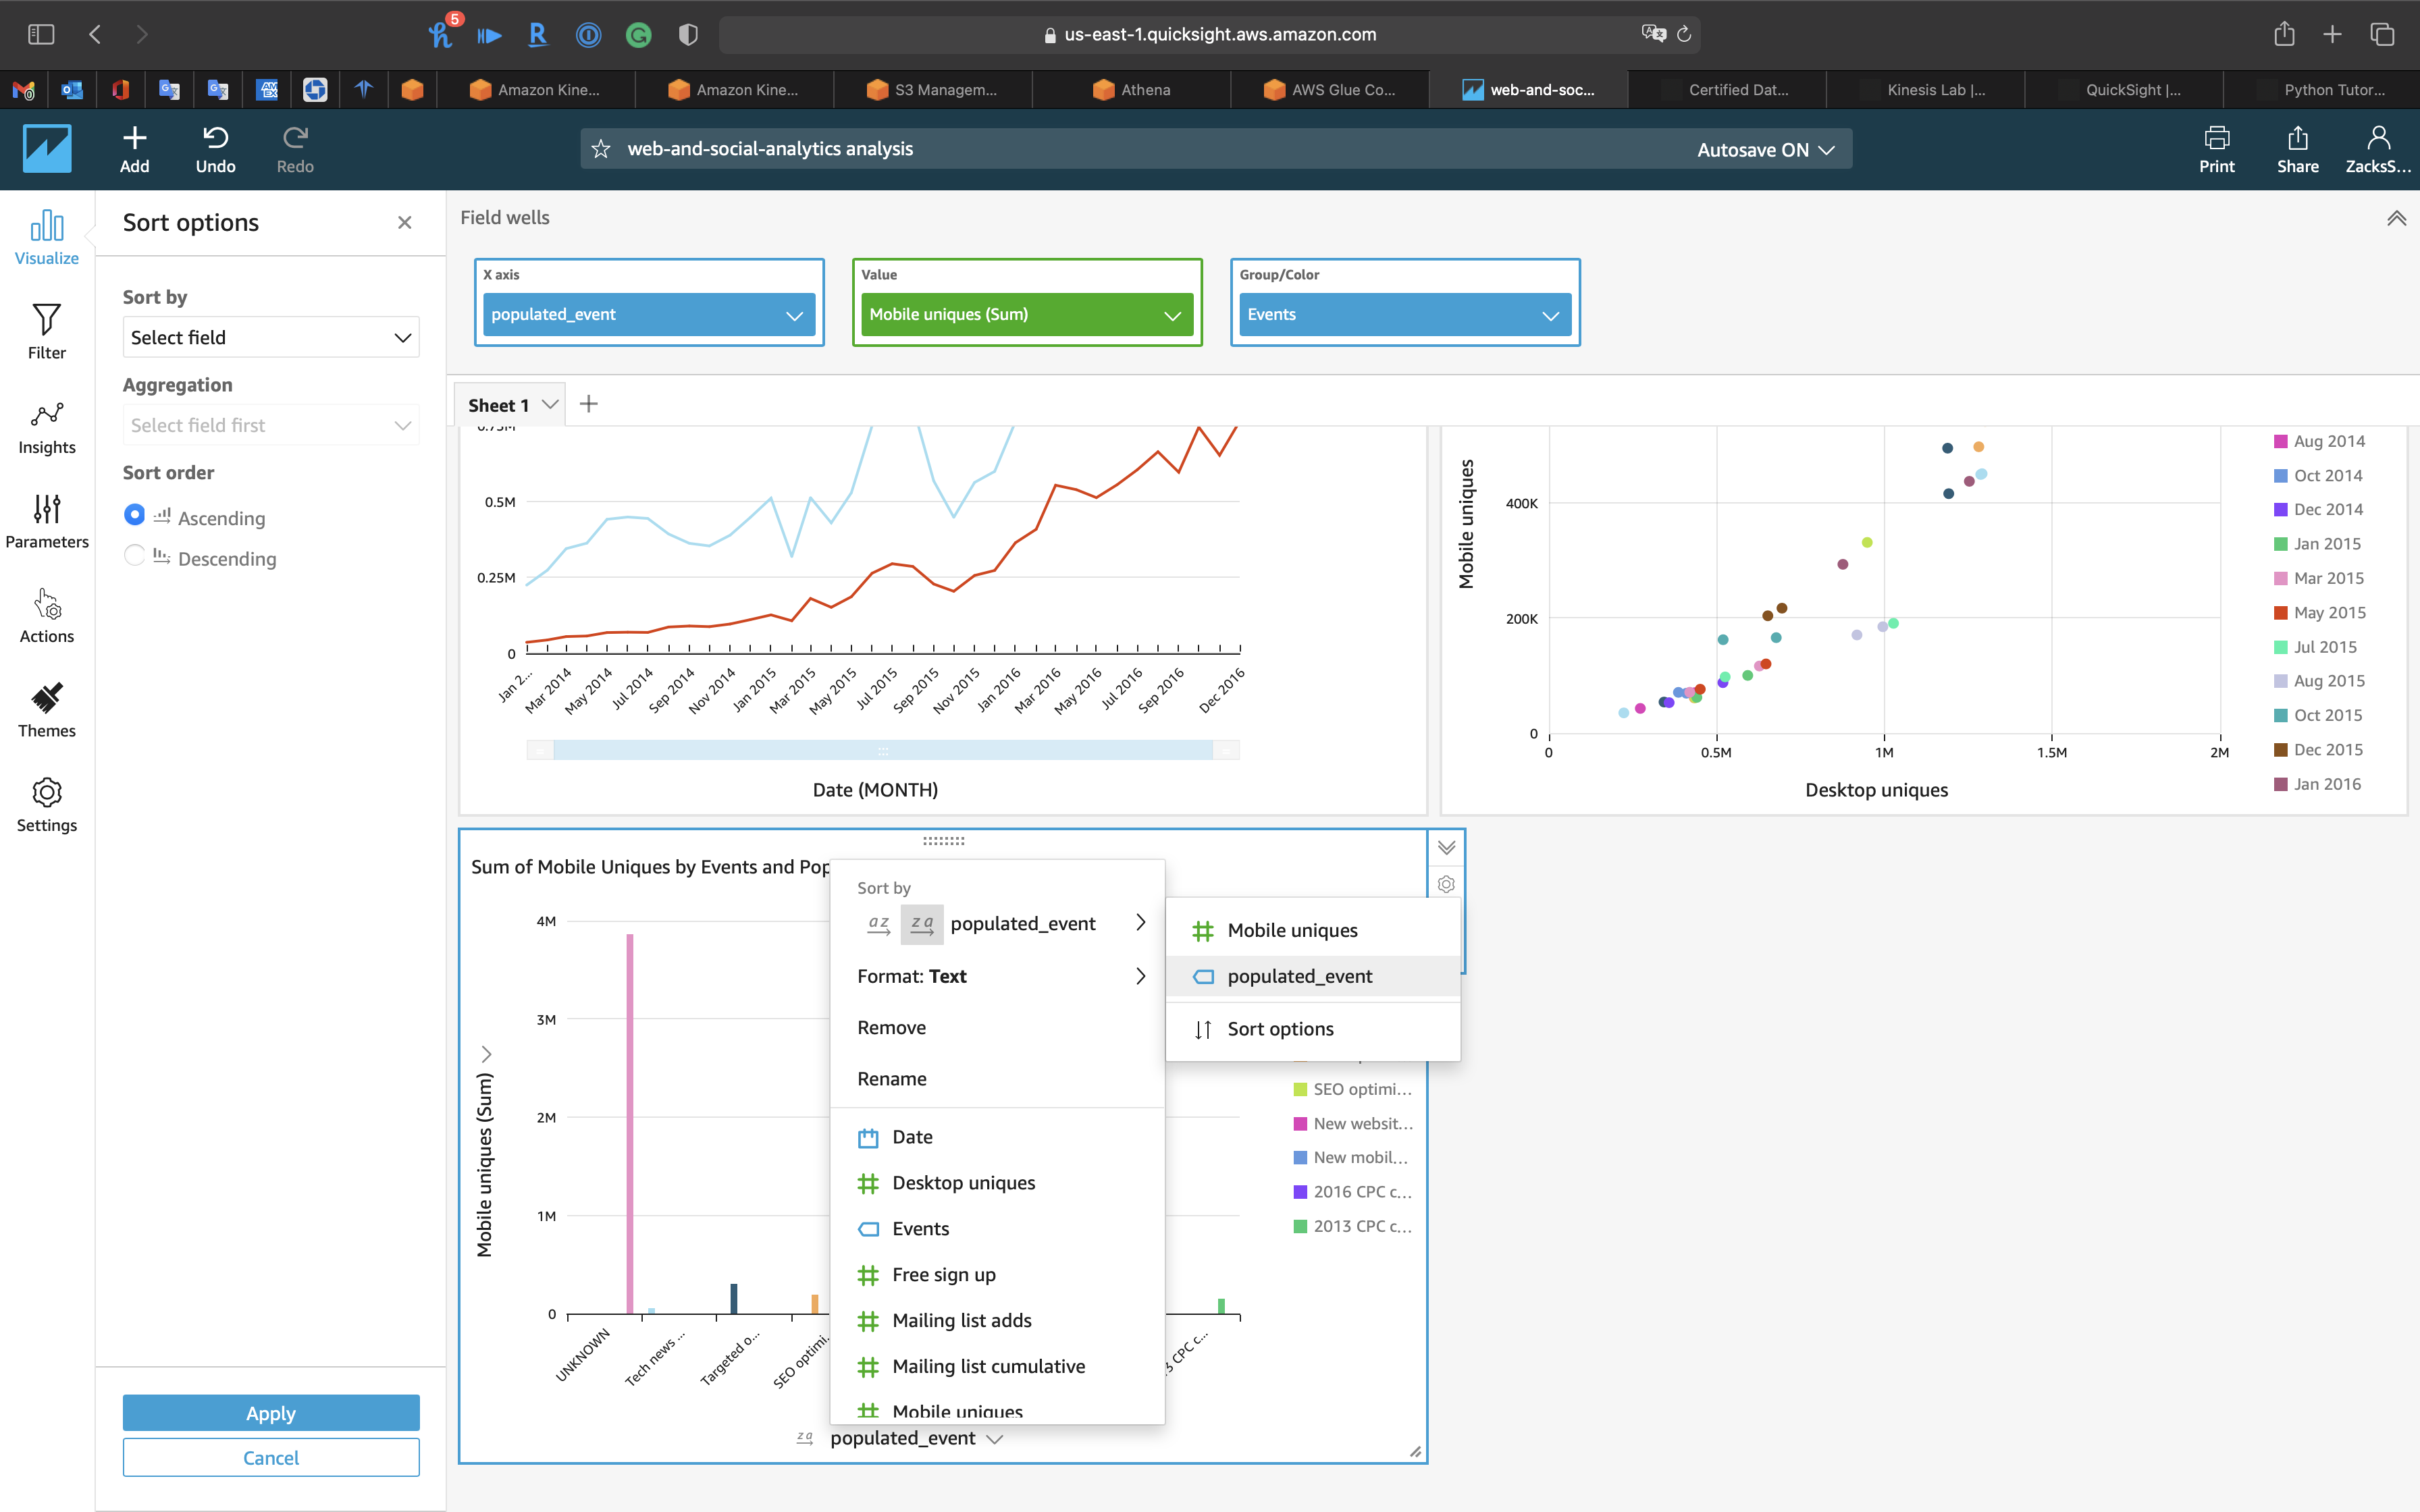
Sorting
- QuickSight sorting options for data interaction
- Sorting: Most visual types offer the ability to change data sort order
- Sorting depends on the visual type
- SPICE limitations for sort
- Up to two million unique values
- Up to 16 columns
- Sorting: Most visual types offer the ability to change data sort order
Drill Down
- QuickSight drill down options for data interaction
- Drill Down: All visual types except pivot tables allow creation of a hierarchy of fields for a visual element
- Hierarchy lets you drill down to see data at different levels of the hierarchy
- Field wells available to create drill-downs varies by visual type
- Drill Down: All visual types except pivot tables allow creation of a hierarchy of fields for a visual element
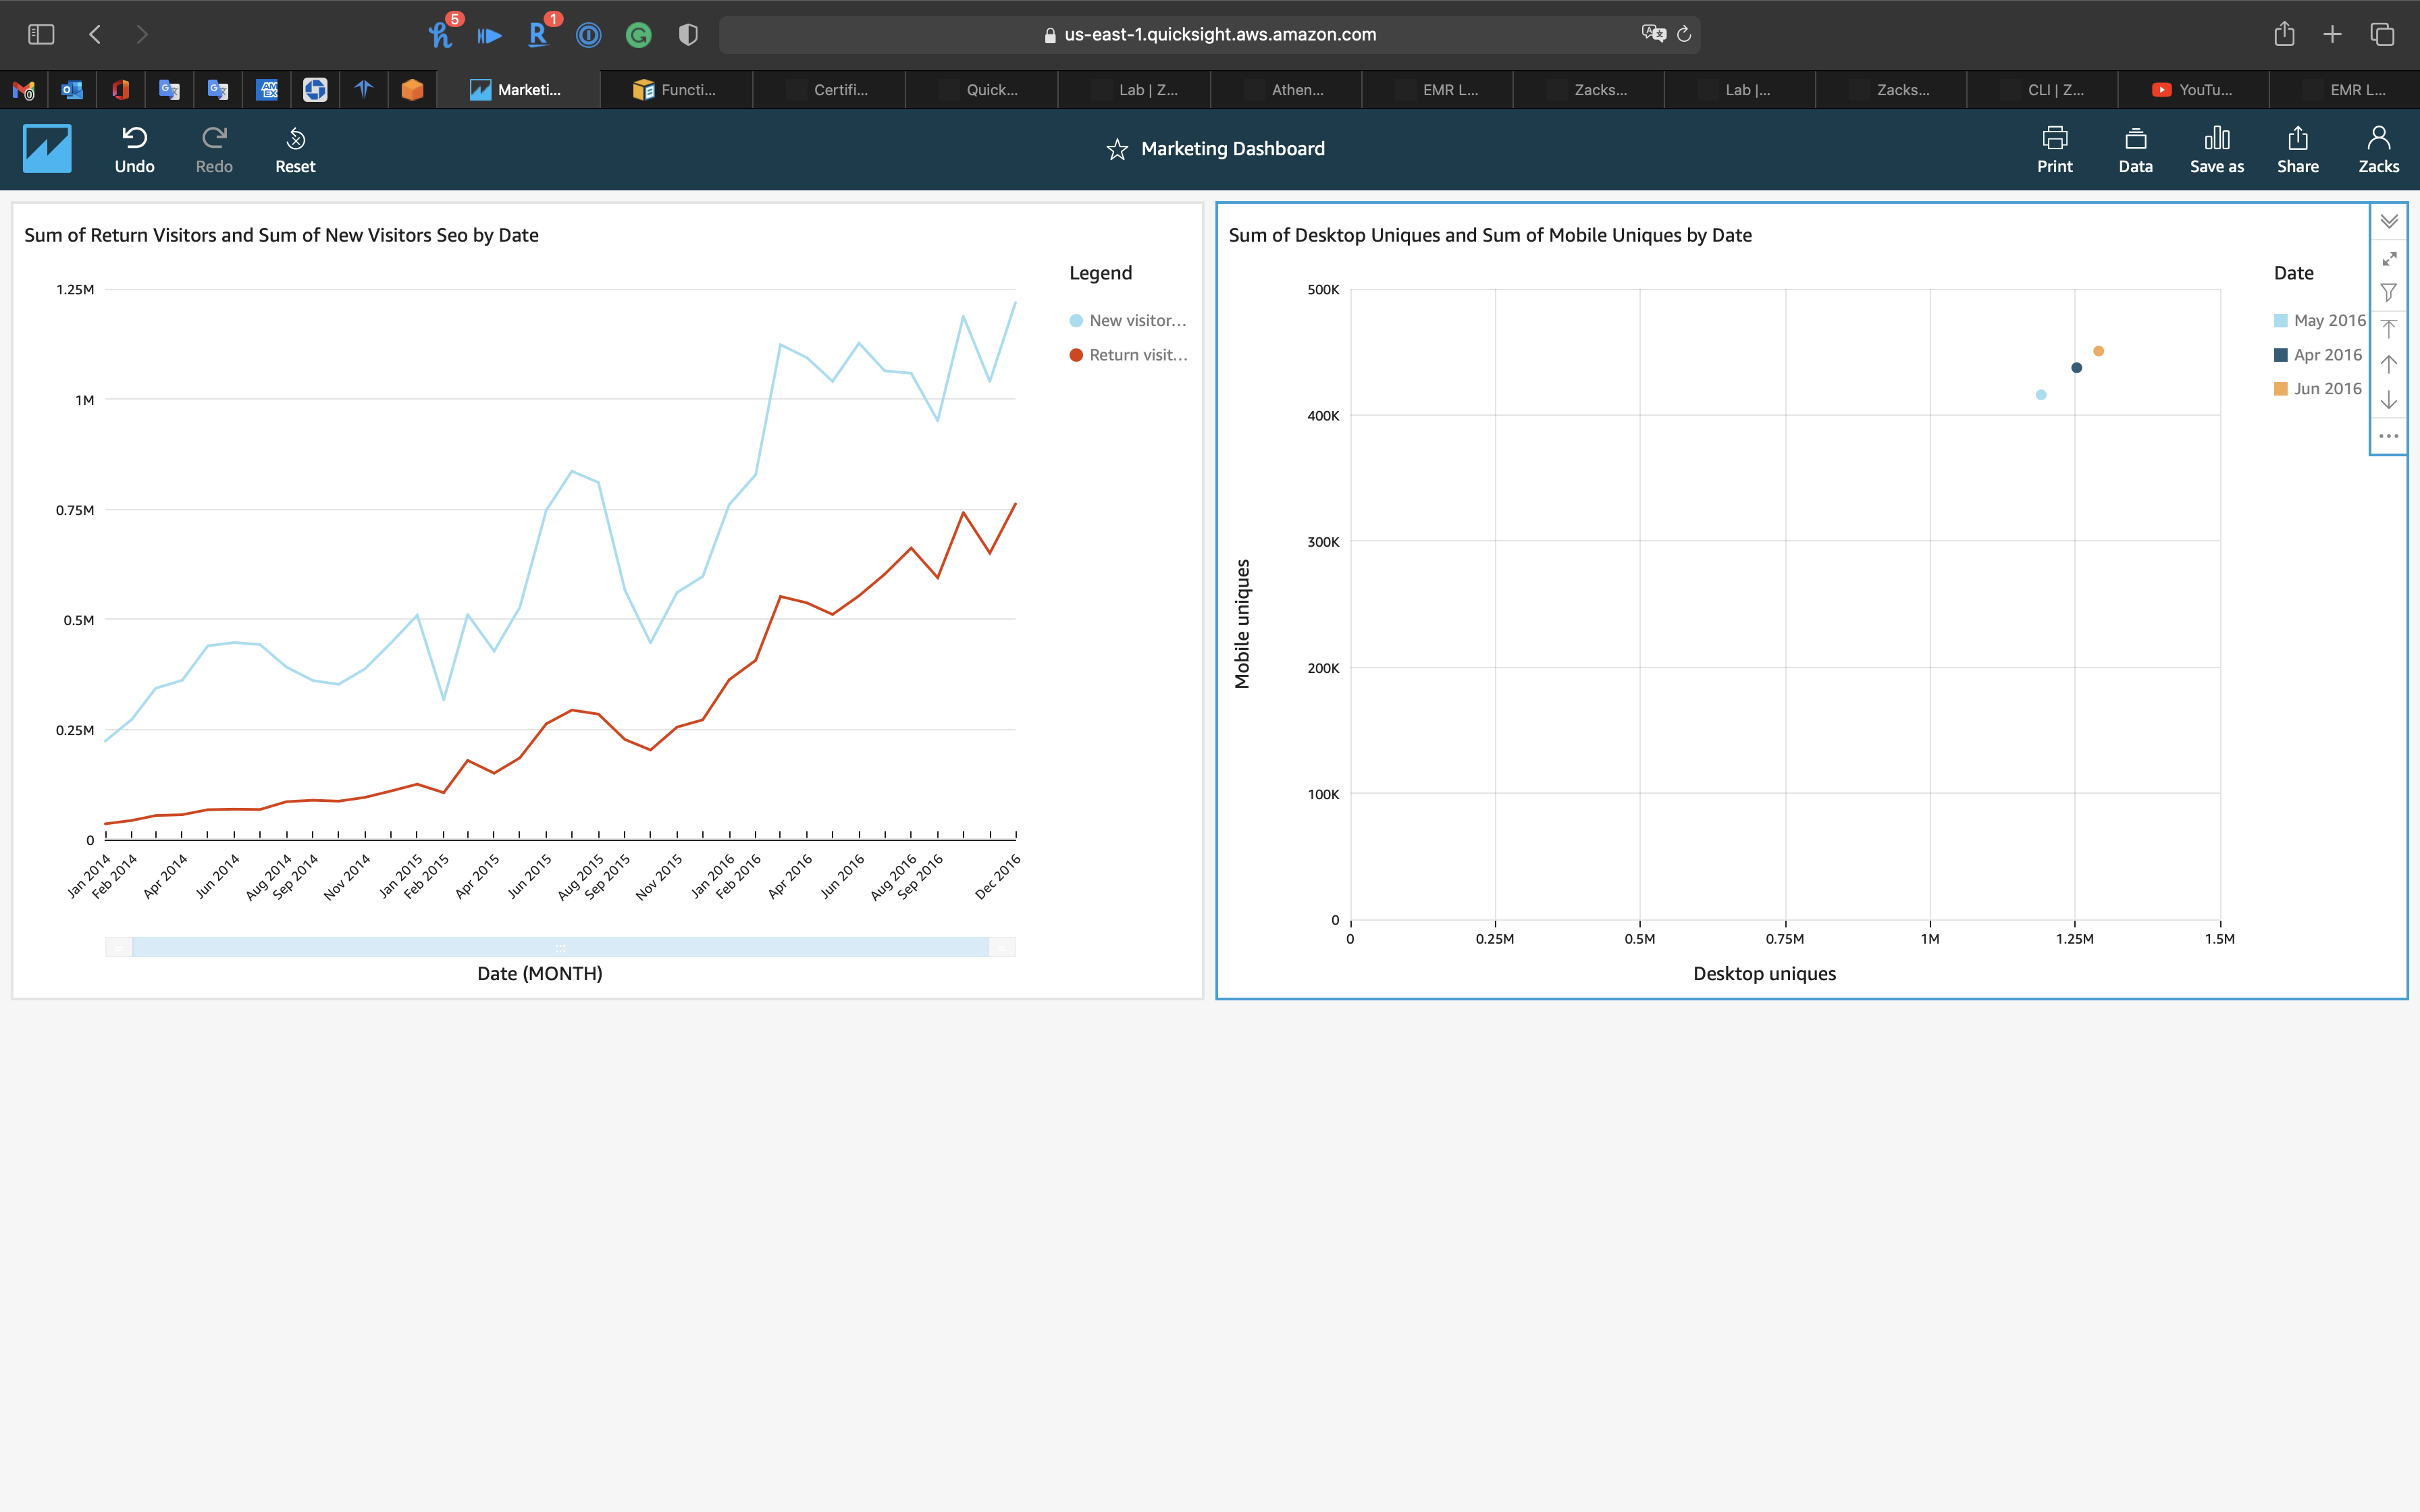
Line Chart - Drill down to WEEK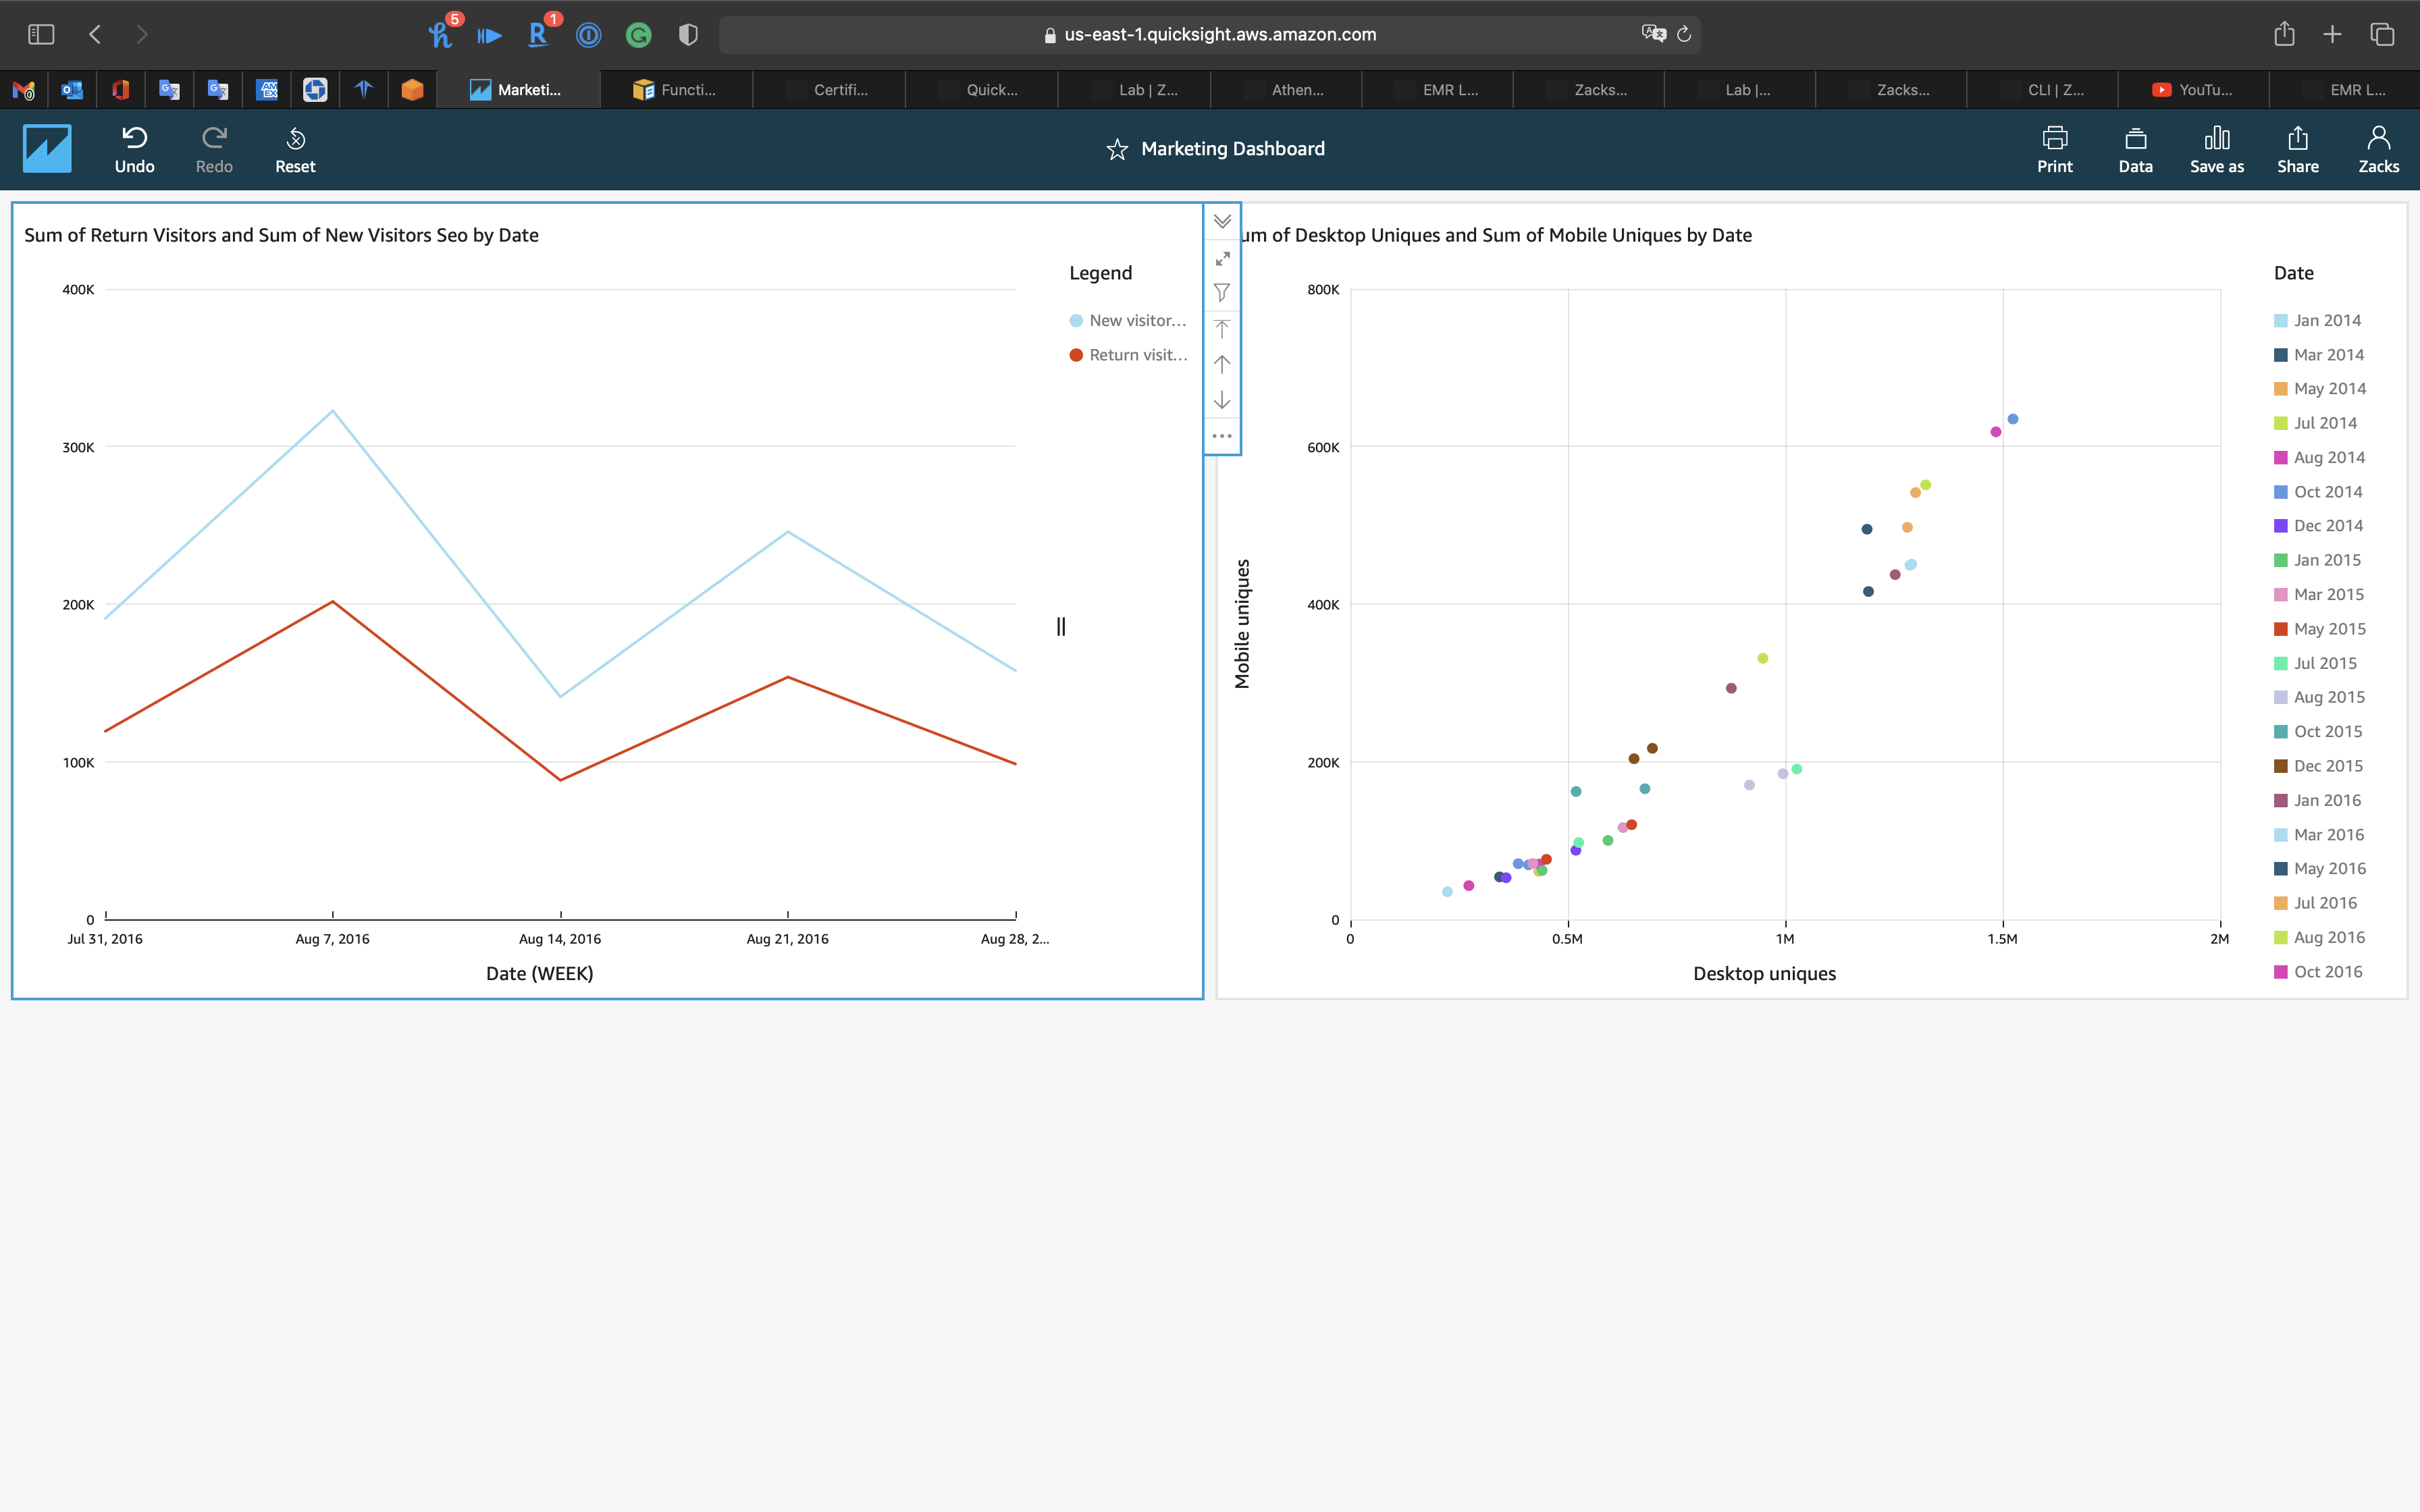
Line Chart - Drill up to MONTH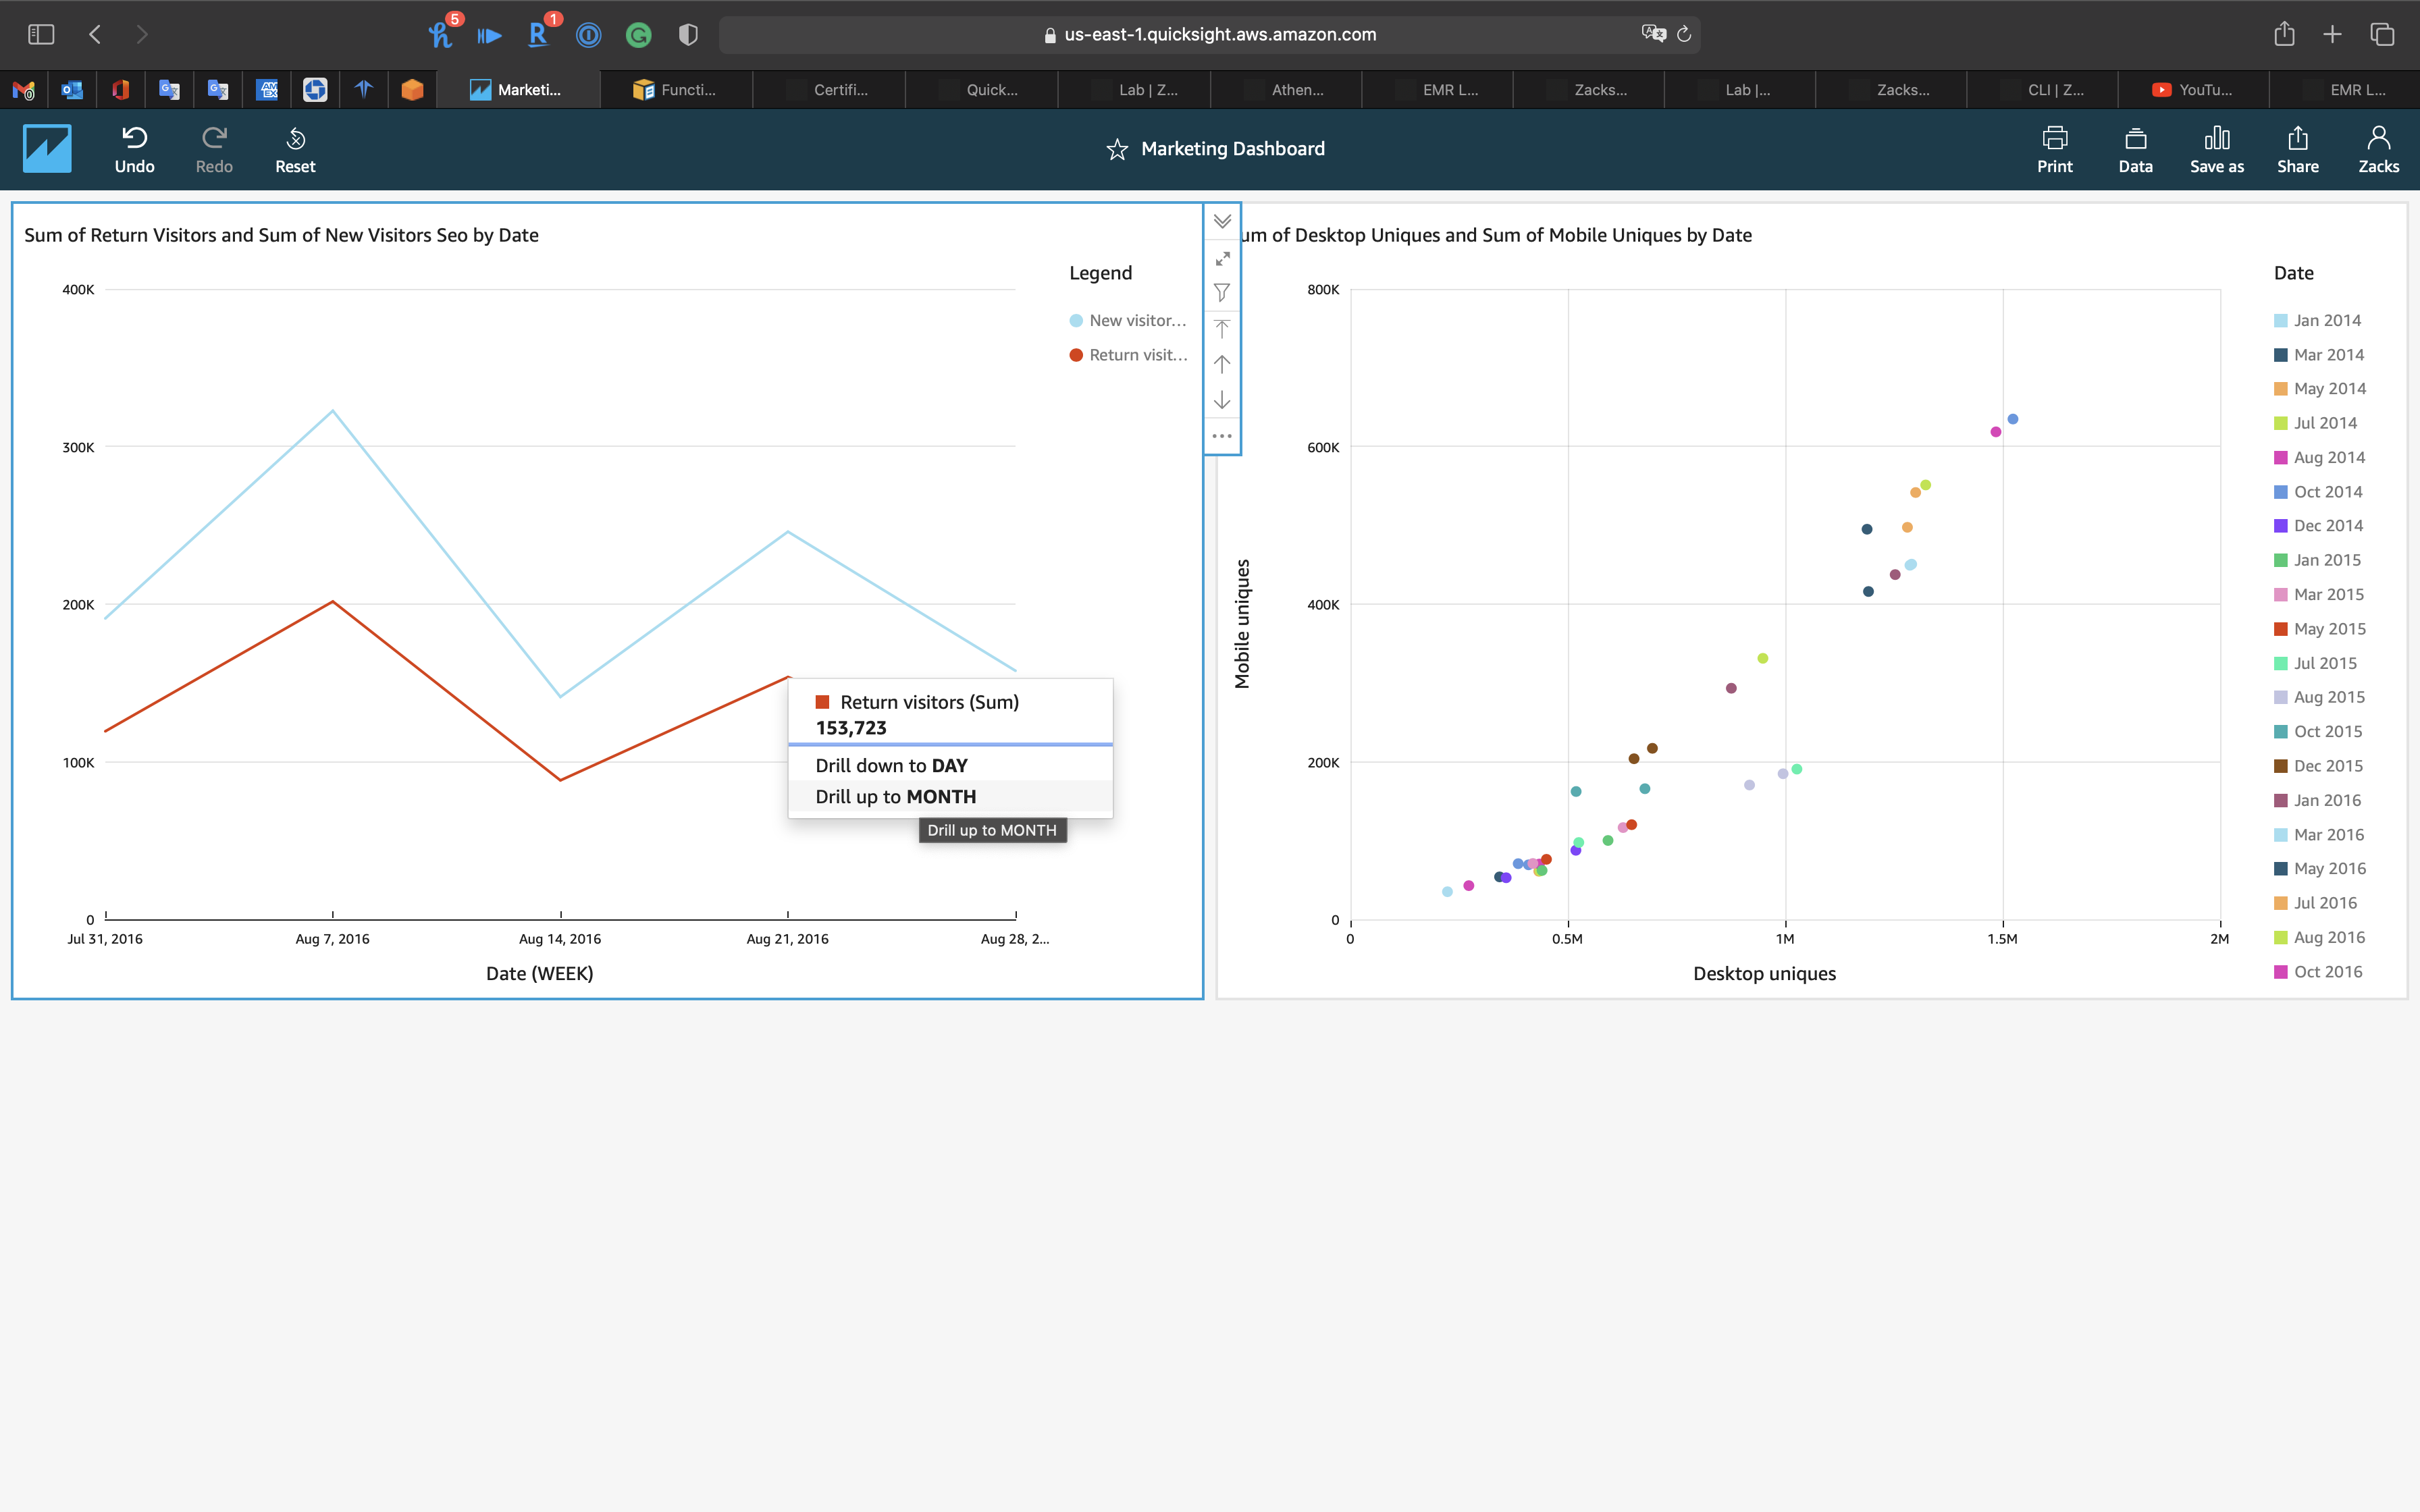
Scatter Plot - Drill down to WEEK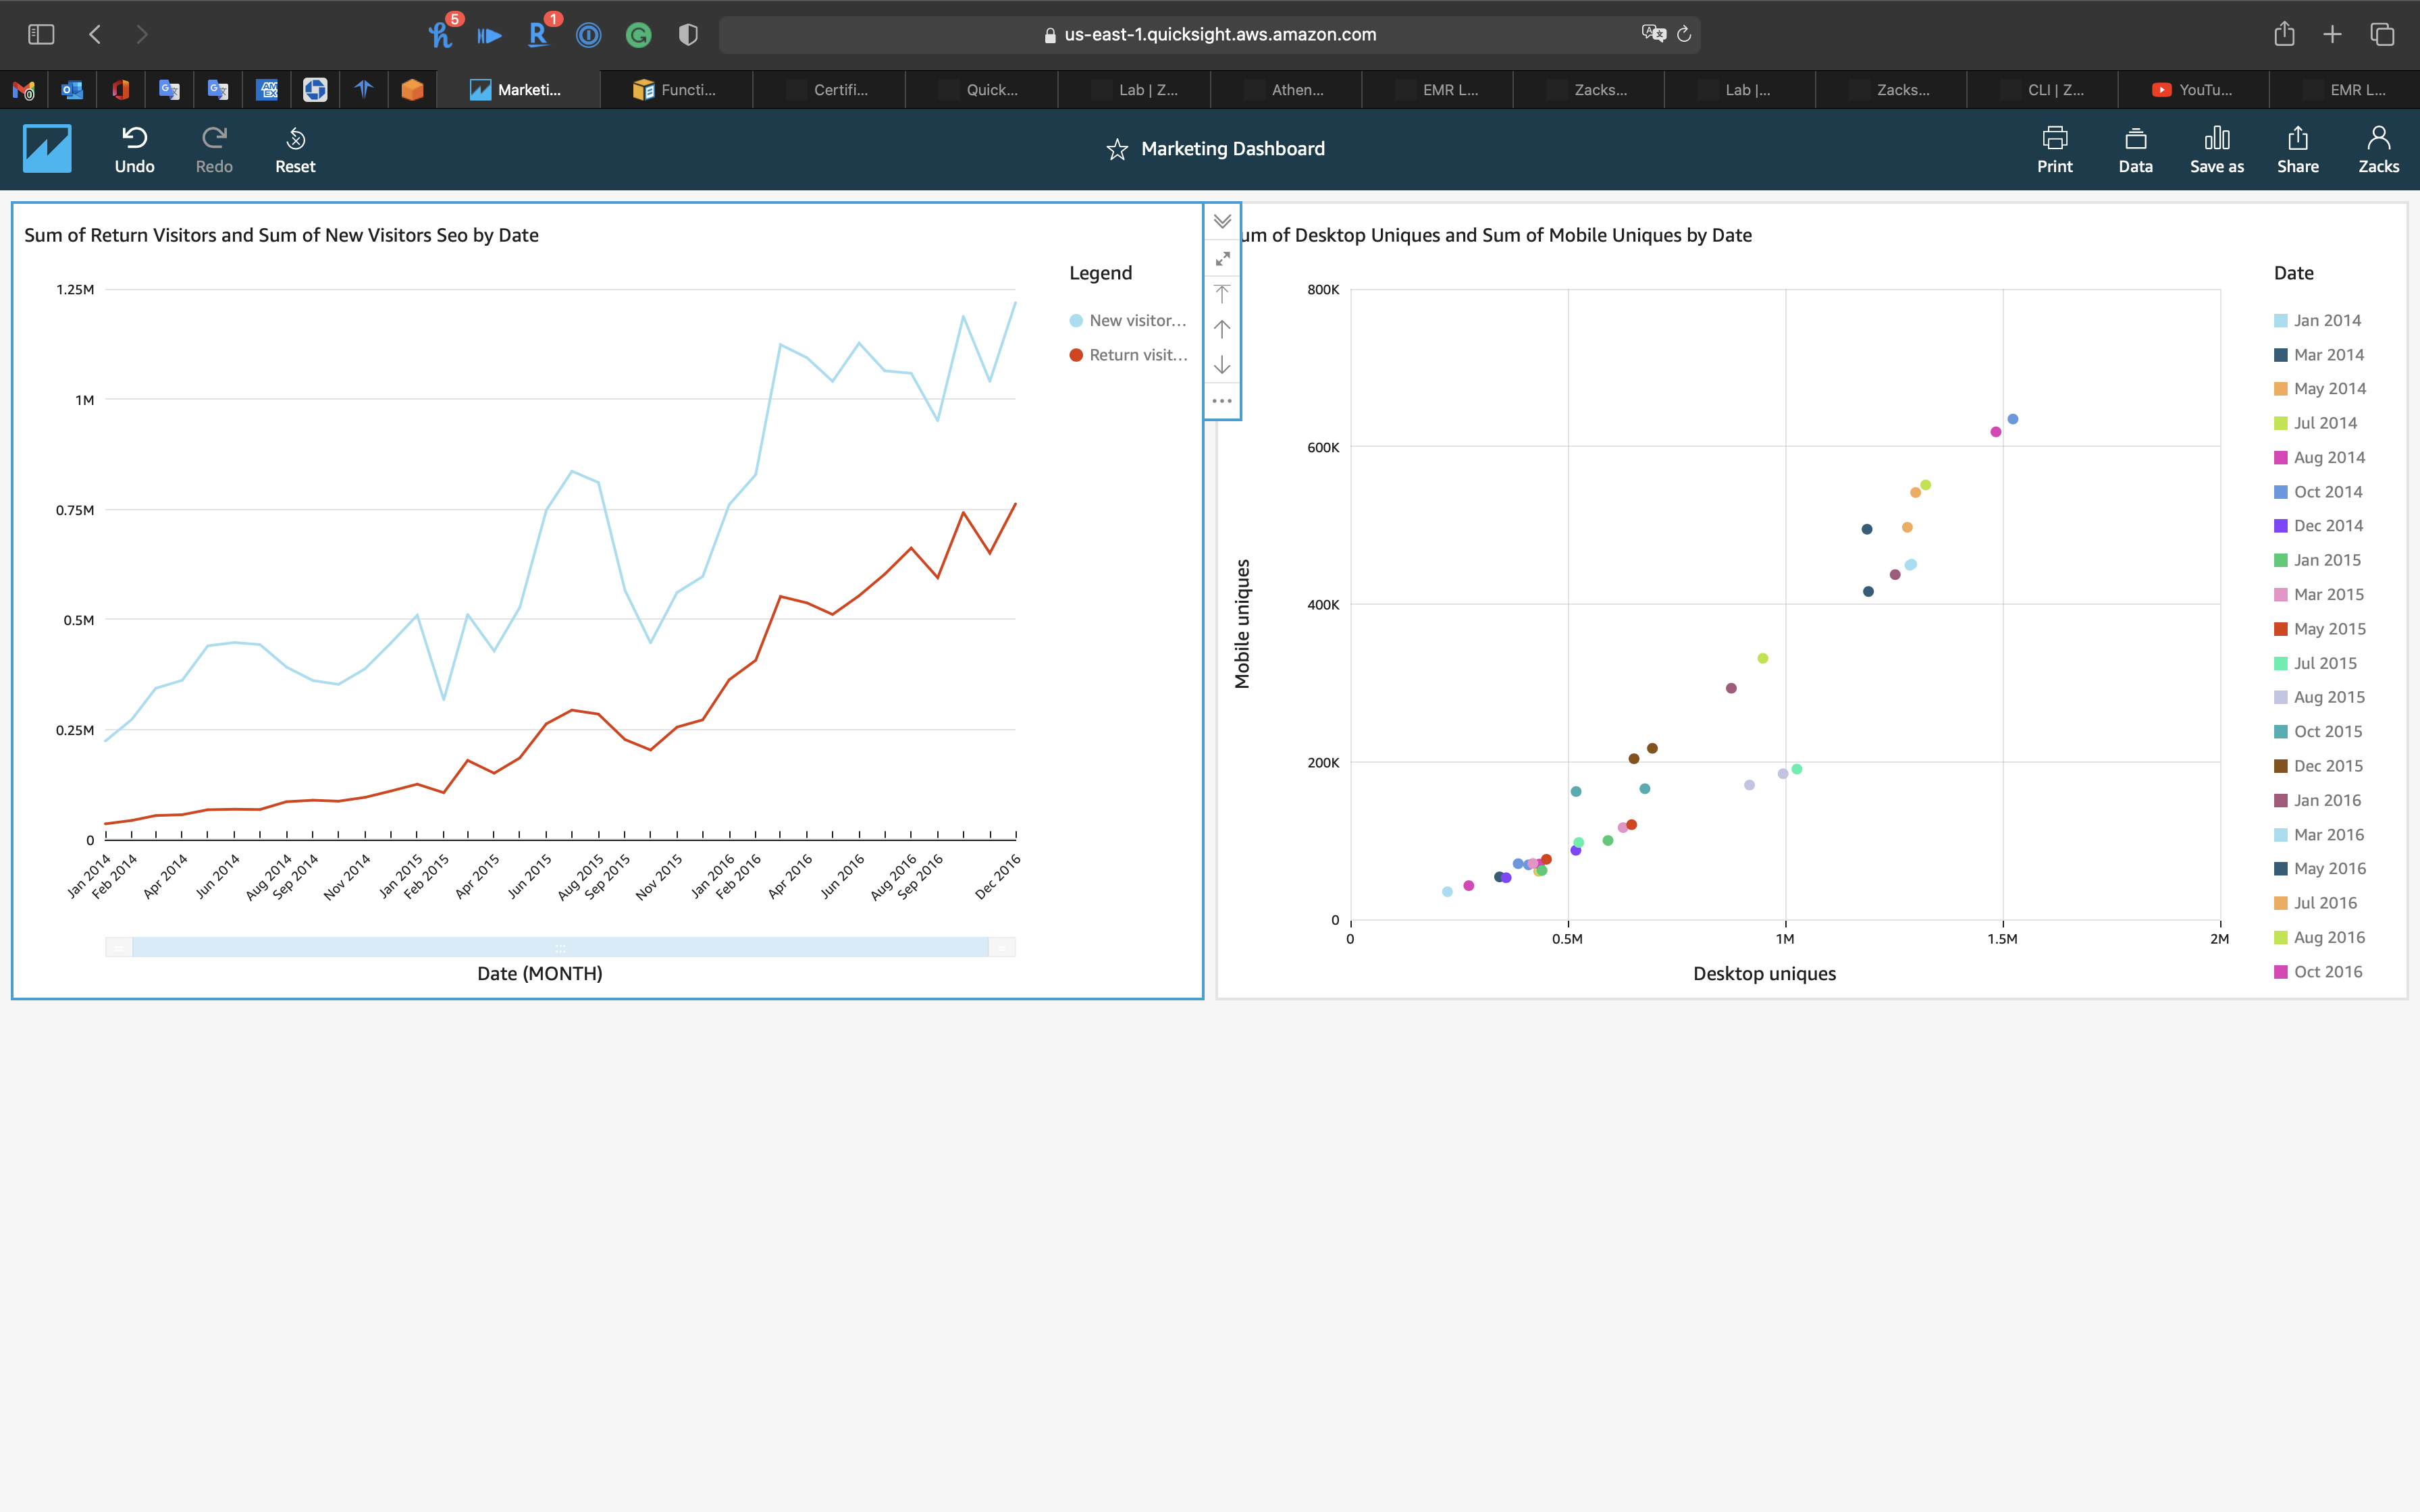
Scatter Plot - Drill up to MONTH