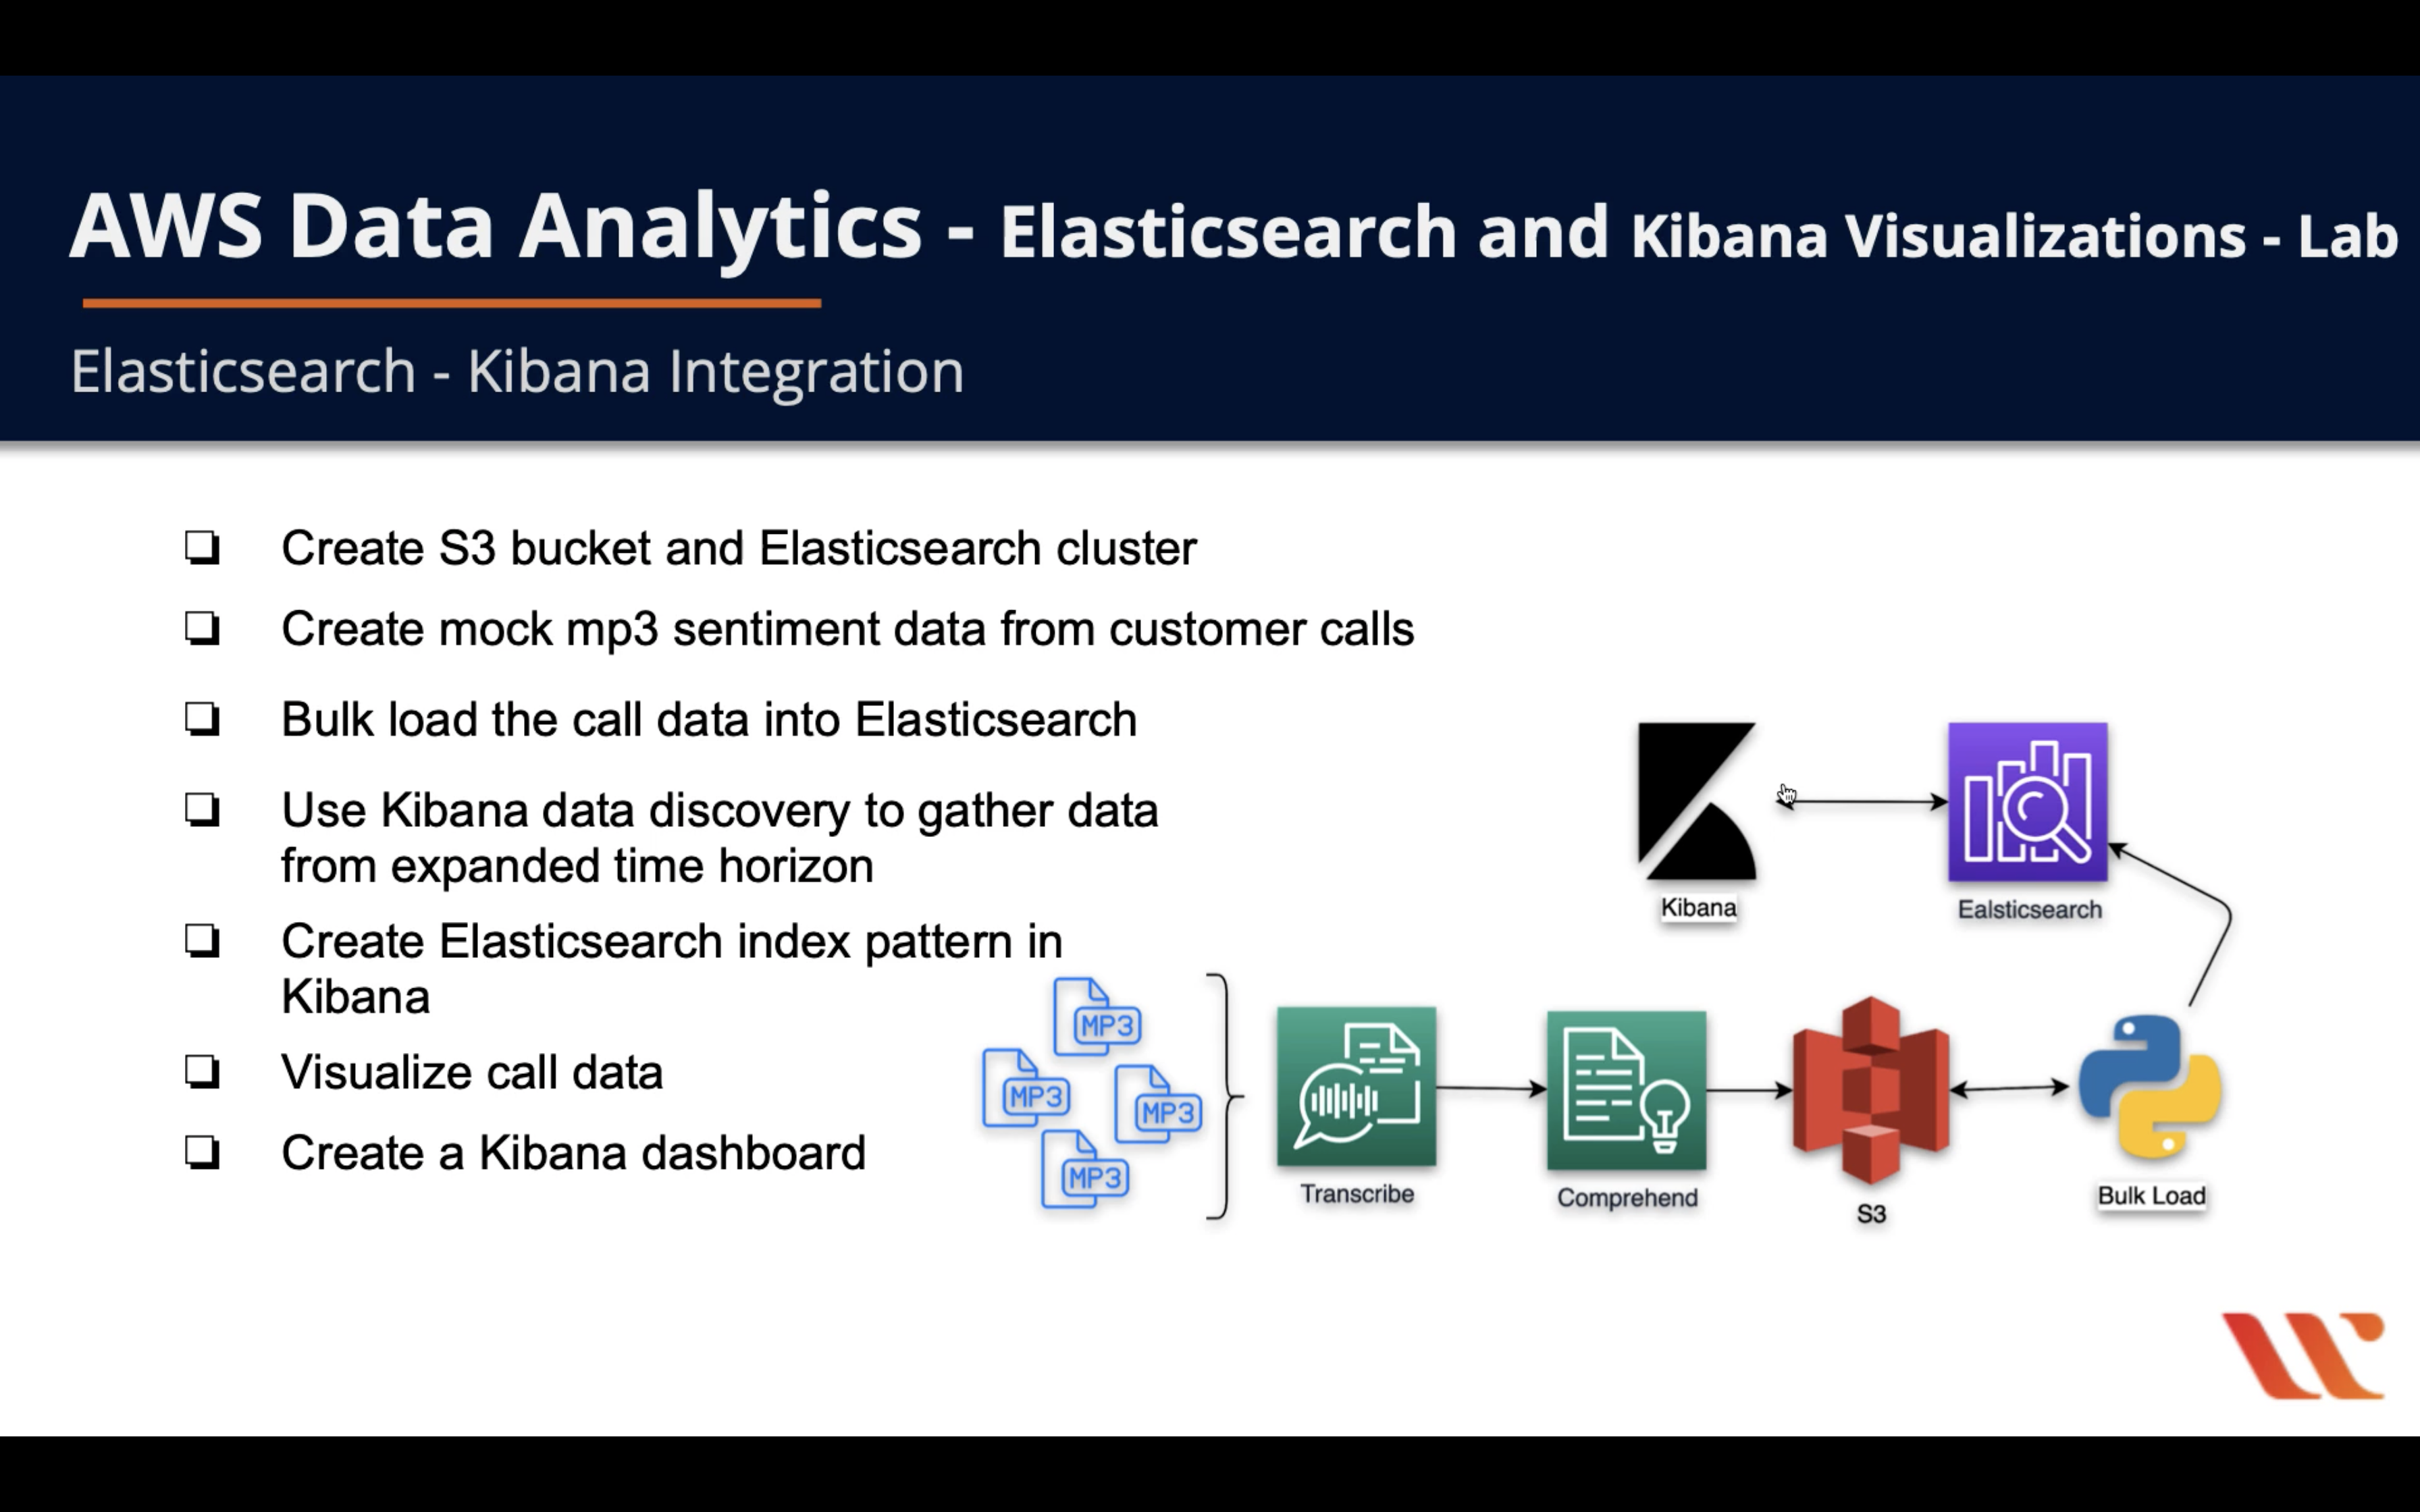
AWS Elasticsearch Service Lab
AWS OpenSearch (Previous Elasticsearch) Service
AWS OpenSearch
Kibana Music
Getting started with Amazon OpenSearch Service
Lab Details
- Create S3 bucket and OpenSearch cluster
- Create mock mp3 sentiment data from customer calls
- Bulk load the call data into OpenSearch
- Use Kibana data discovery to gether data from expanded time horizon
- Create OpenSearch index pattern in Kibana
- Visualize call data
- Create a Kibana dashboard
S3 Configuration
Create your S3 bucket. My bucket was enabled public access for minimizing lab complexity. Make sure your bucket policy obeys certain requirements.
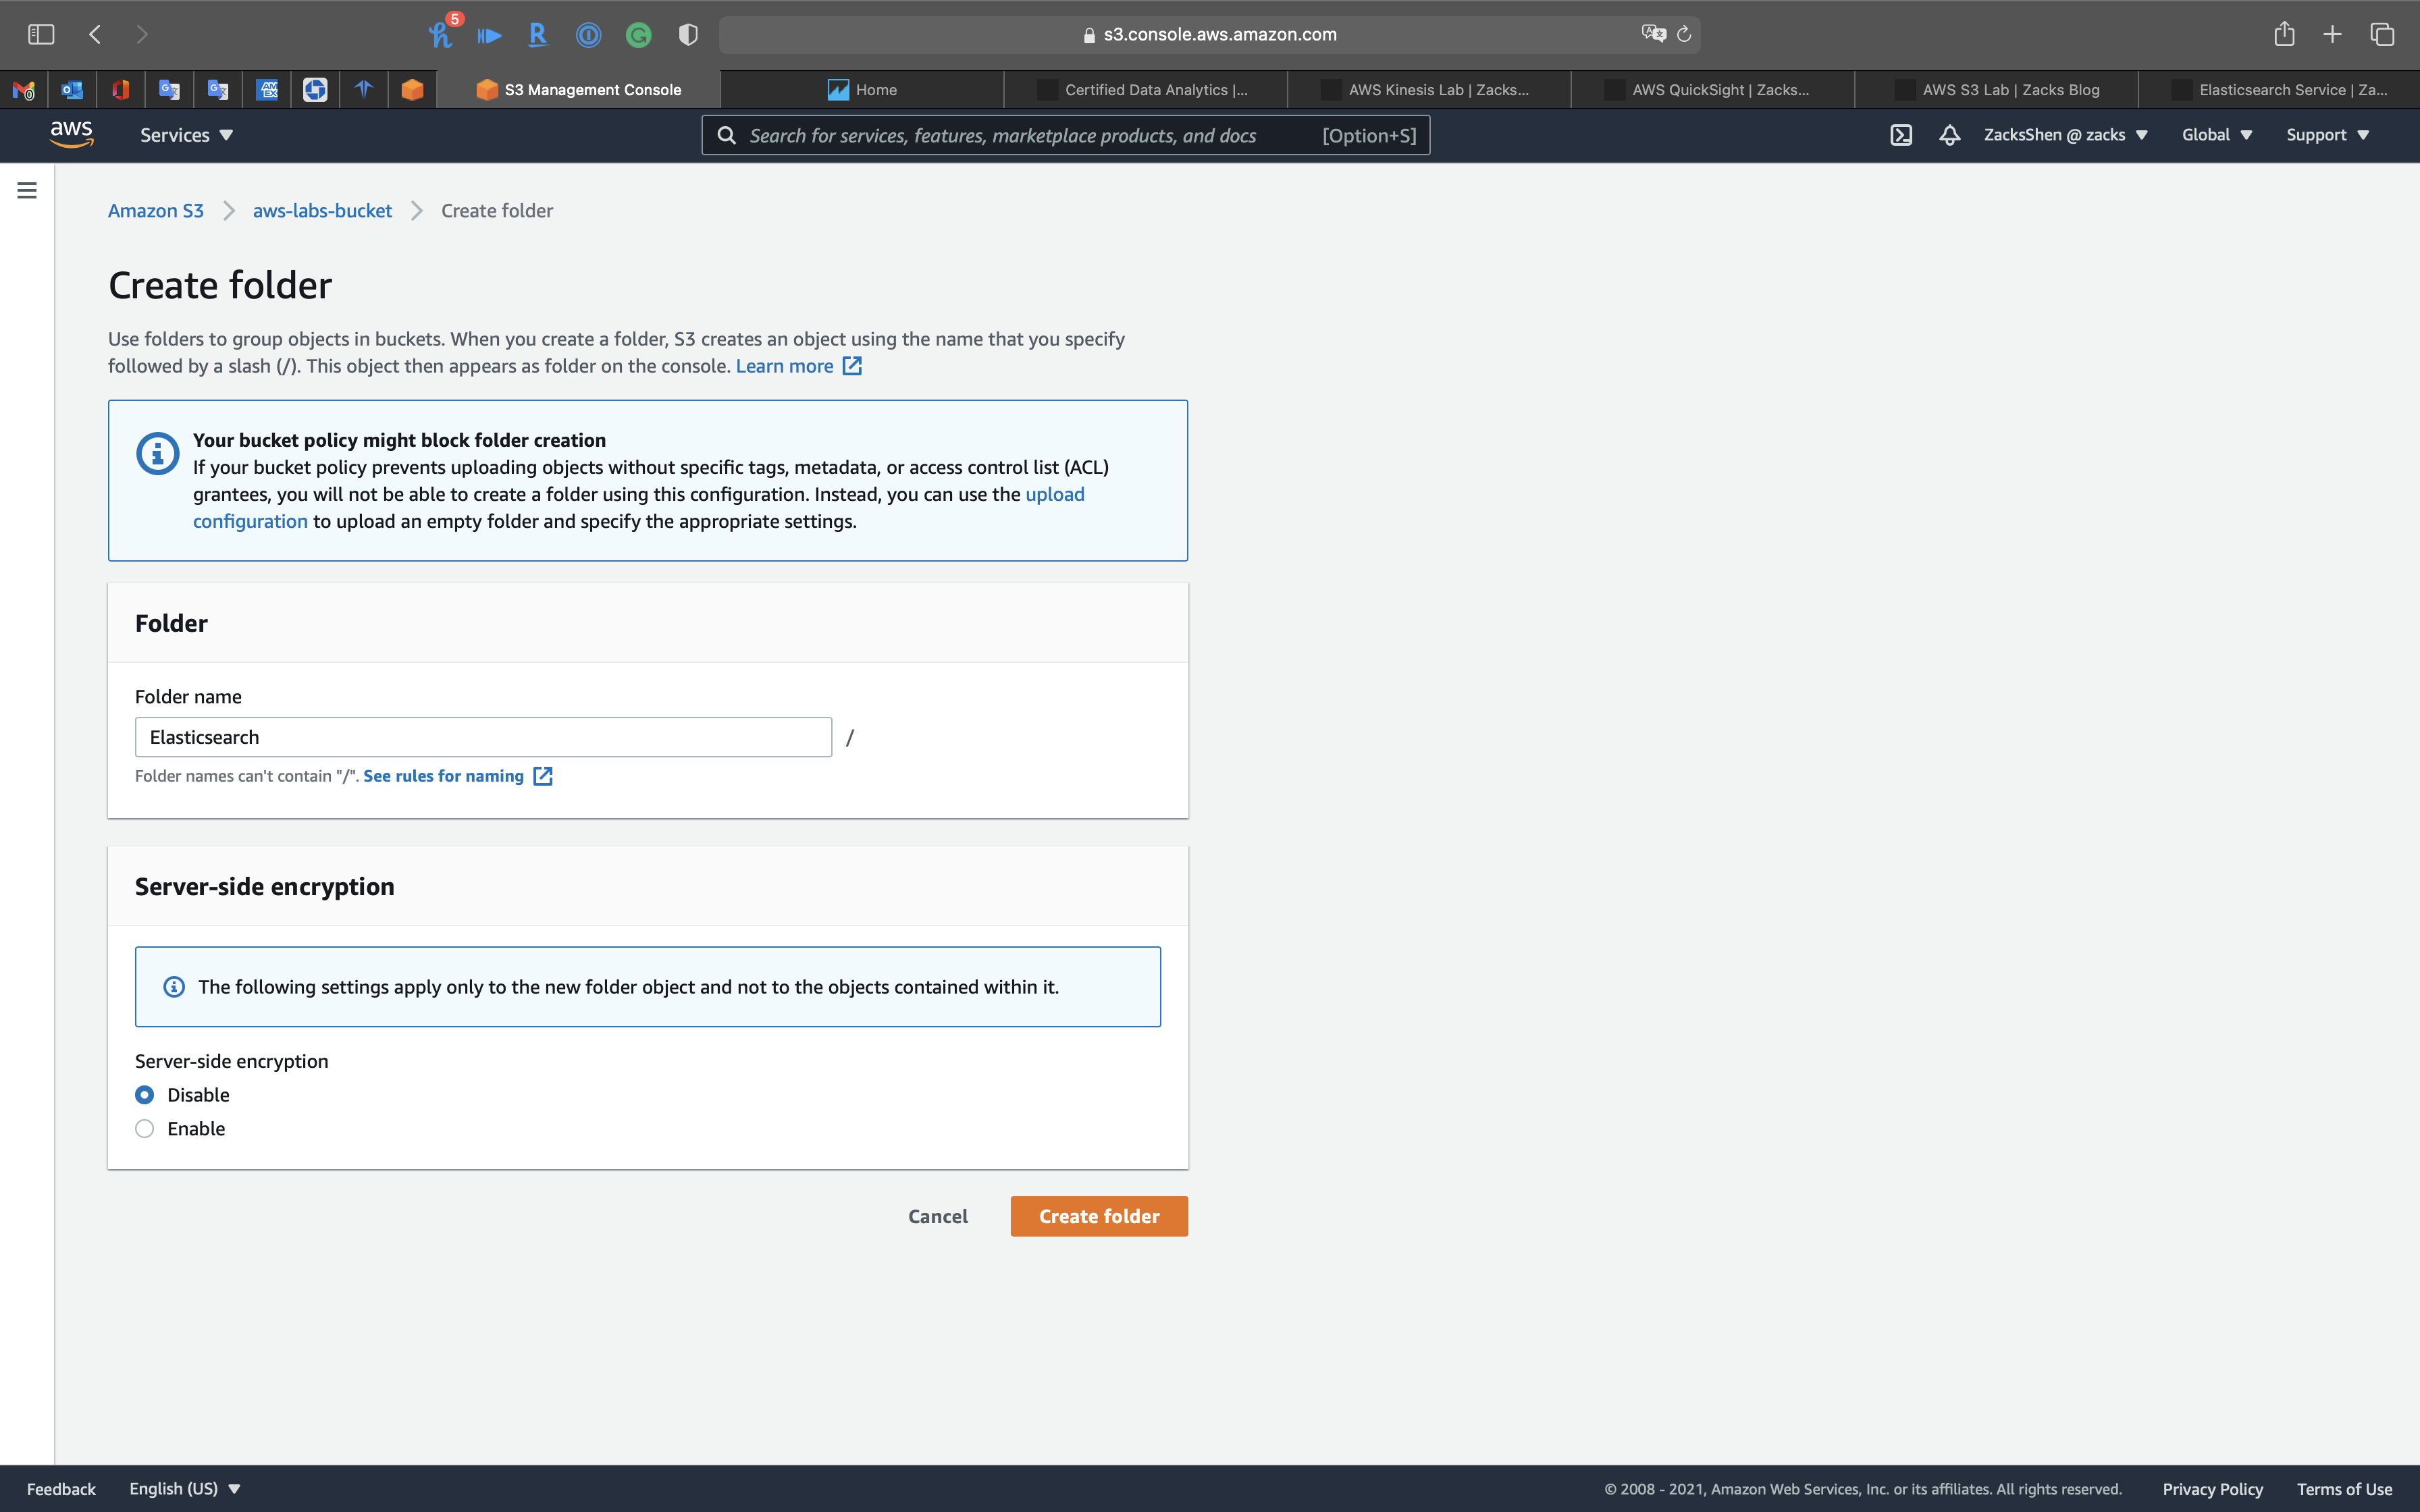
Create a folder
Elasticsearchfor Kibana in S3 bucket
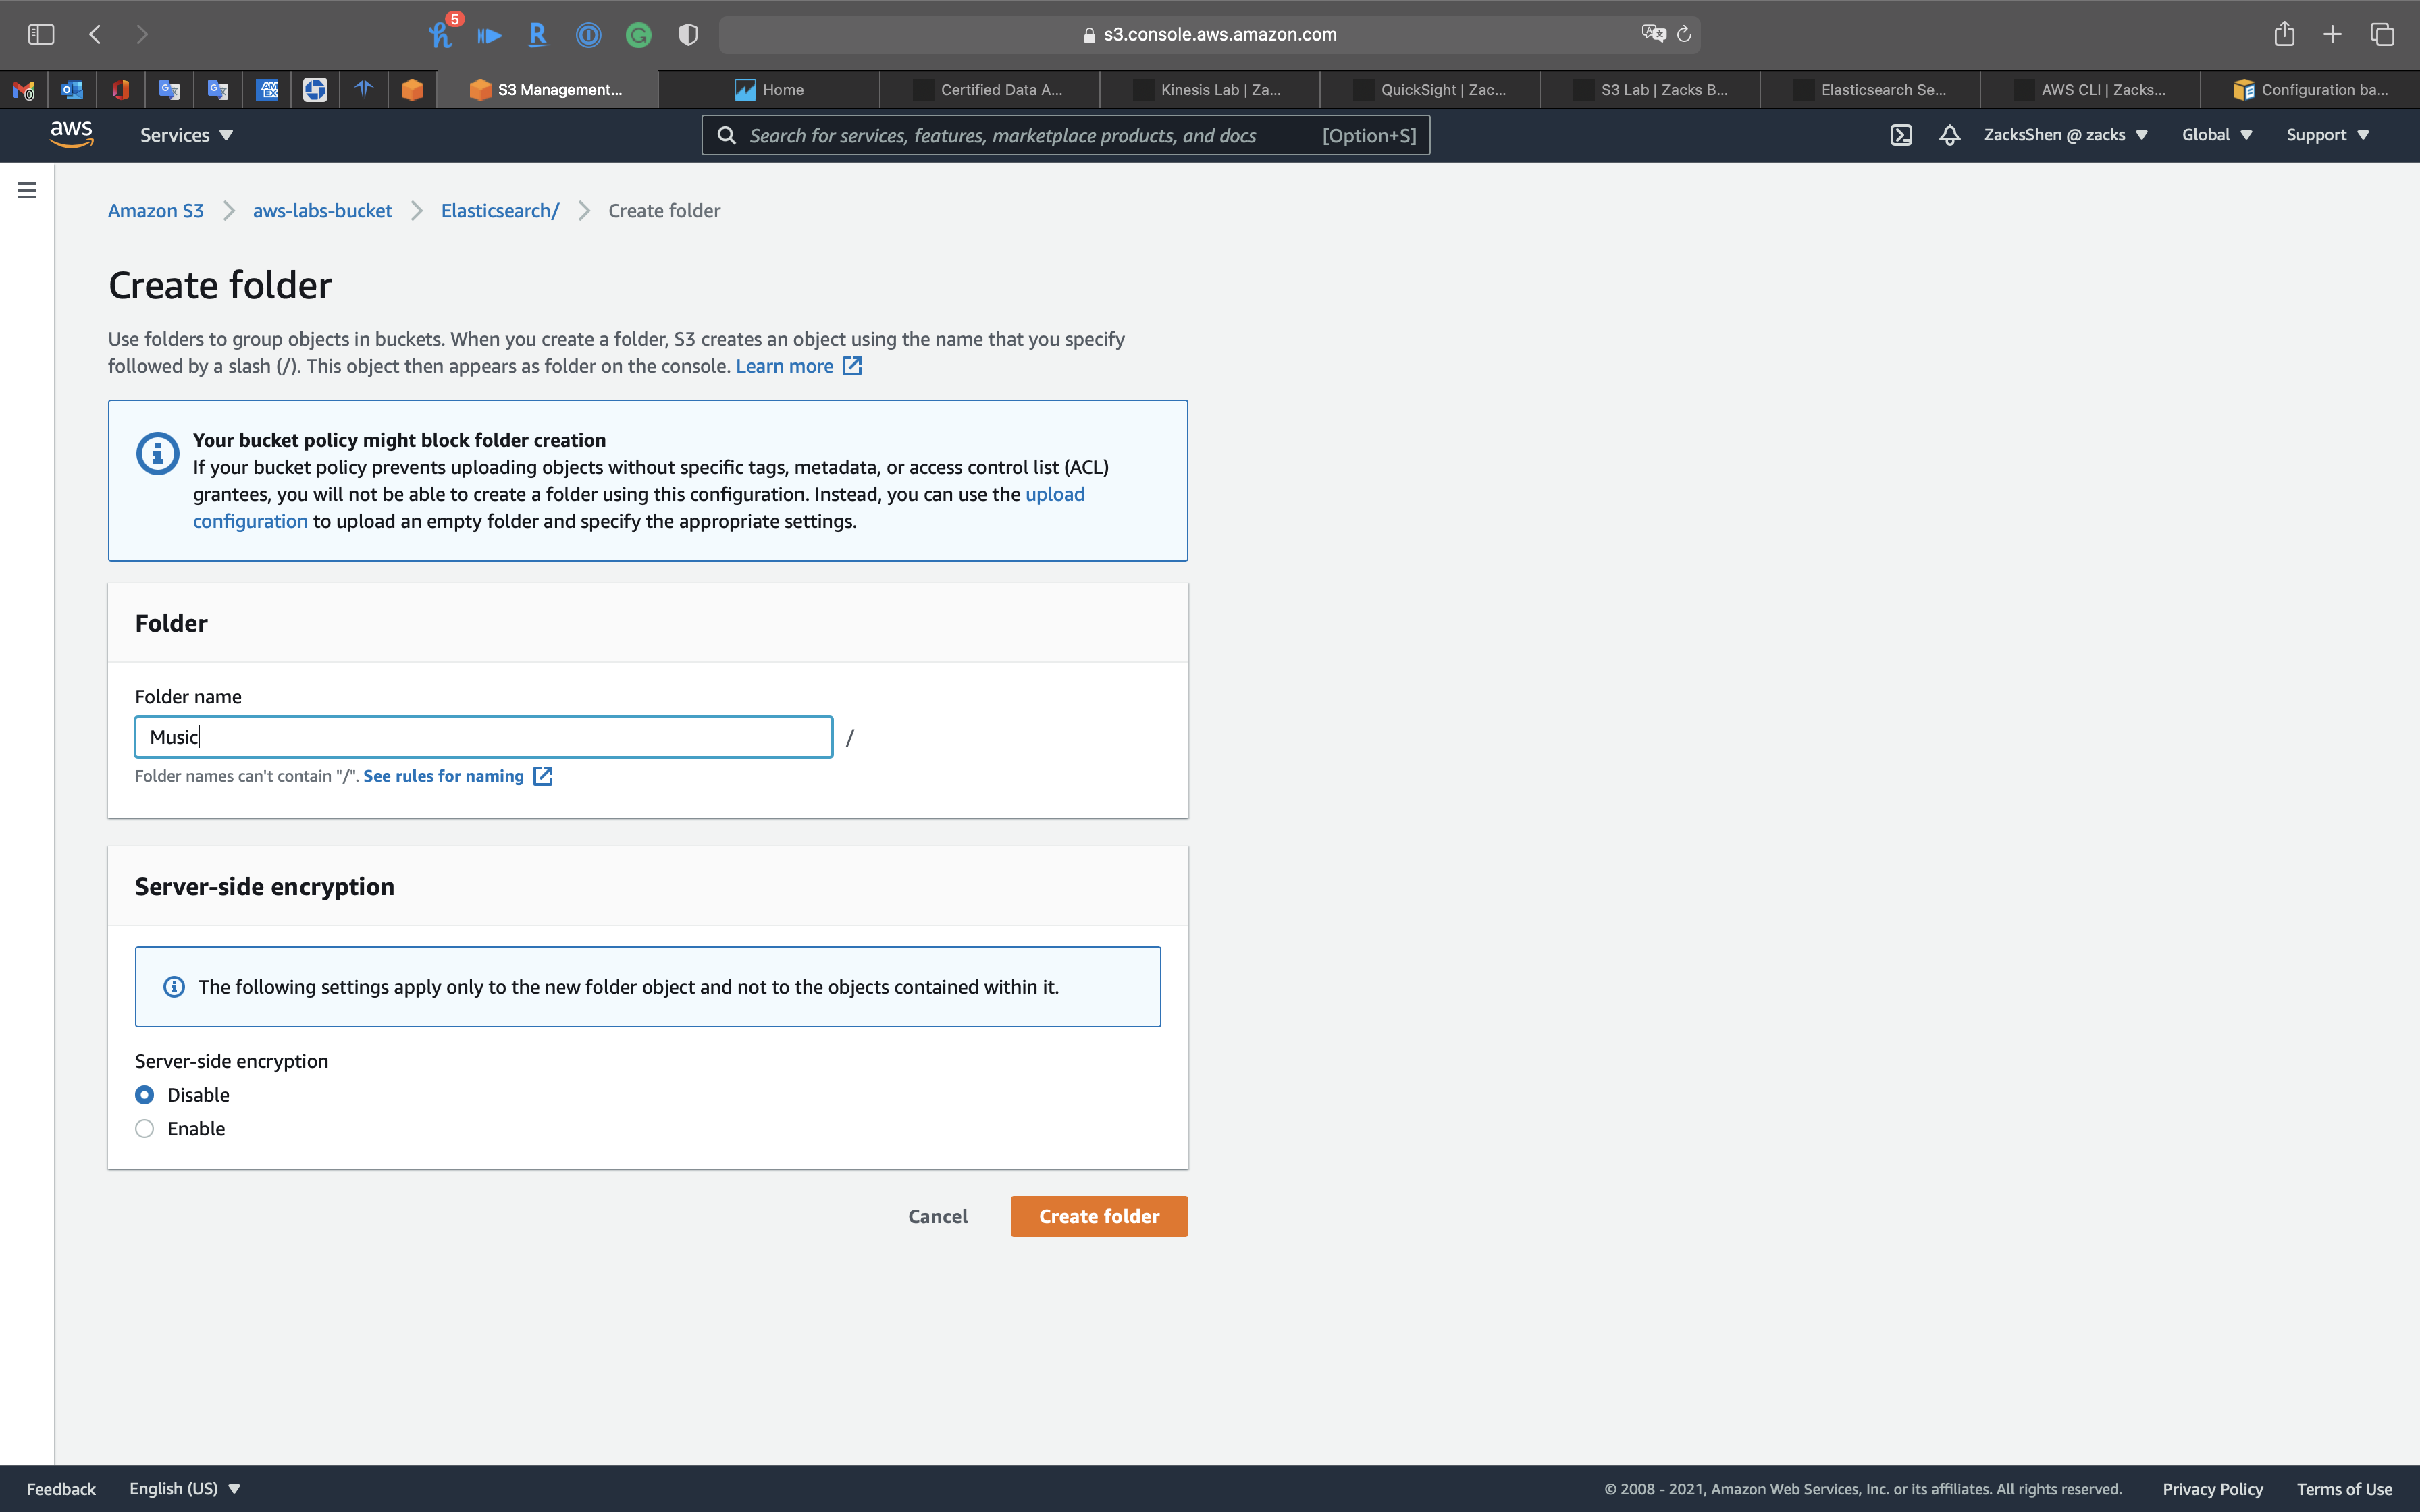
- Create a folder
Musicfor Kibana inElasticsearchfolder
OpenSearch Configuration
Create an OpenSearch Cluster
AWS CLI
If you have any permission error, see AWS CLI
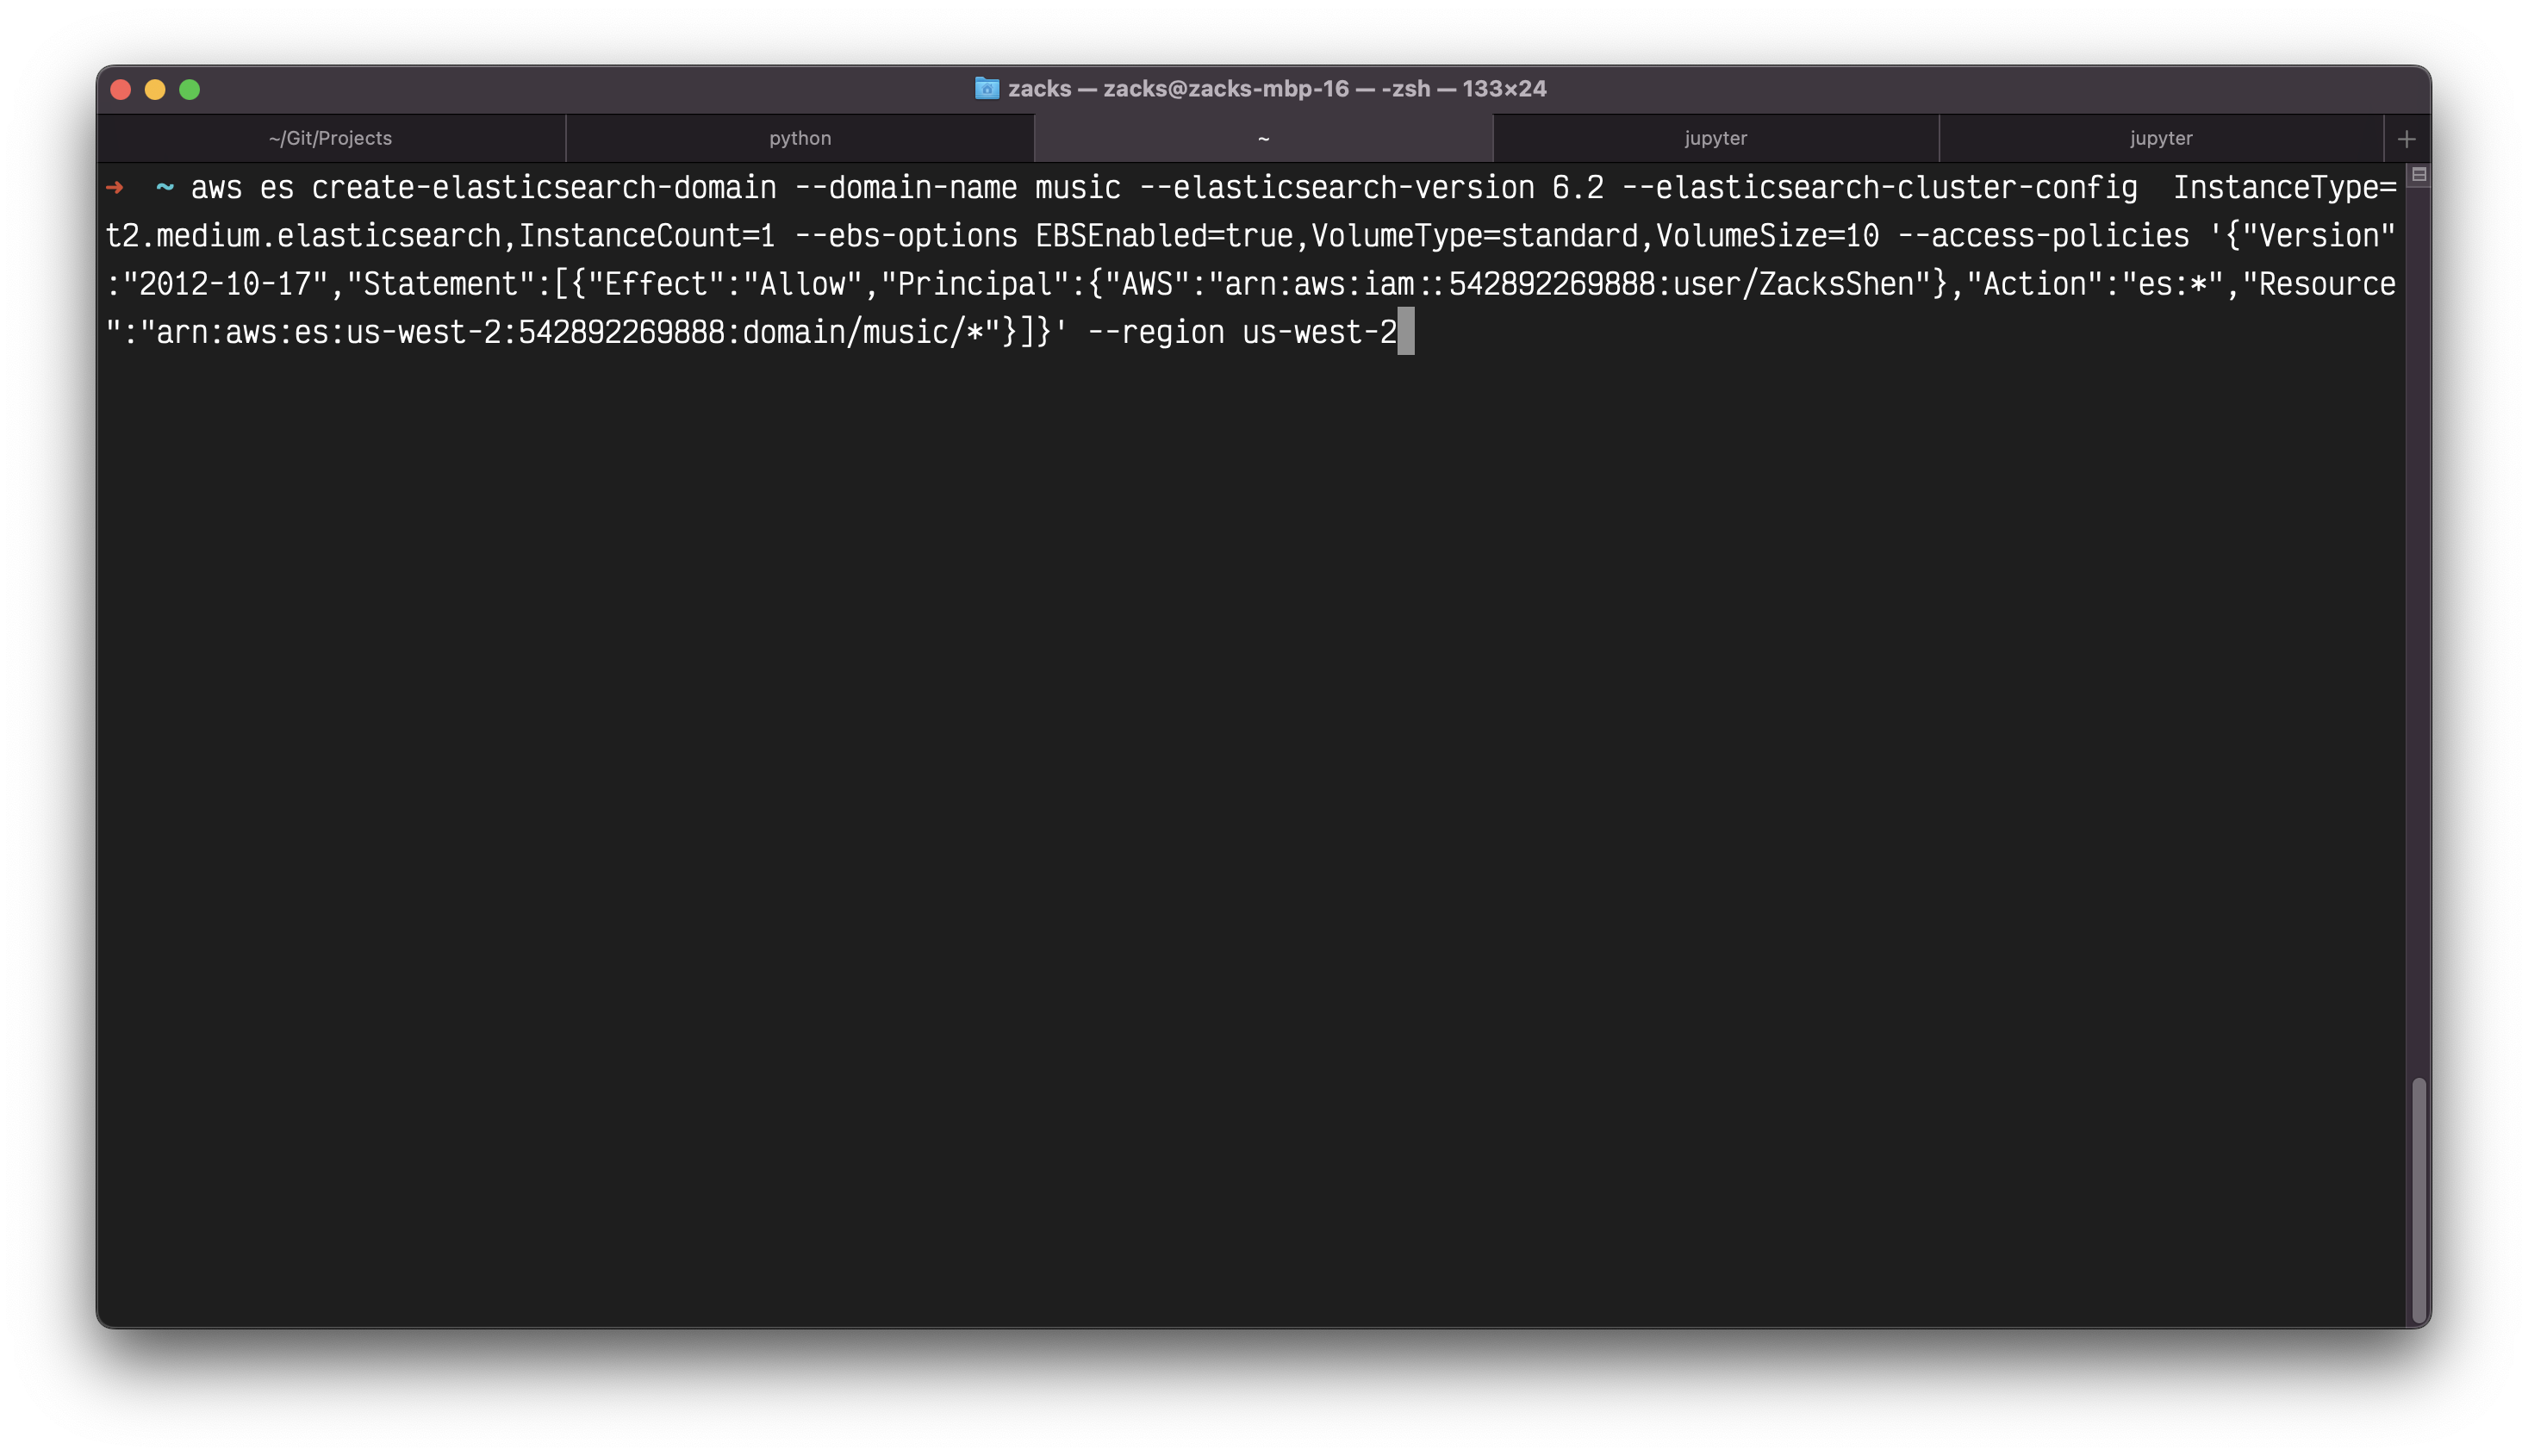
Use AWS Command Line to create OpenSearch cluster.
Replace the the following AWS CLI parameters to your:
--domain-name* 2- AWS Account ID & AWS User * 2
- Region * 2
- elasticsearch version:
6.8is the latest version on 2022-07-21, you can also upgrade it on AWS console after the installation.
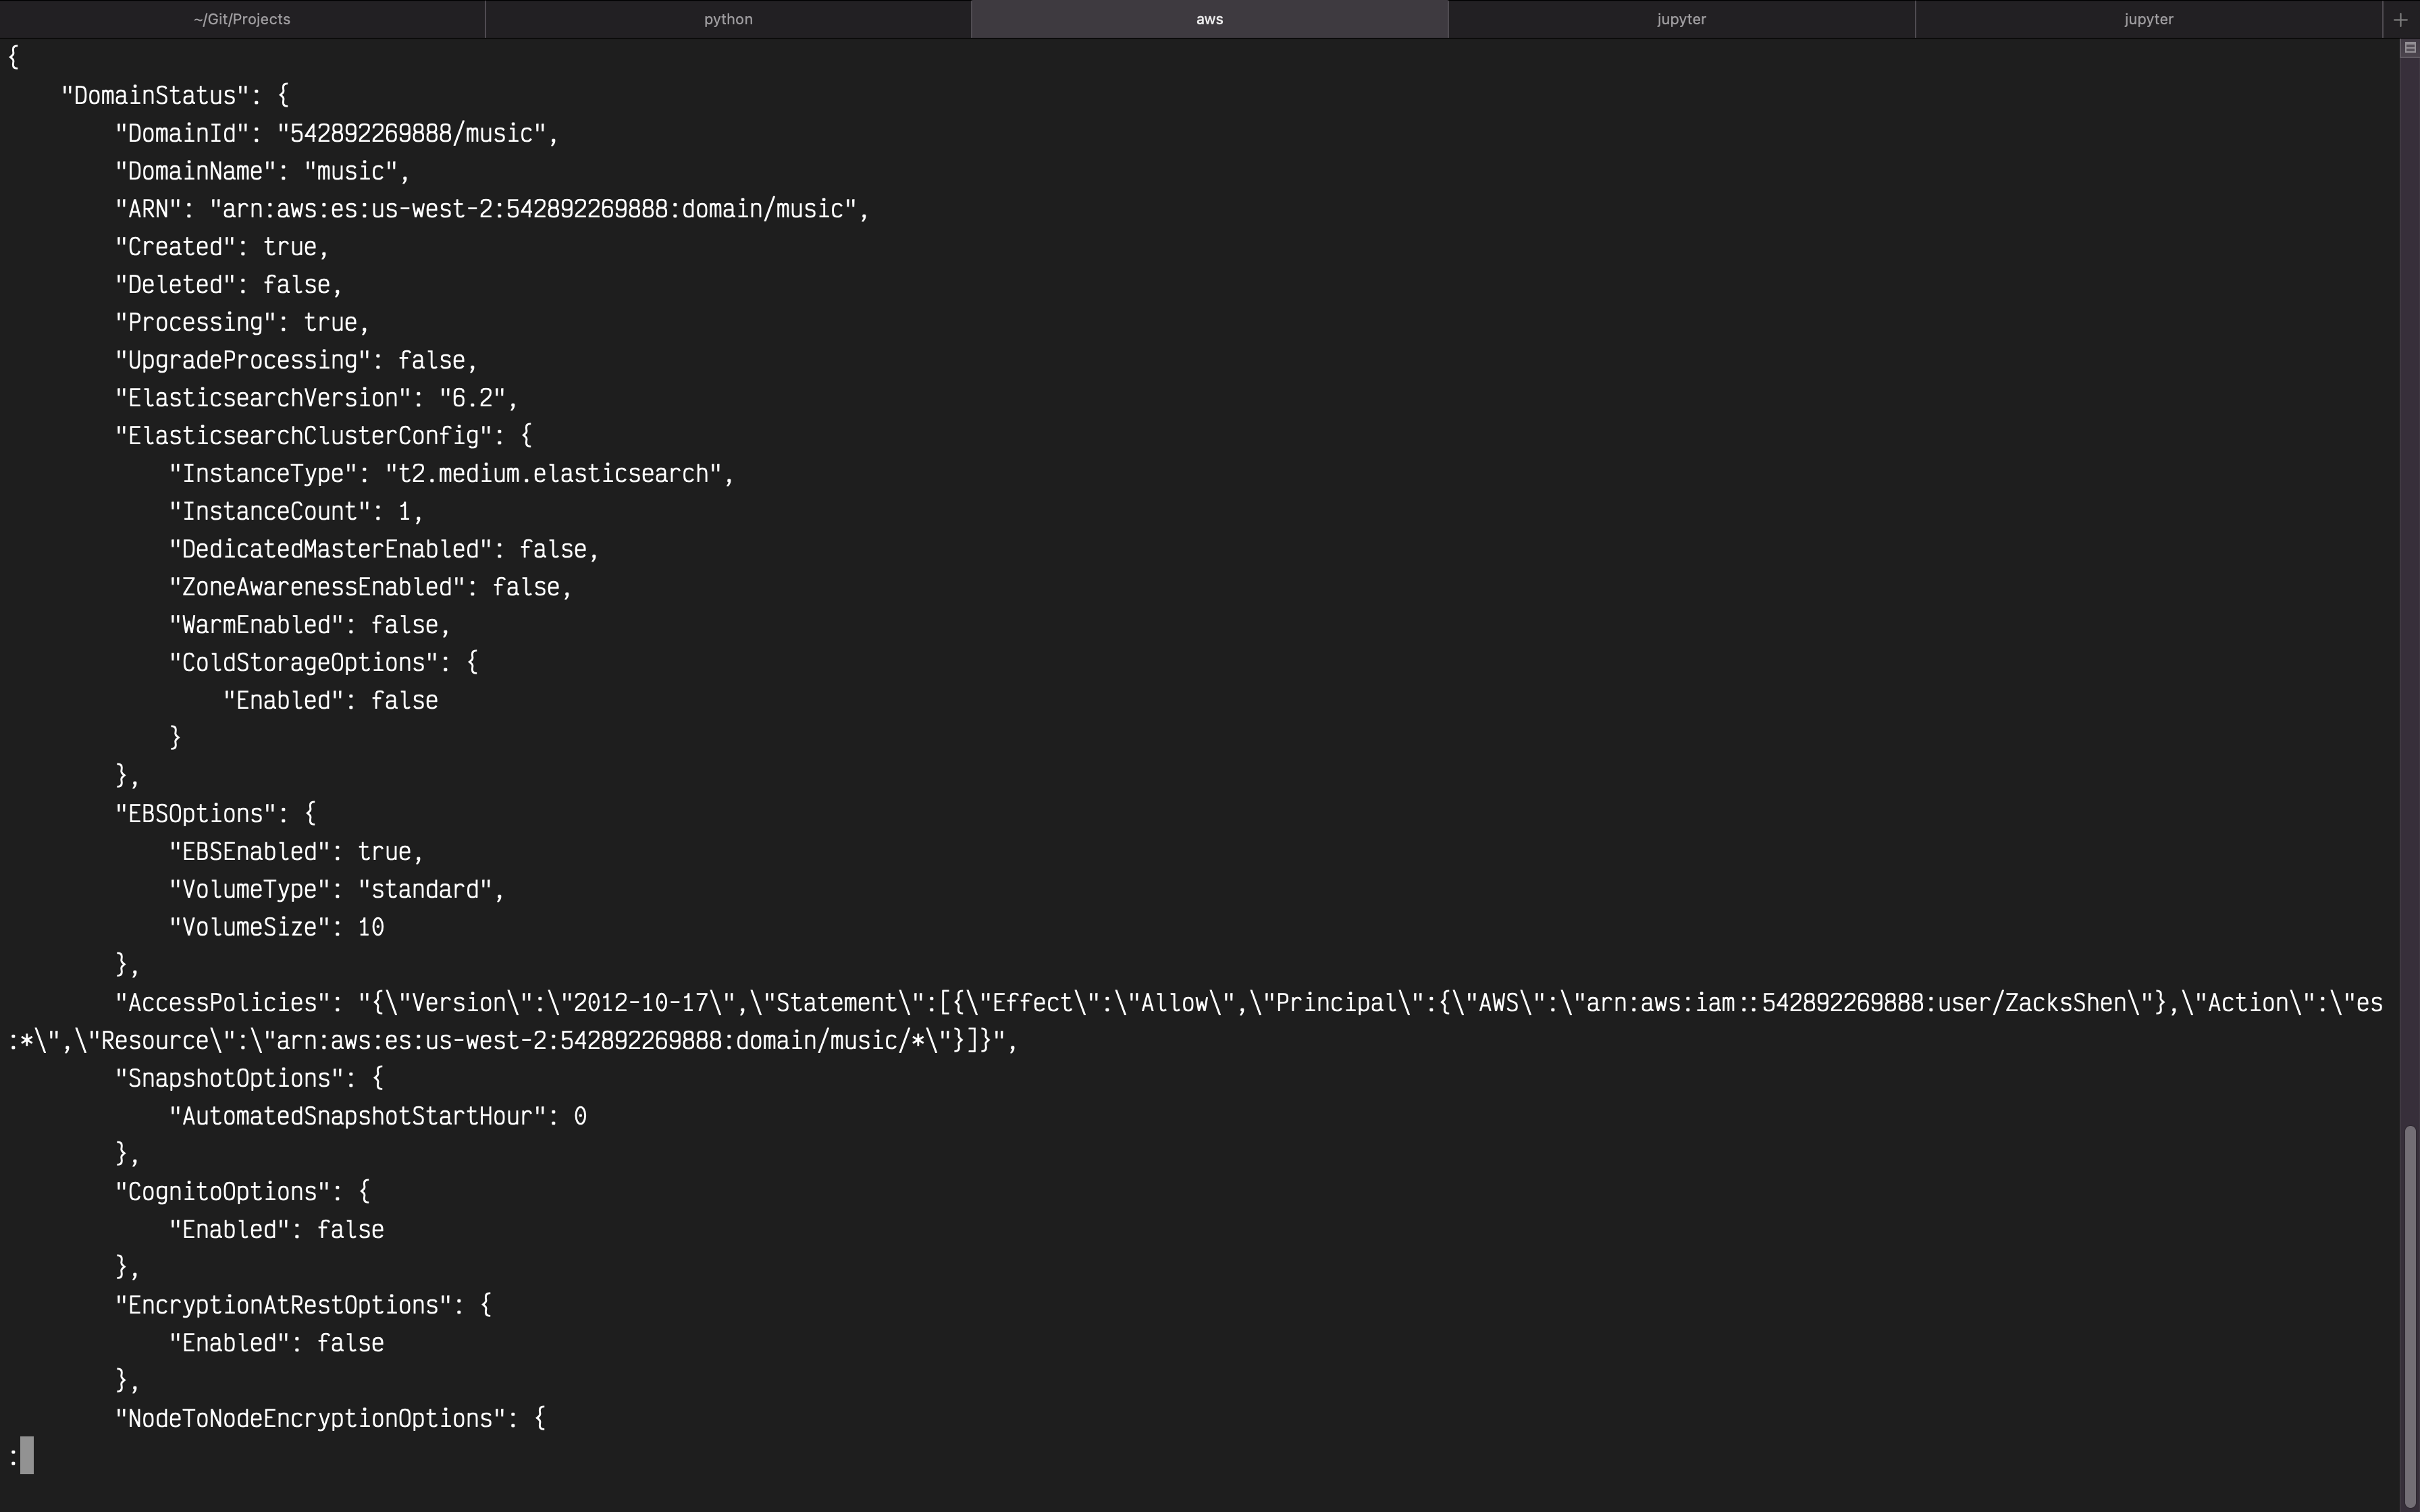
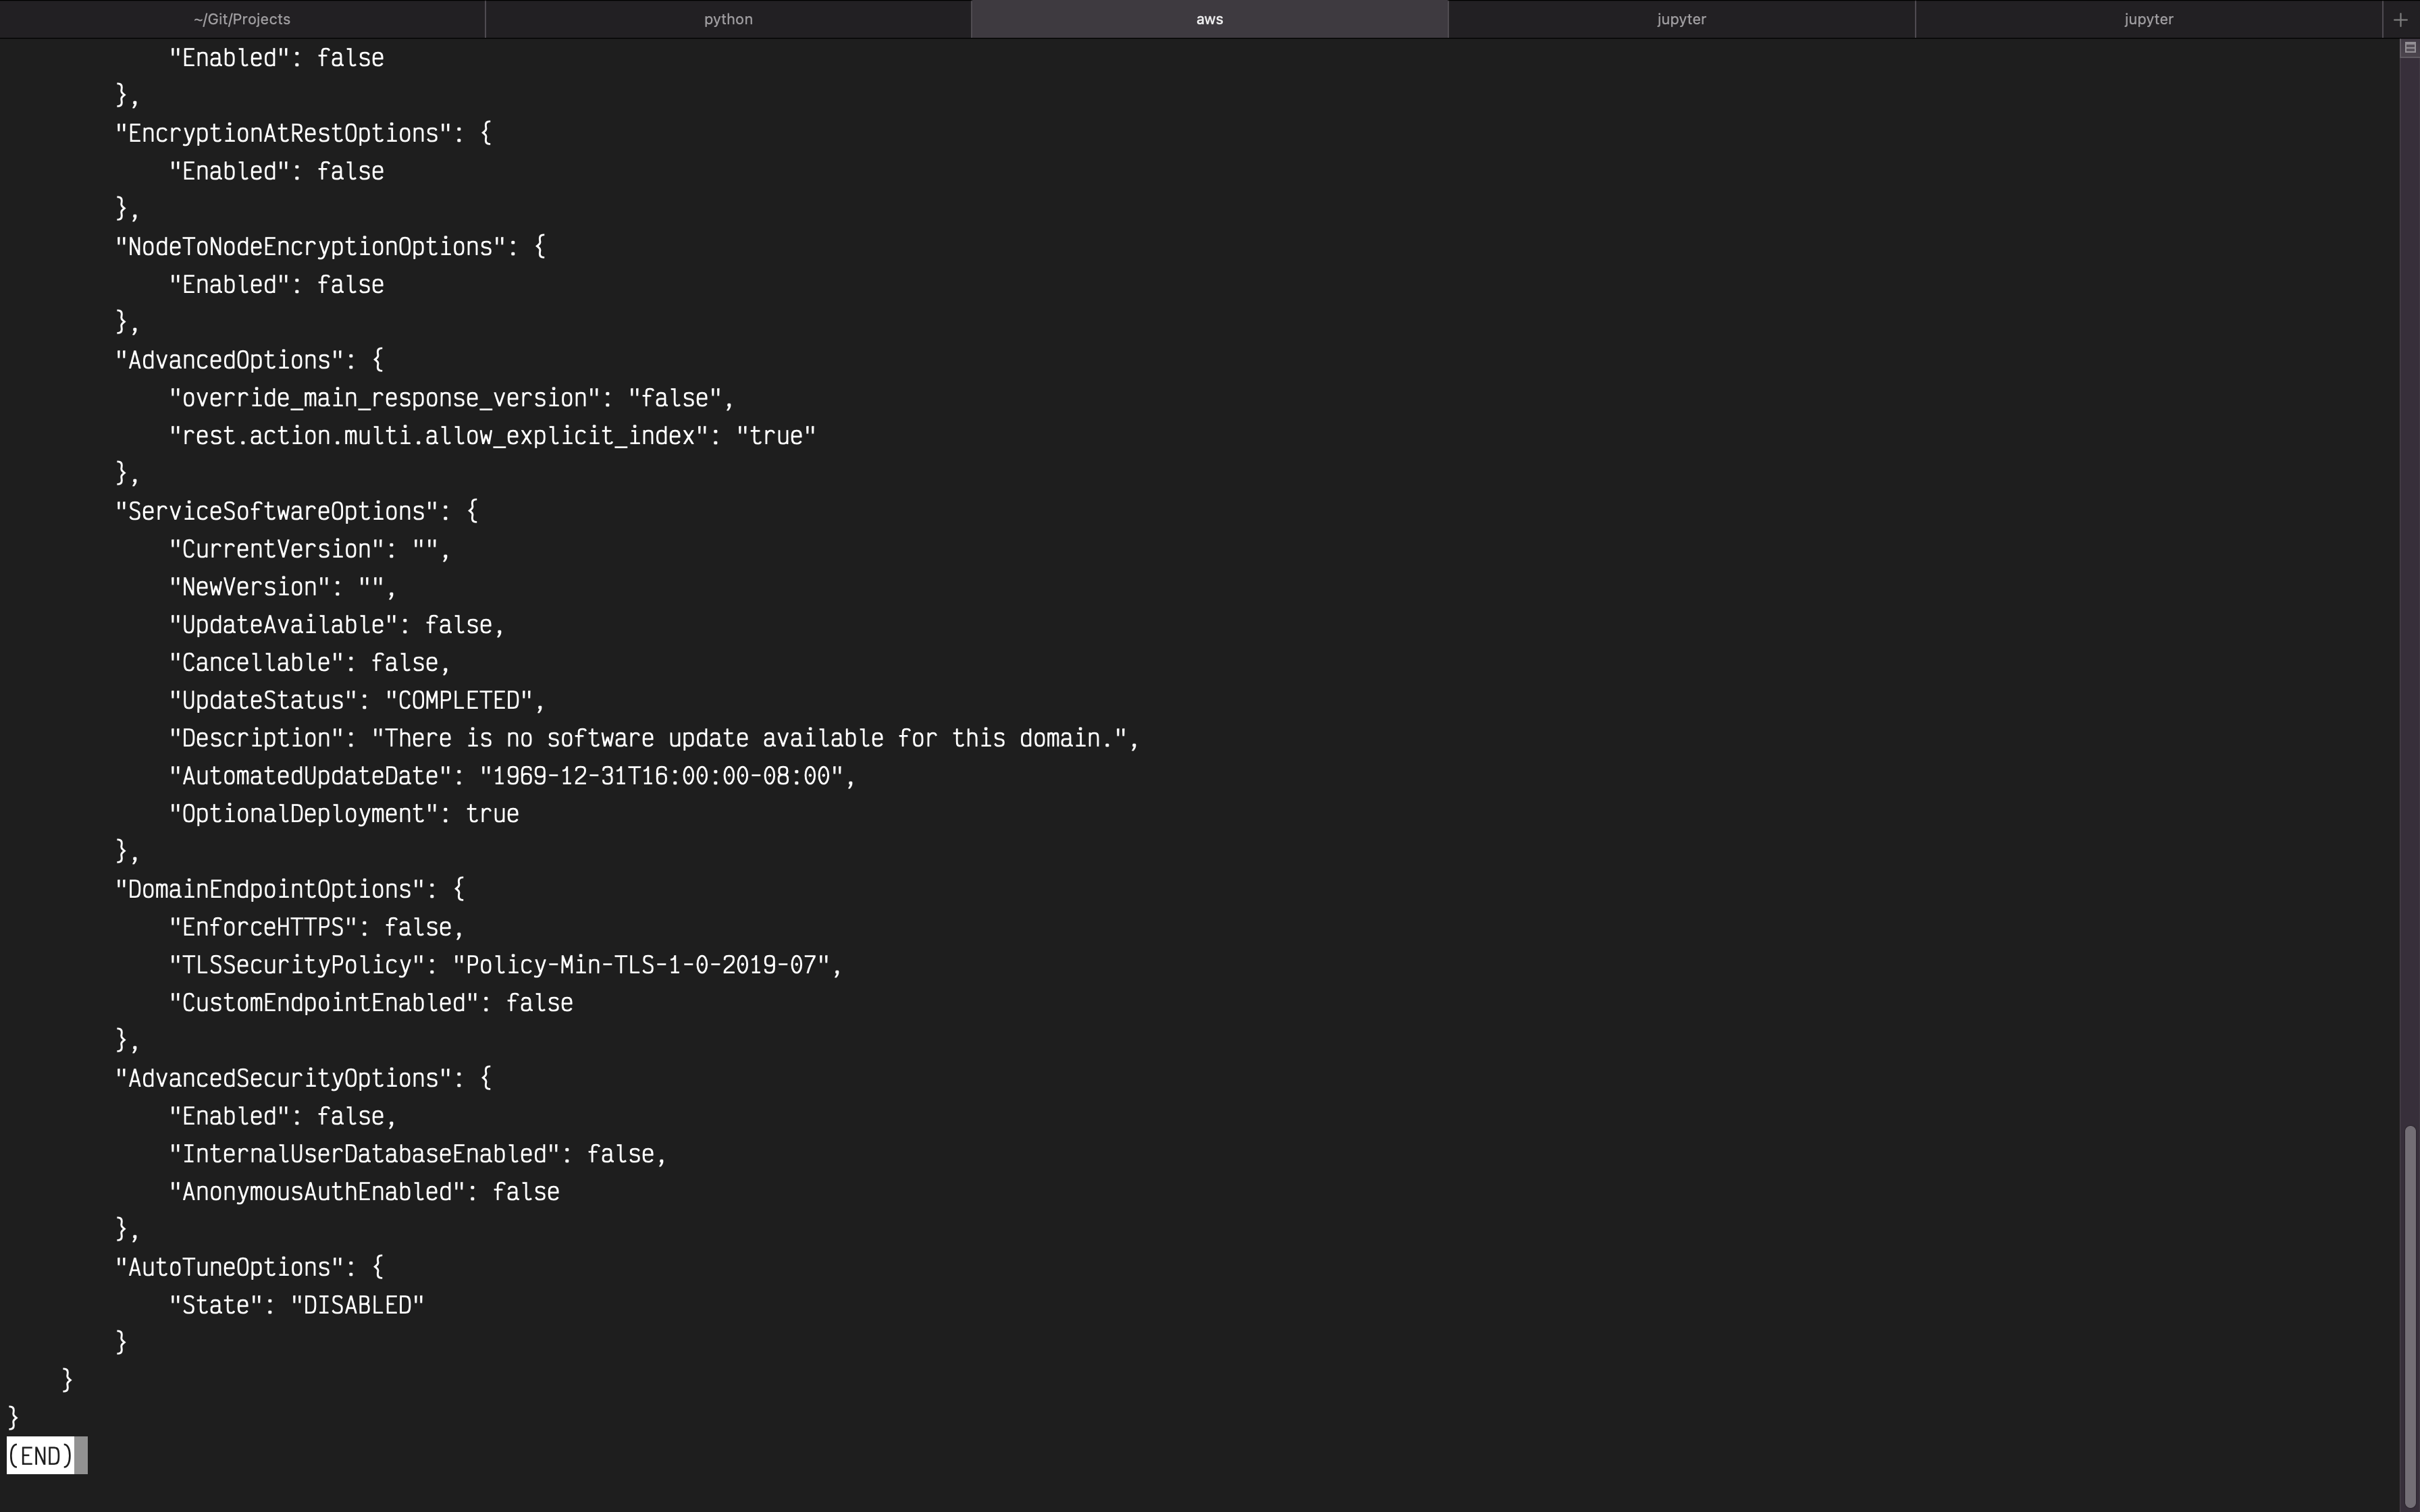
1 | aws es create-elasticsearch-domain --domain-name music --elasticsearch-version 6.8 --elasticsearch-cluster-config InstanceType=t3.medium.elasticsearch,InstanceCount=1 --ebs-options EBSEnabled=true,VolumeType=standard,VolumeSize=10 --access-policies '{"Version":"2012-10-17","Statement":[{"Effect":"Allow","Principal":{"AWS":"arn:aws:iam::542892269888:user/ZacksShen"},"Action":"es:*","Resource":"arn:aws:es:us-west-2:542892269888:domain/music/*"}]}' --region us-west-2 |
Press Q to quit
Services -> OpenSearch
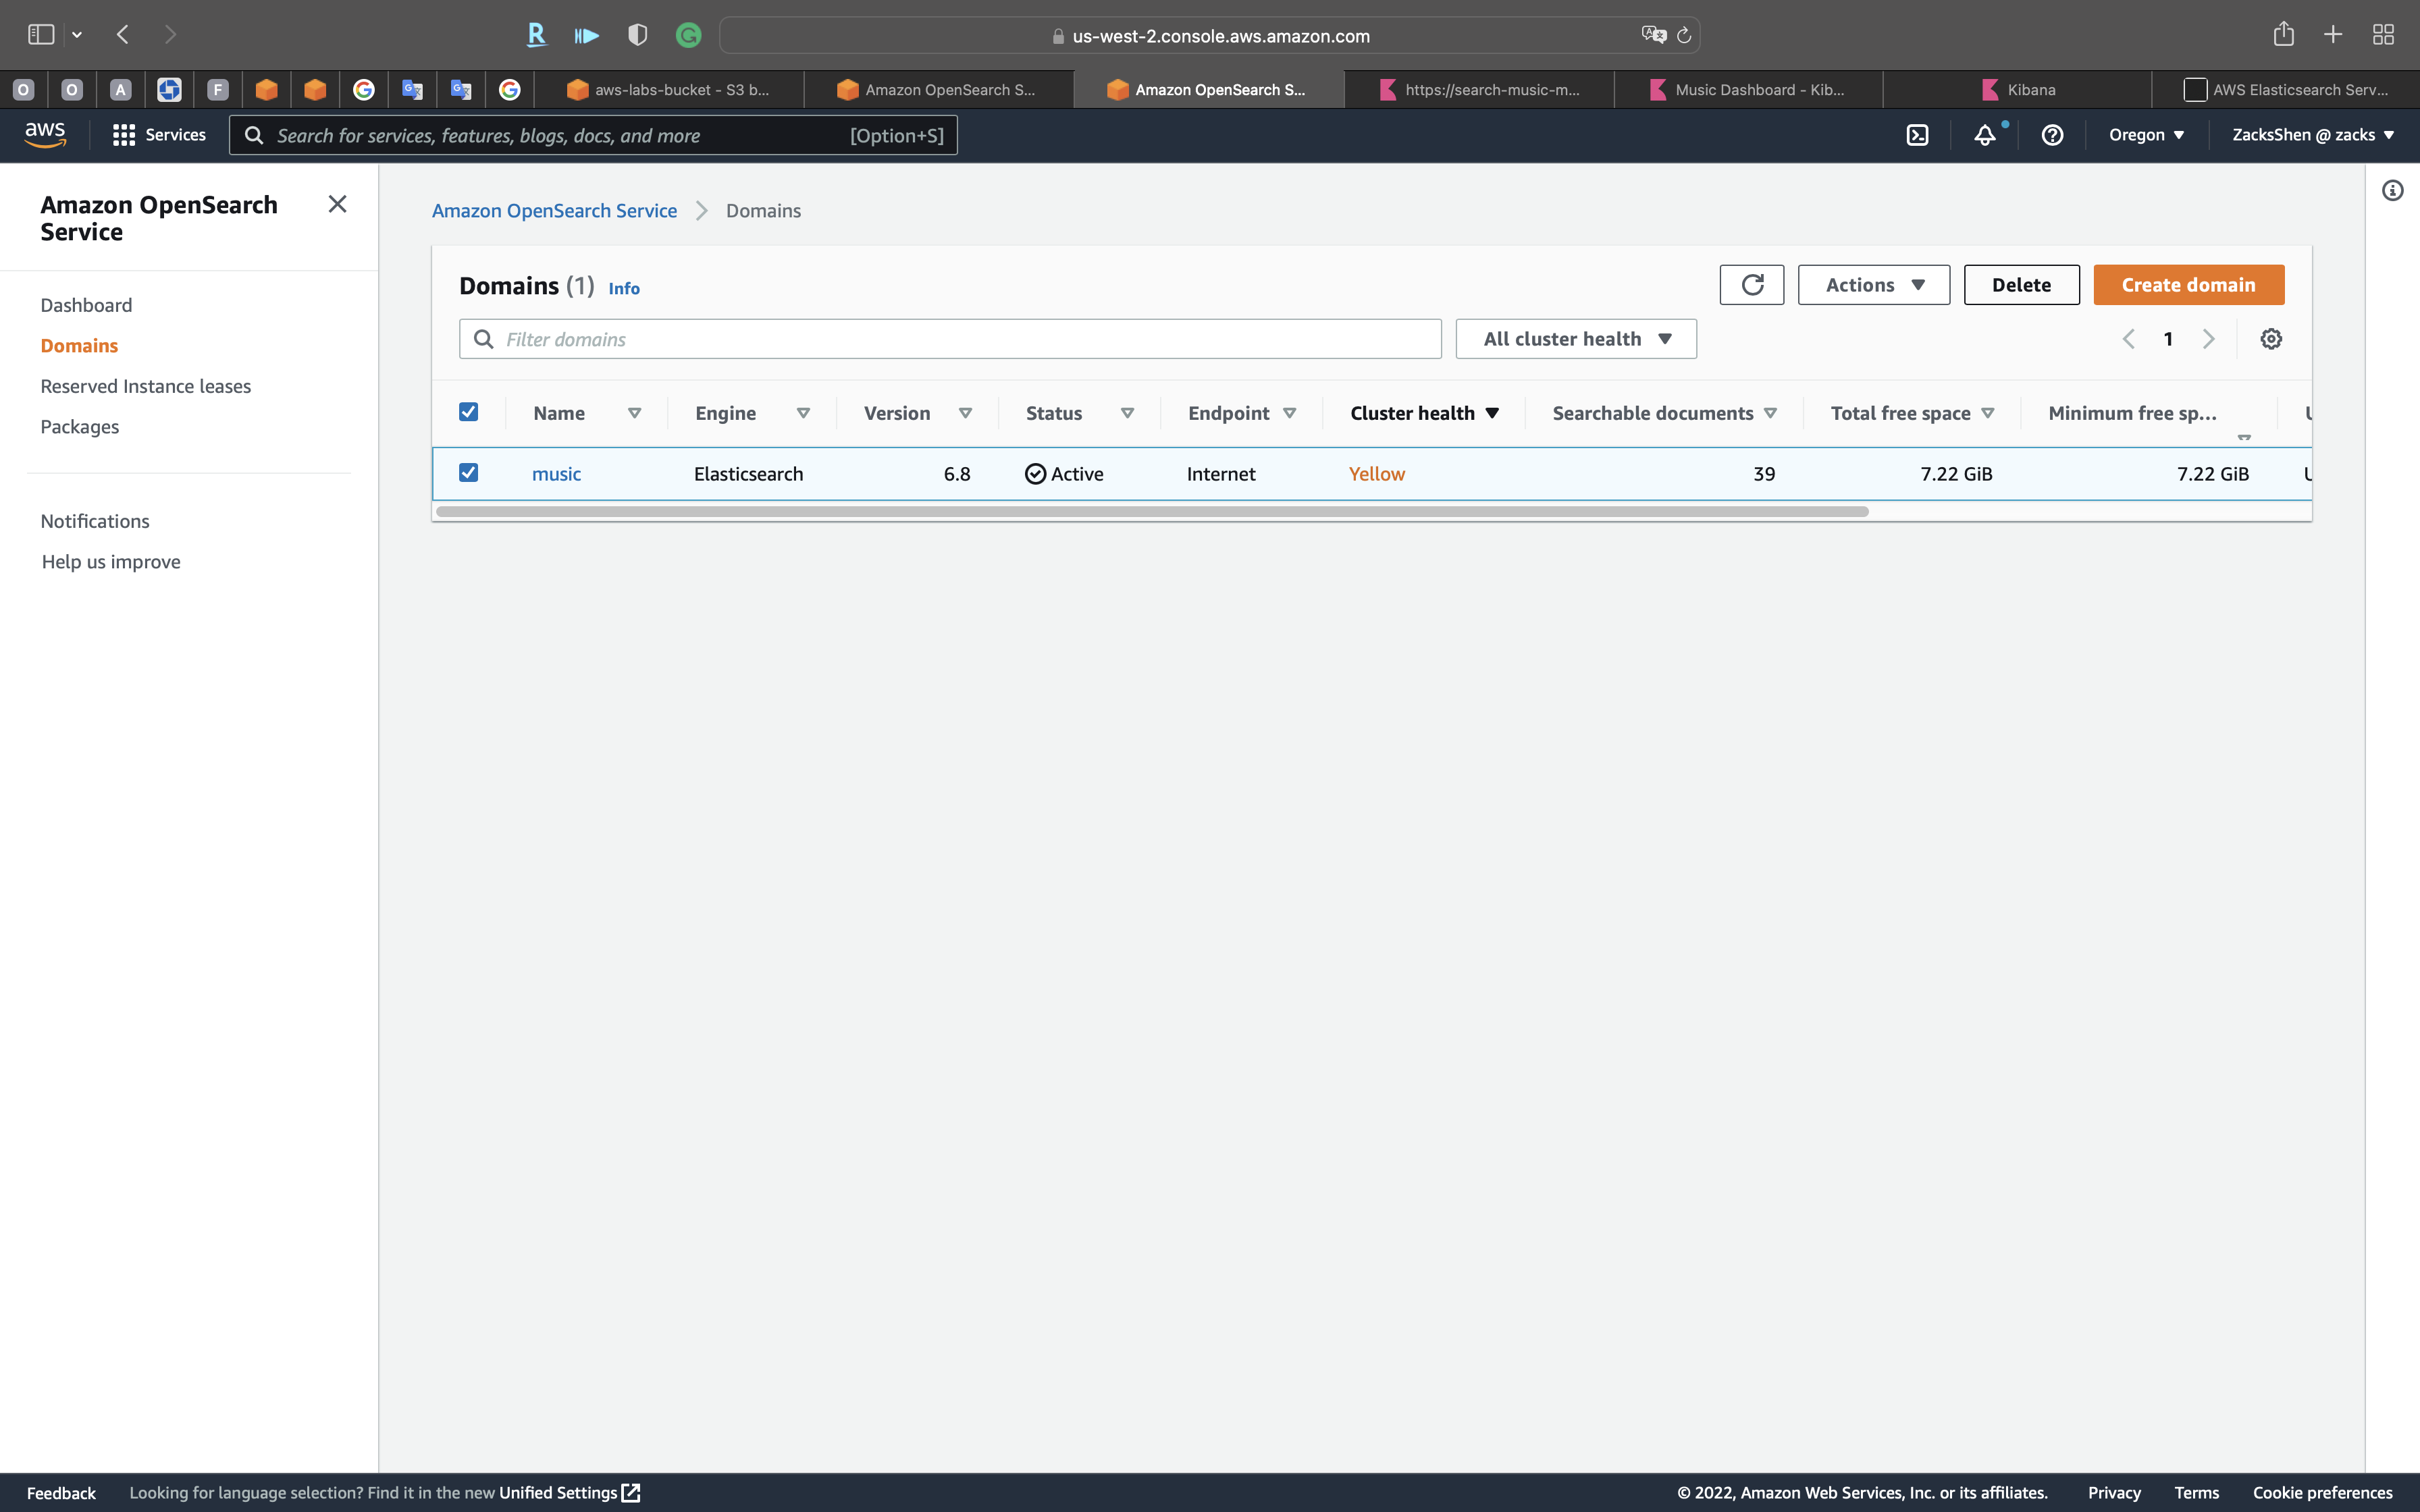
Refresh the page and you can see music is on the welcome page and the navigation panel
Click on music on the navigation panel
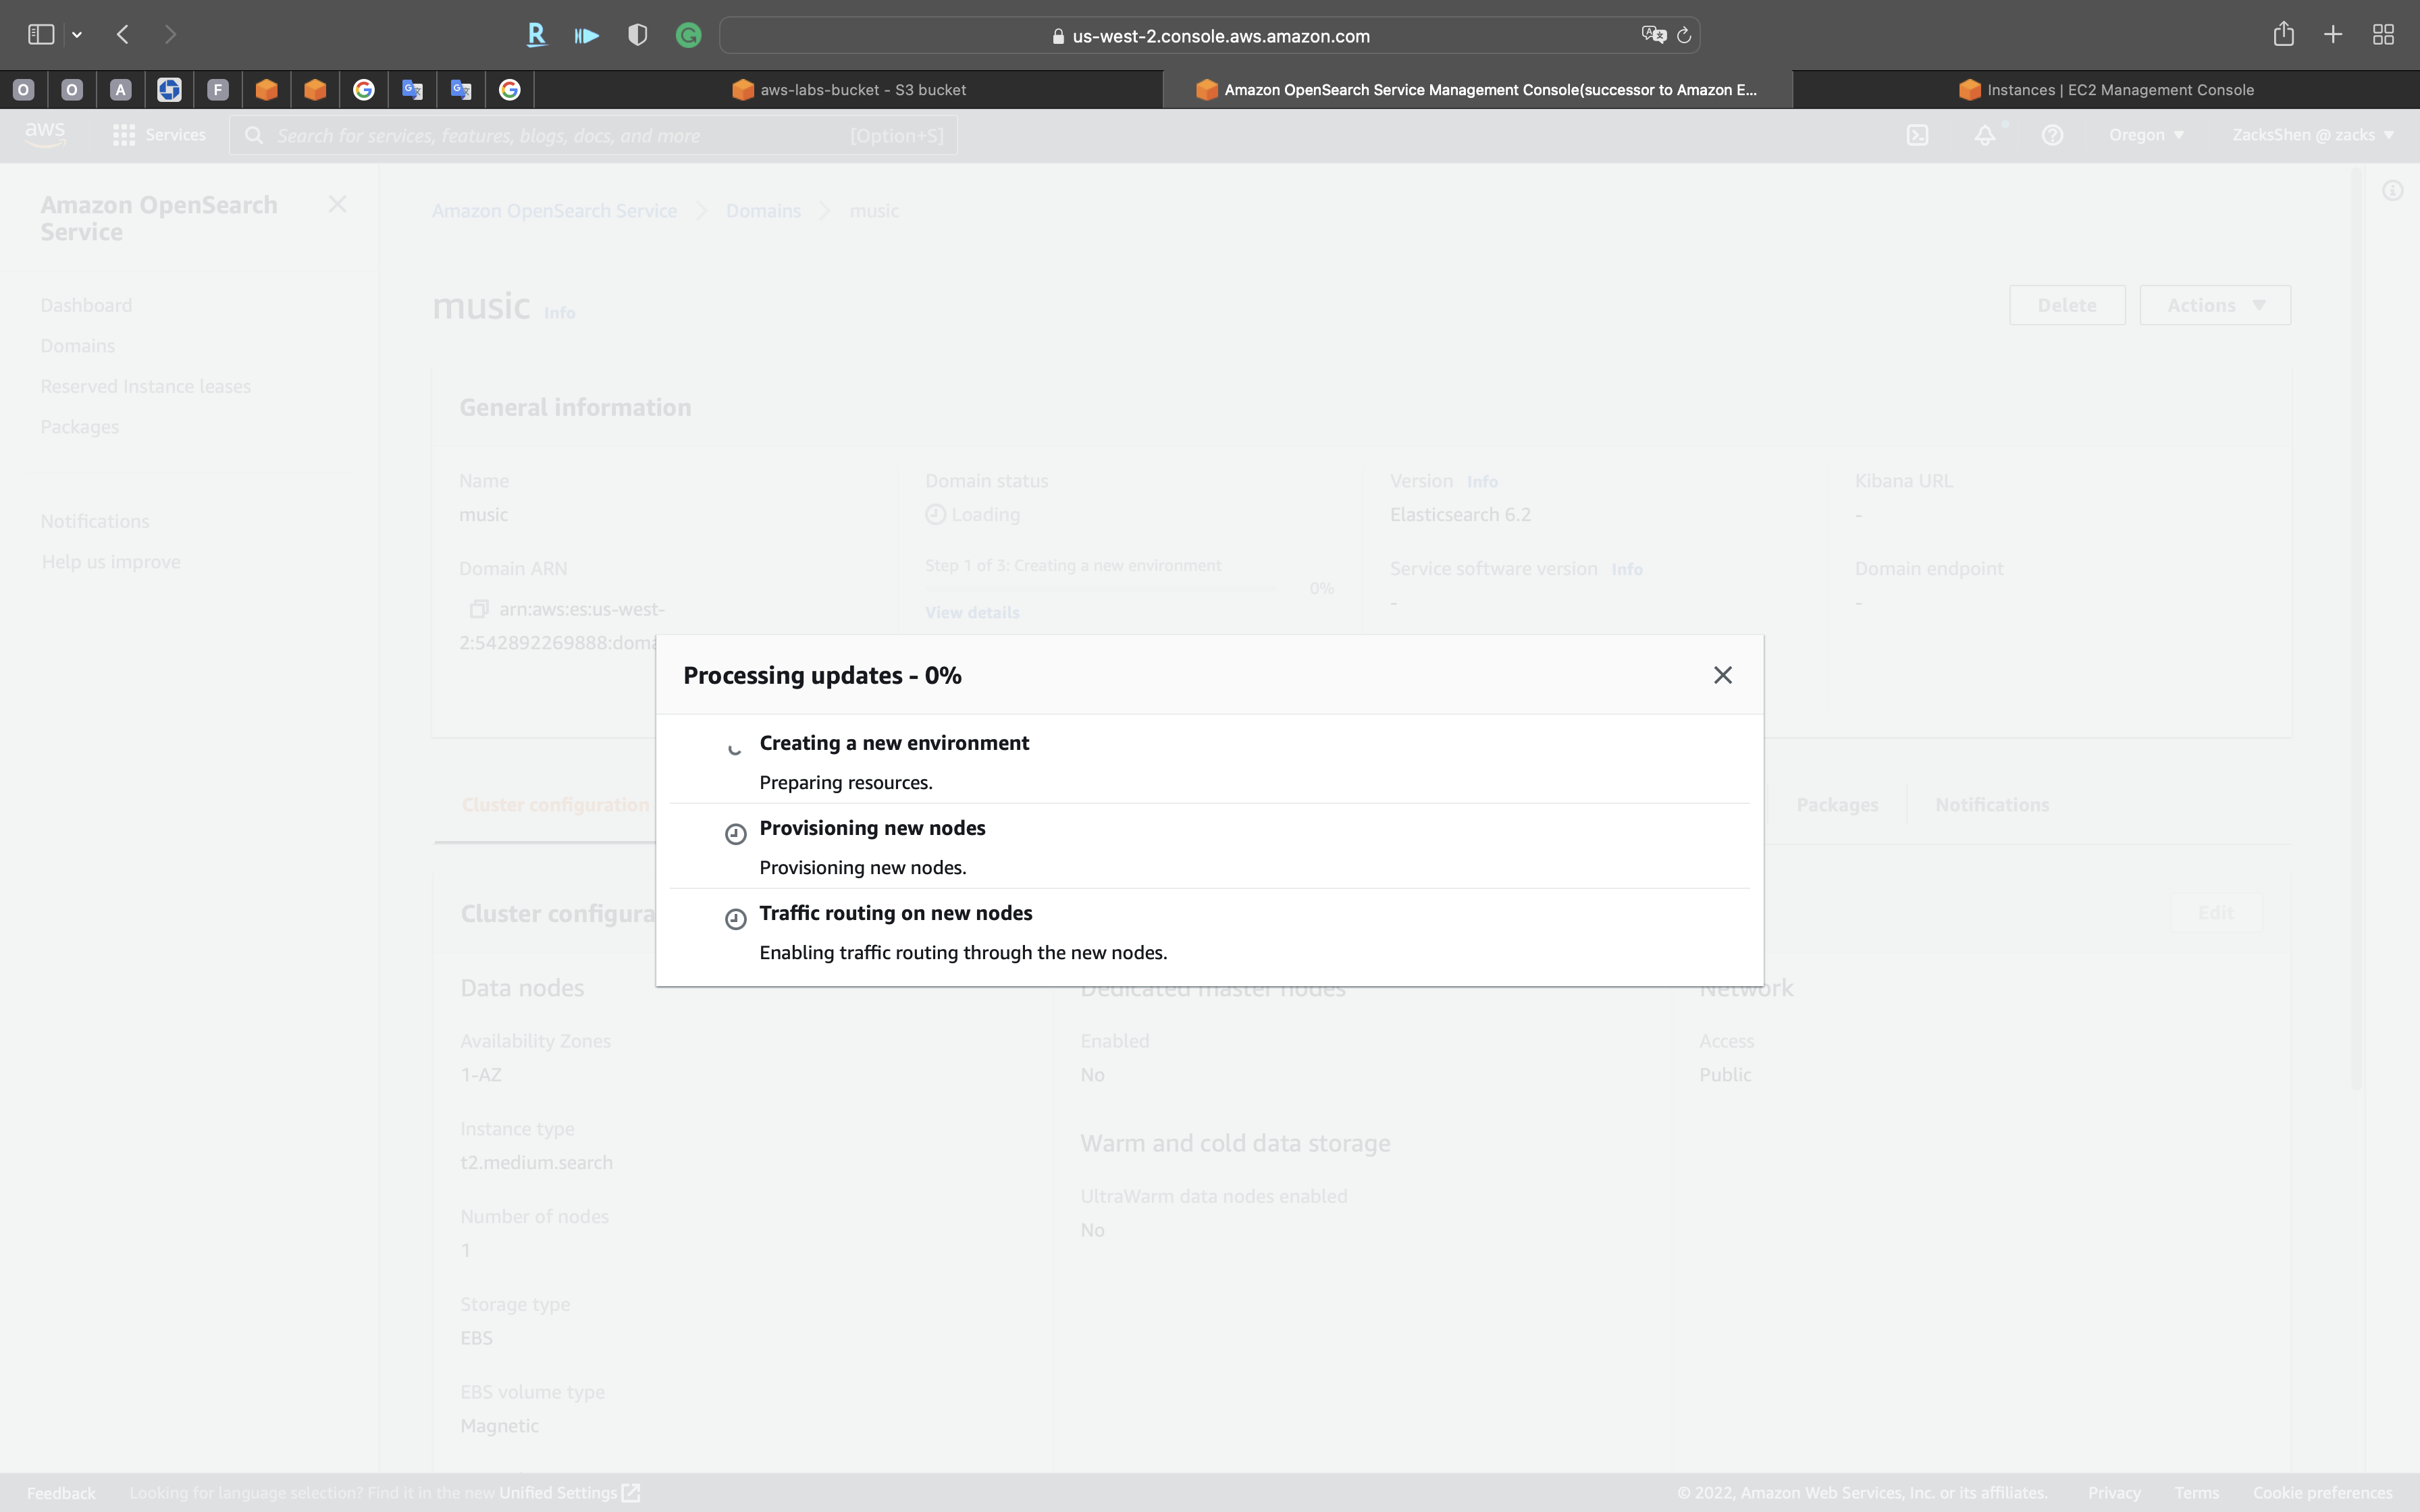
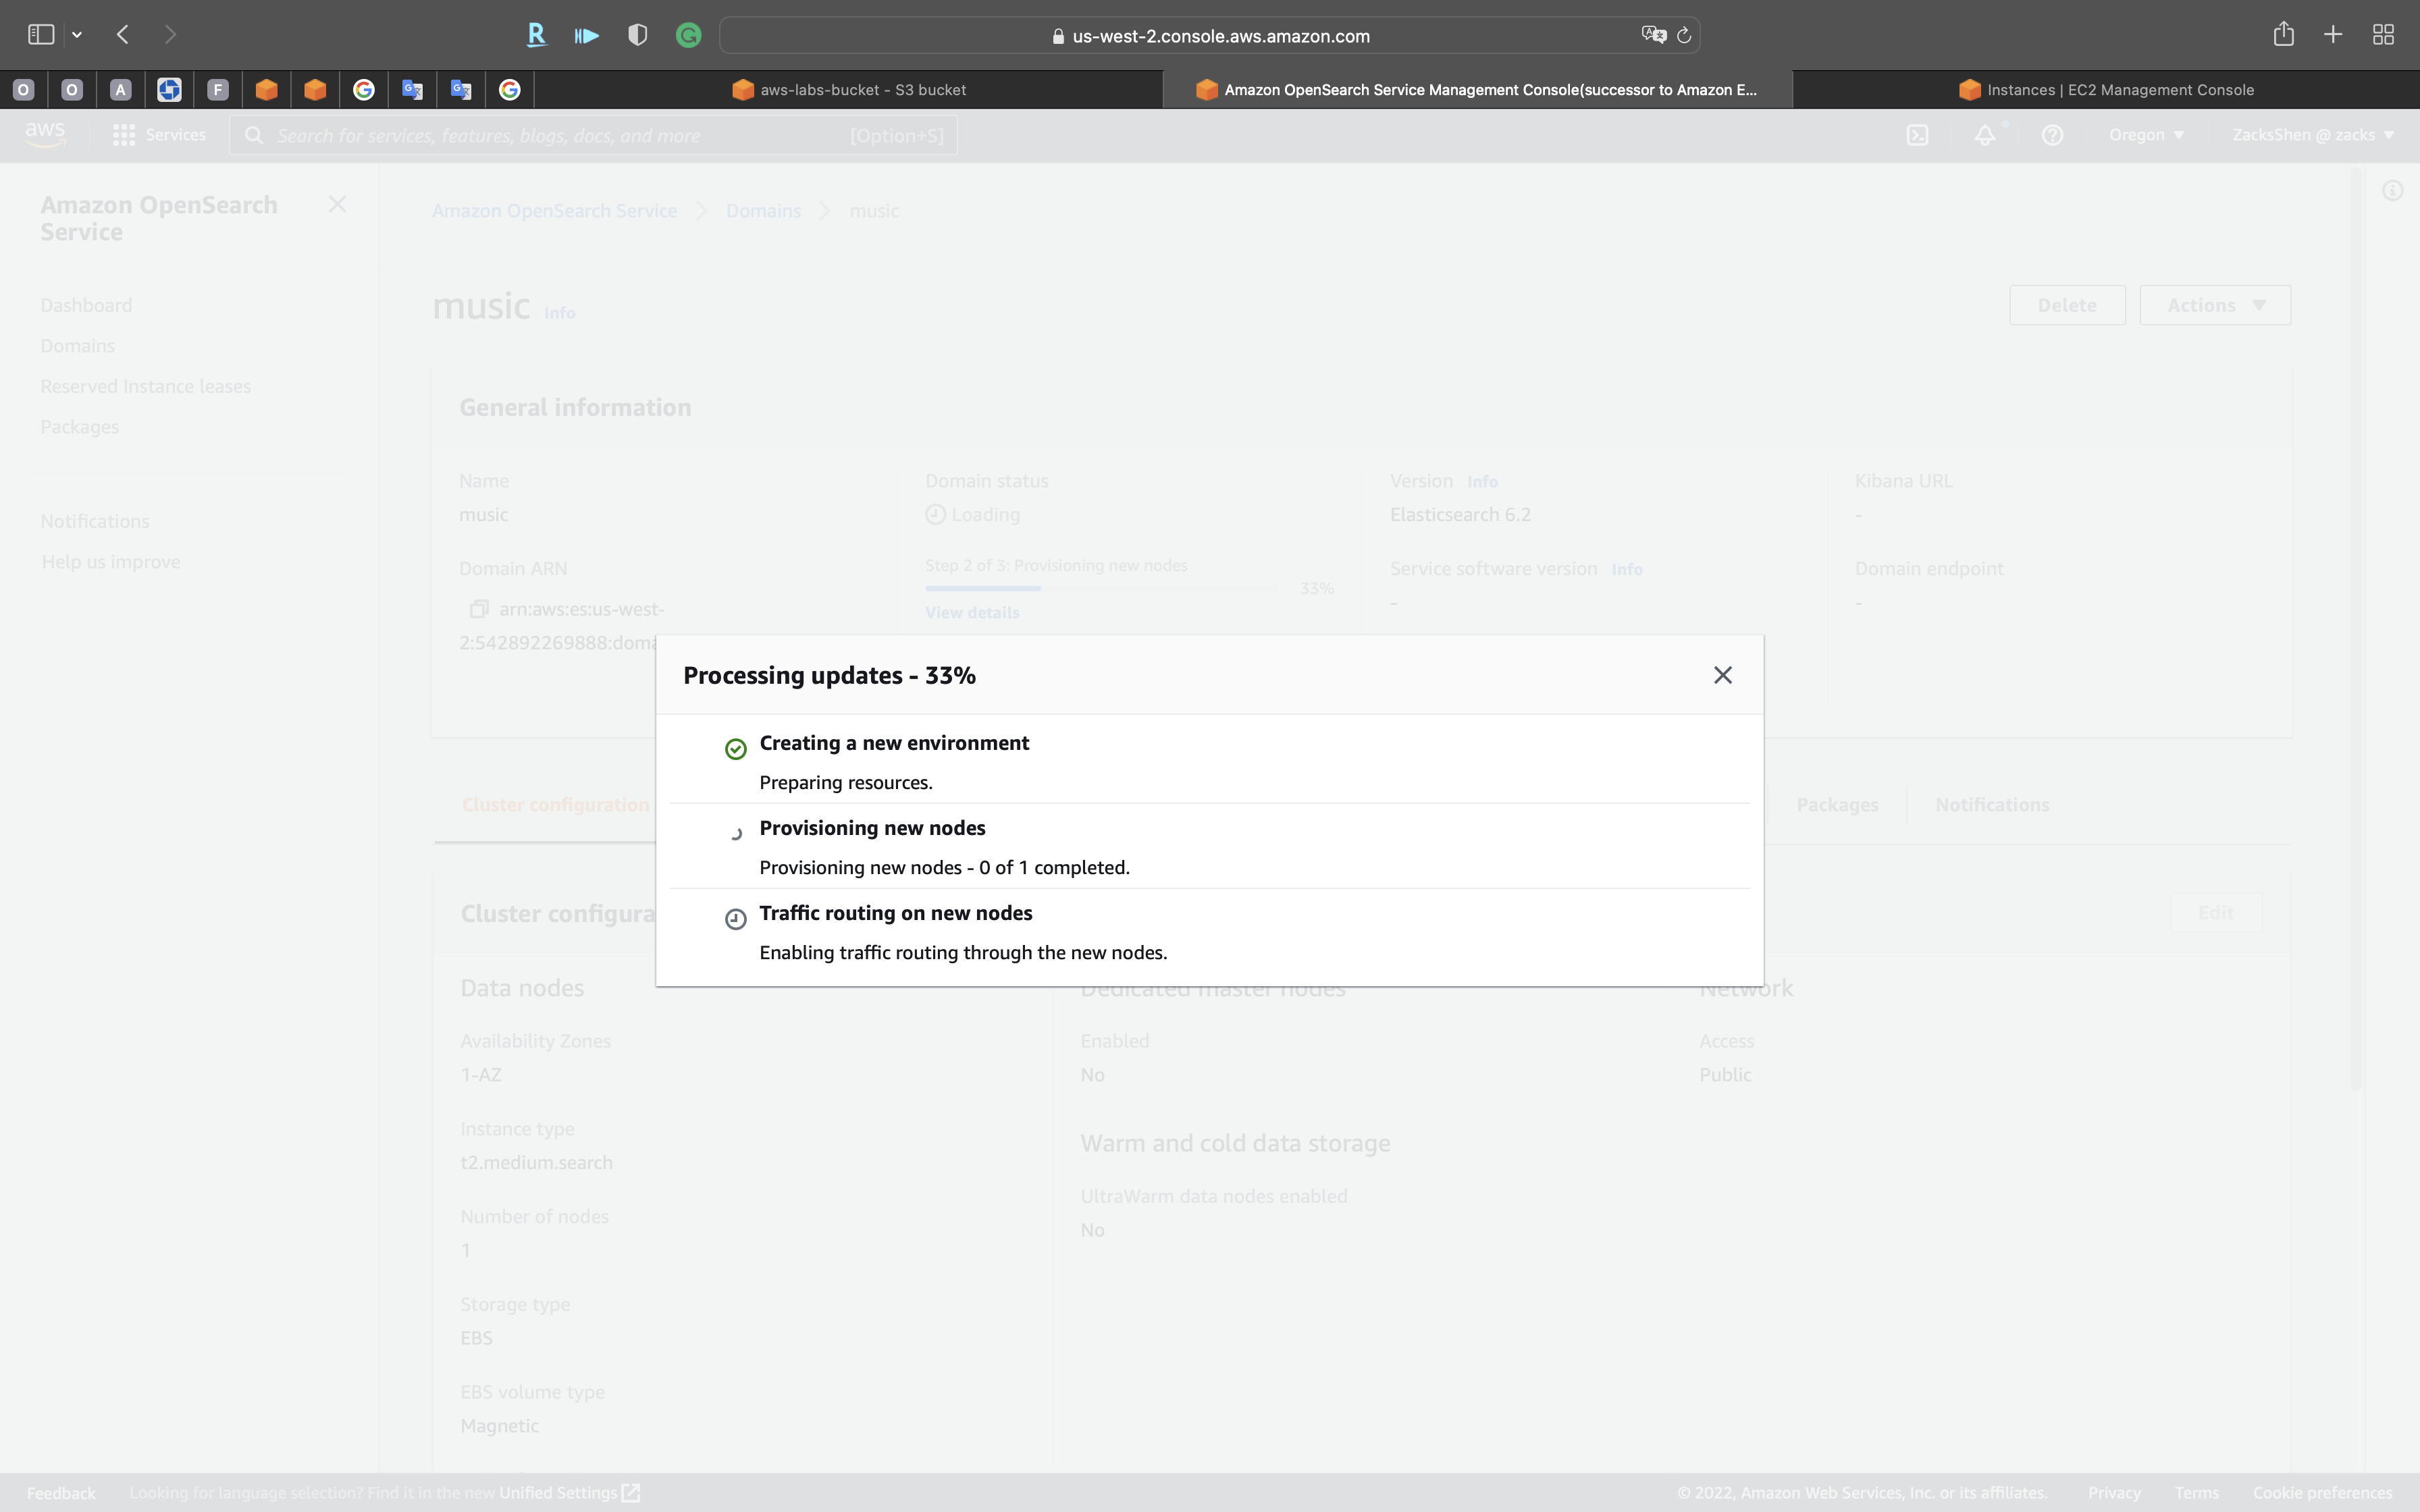
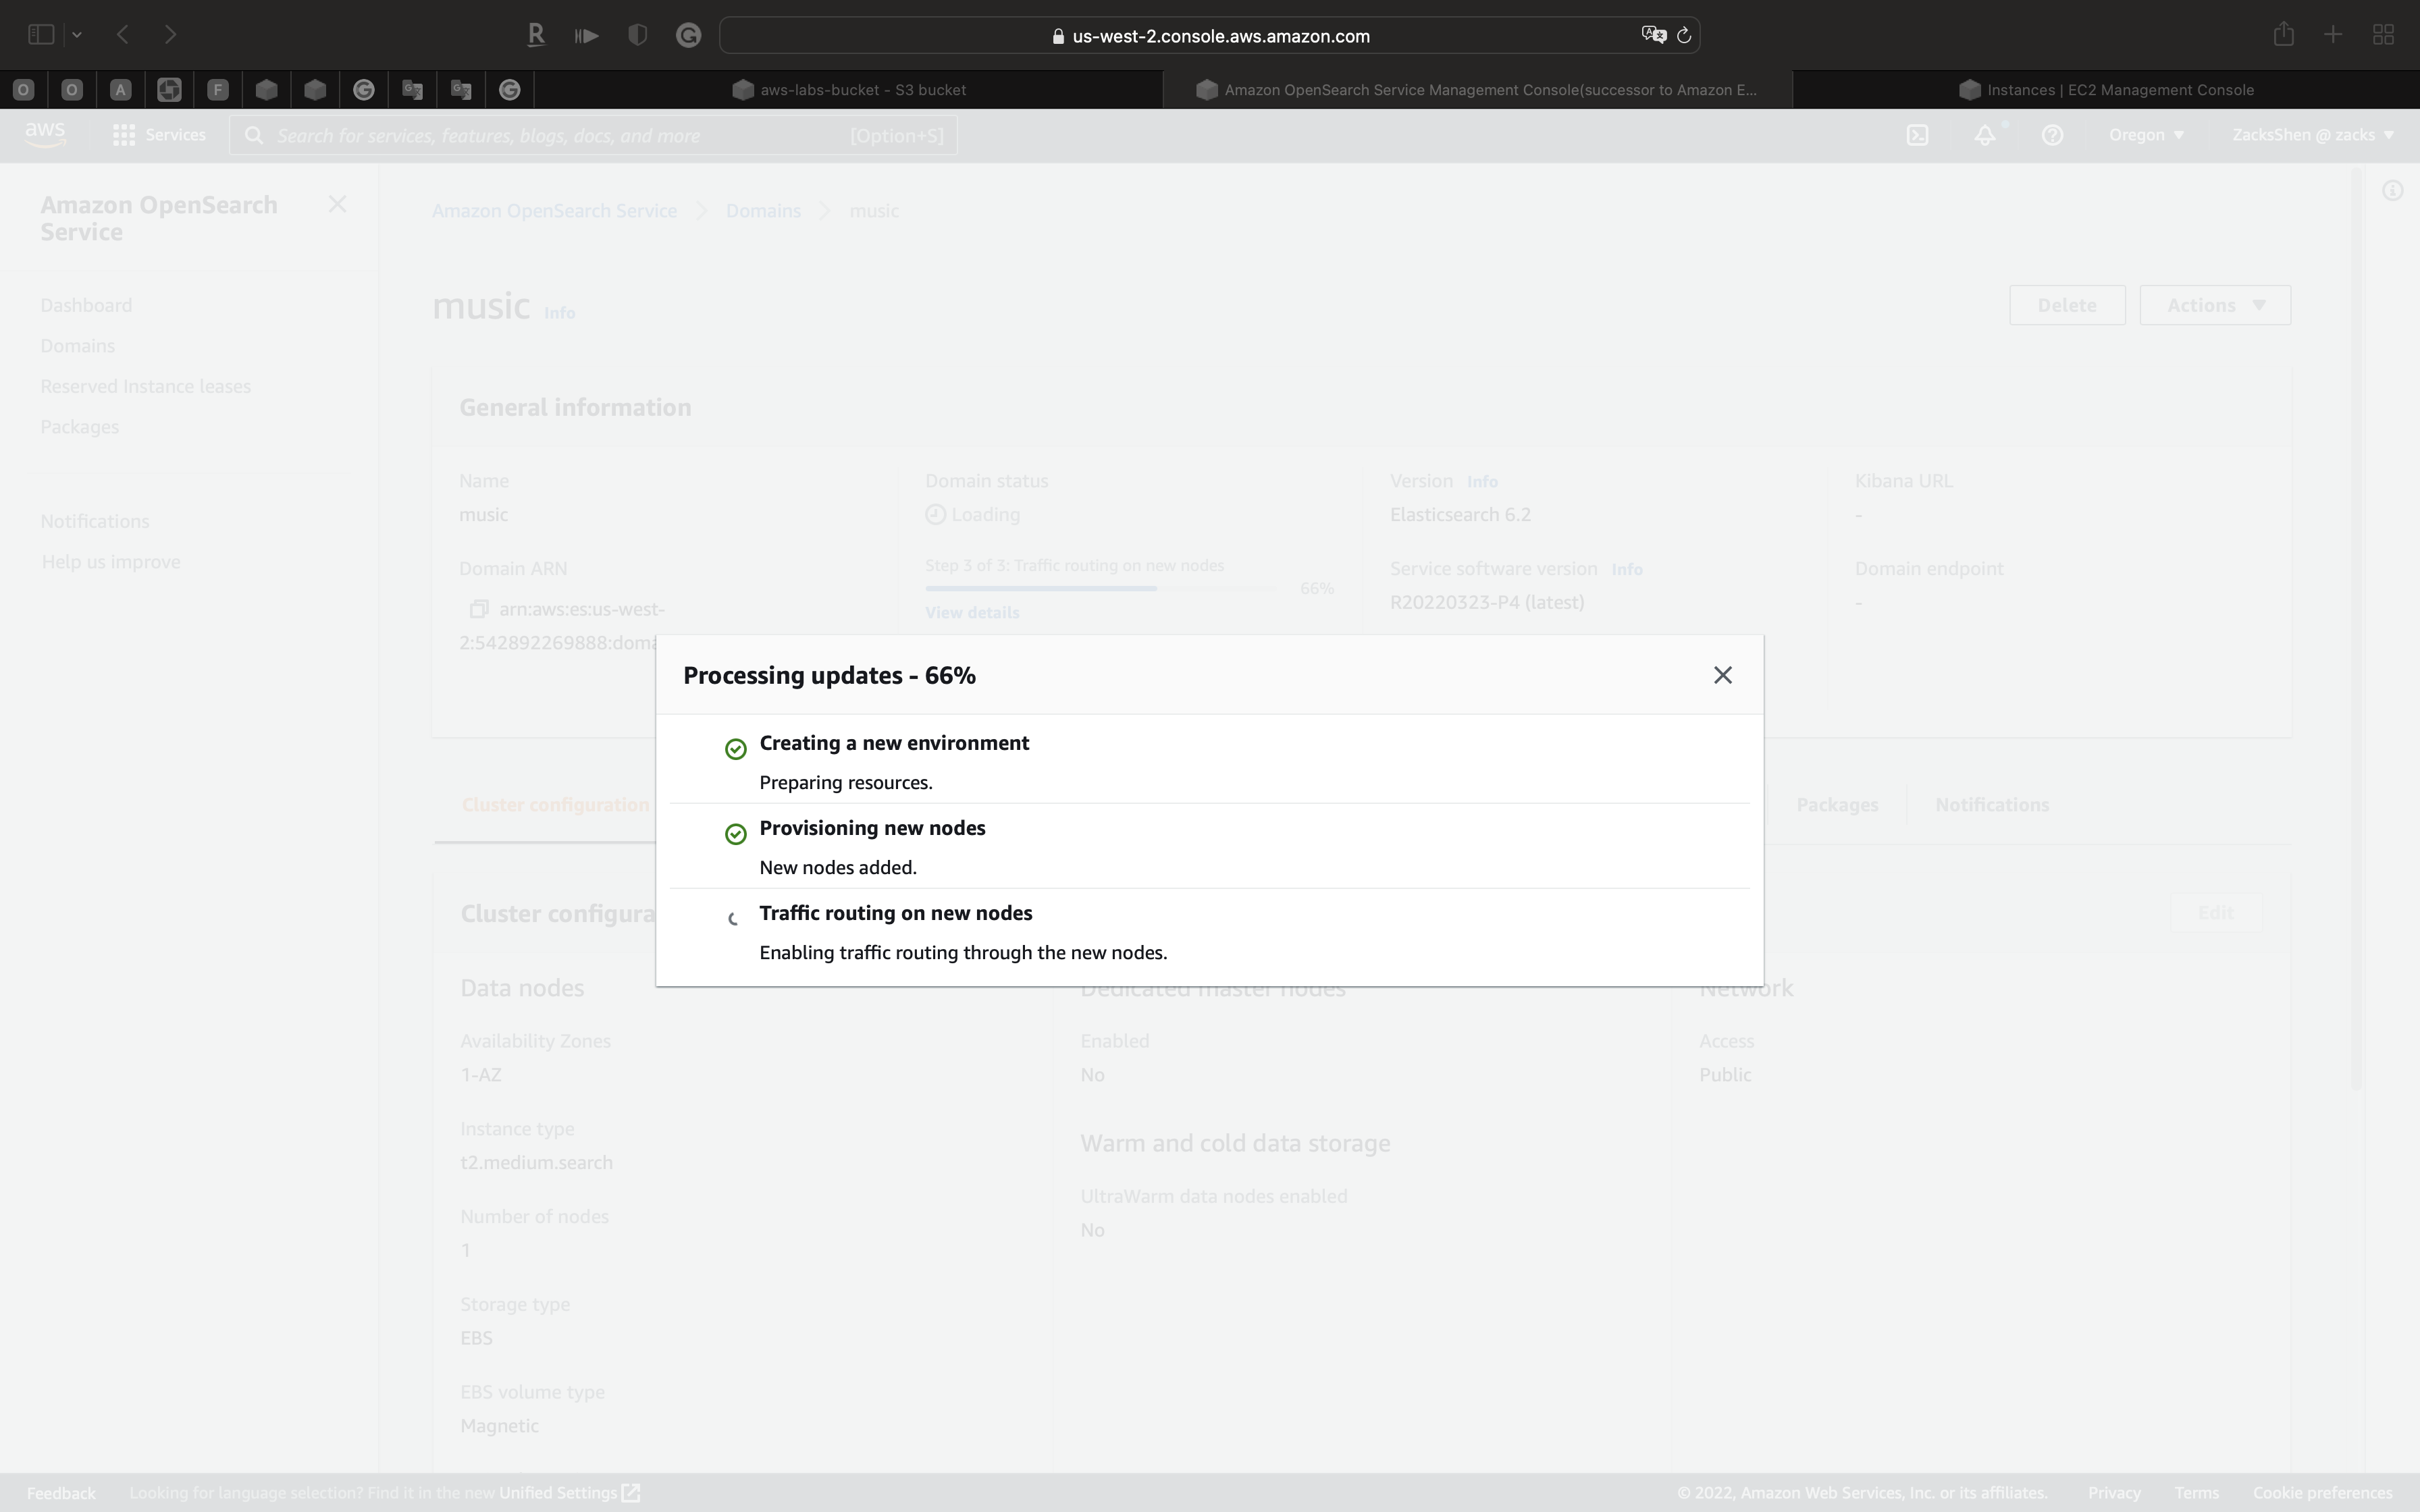
Wait until the Domain status switches from Loading to Active.
It may take around 10 minutes.
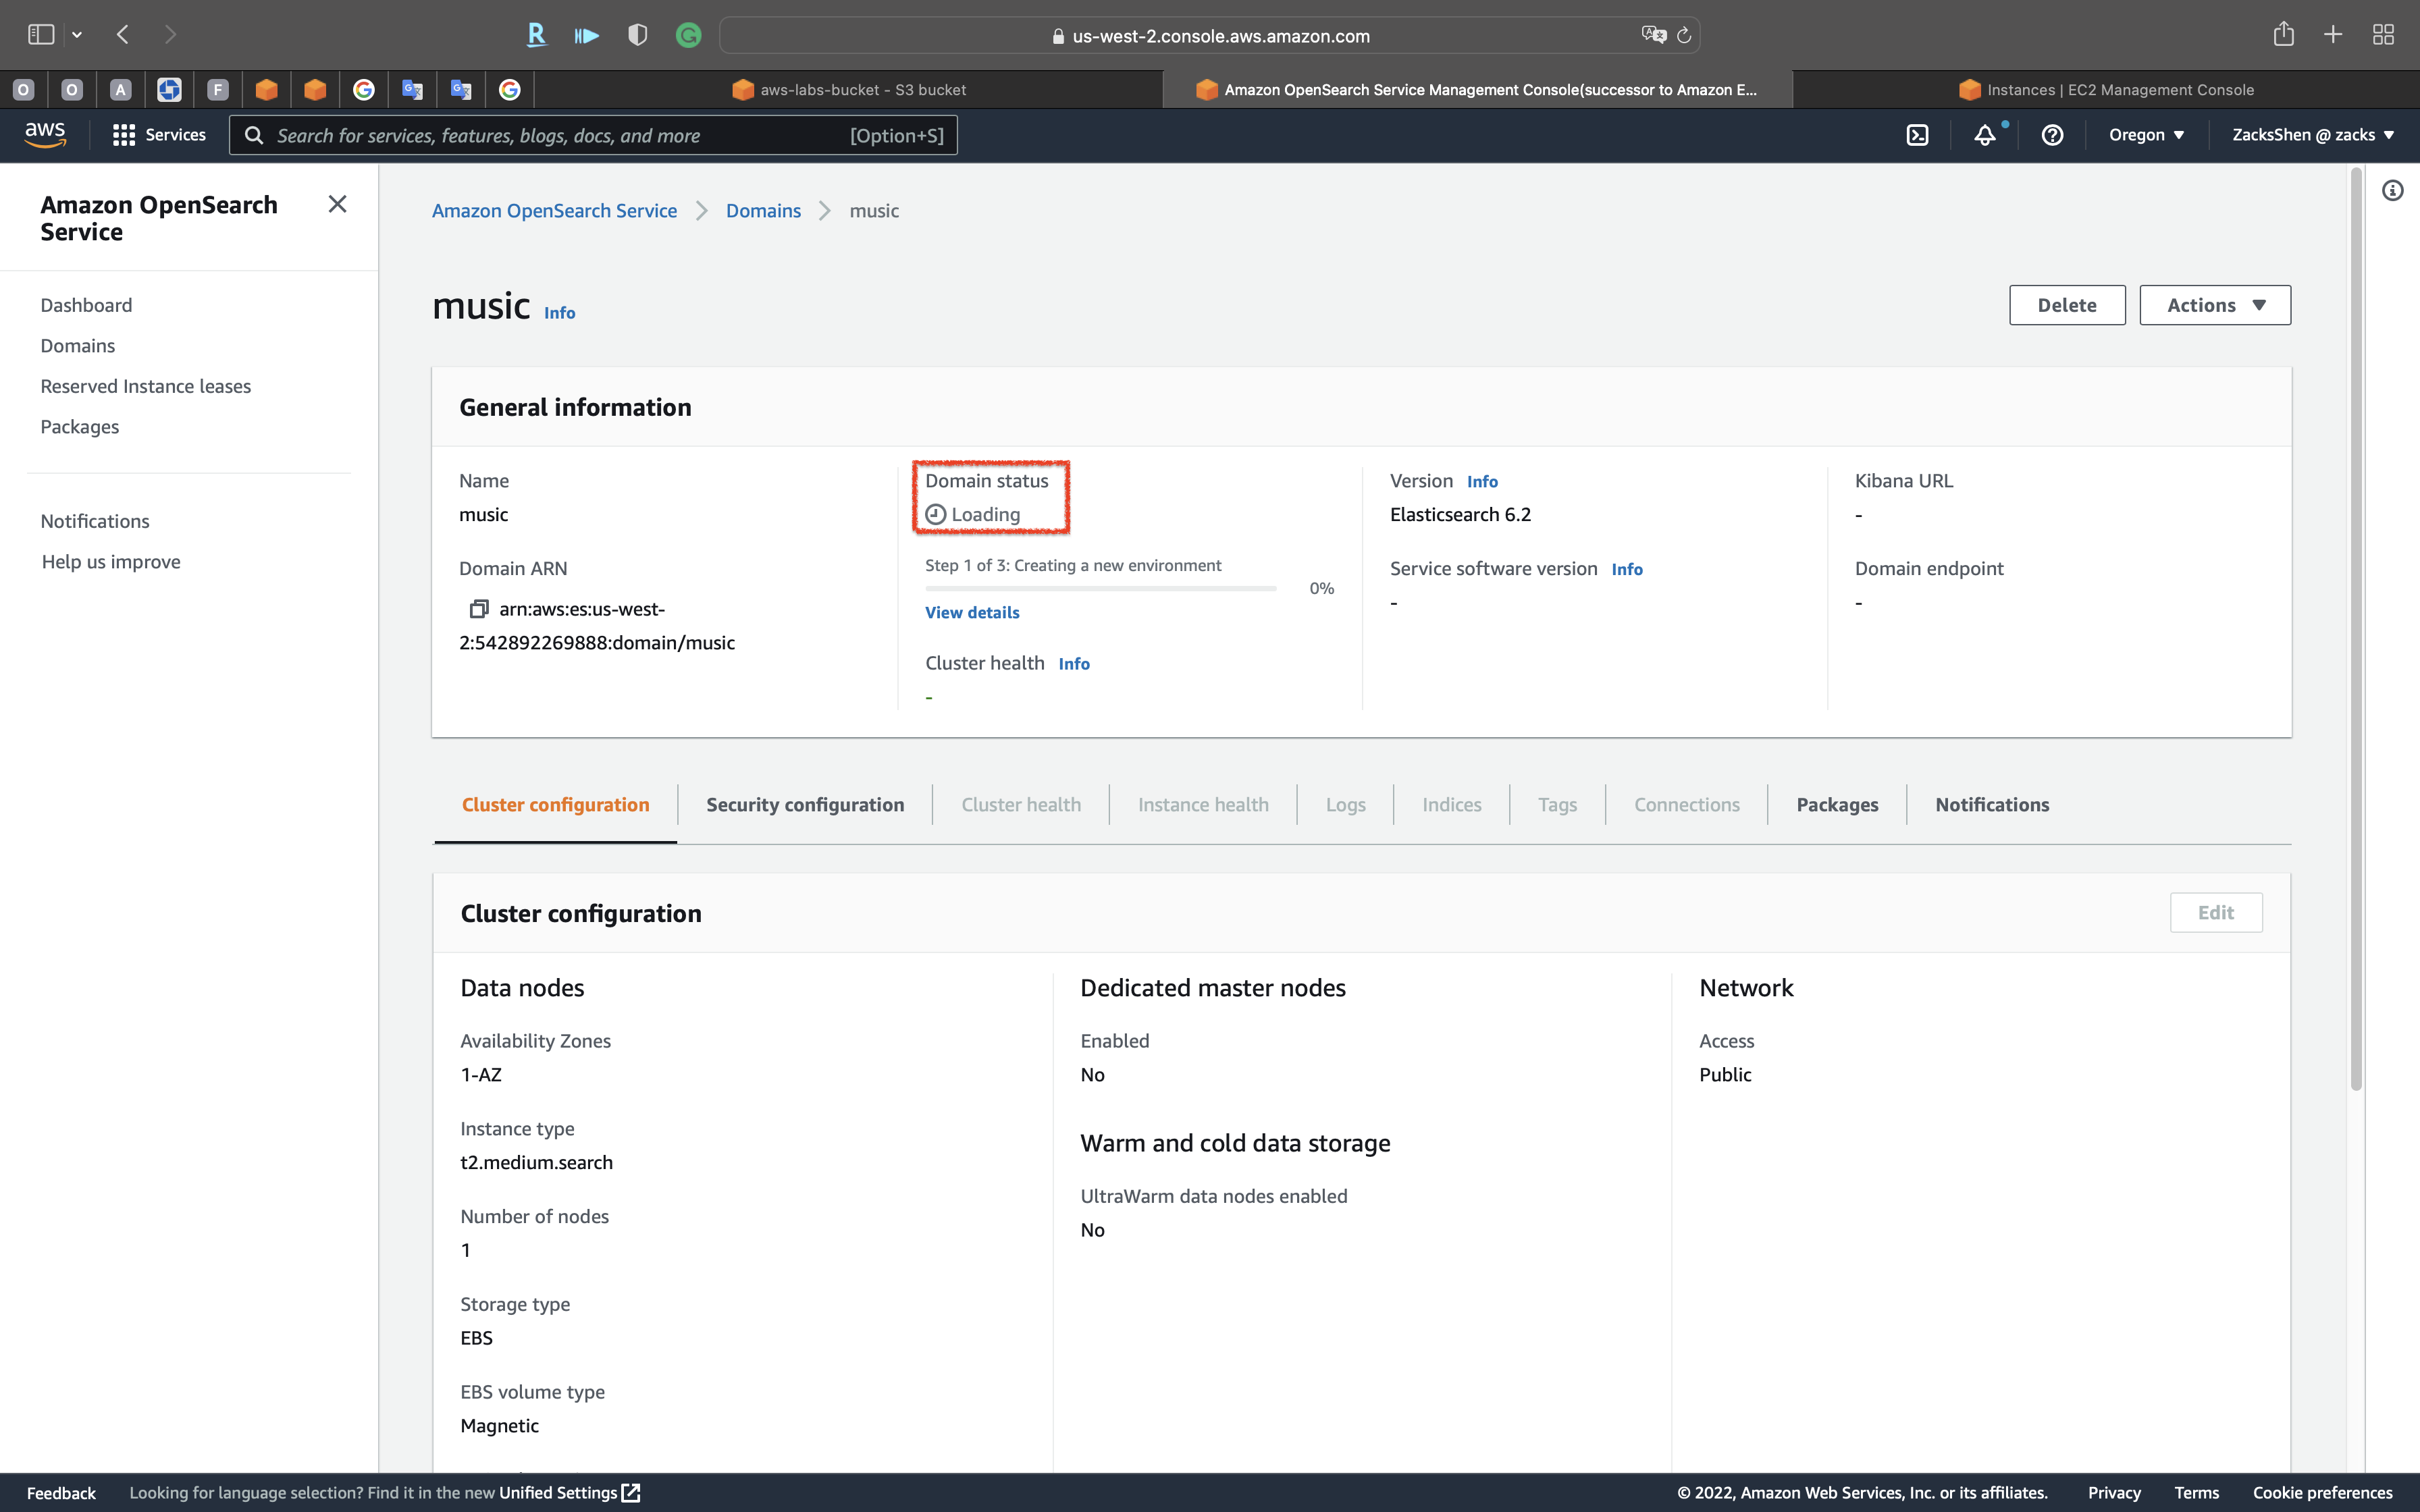
Click on View details
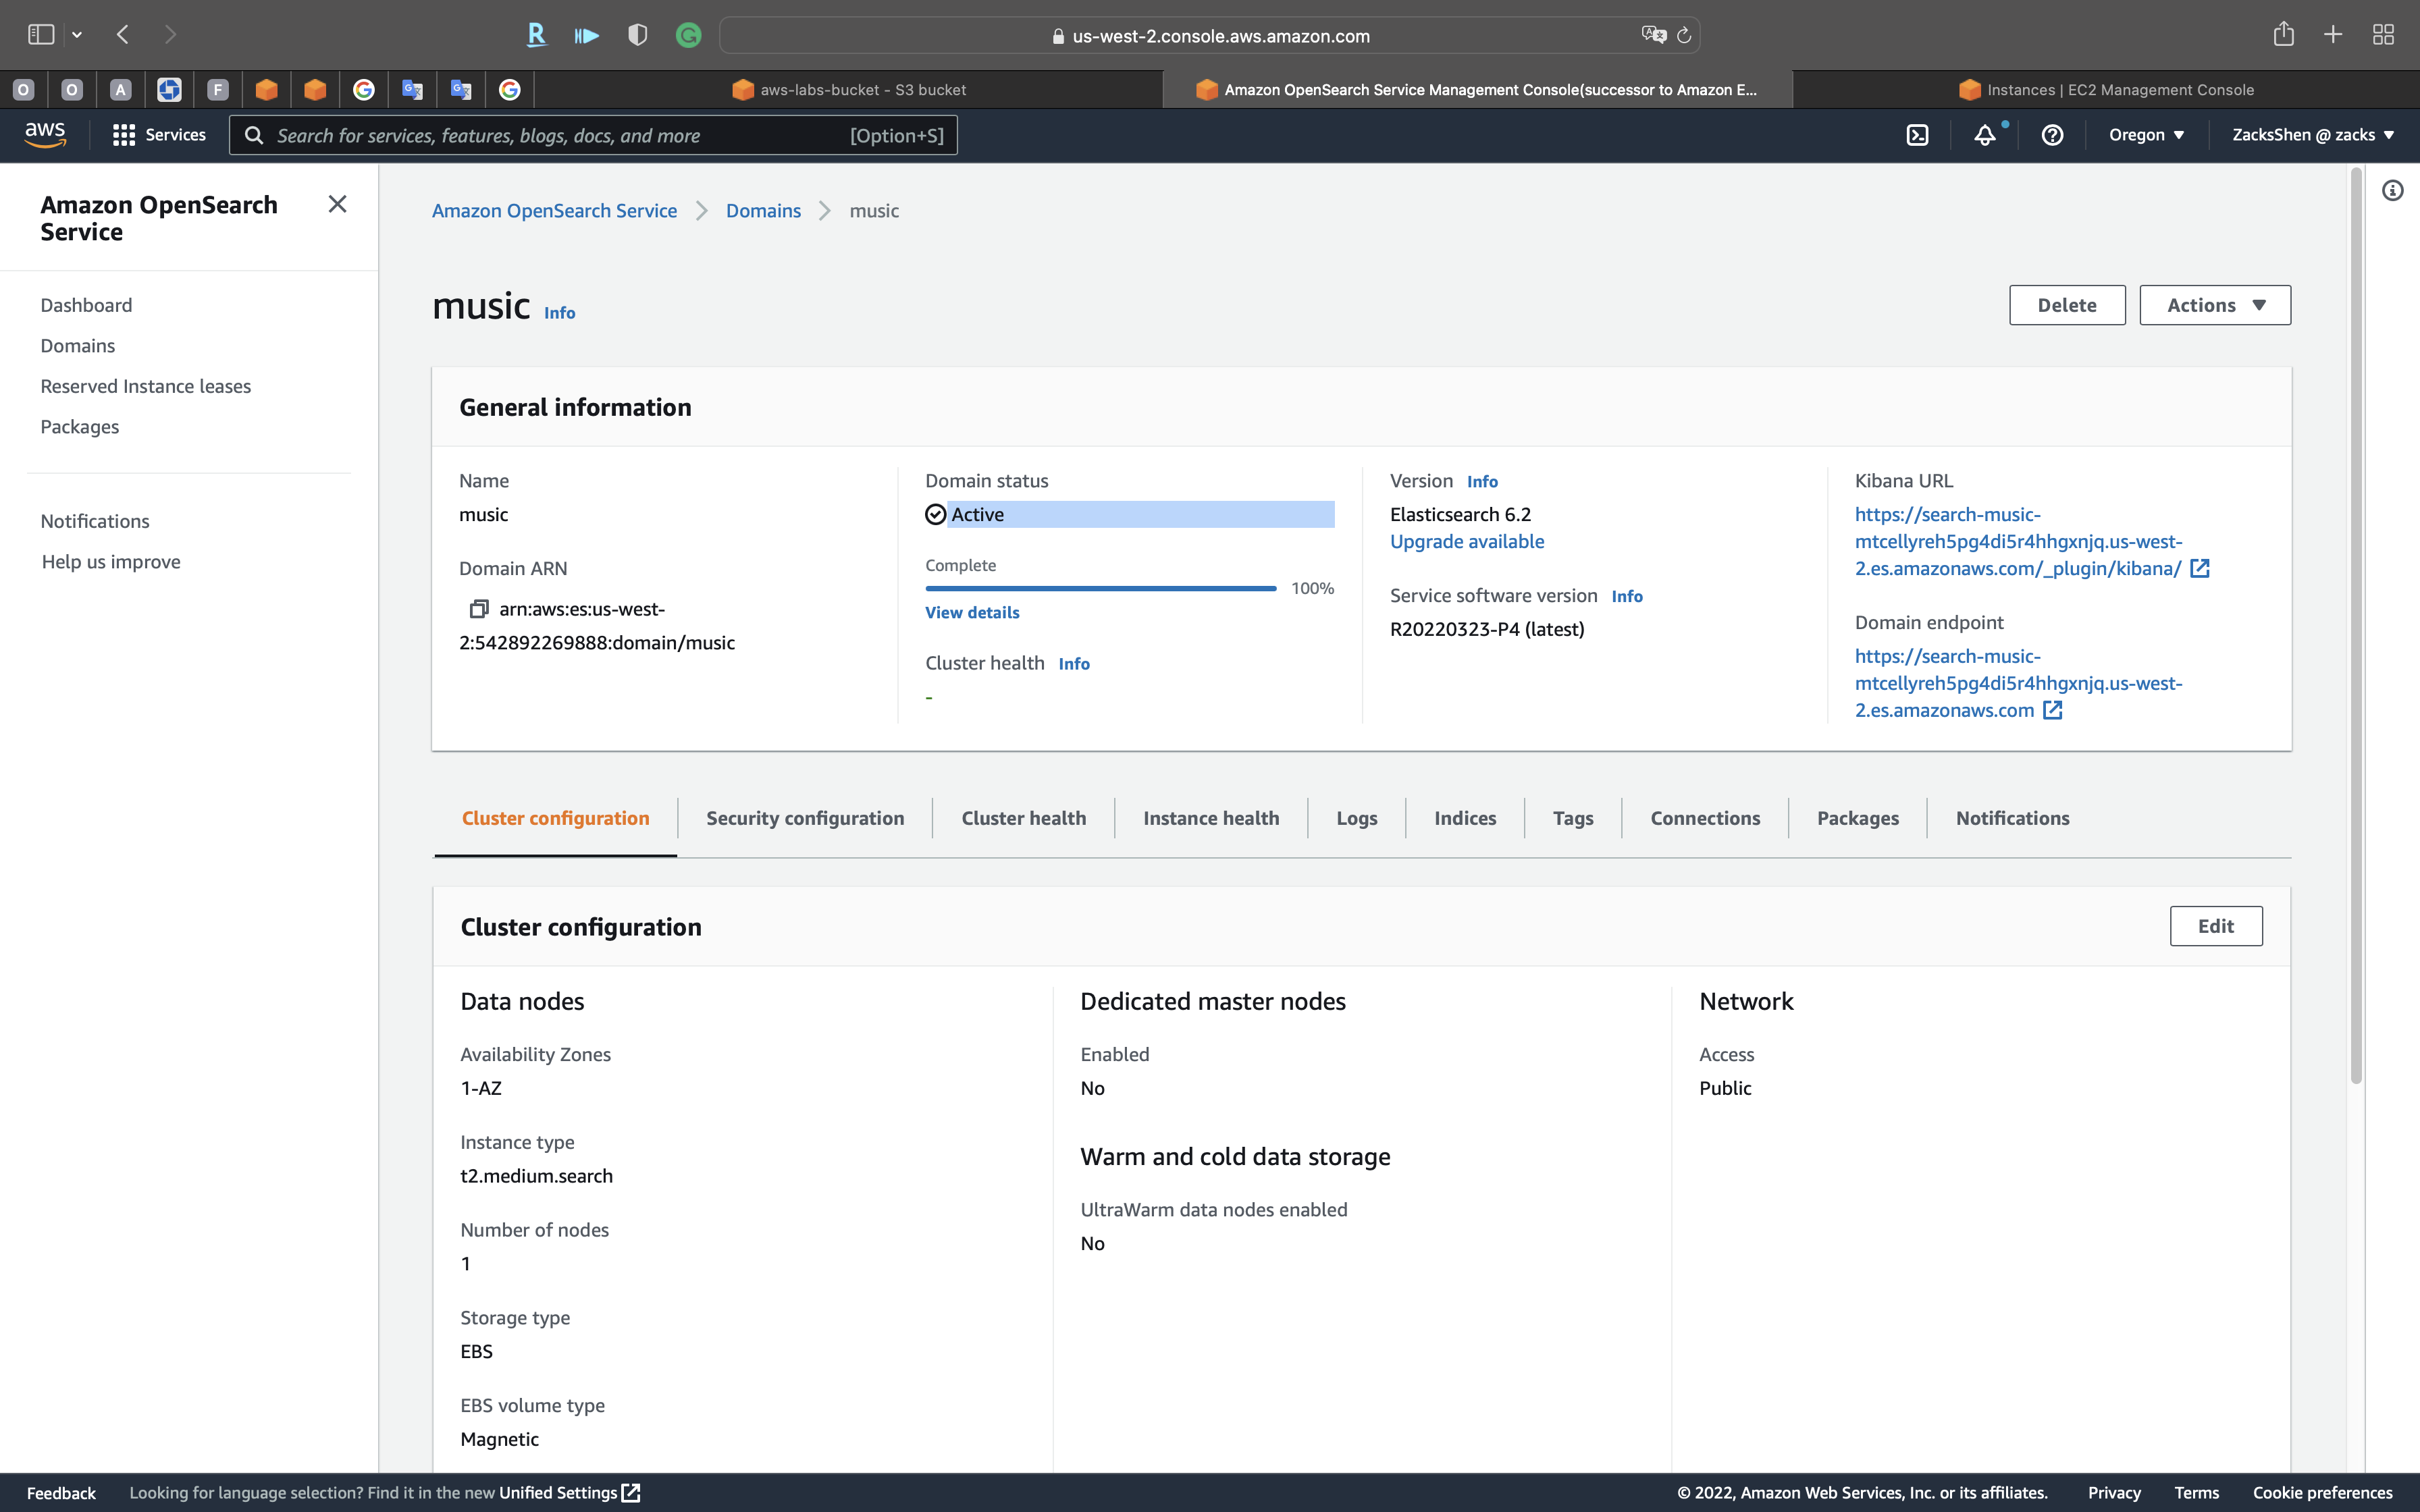
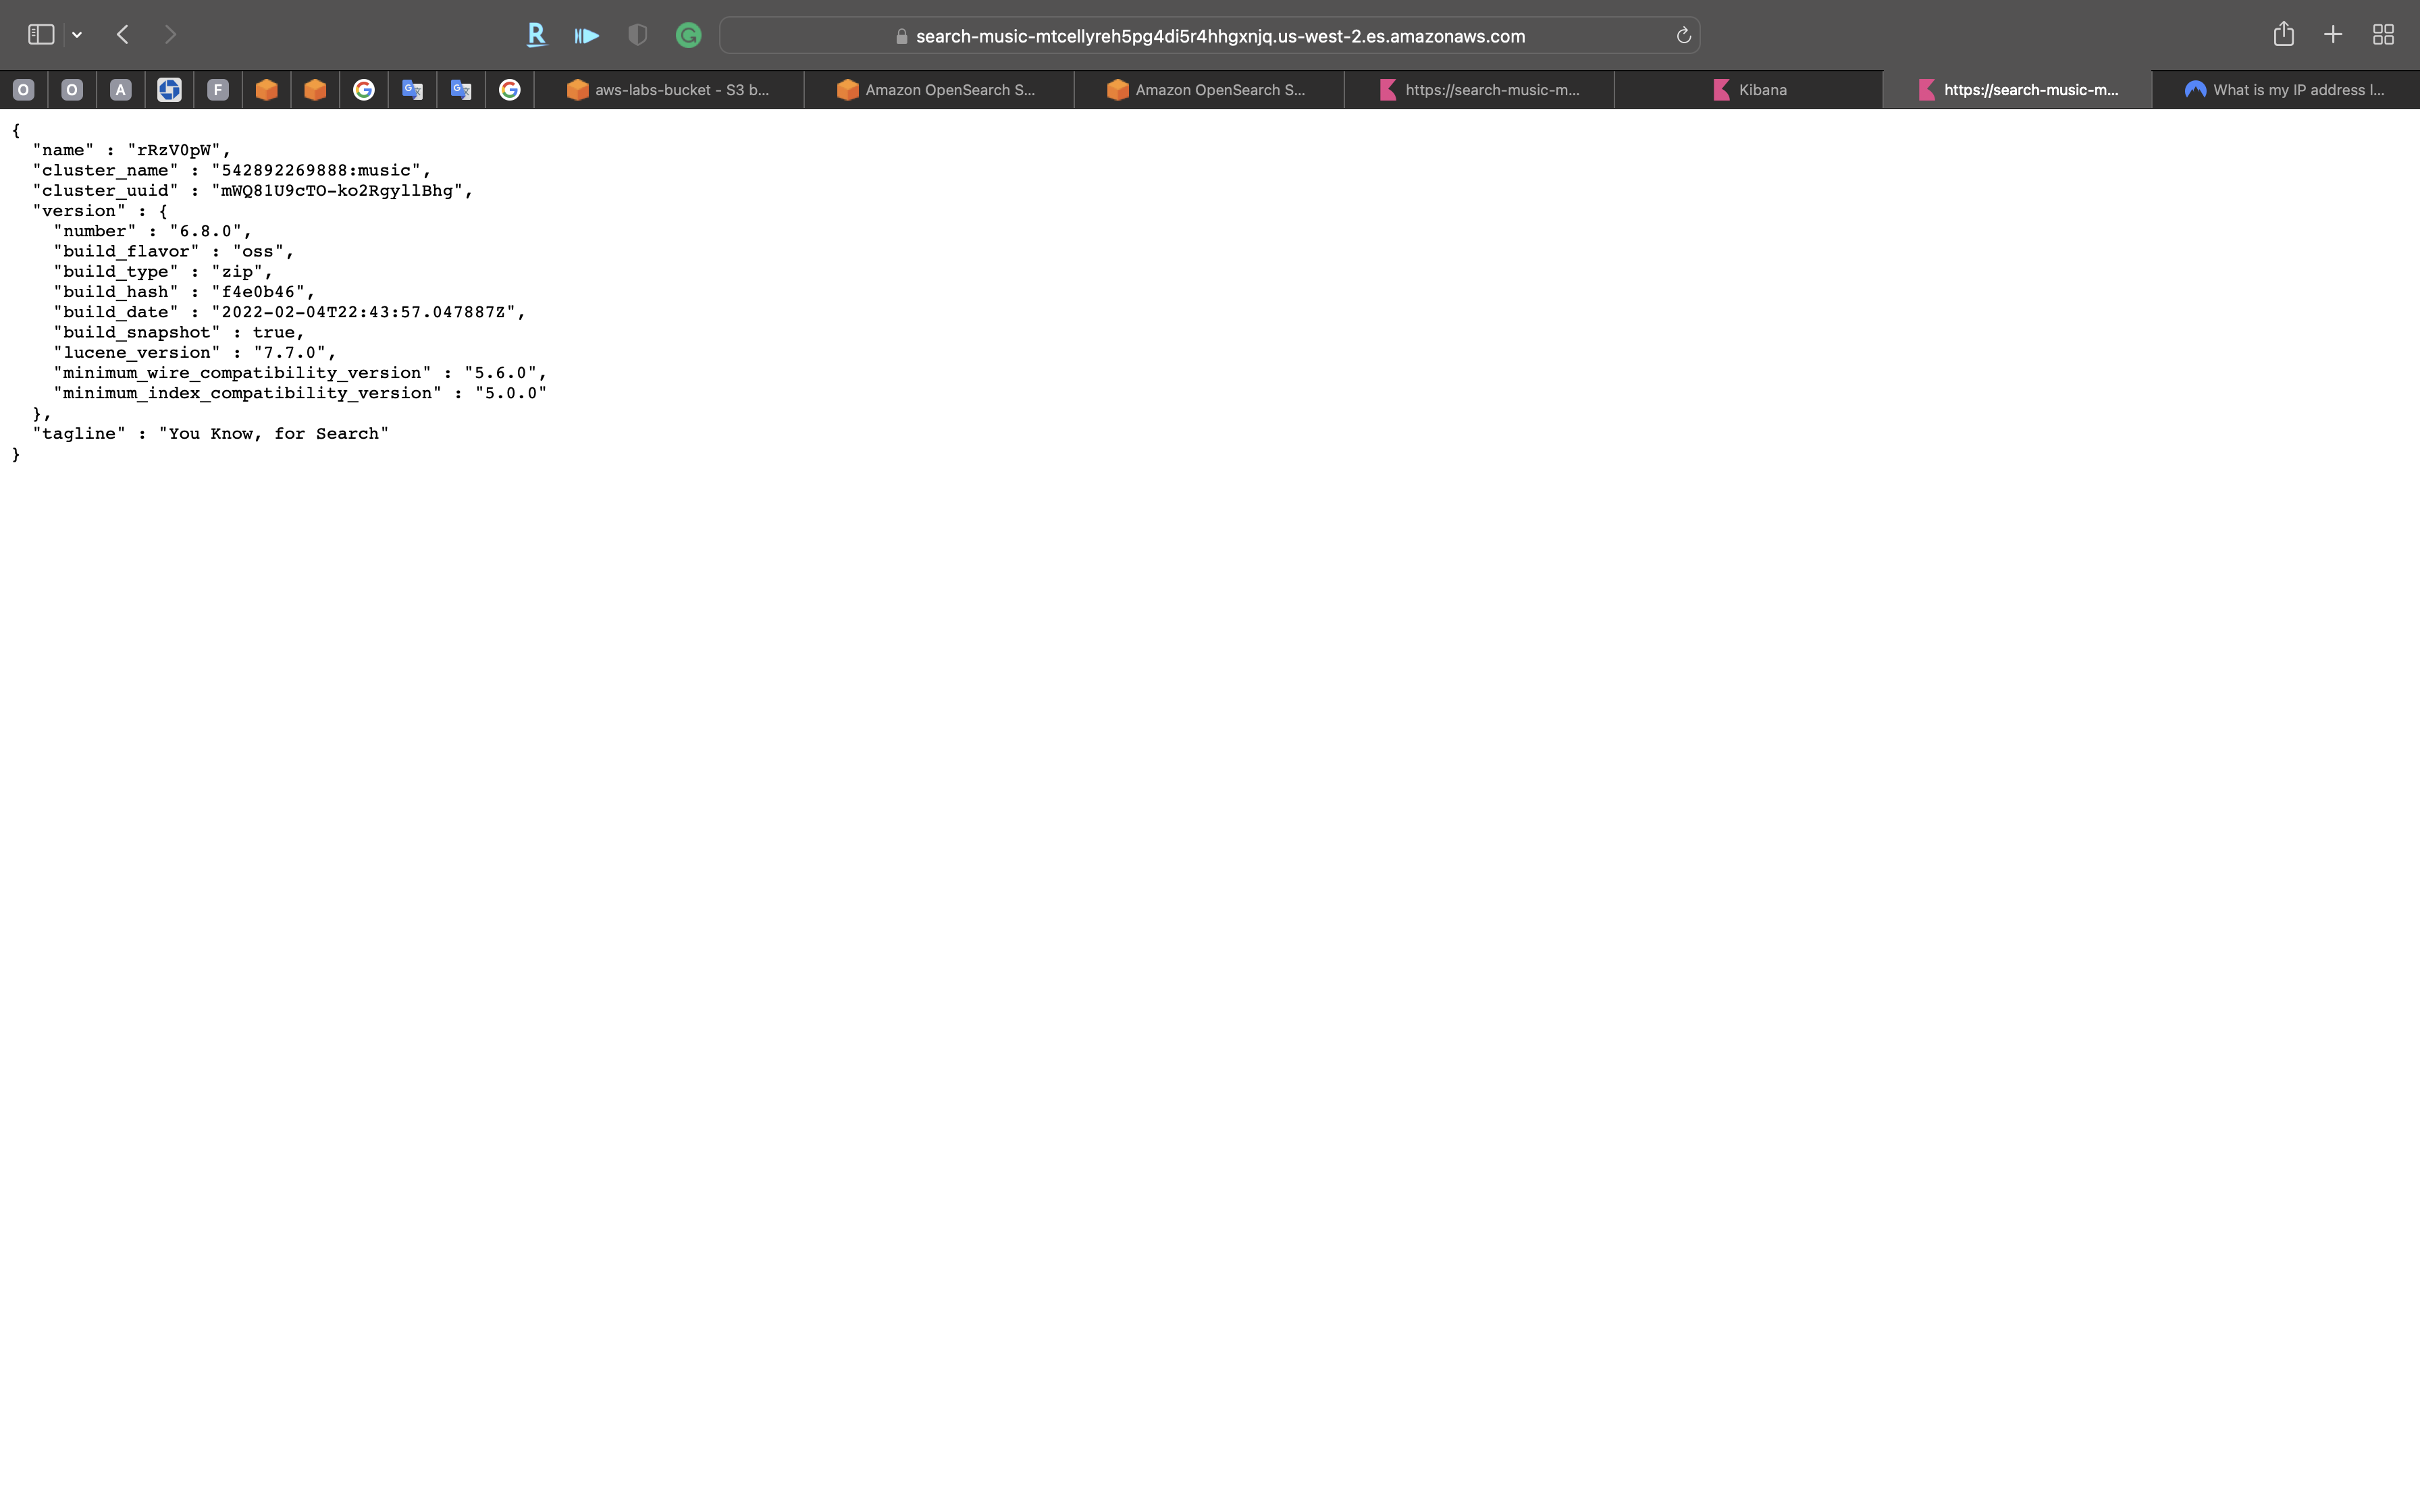
Copy OpenSearch Cluster’s Domain endpoint
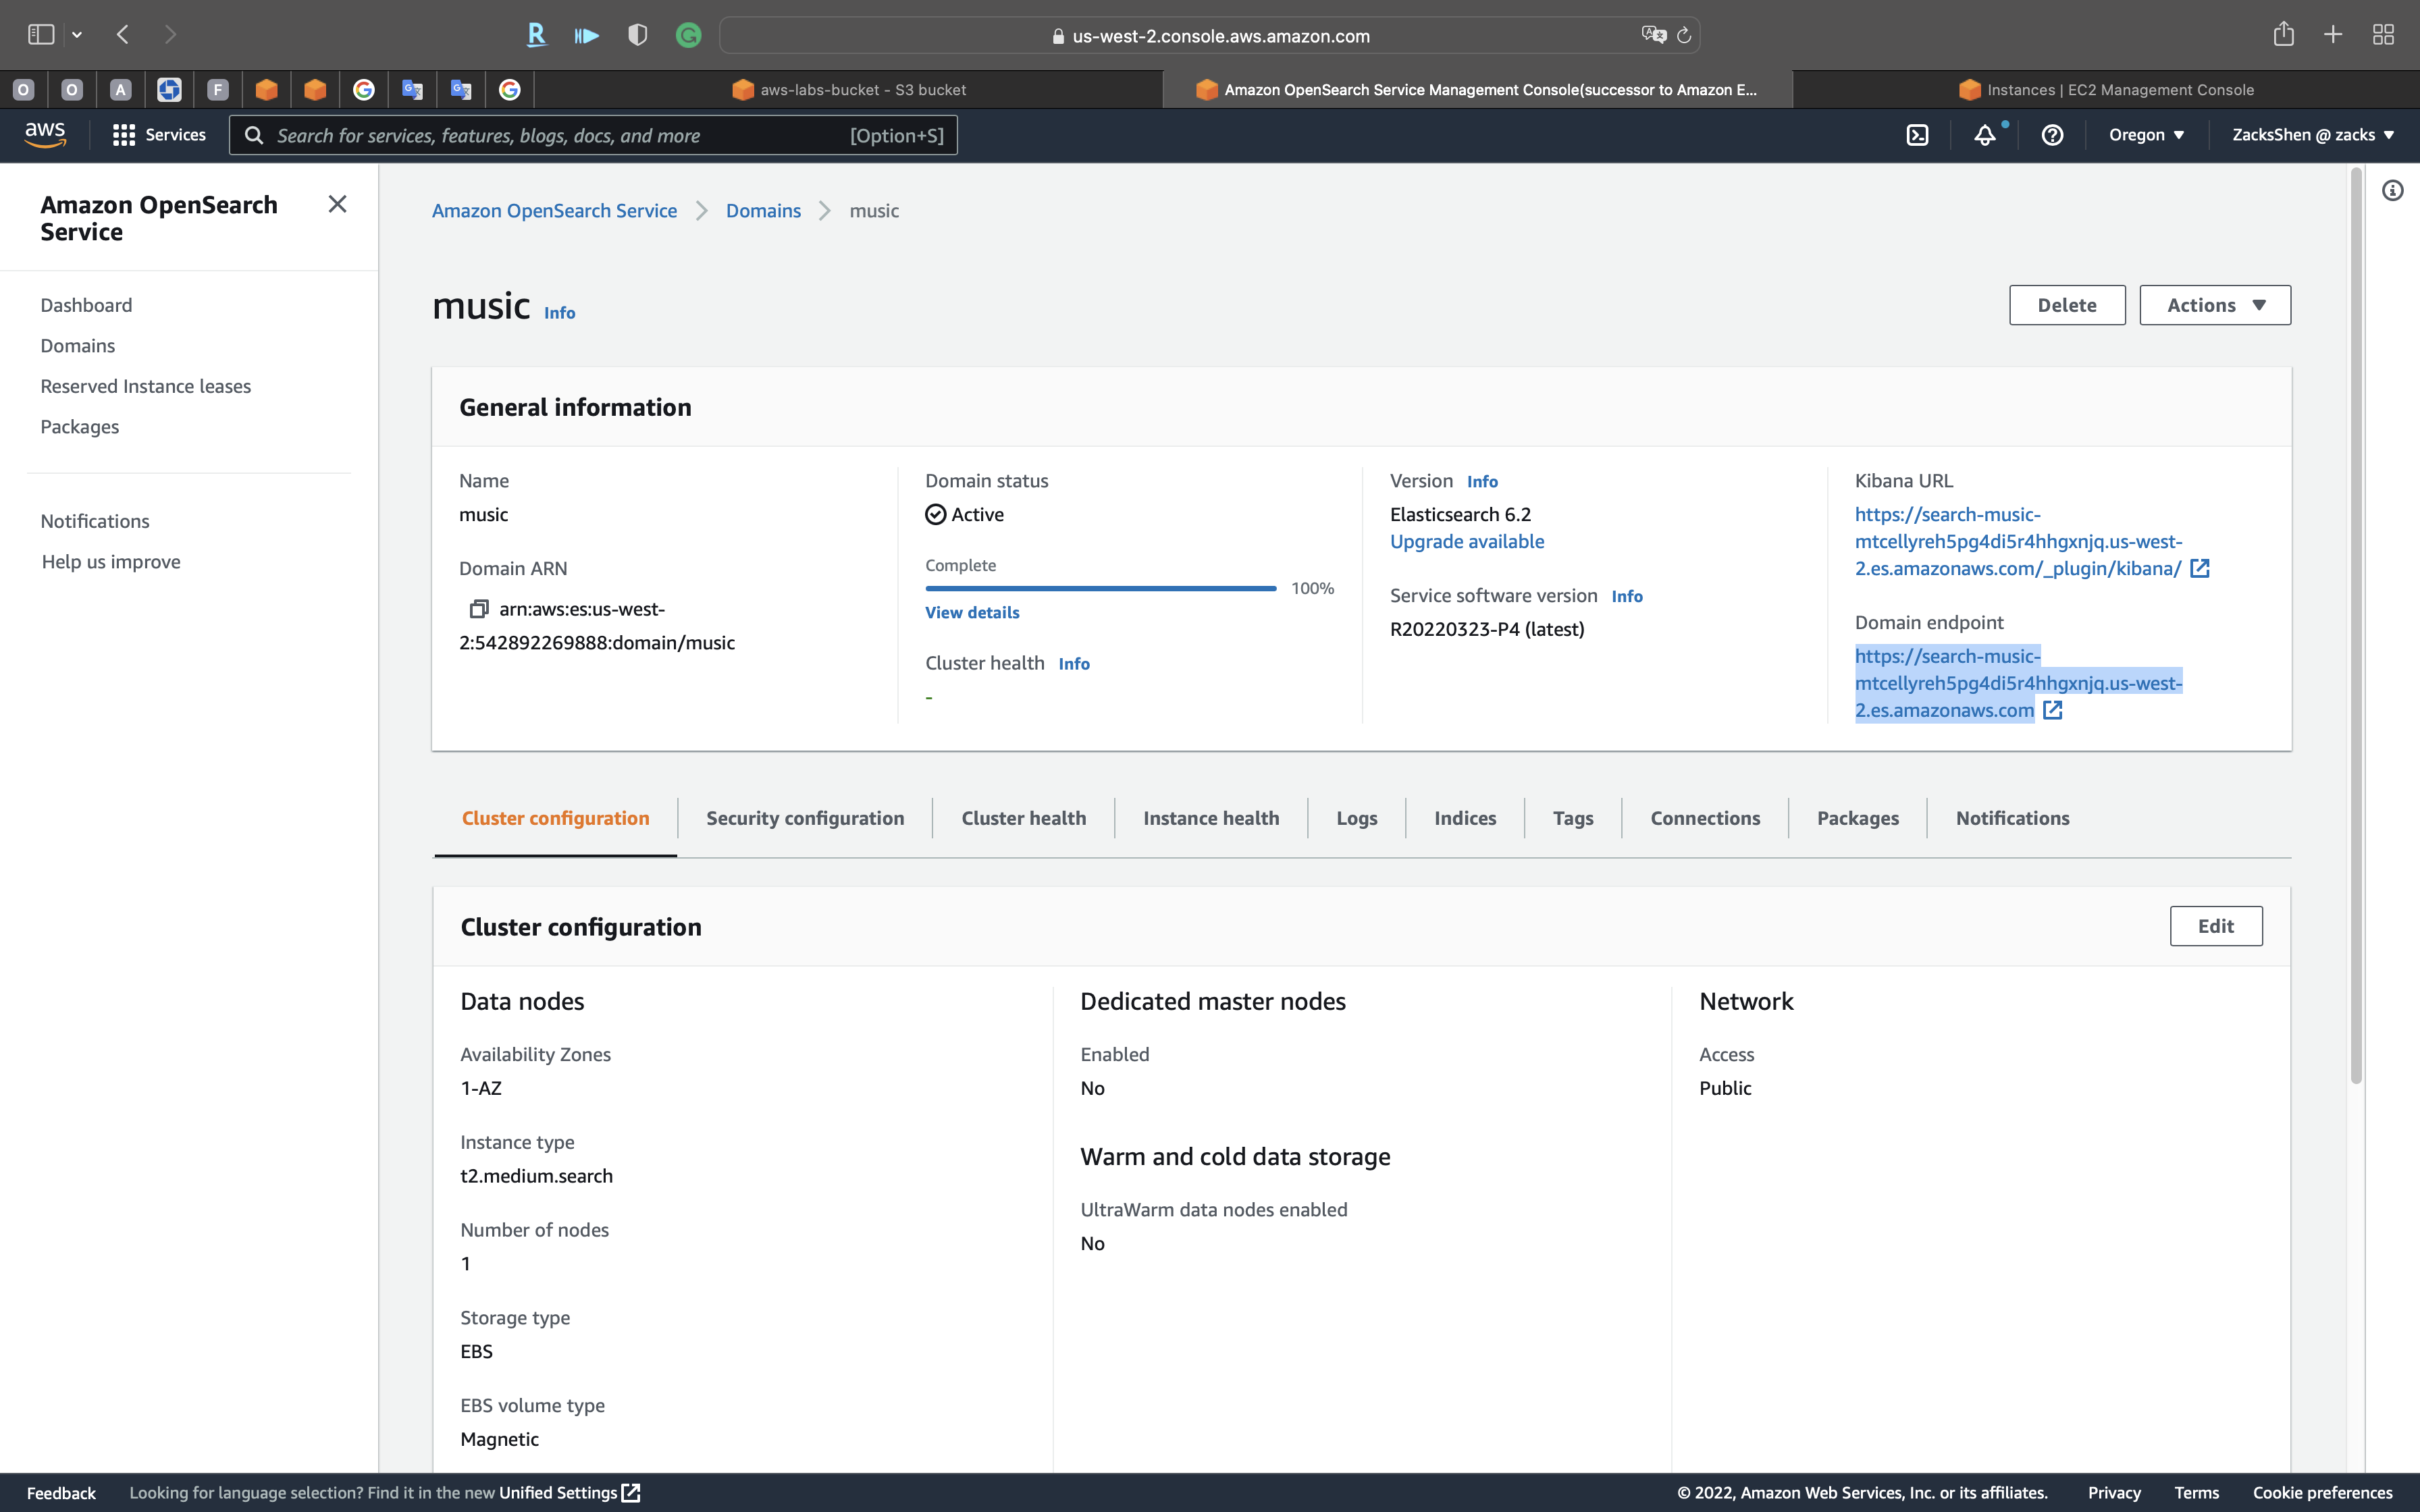
The Domain endpoin is end with es.amazonaws.com, such as https://search-music-mtcellyreh5pg4di5r4hhgxnjq.us-west-2.es.amazonaws.com
Upload data to OpenSearch cluster
Install OpenSearch through Python PIP.
If you would like to run Python in virtual environment, see Pipenv or venv.
For Pipenv:
1 | # Make a directory AWS for your AWS labs |
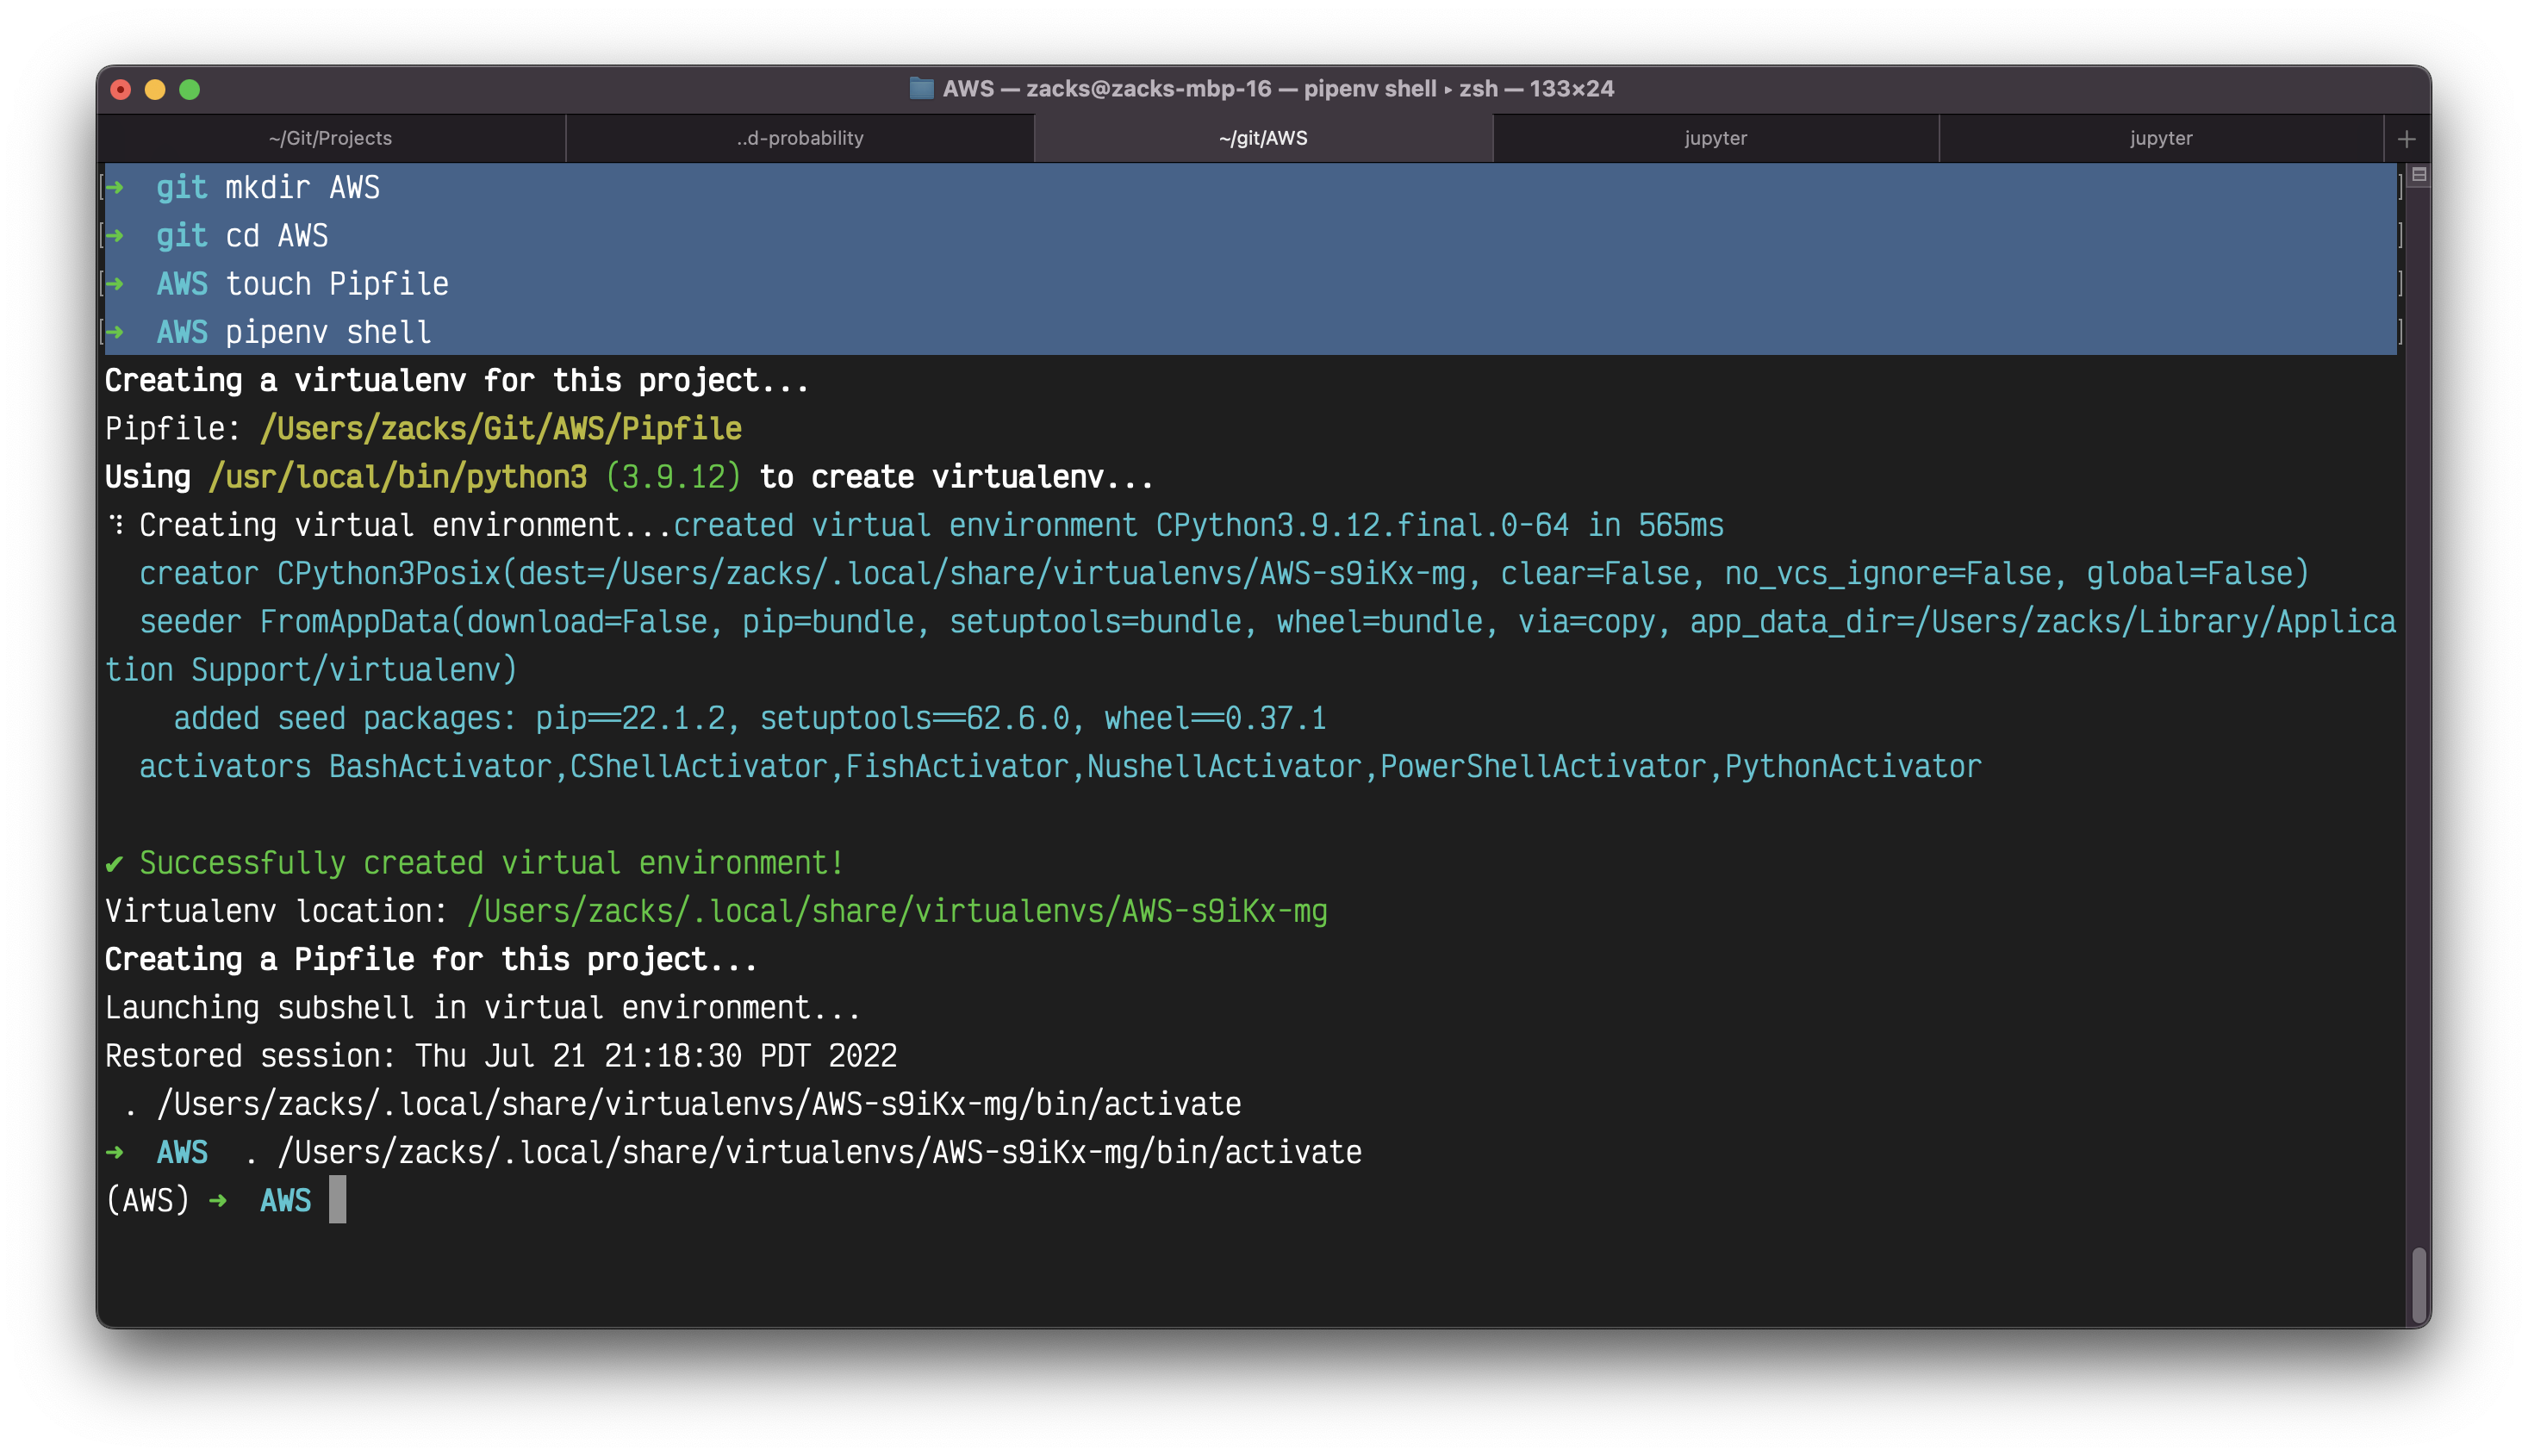
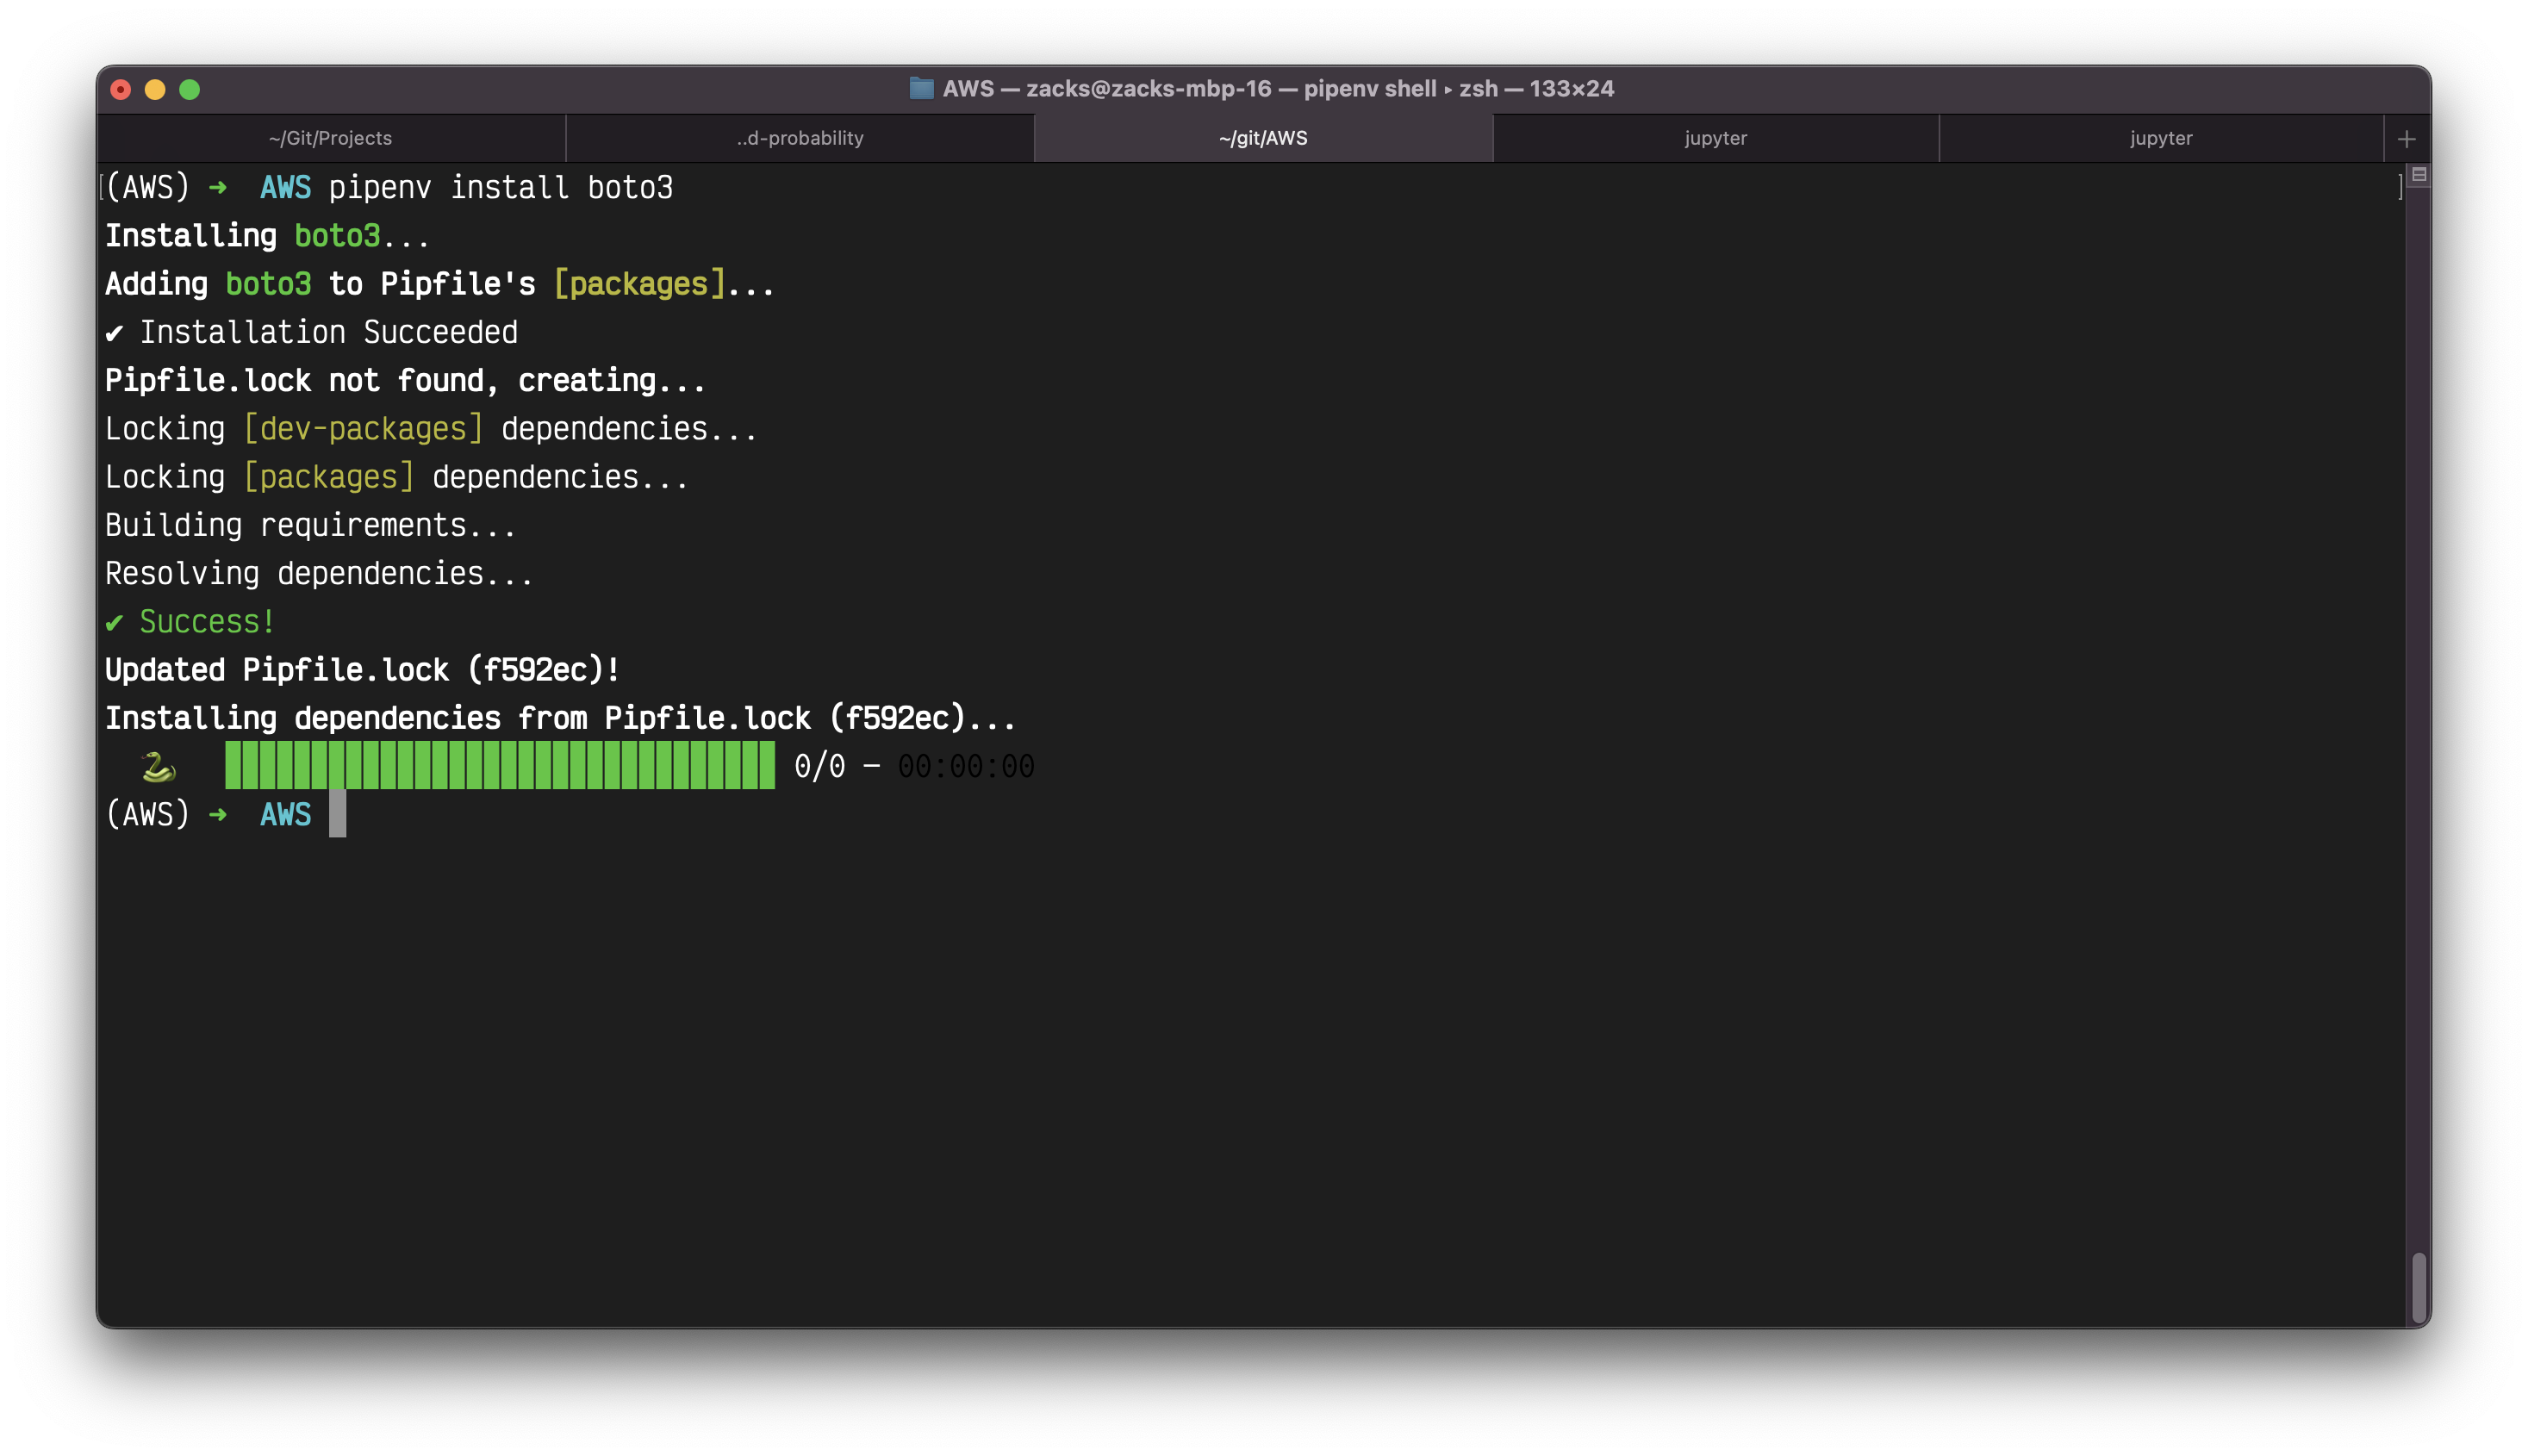
1 | # Install boto3 |
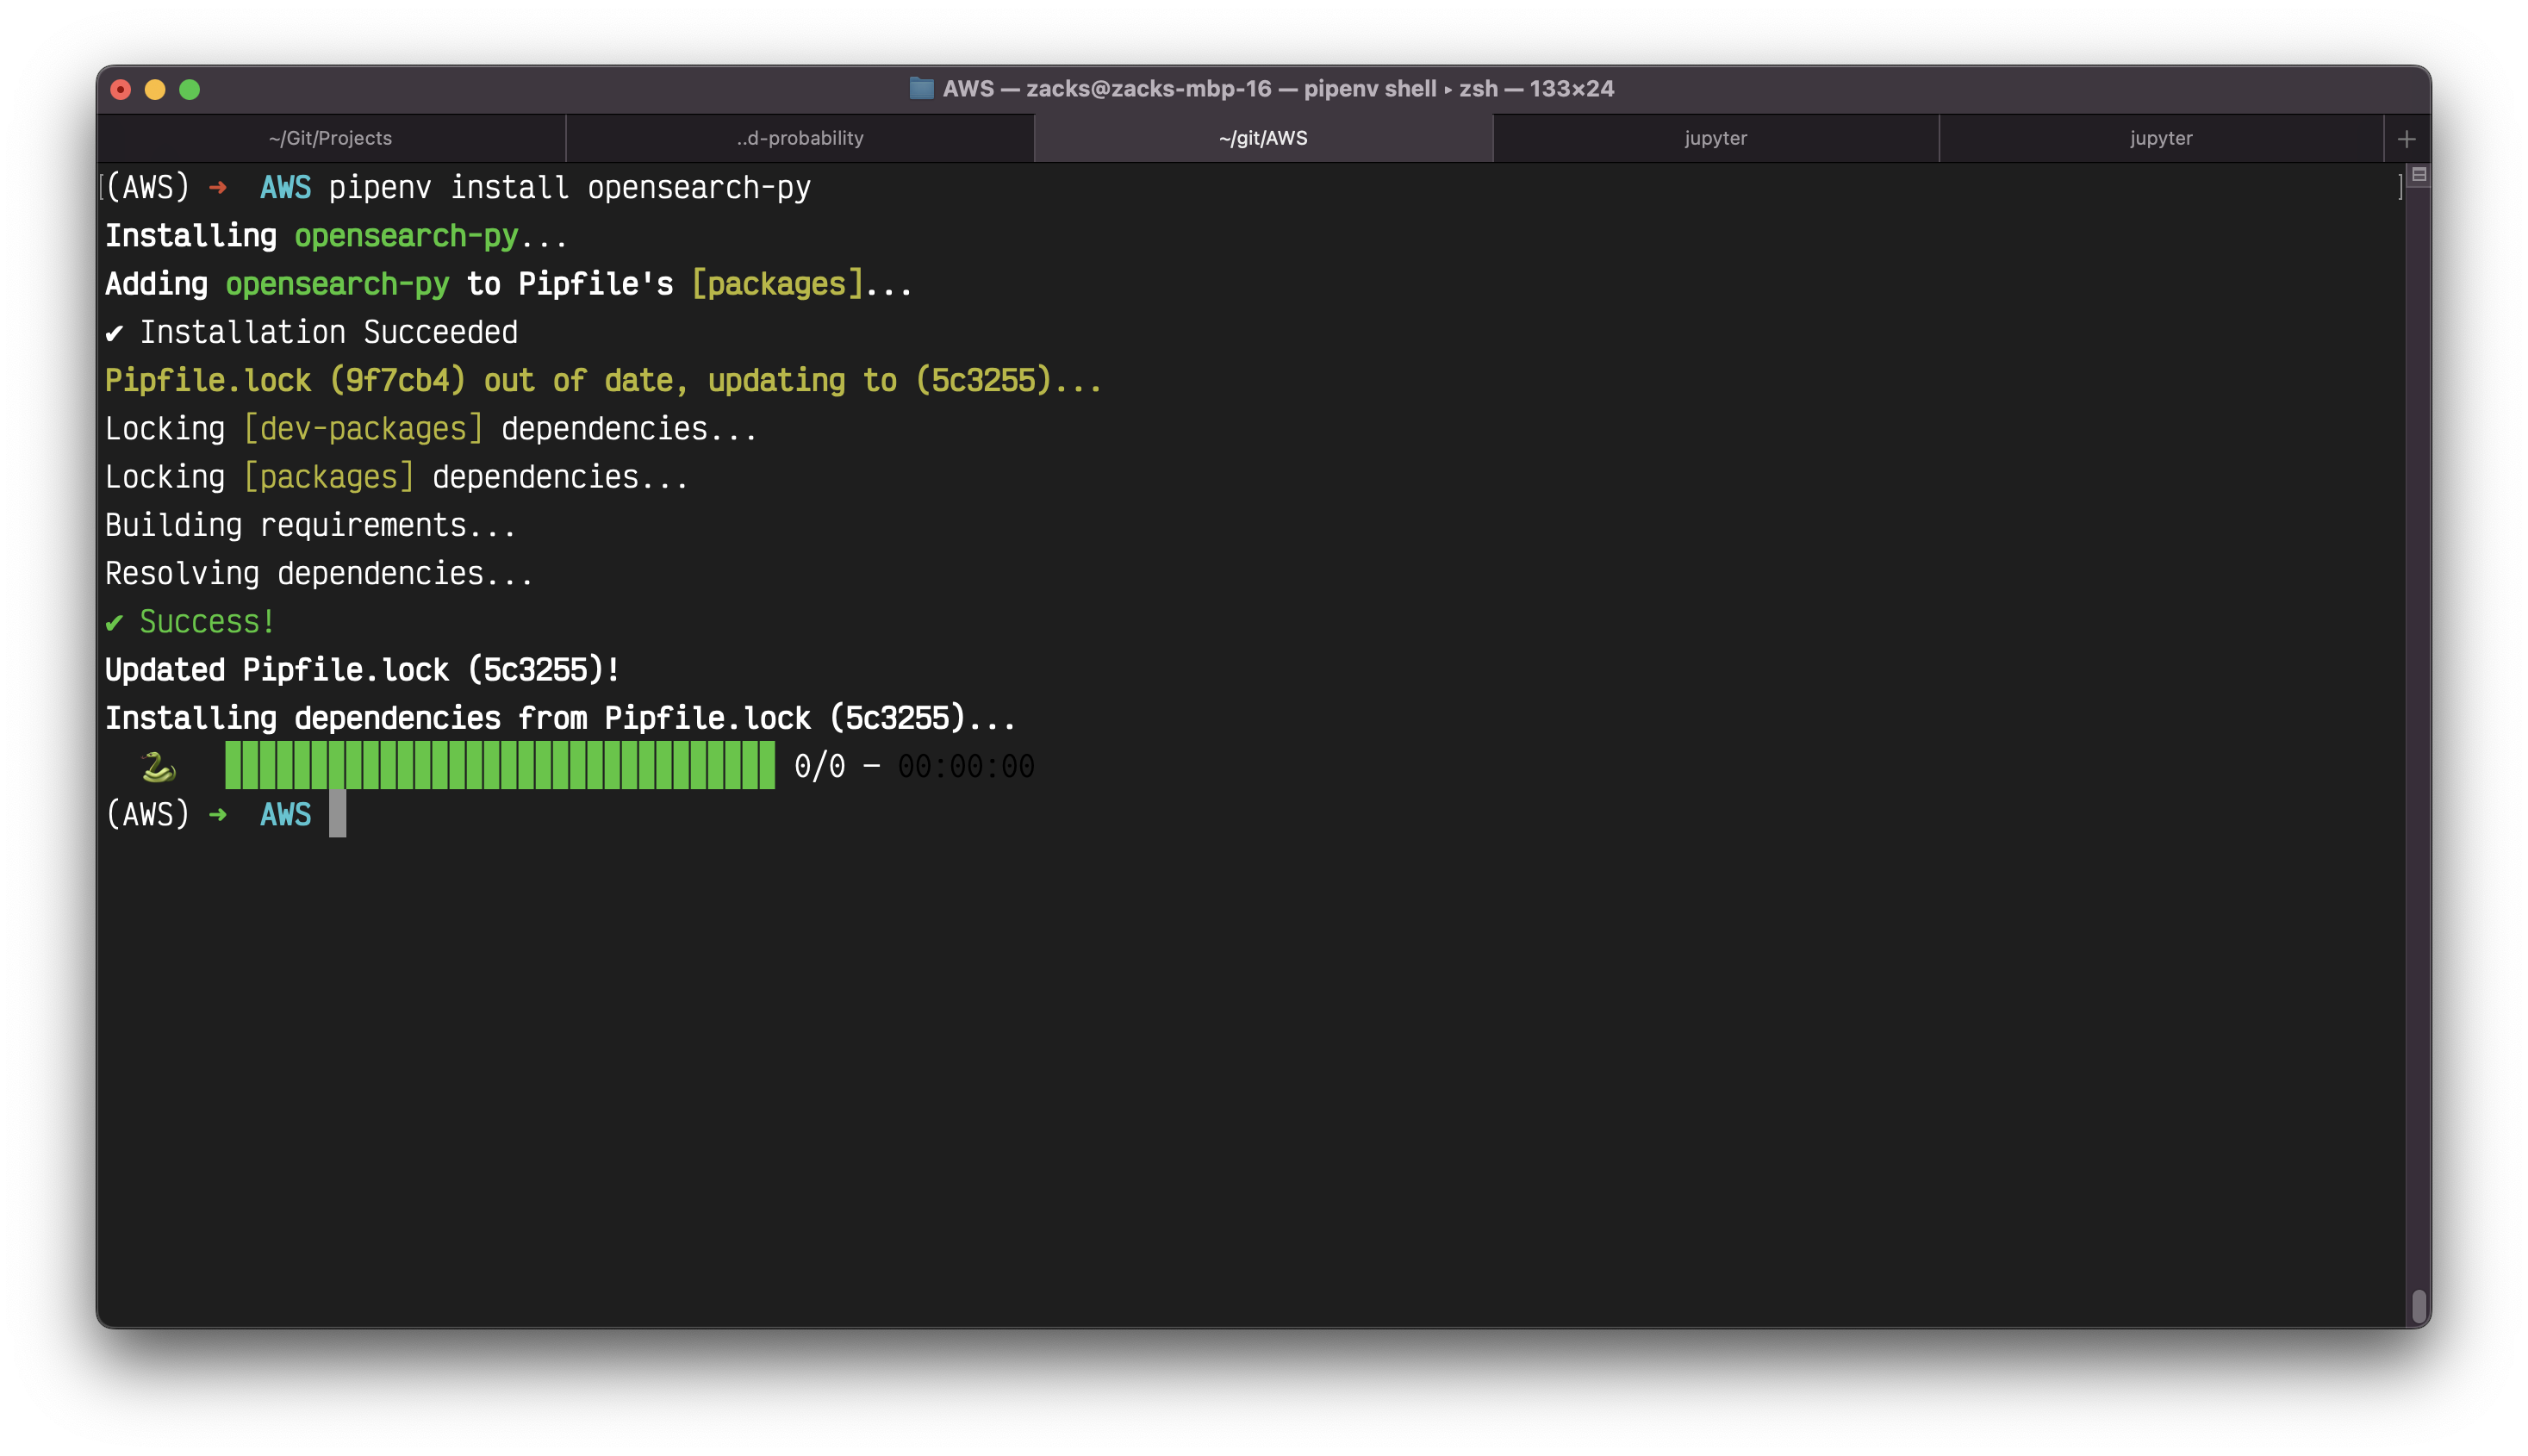
1 | # Install opensearch-py |
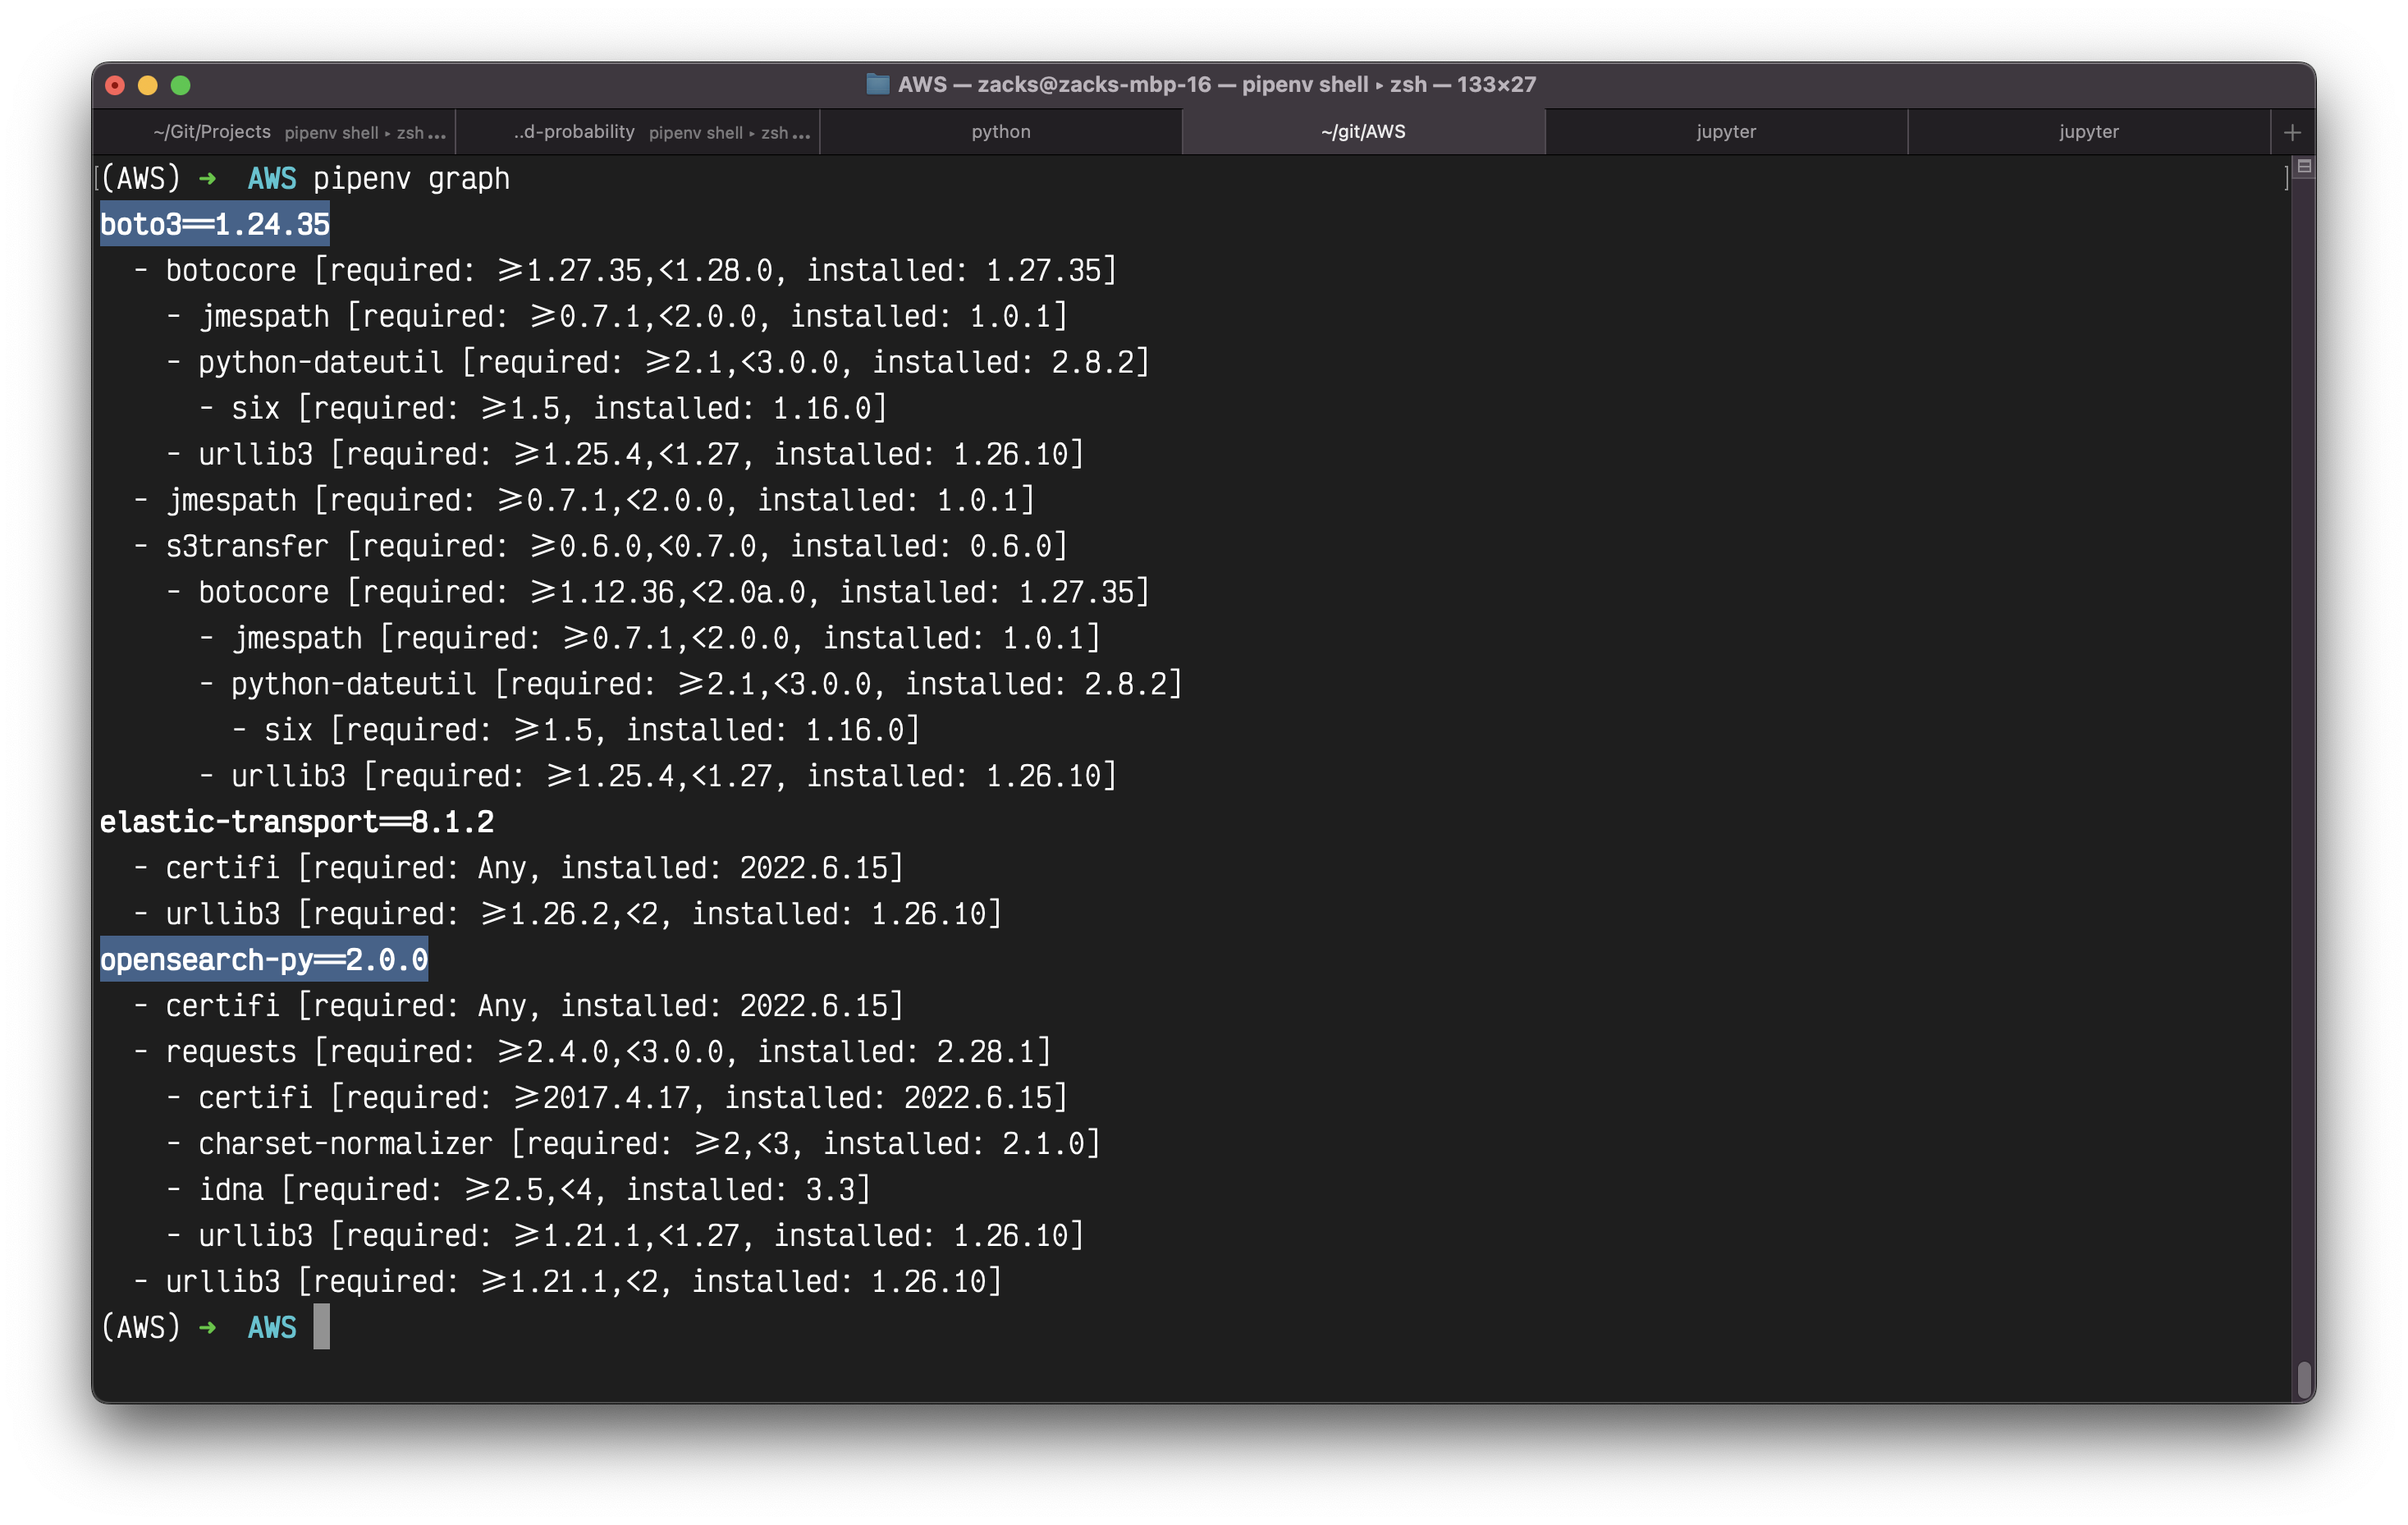
1 | # Review your installed packages |
For pip (SKIP this step if you already perform the above Pipenv step):
1 | # Install boto3 |
1 | # Review your installed packages |
OpenSearch Documentation
Sample code for Amazon OpenSearch Service
Create a .py file such as aws-es-music.py with the following code.
Replace the
hostto your OpenSearch Cluster Domain Endpoint (without https://) such assearch-music-mtcellyreh5pg4di5r4hhgxnjq.us-west-2.es.amazonaws.comReplace the
regionto your OpenSearch Service region and S3 region.
1 | from opensearchpy import OpenSearch, RequestsHttpConnection, AWSV4SignerAuth |
Download the dataset music_bulk.json and save it to the directory of aws-es-music.py
Run aws-es-music.py for uploading dataset music_bulk.json to OpenSearch Cluster.
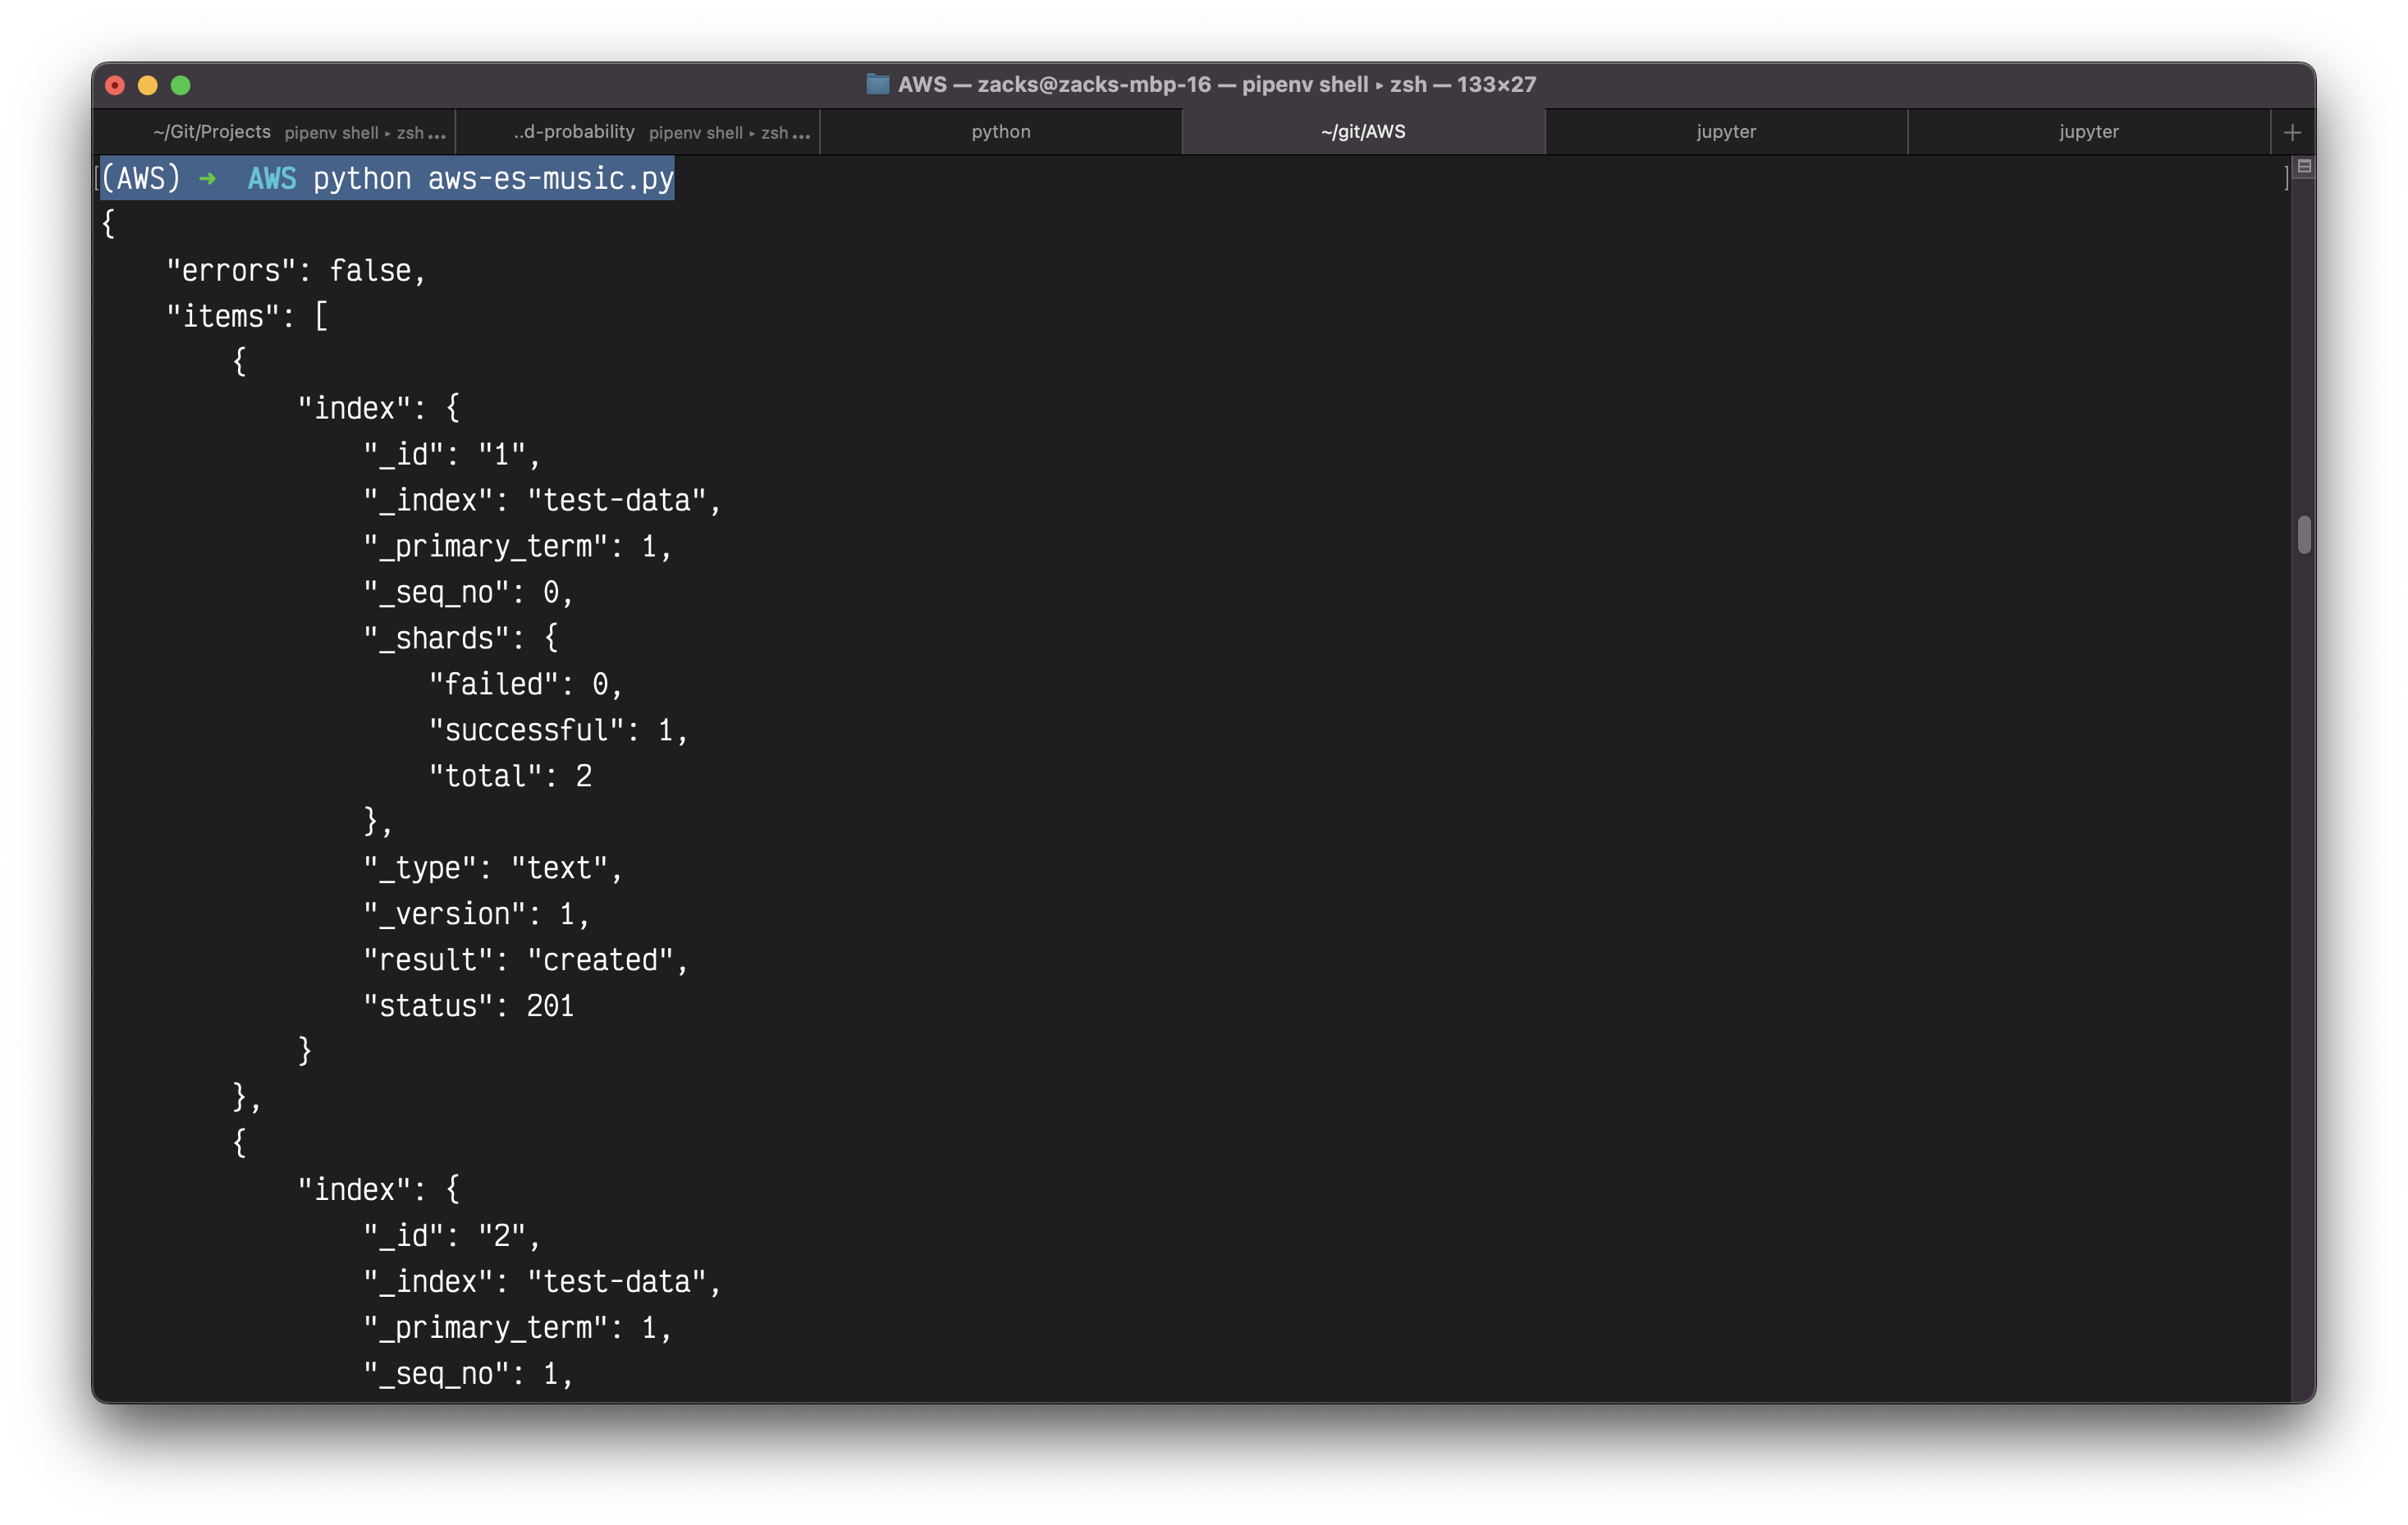
If you can see the http response from the Python output, you have successfully uploaded the JSON file to your OpenSearch cluster.
OpenSearch Upgrade
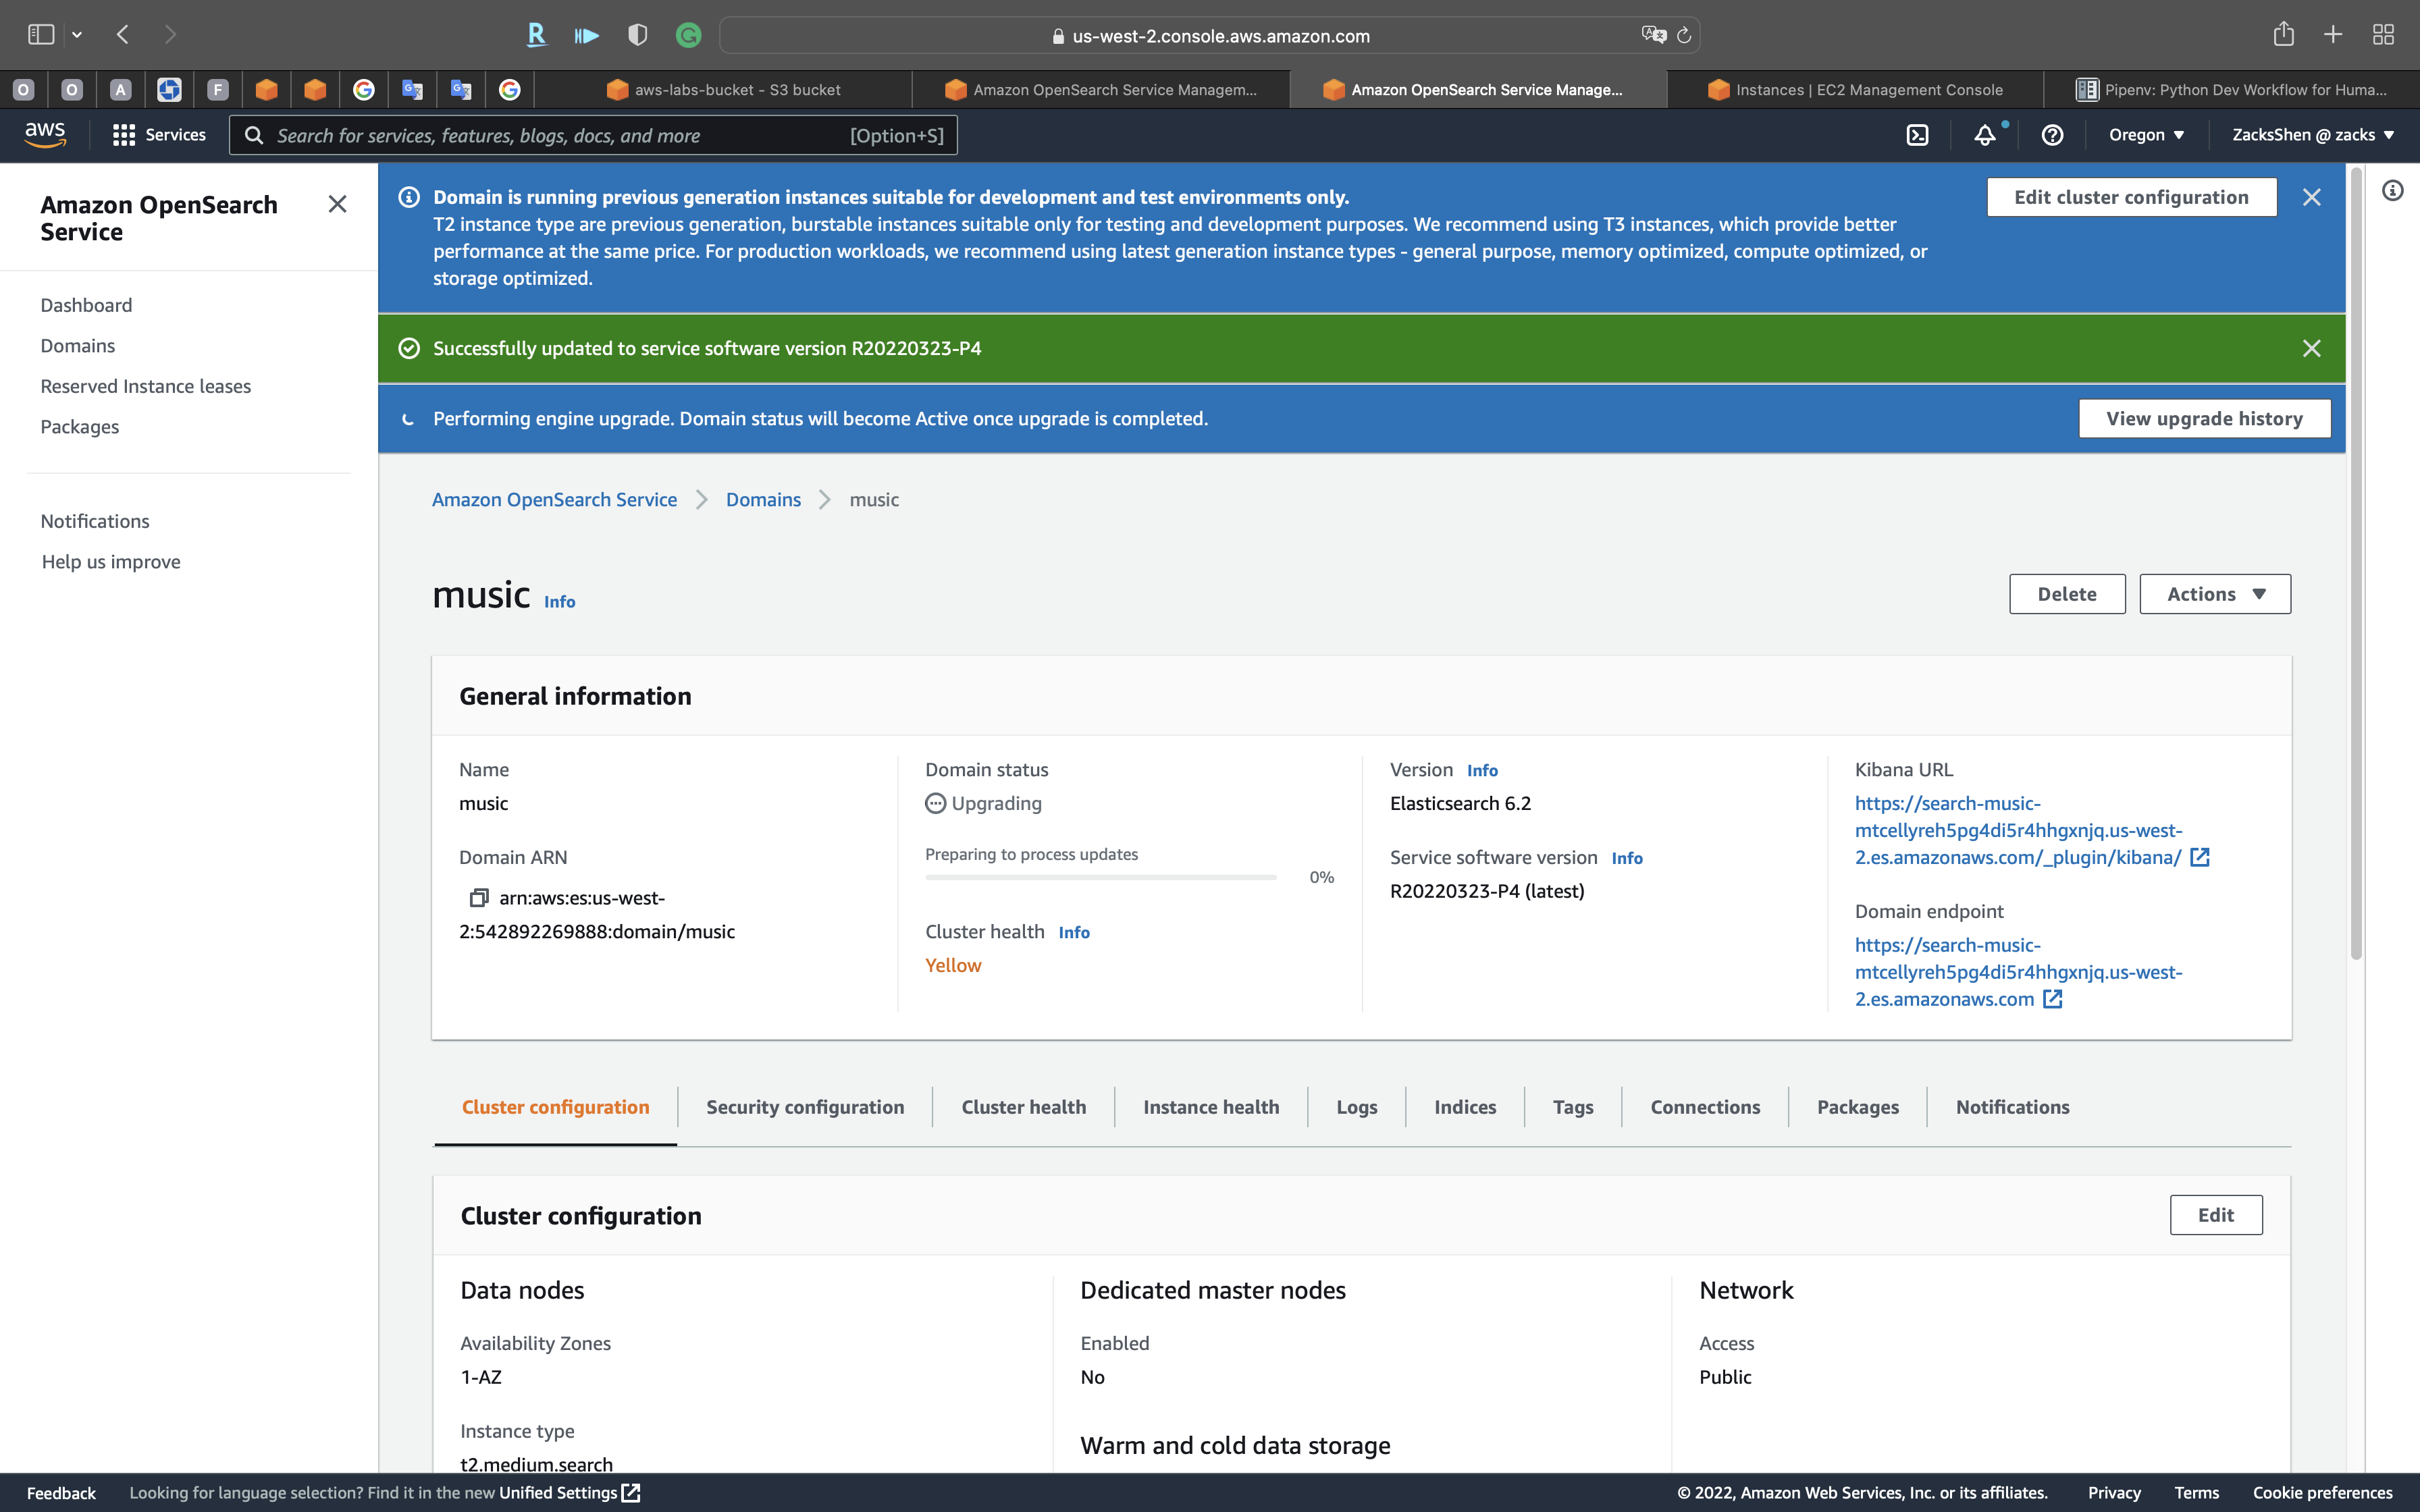
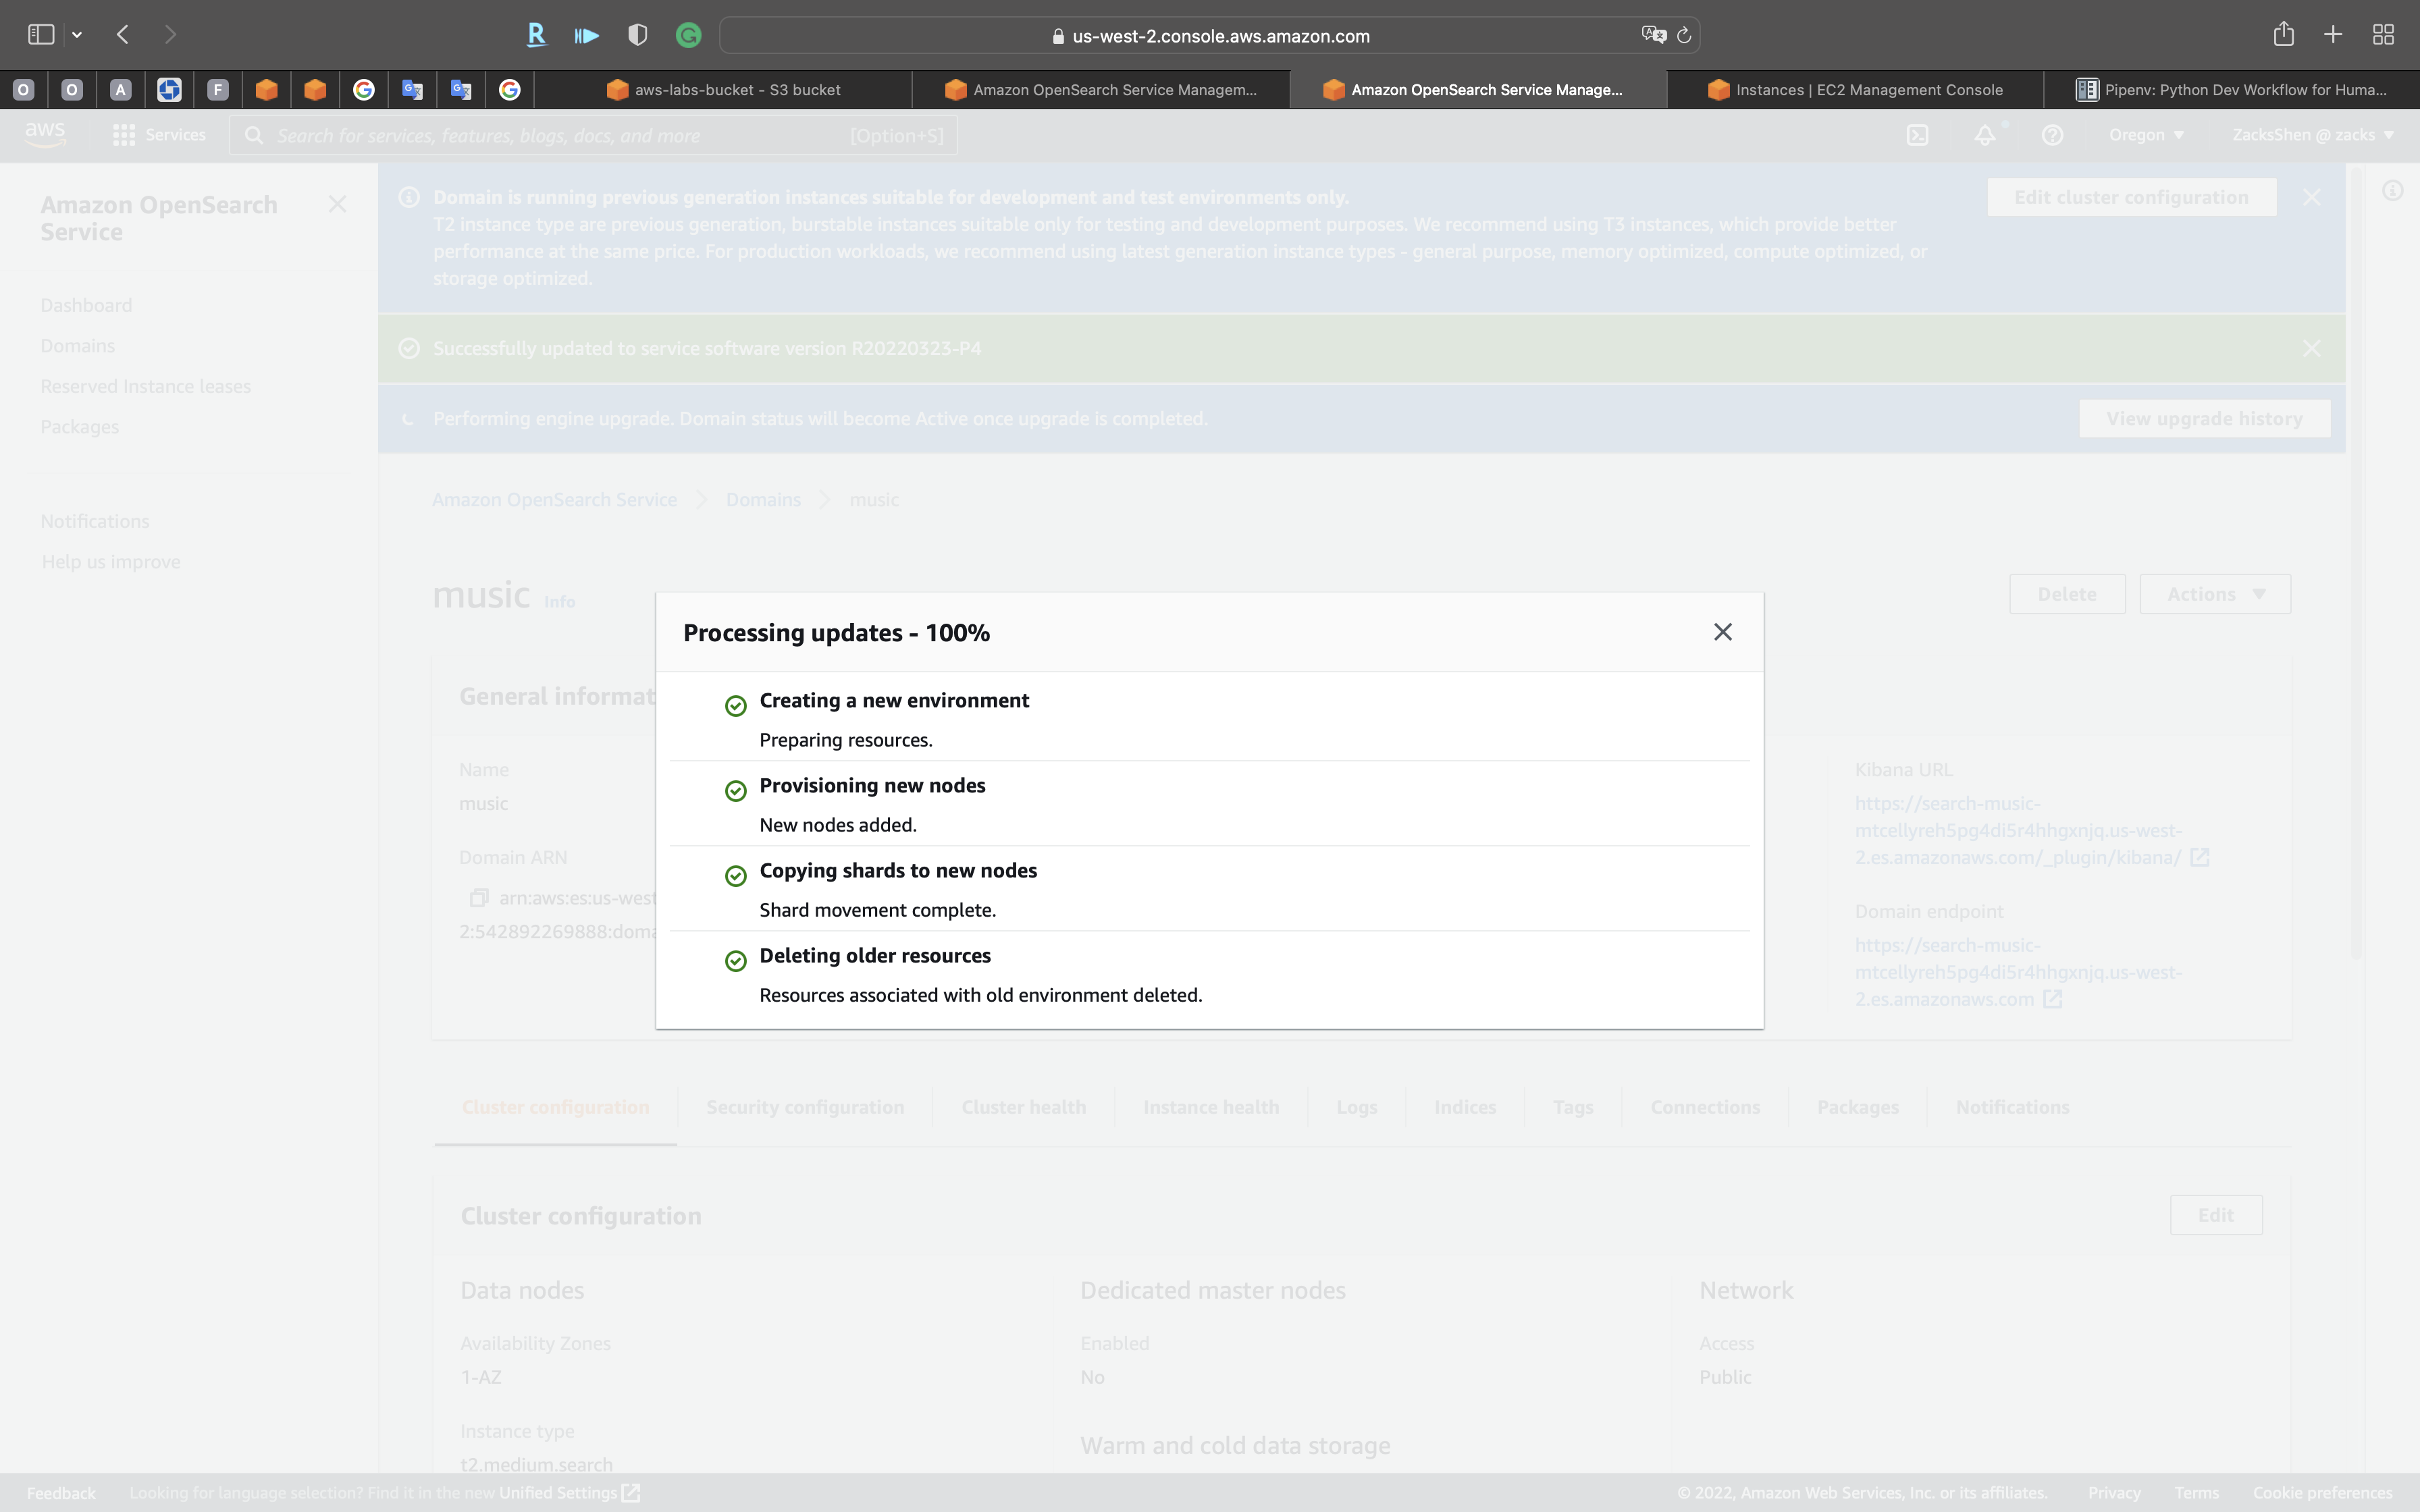
If you encounter any incompatibility in the following steps, you can upgrade your OpenSearch cluster to the latest or any version on AWS OpenSearch console.
For example, I am upgrading my OpenSearch cluster from 6.2 to 6.8 for enabling Fine-grained access control under security configuration for public access.
Kibana Configuration
Services -> OpenSearch Service
Click on Domains -> music -> Security configuration
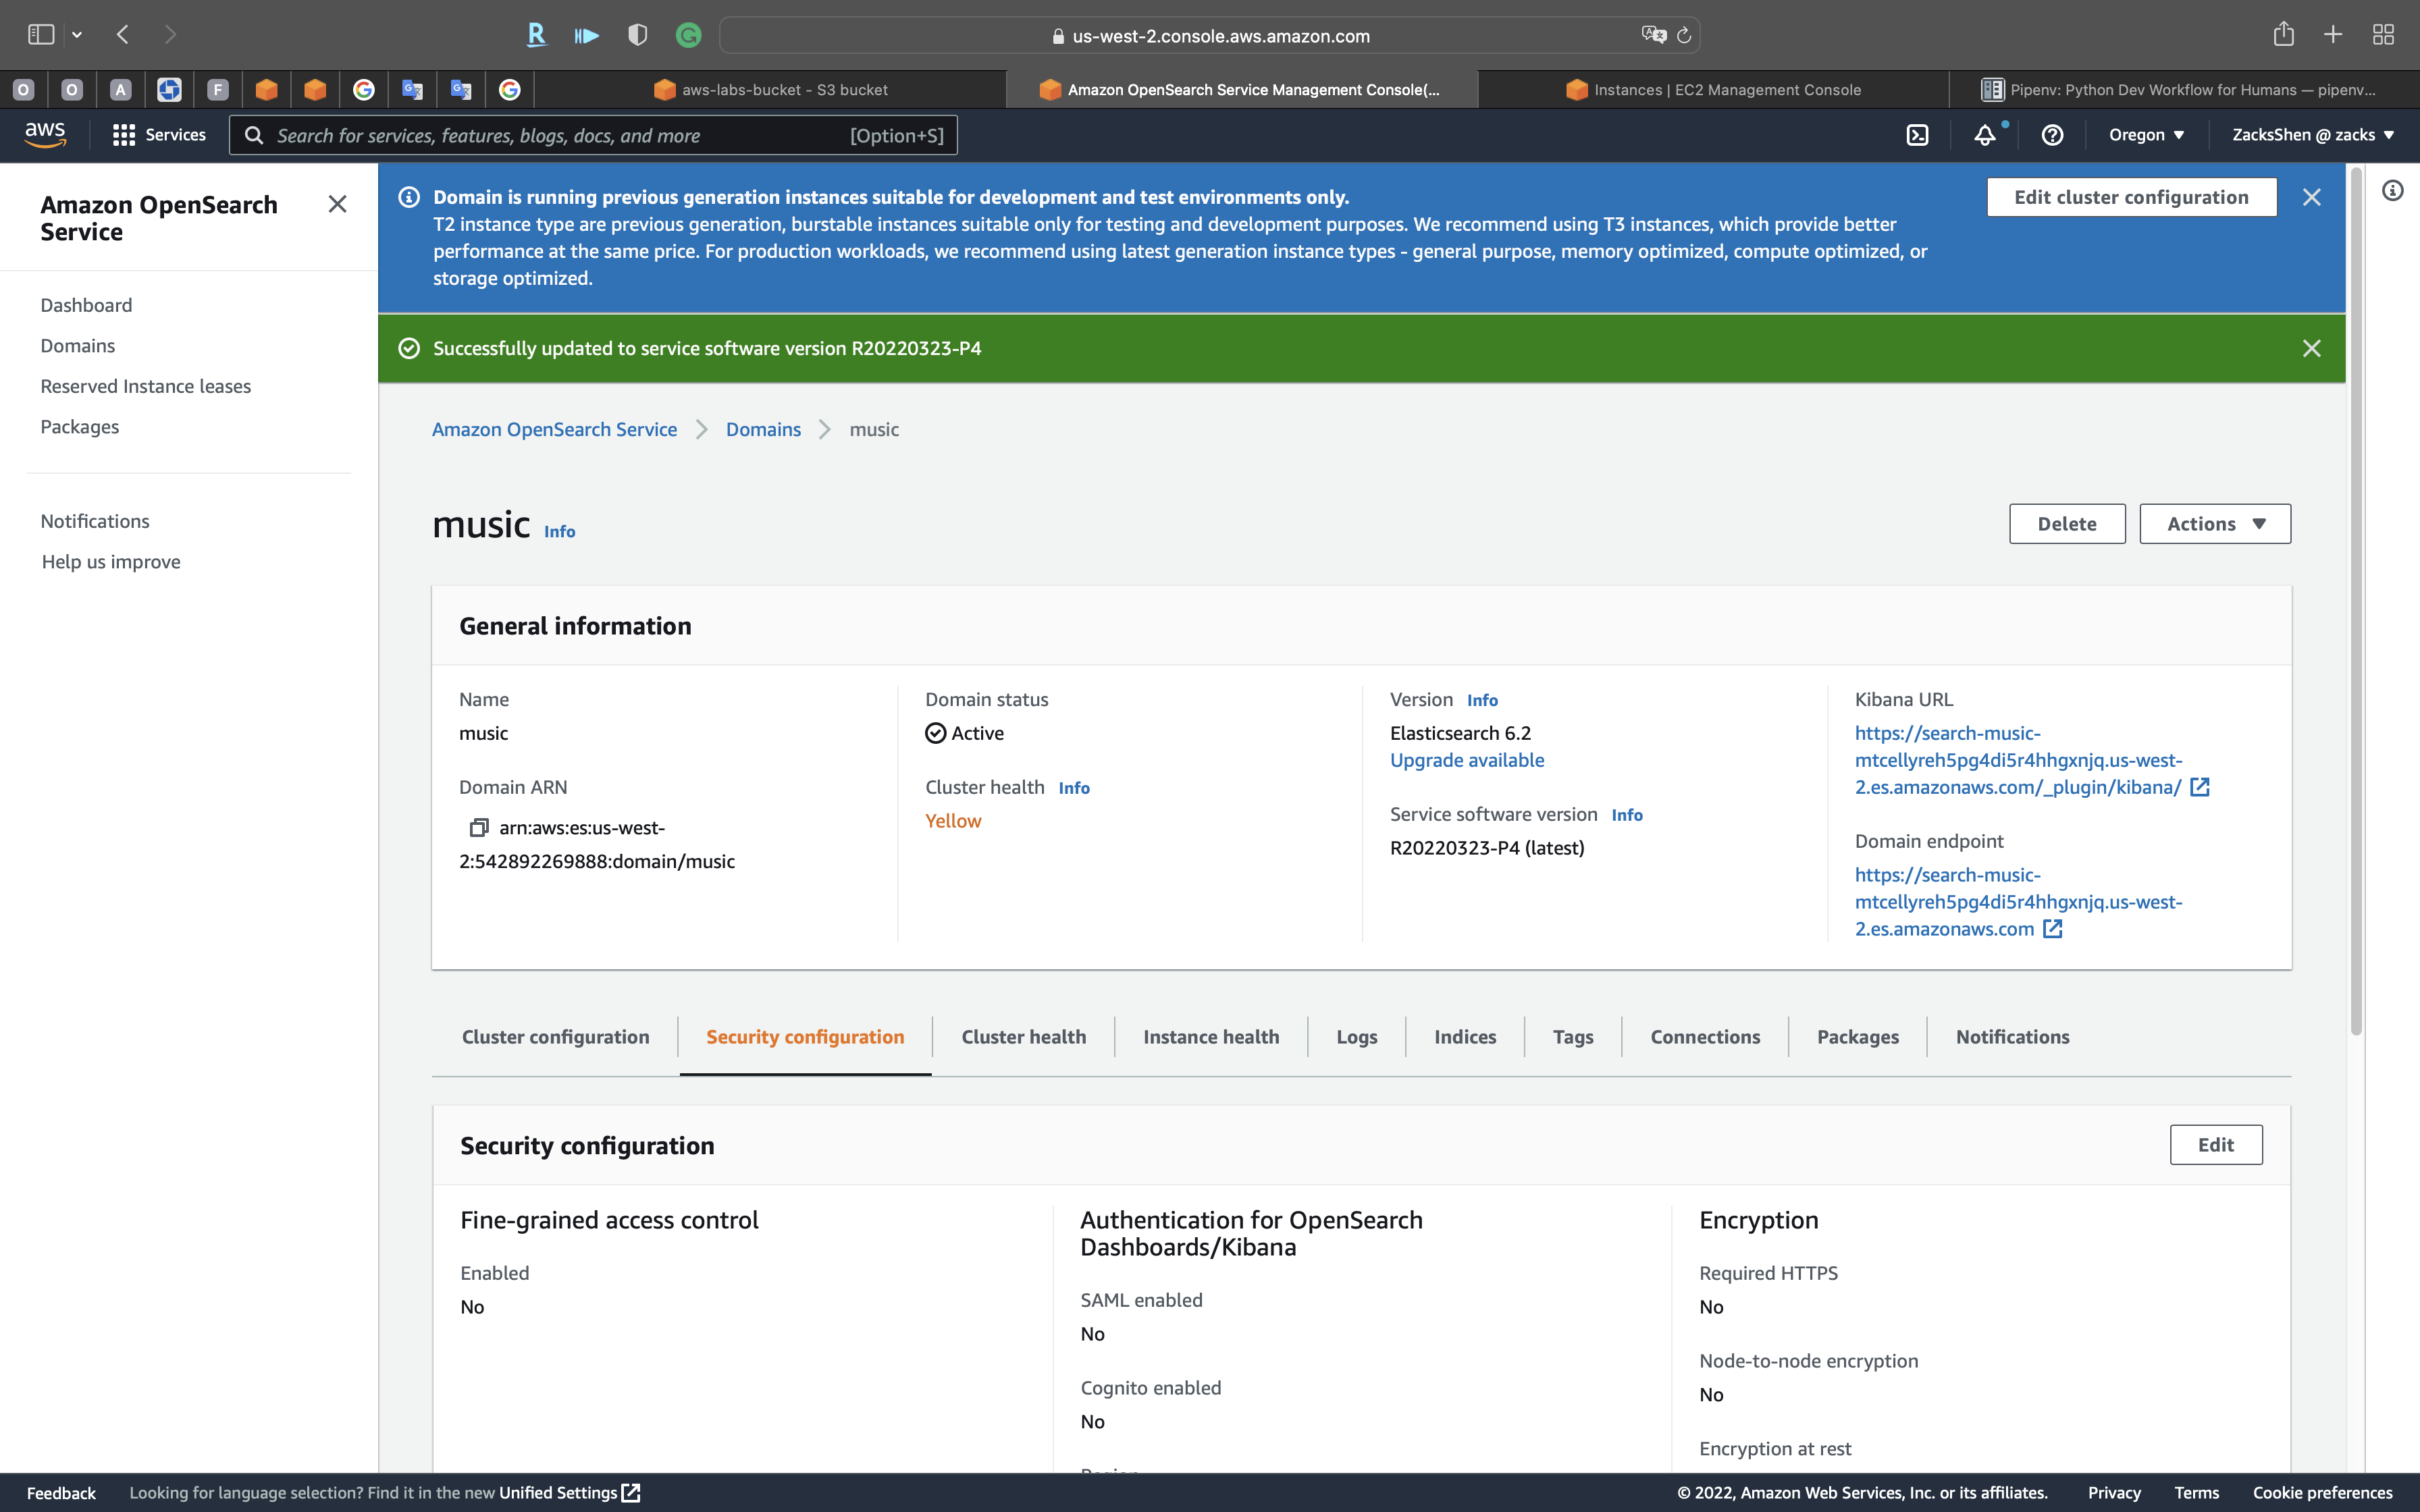
Click on Edit under Security configuration
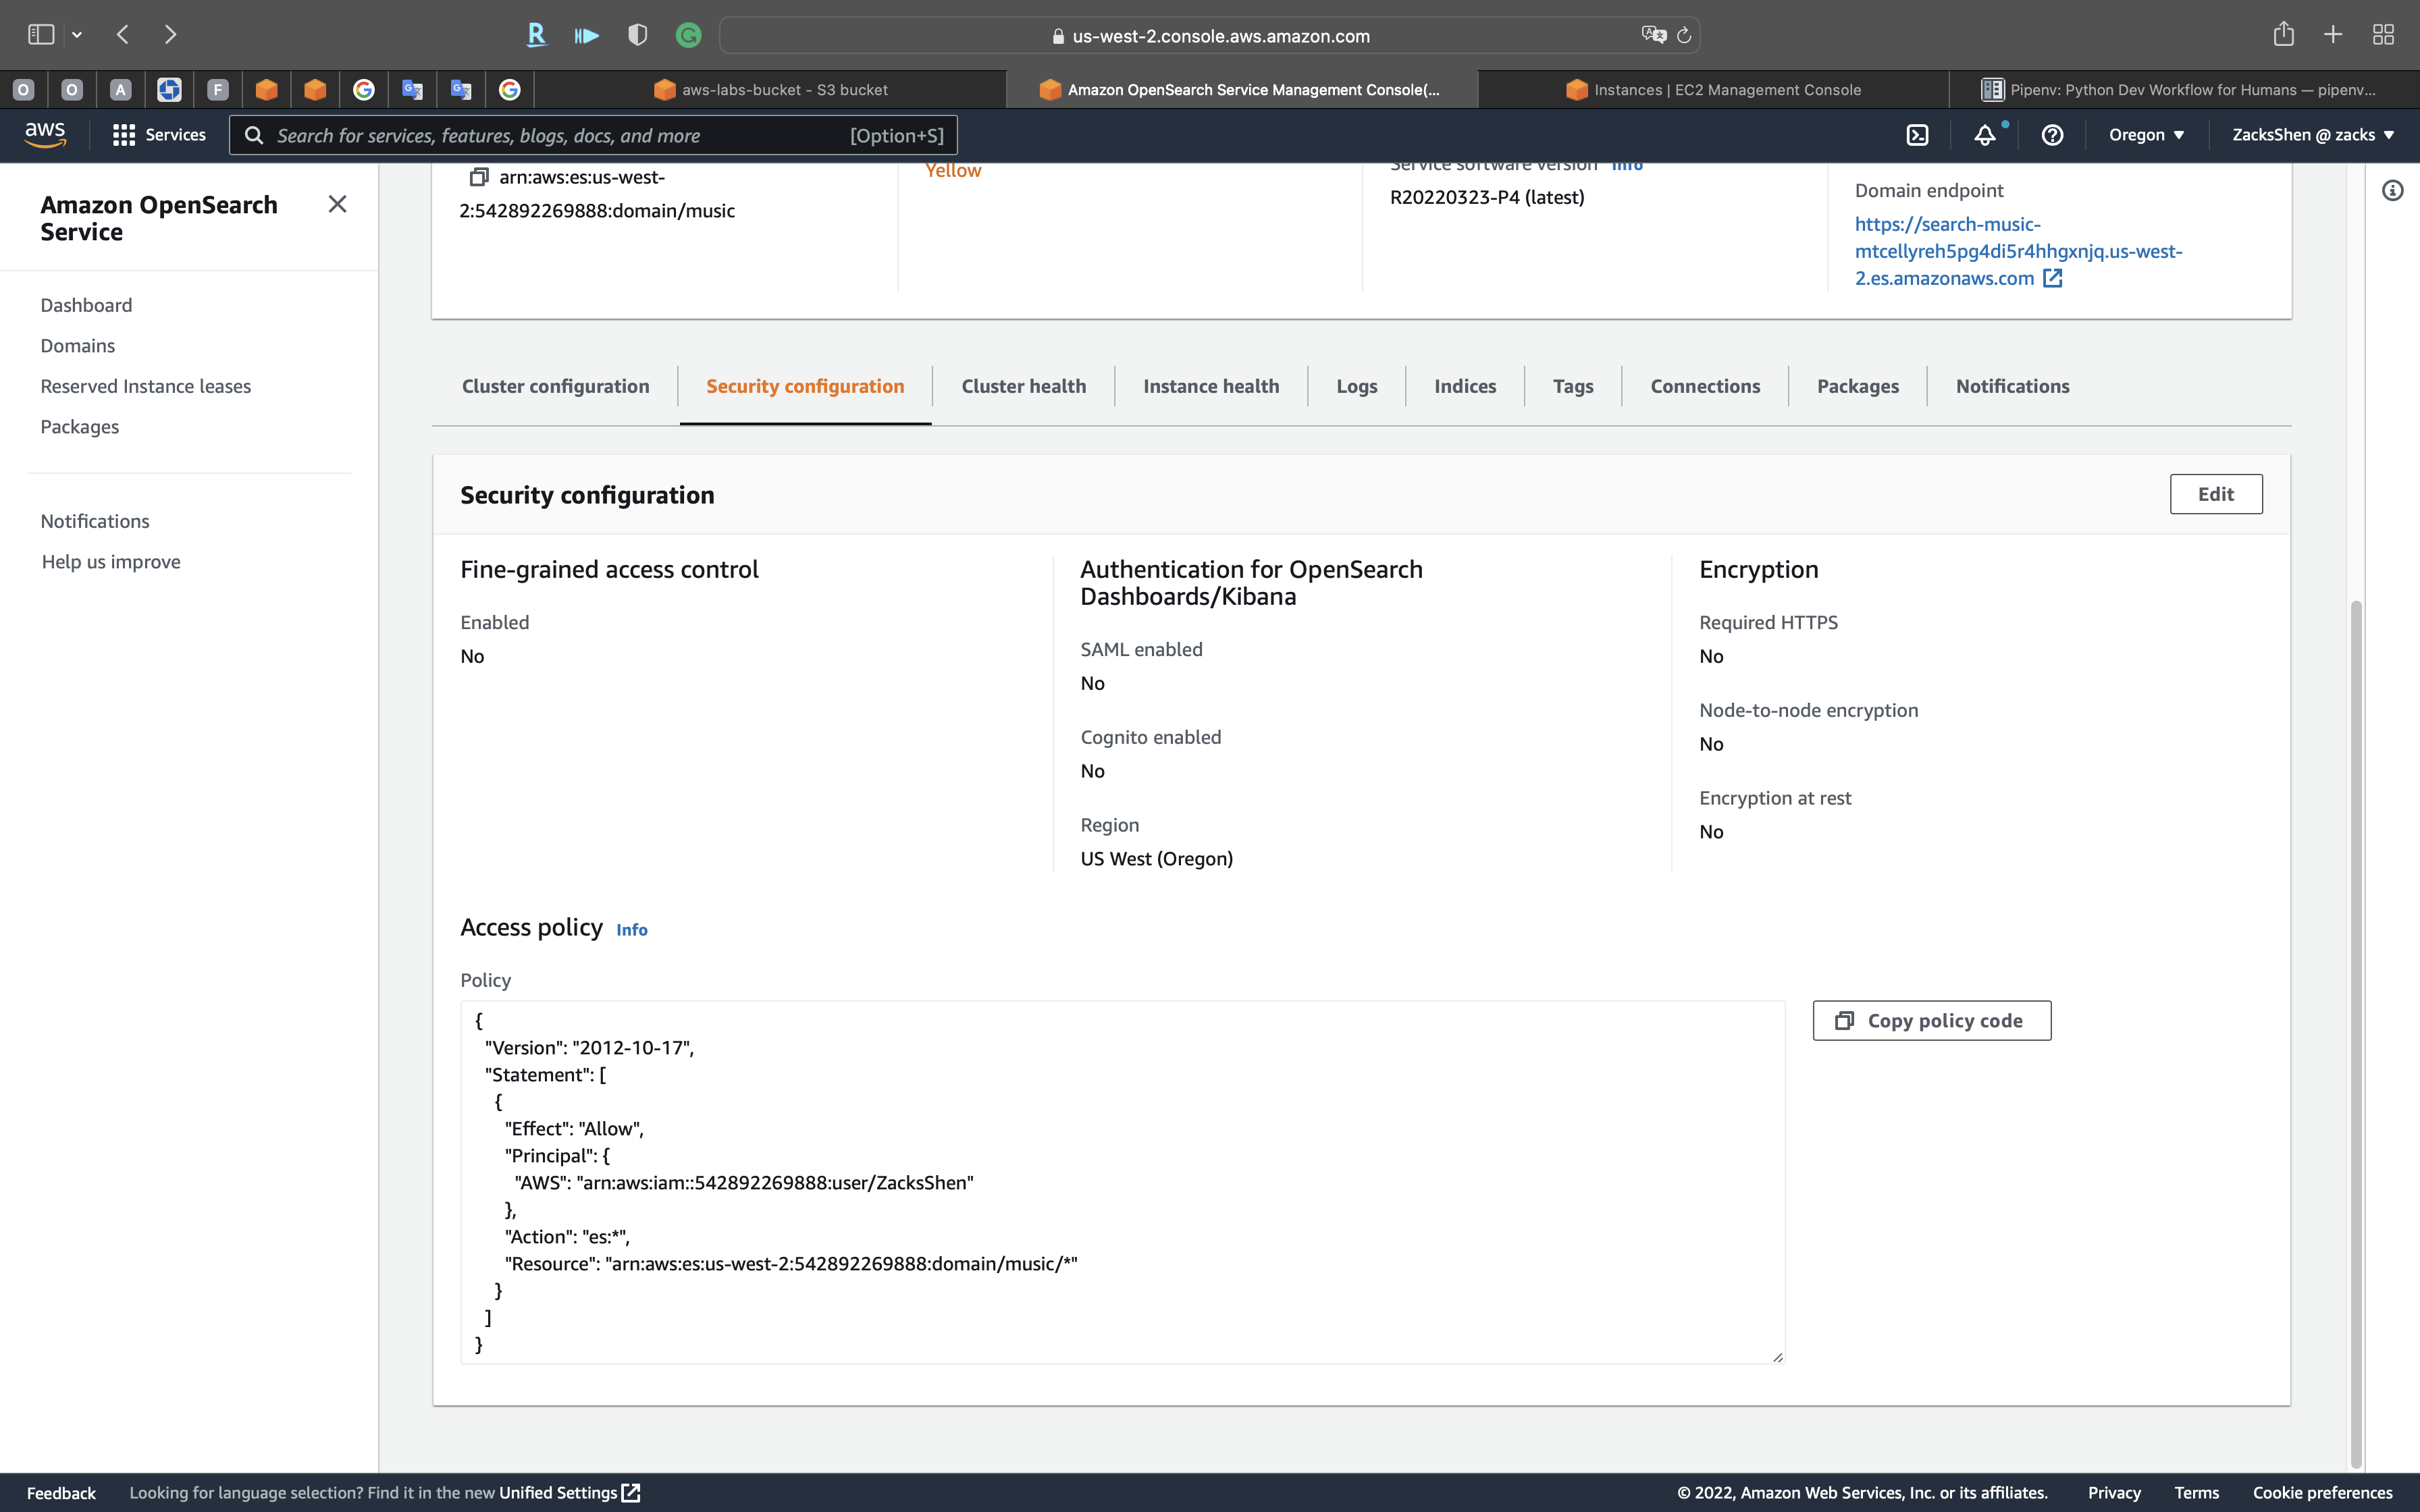
Access policy
I get a “User: anonymous is not authorized” error when I try to access my Amazon OpenSearch Service cluster
Identity and Access Management in Amazon OpenSearch Service - IP-based policies
Domain access policy:
Configure domain level access policyEffect: “Allow”AWS:*or your IAM user arn.Resource: No need to change. It should be your recourse.aws:SourceIp: Your local computer public IP address.
1 | { |
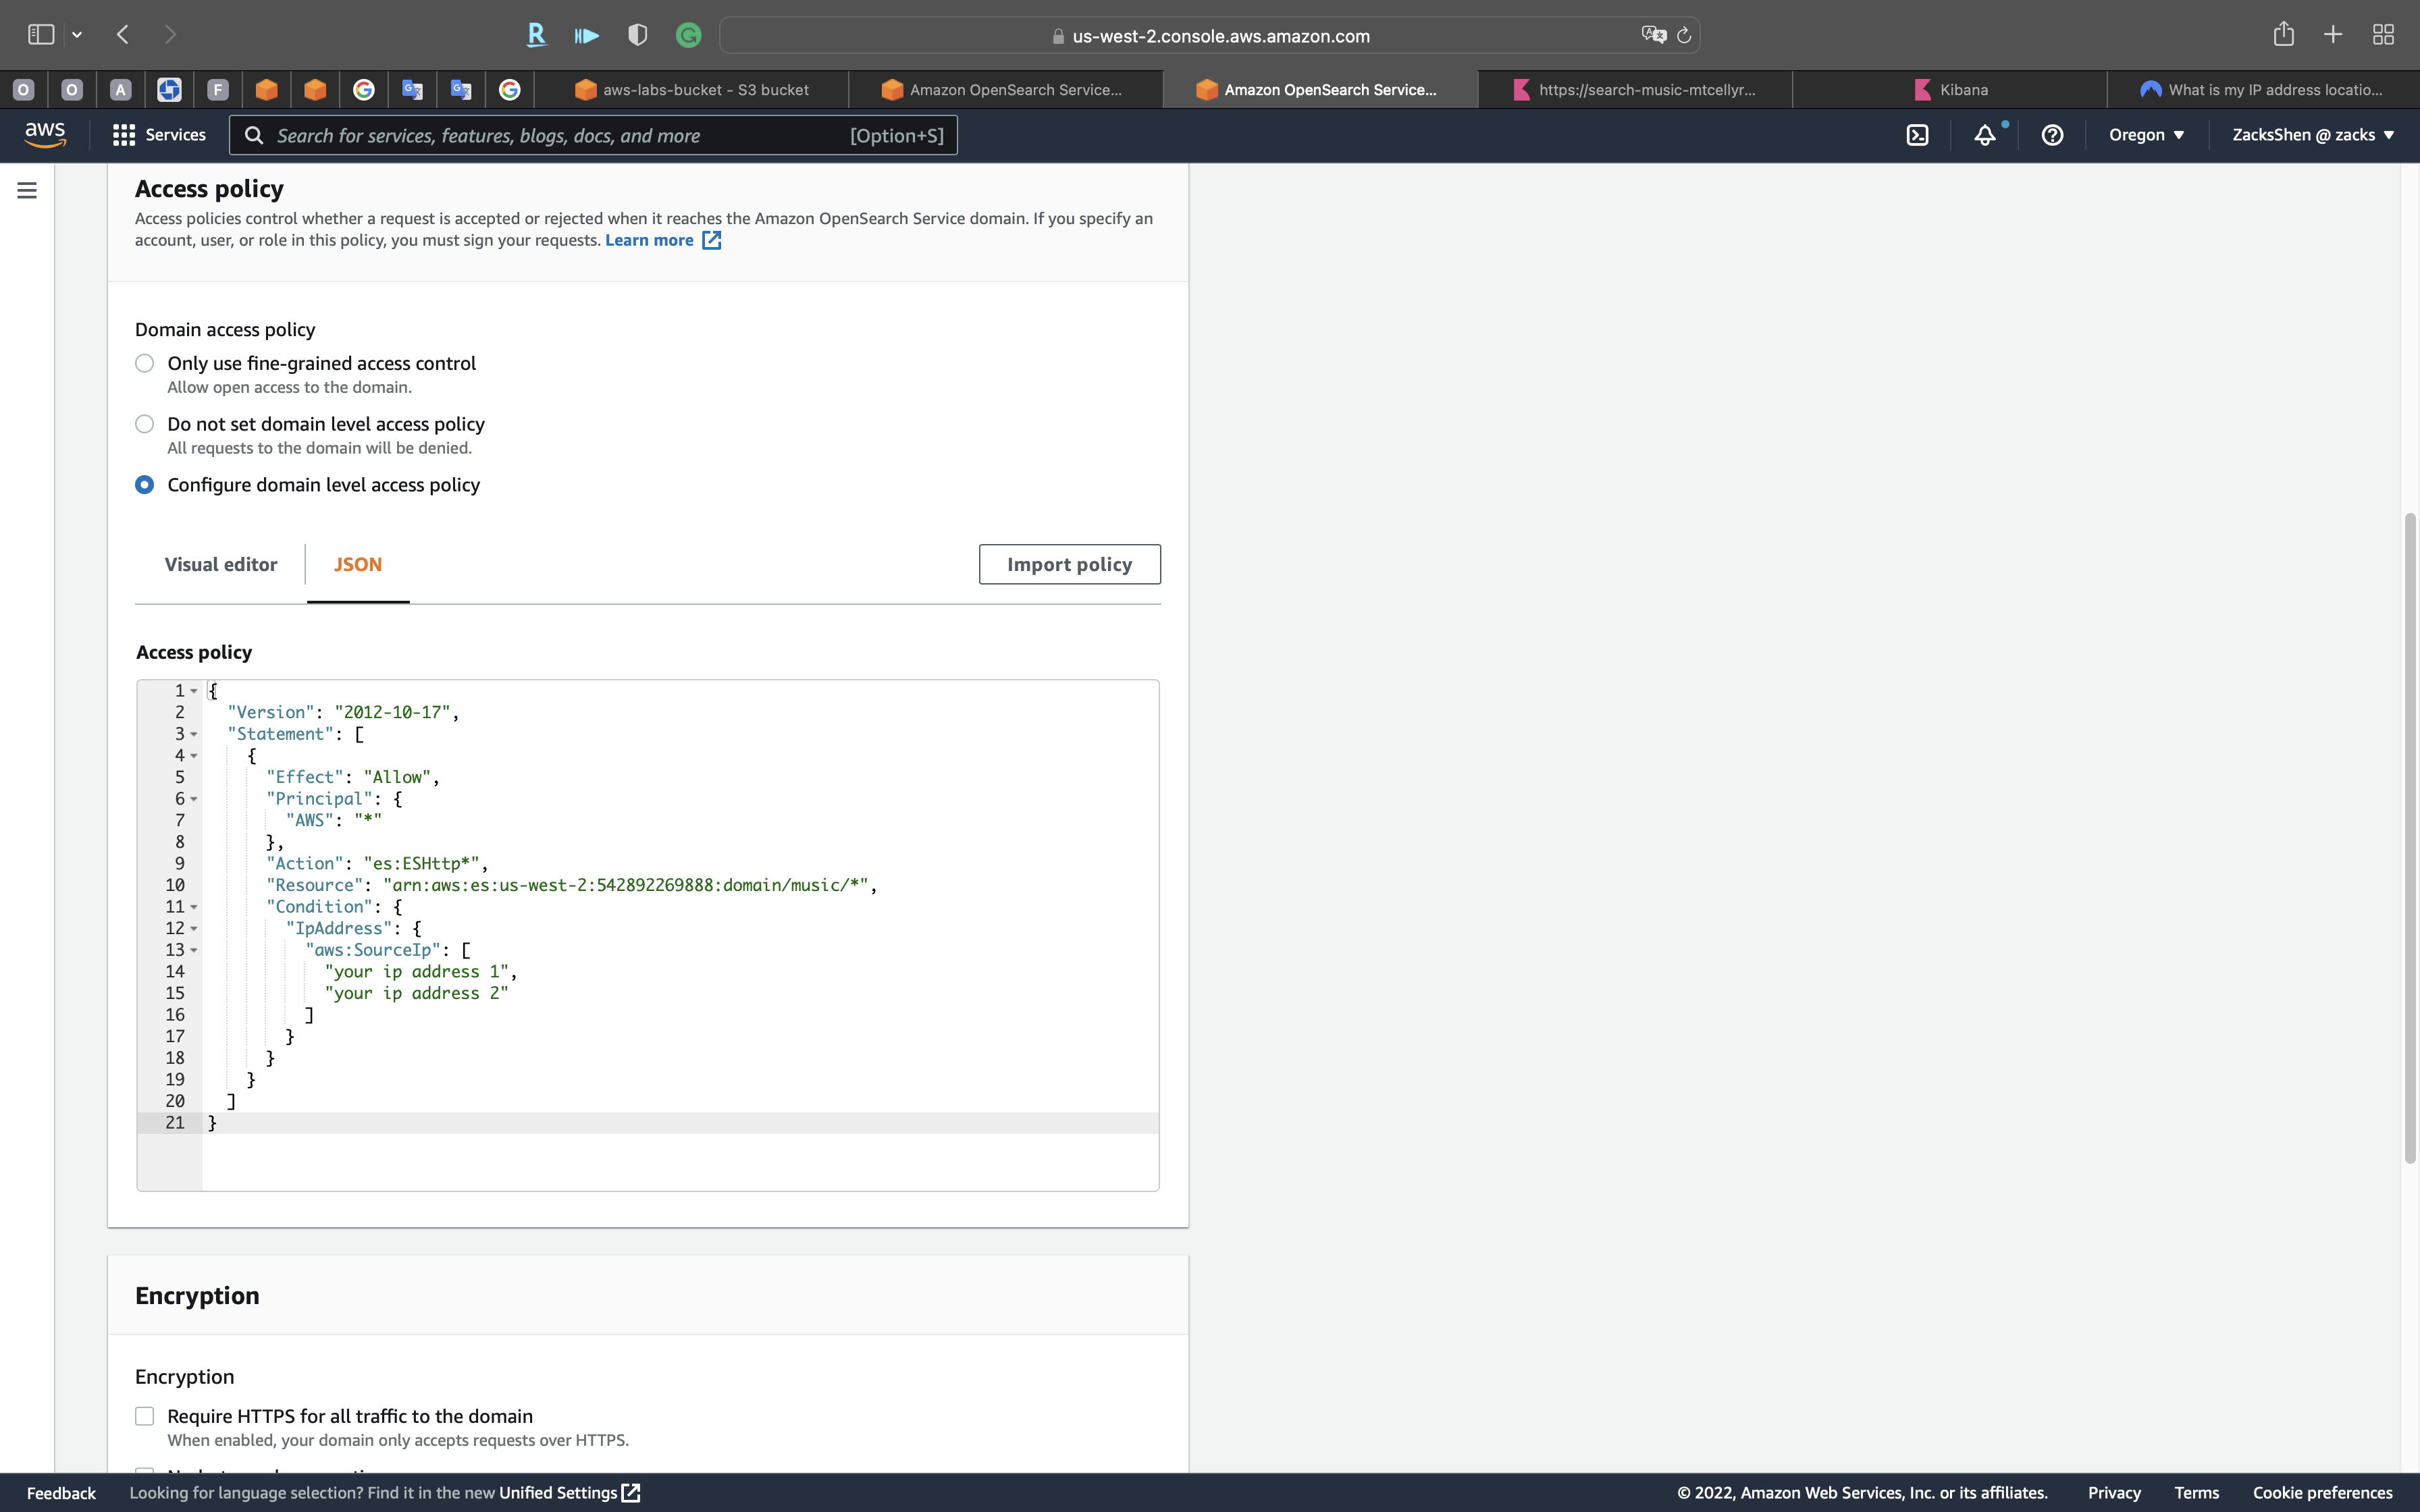
Click on Save changes
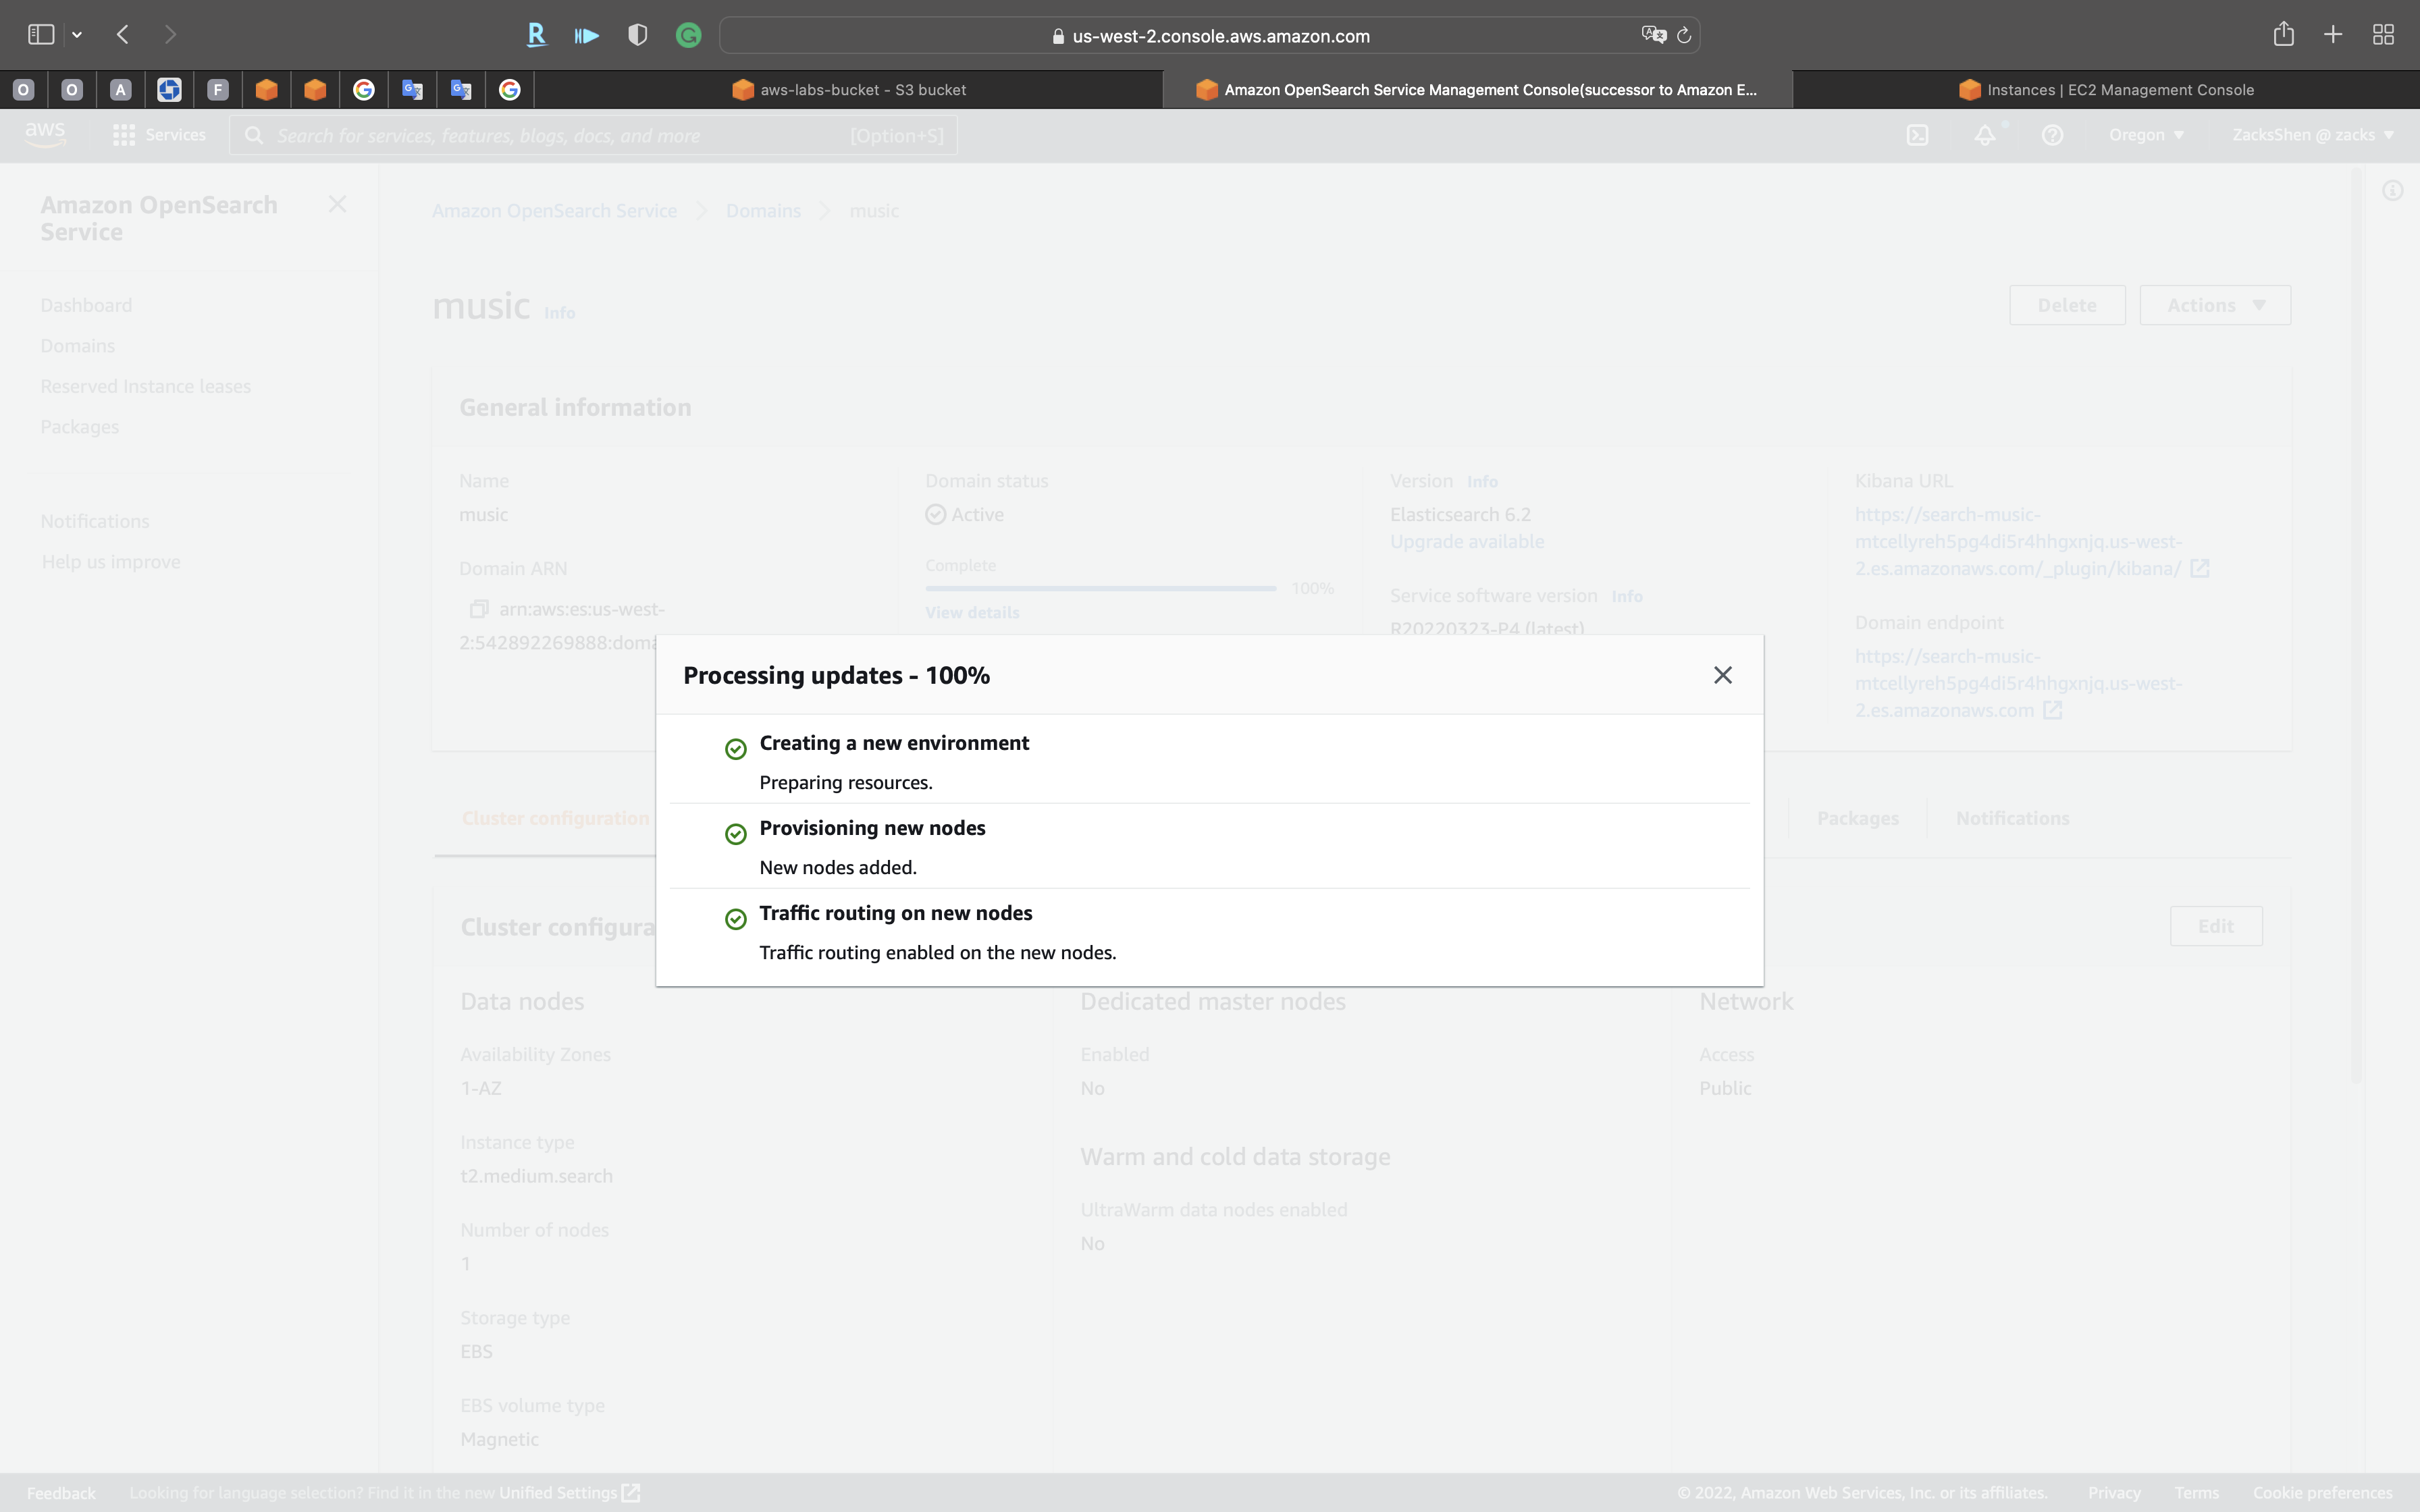
Wait until the Domain status switches from Processing to Active.
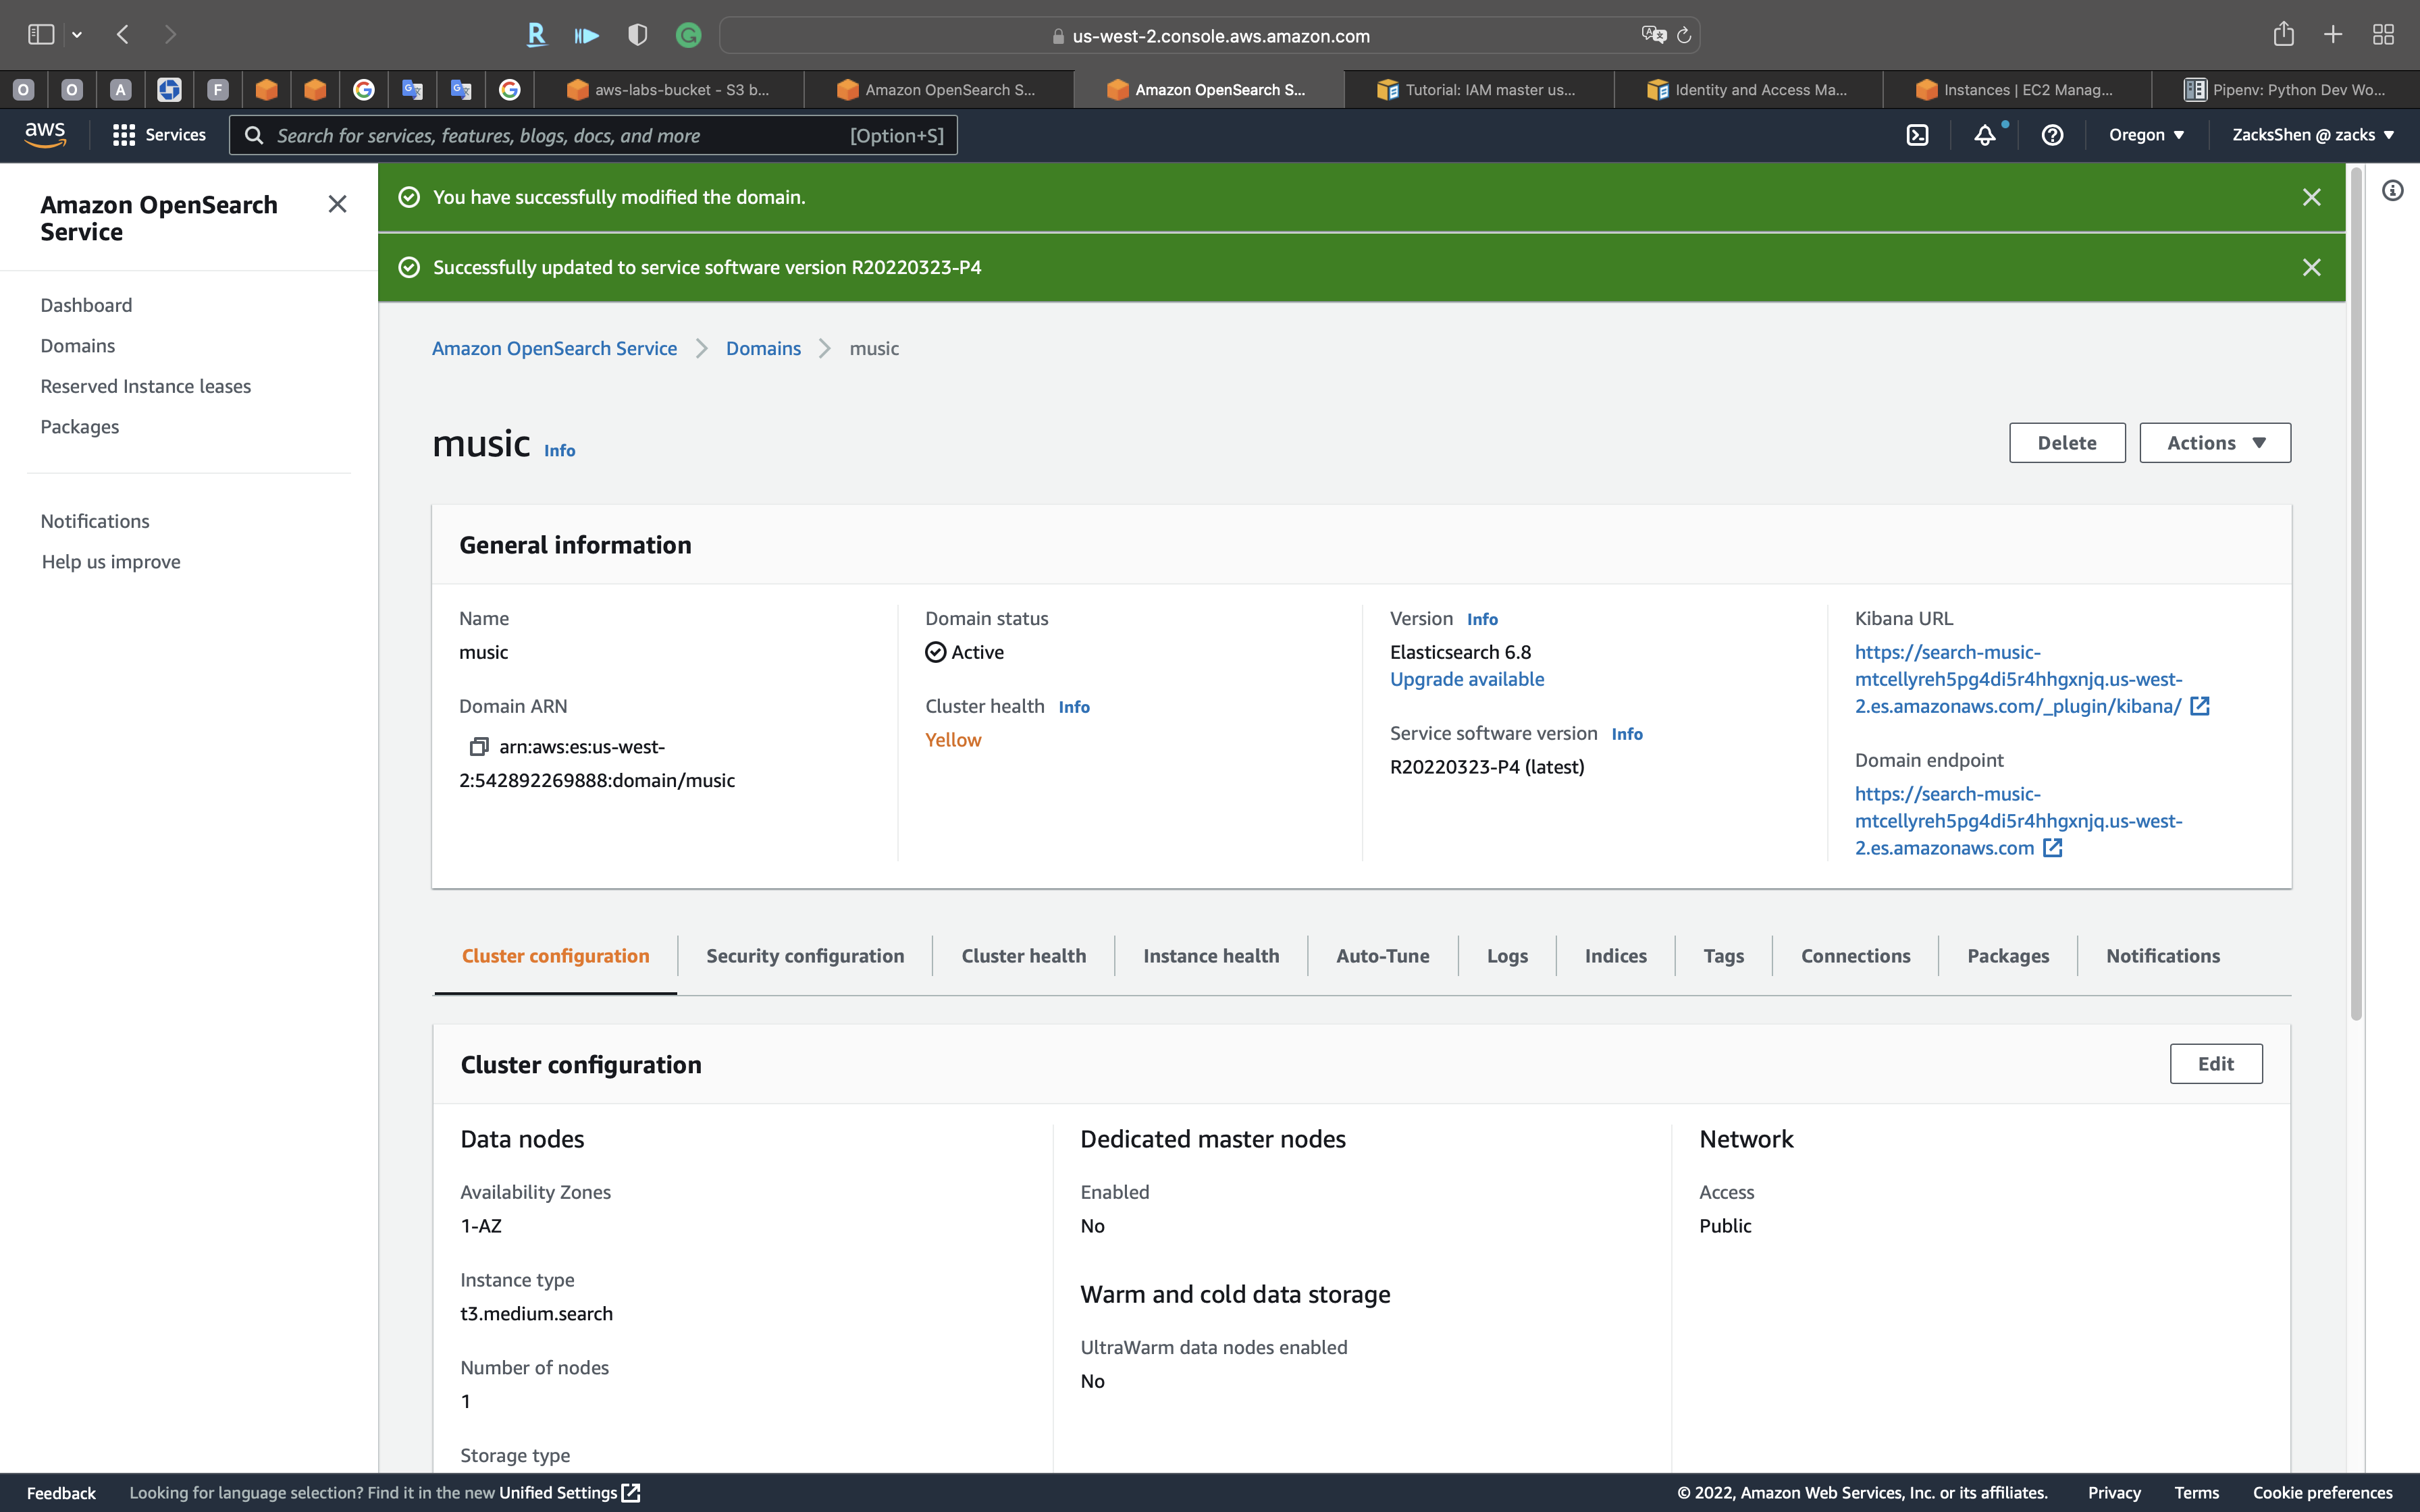
Click on Domain endpoint.
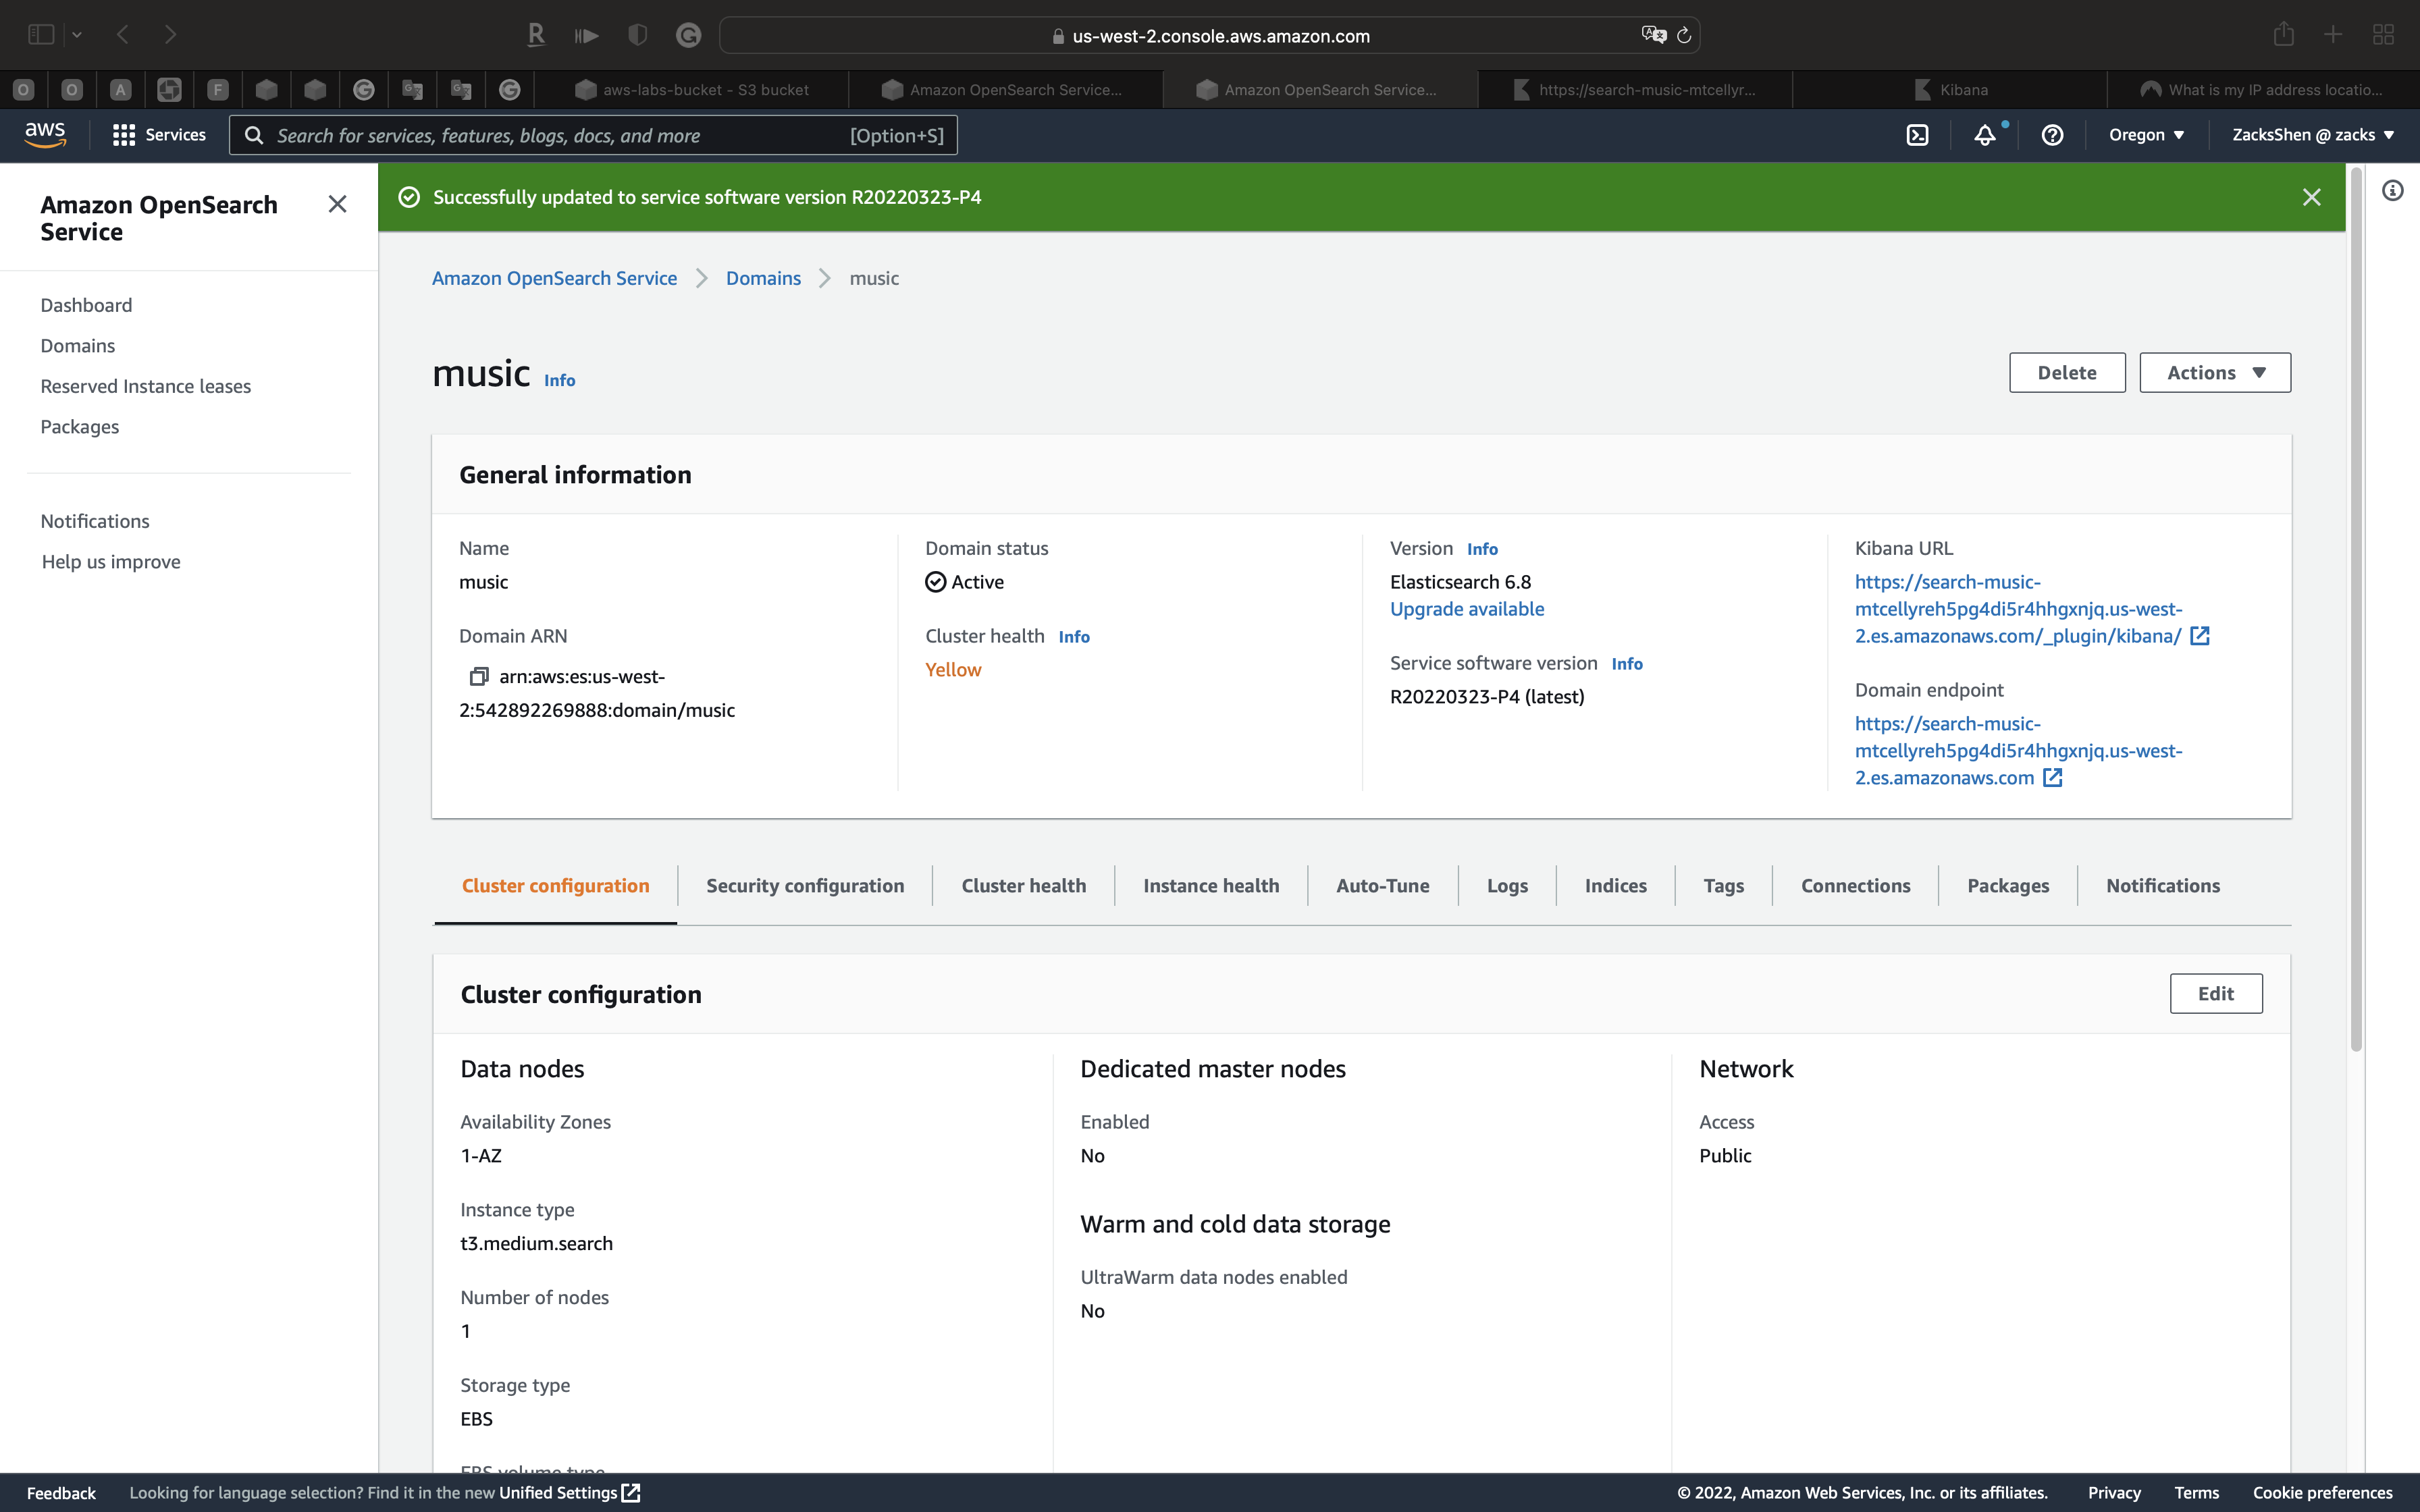
The page should be like:
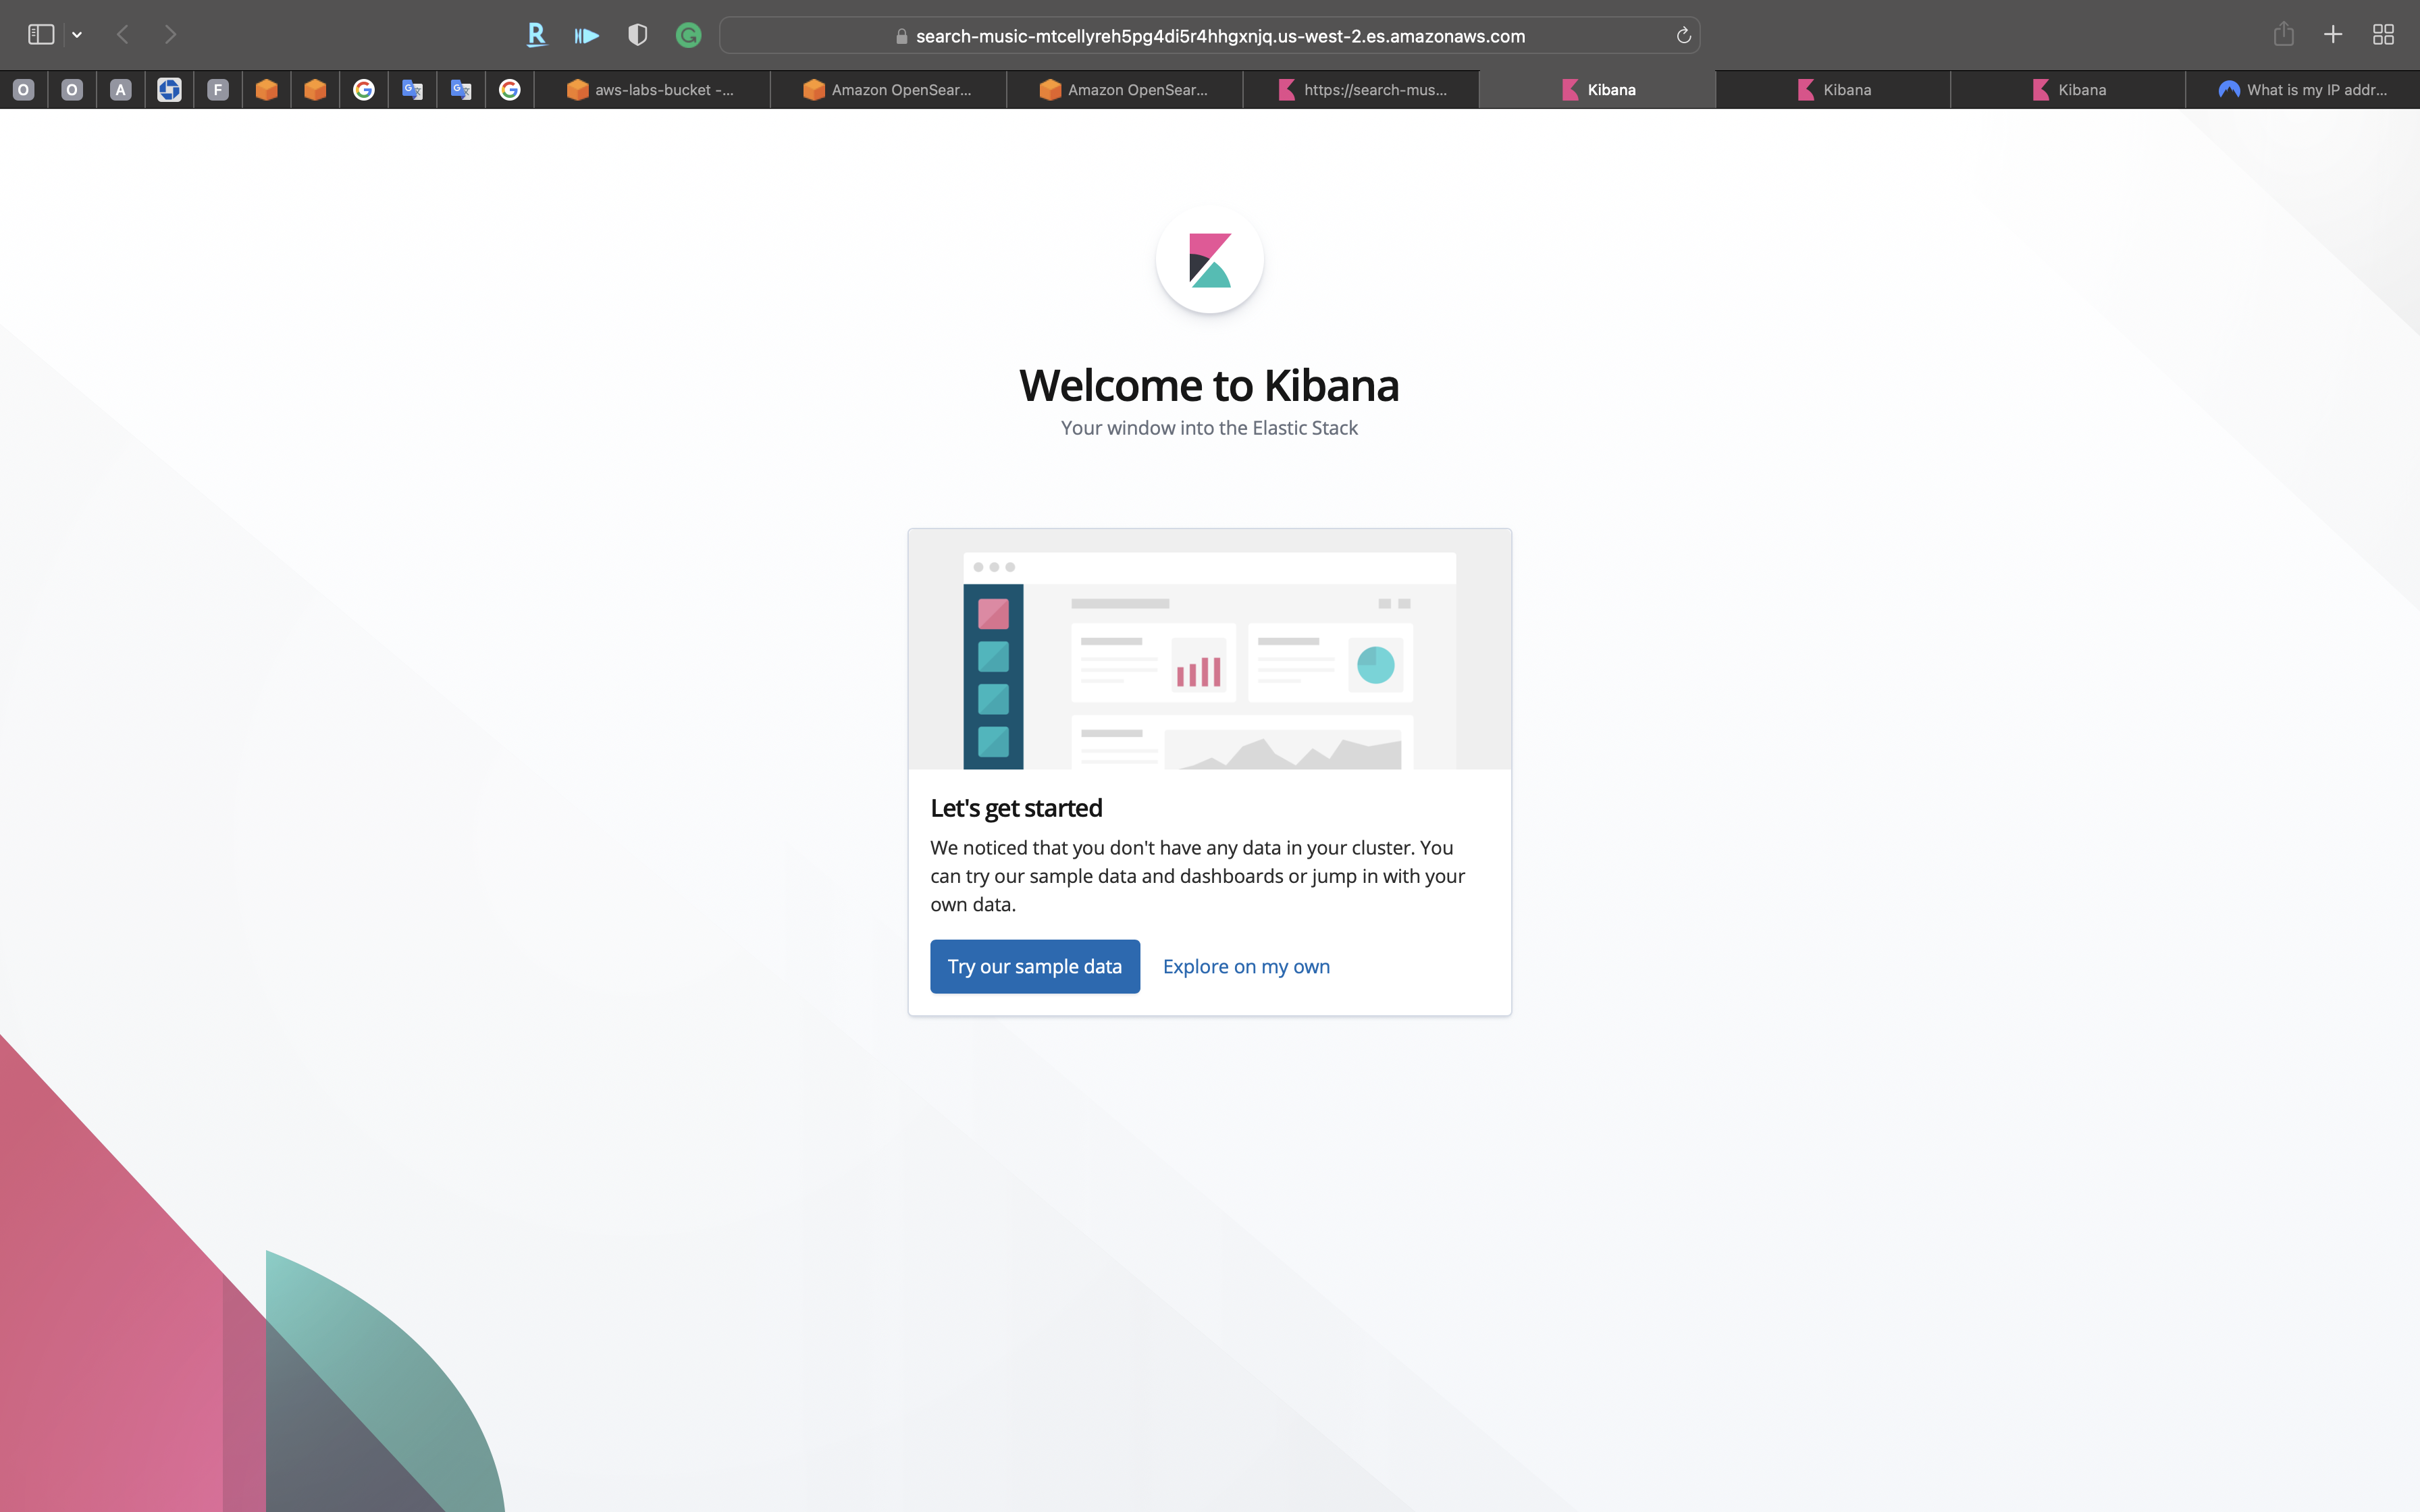
Click on Kibana URL.
Click on Explore on my own
Click on Discover on the navigation panel
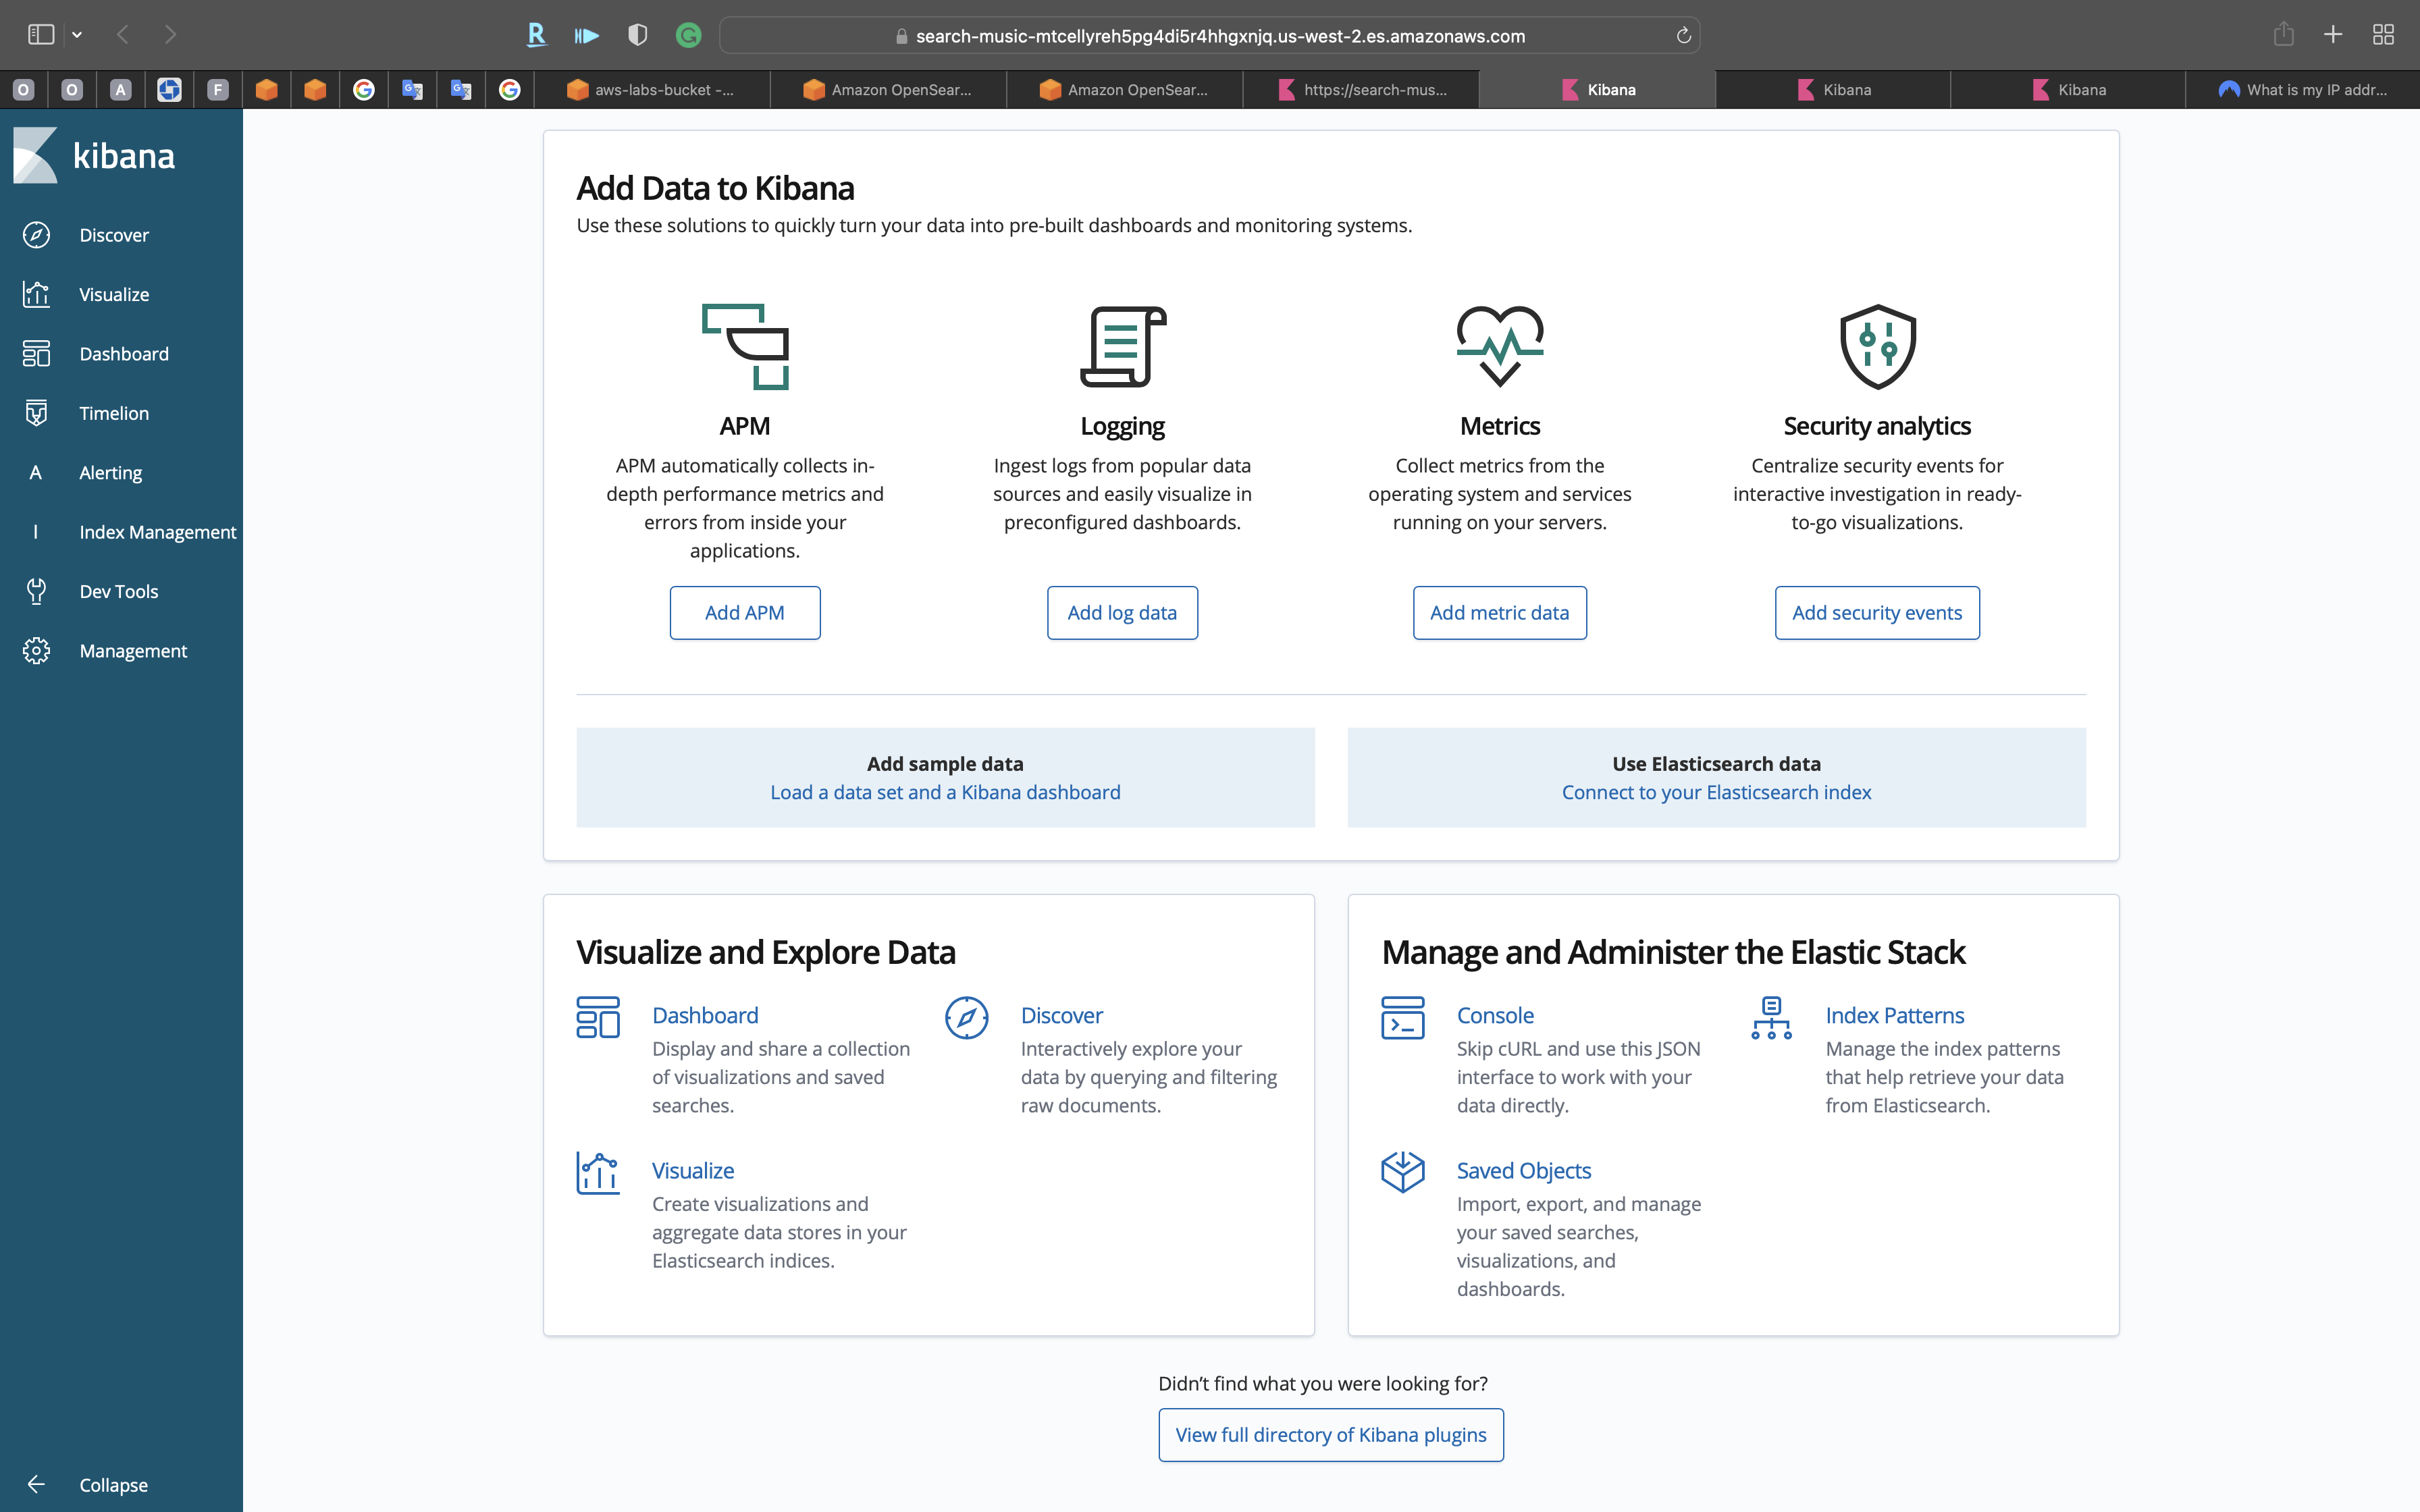
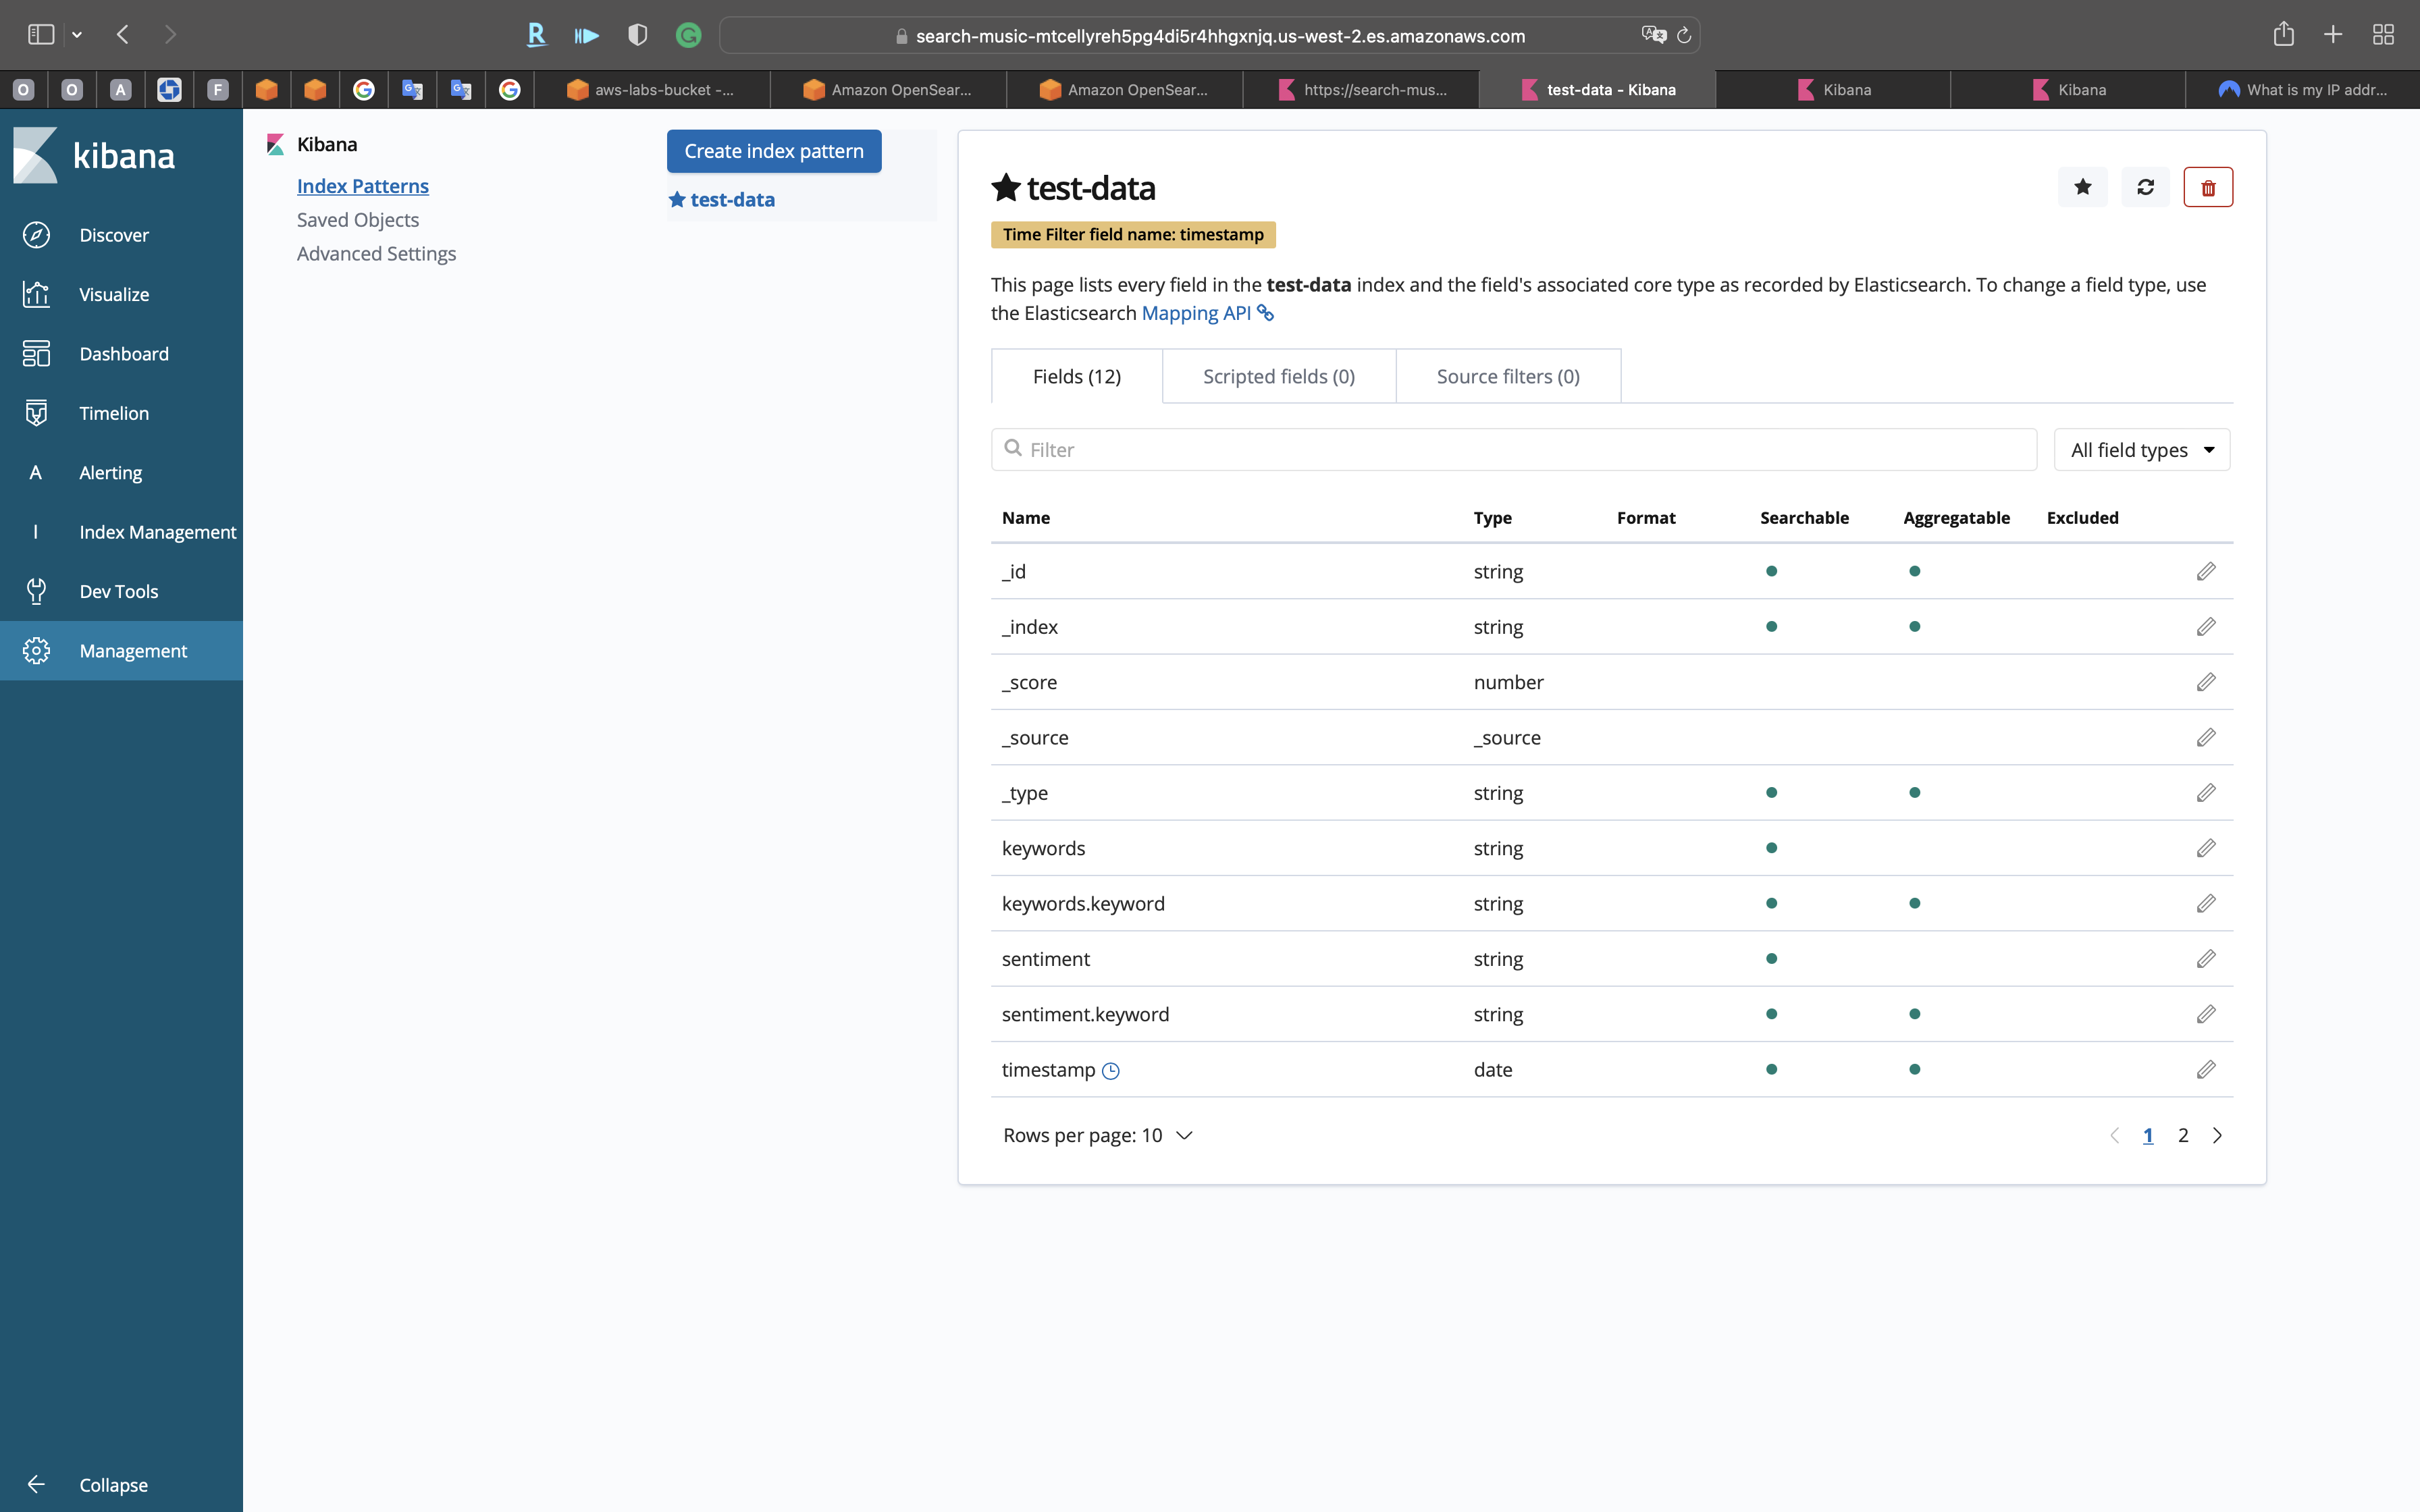
Discover
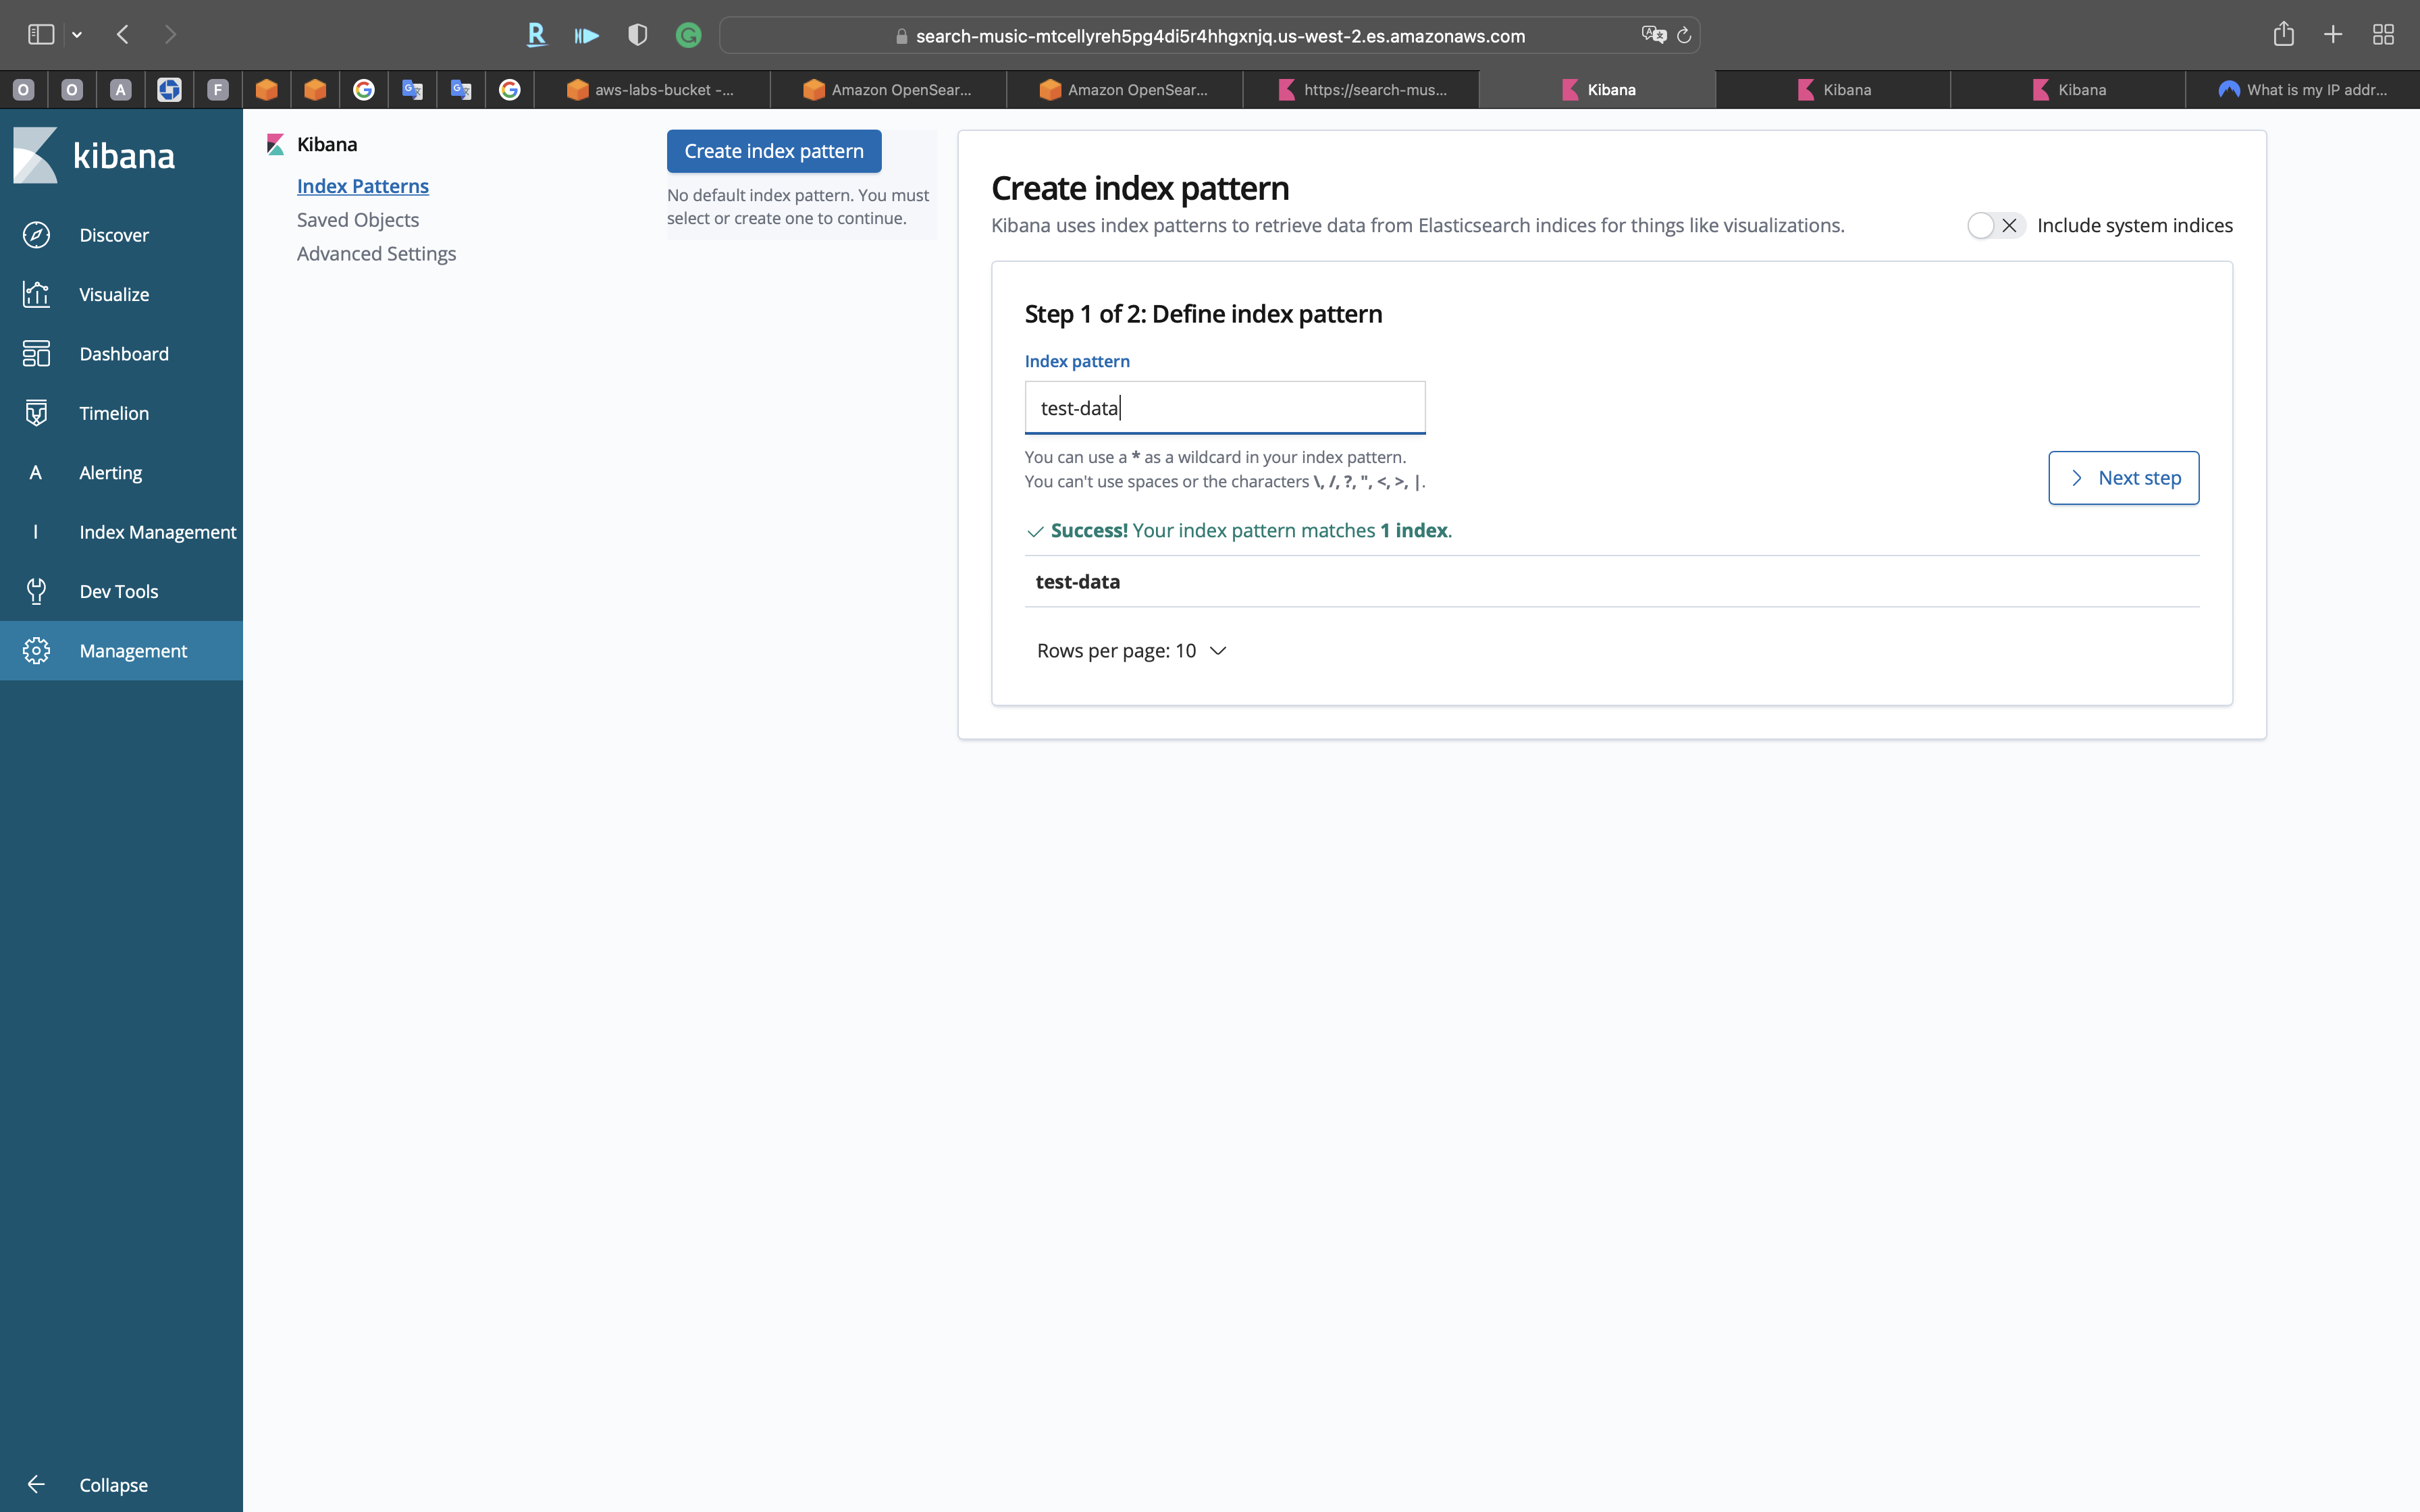
- Index pattern:
test-data*
Click on Next step
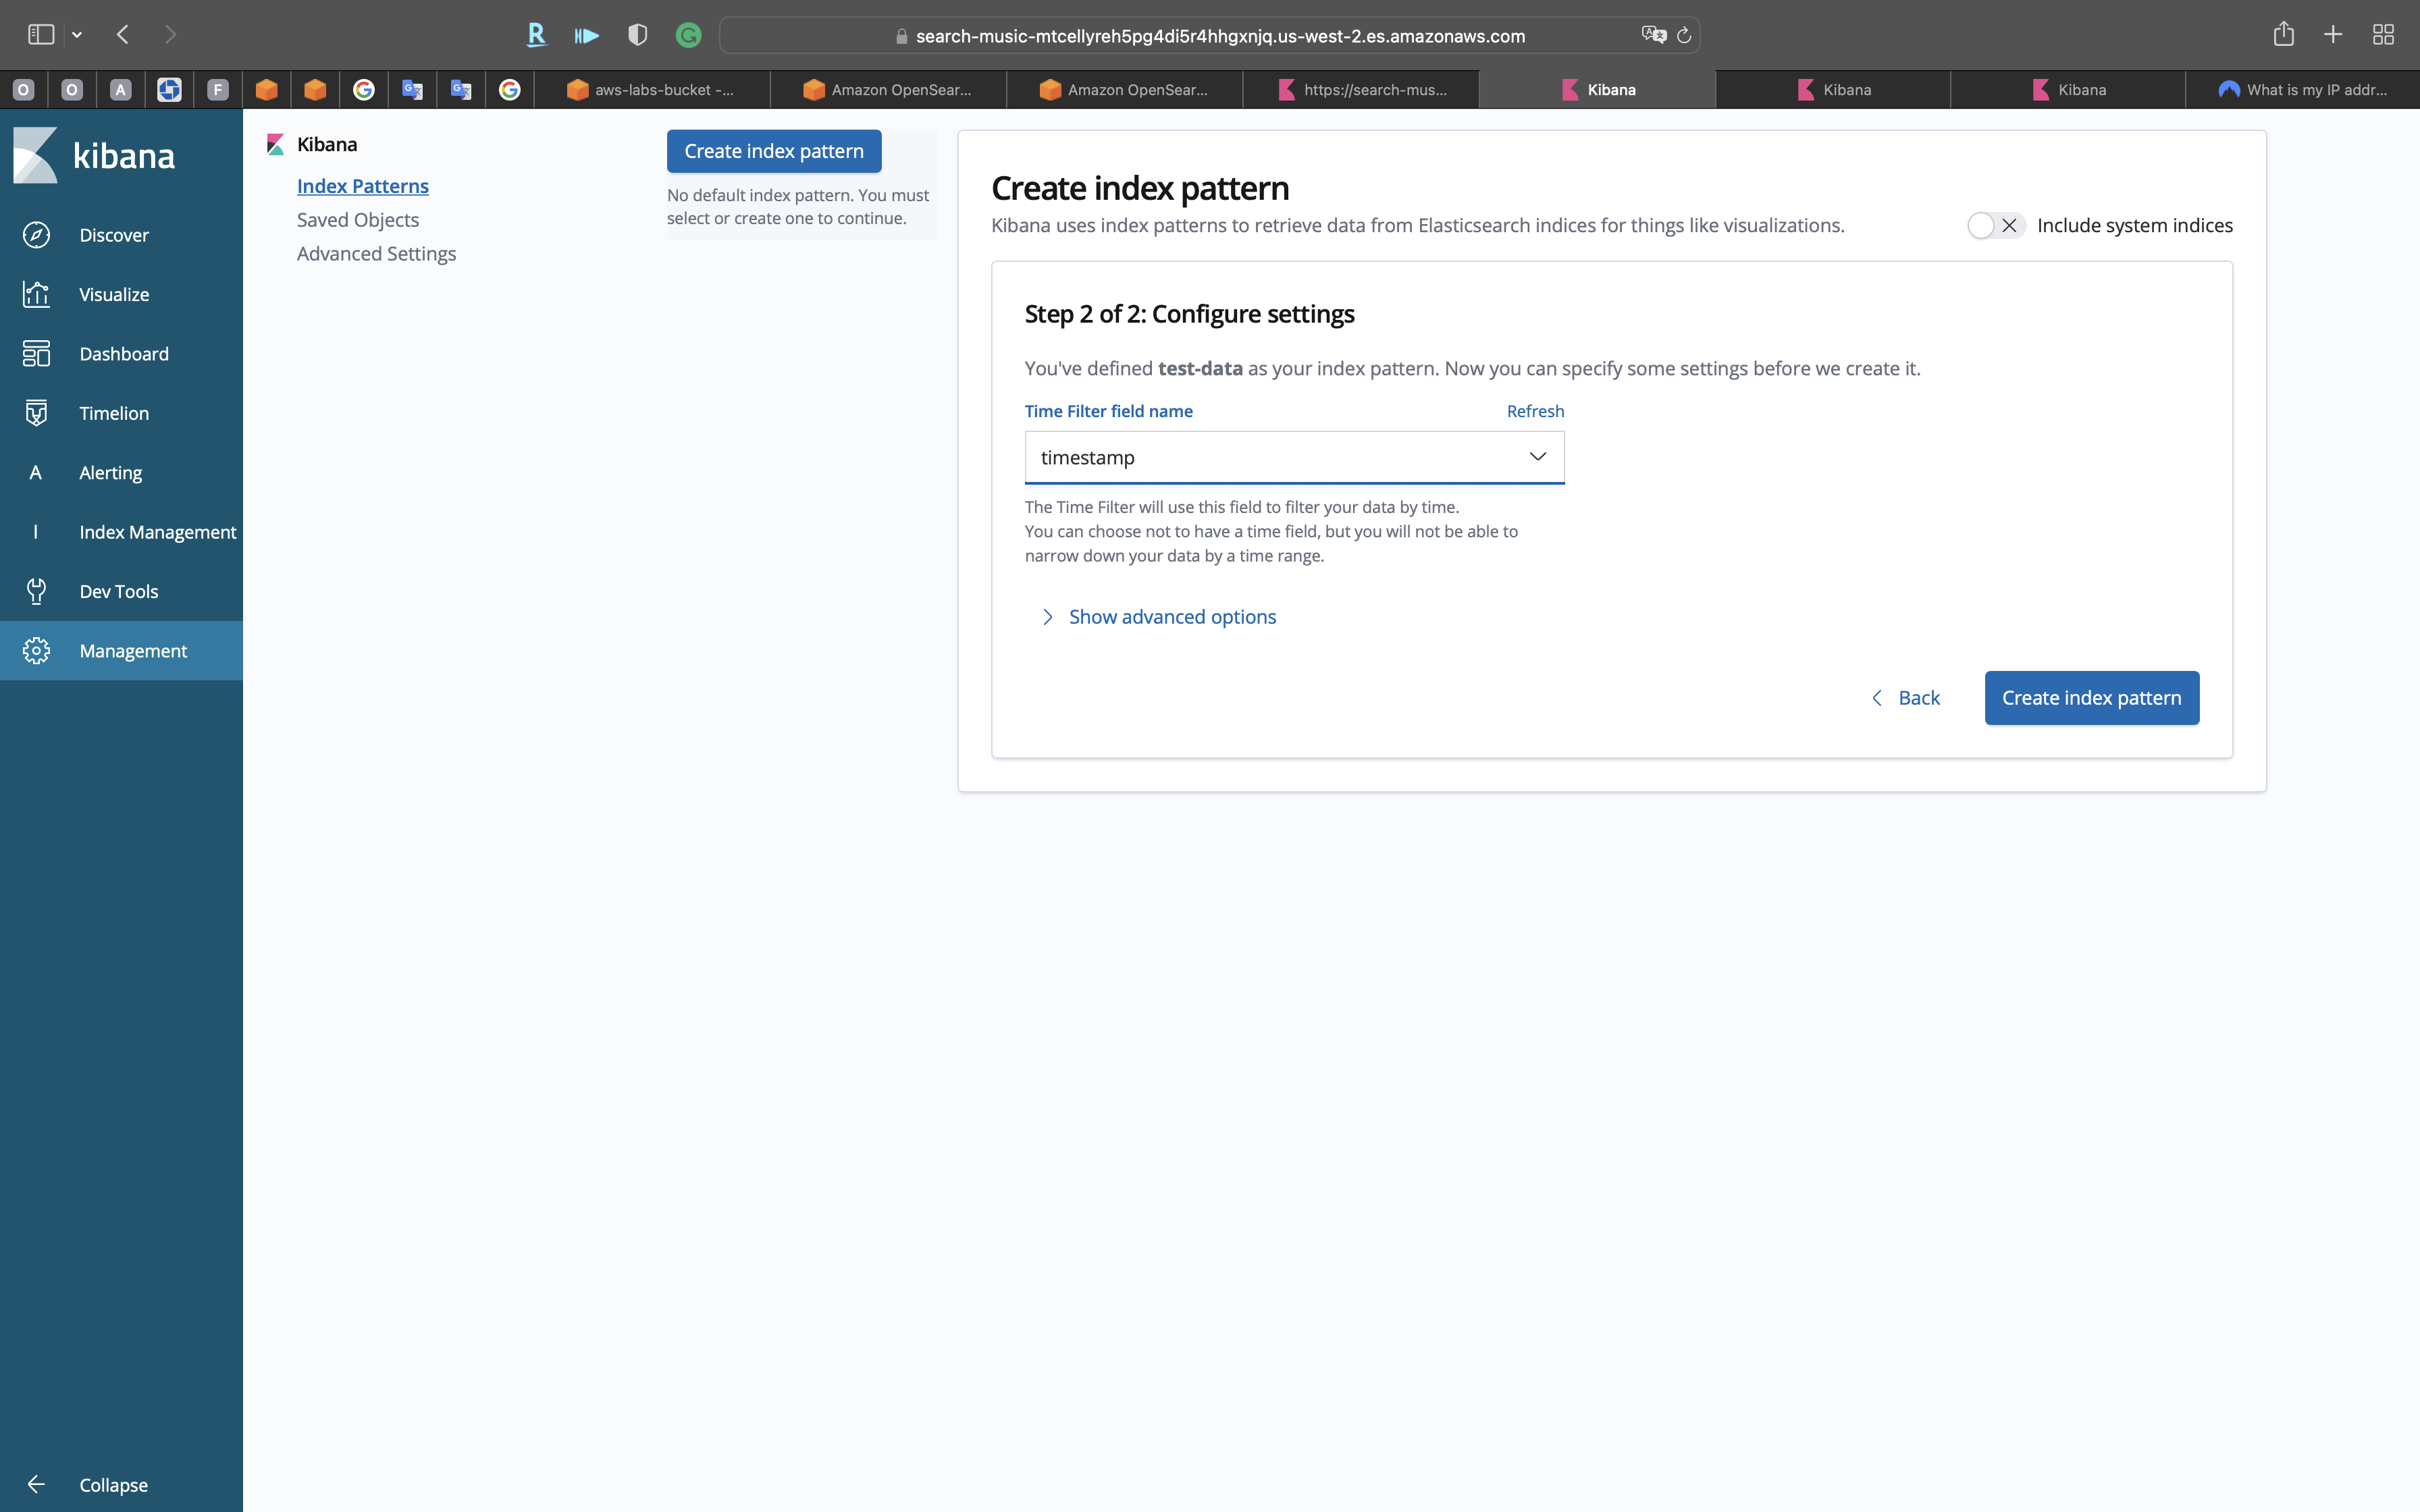
- Time Filter field name:
timestamp
Click on Create index pattern
You can see the indexes of the data that we uploaded to OpenSearch.
Click on Discover on the navigation panel.
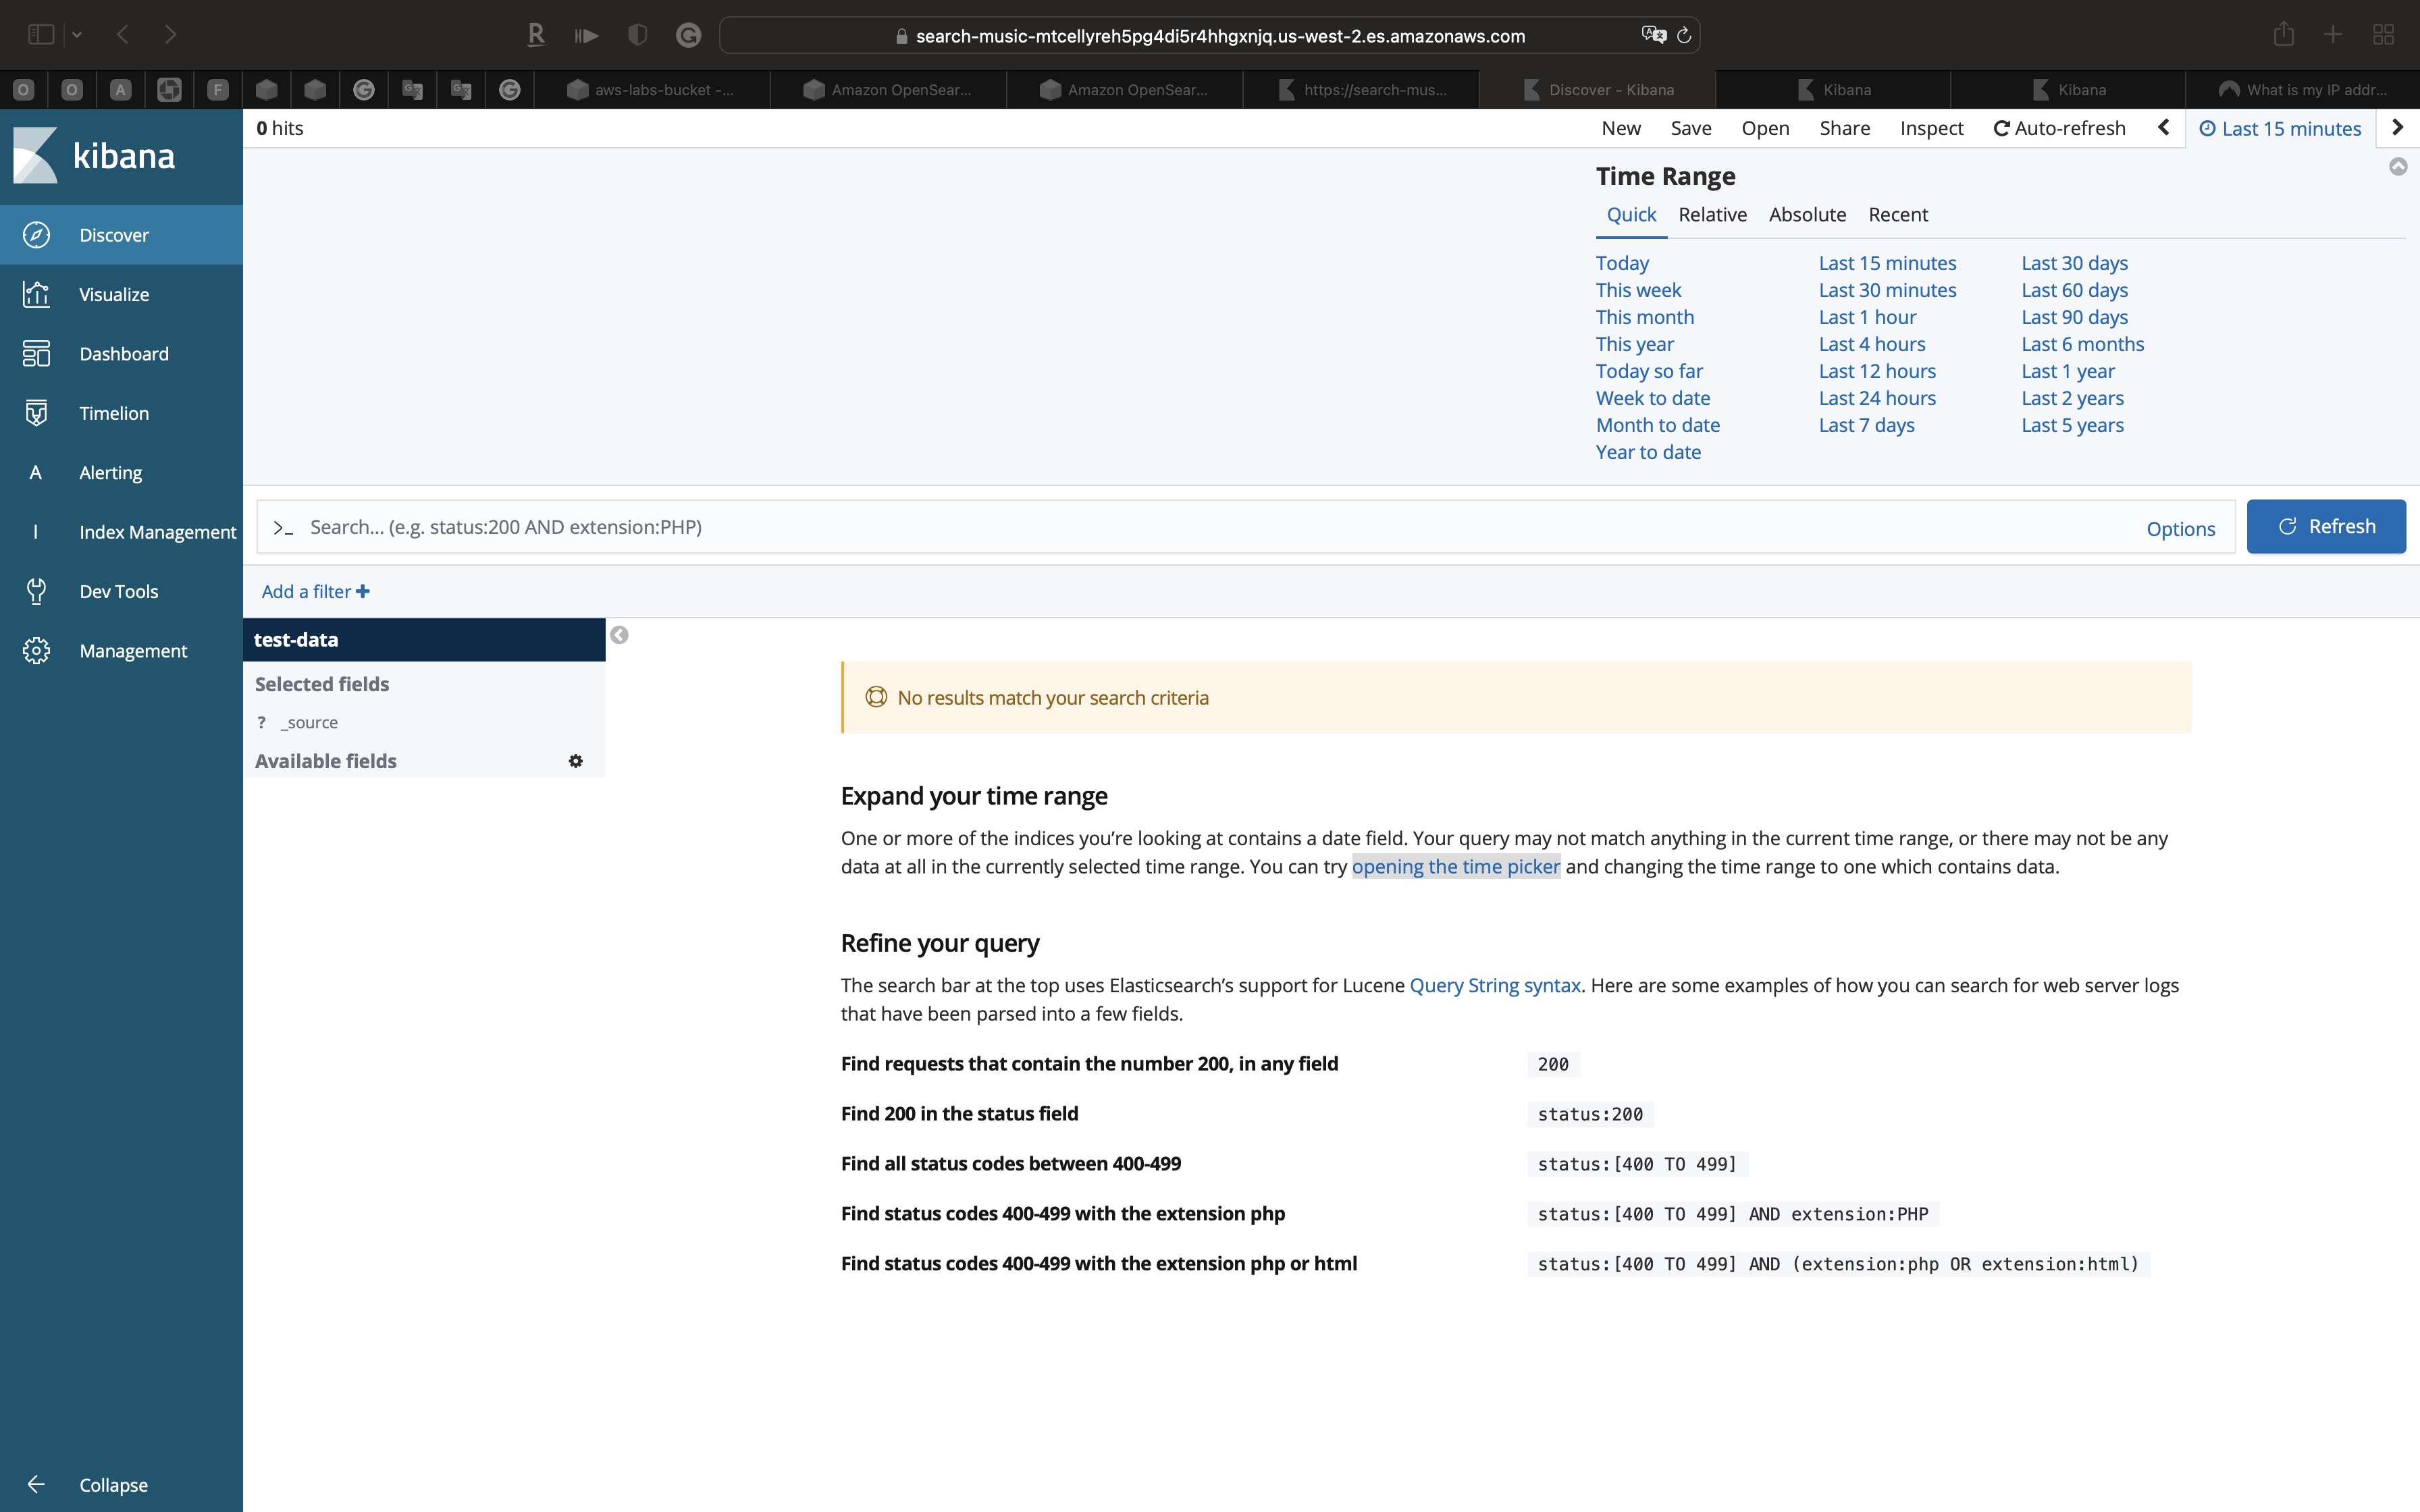
Because there is No results found, we click on the opening the time picker
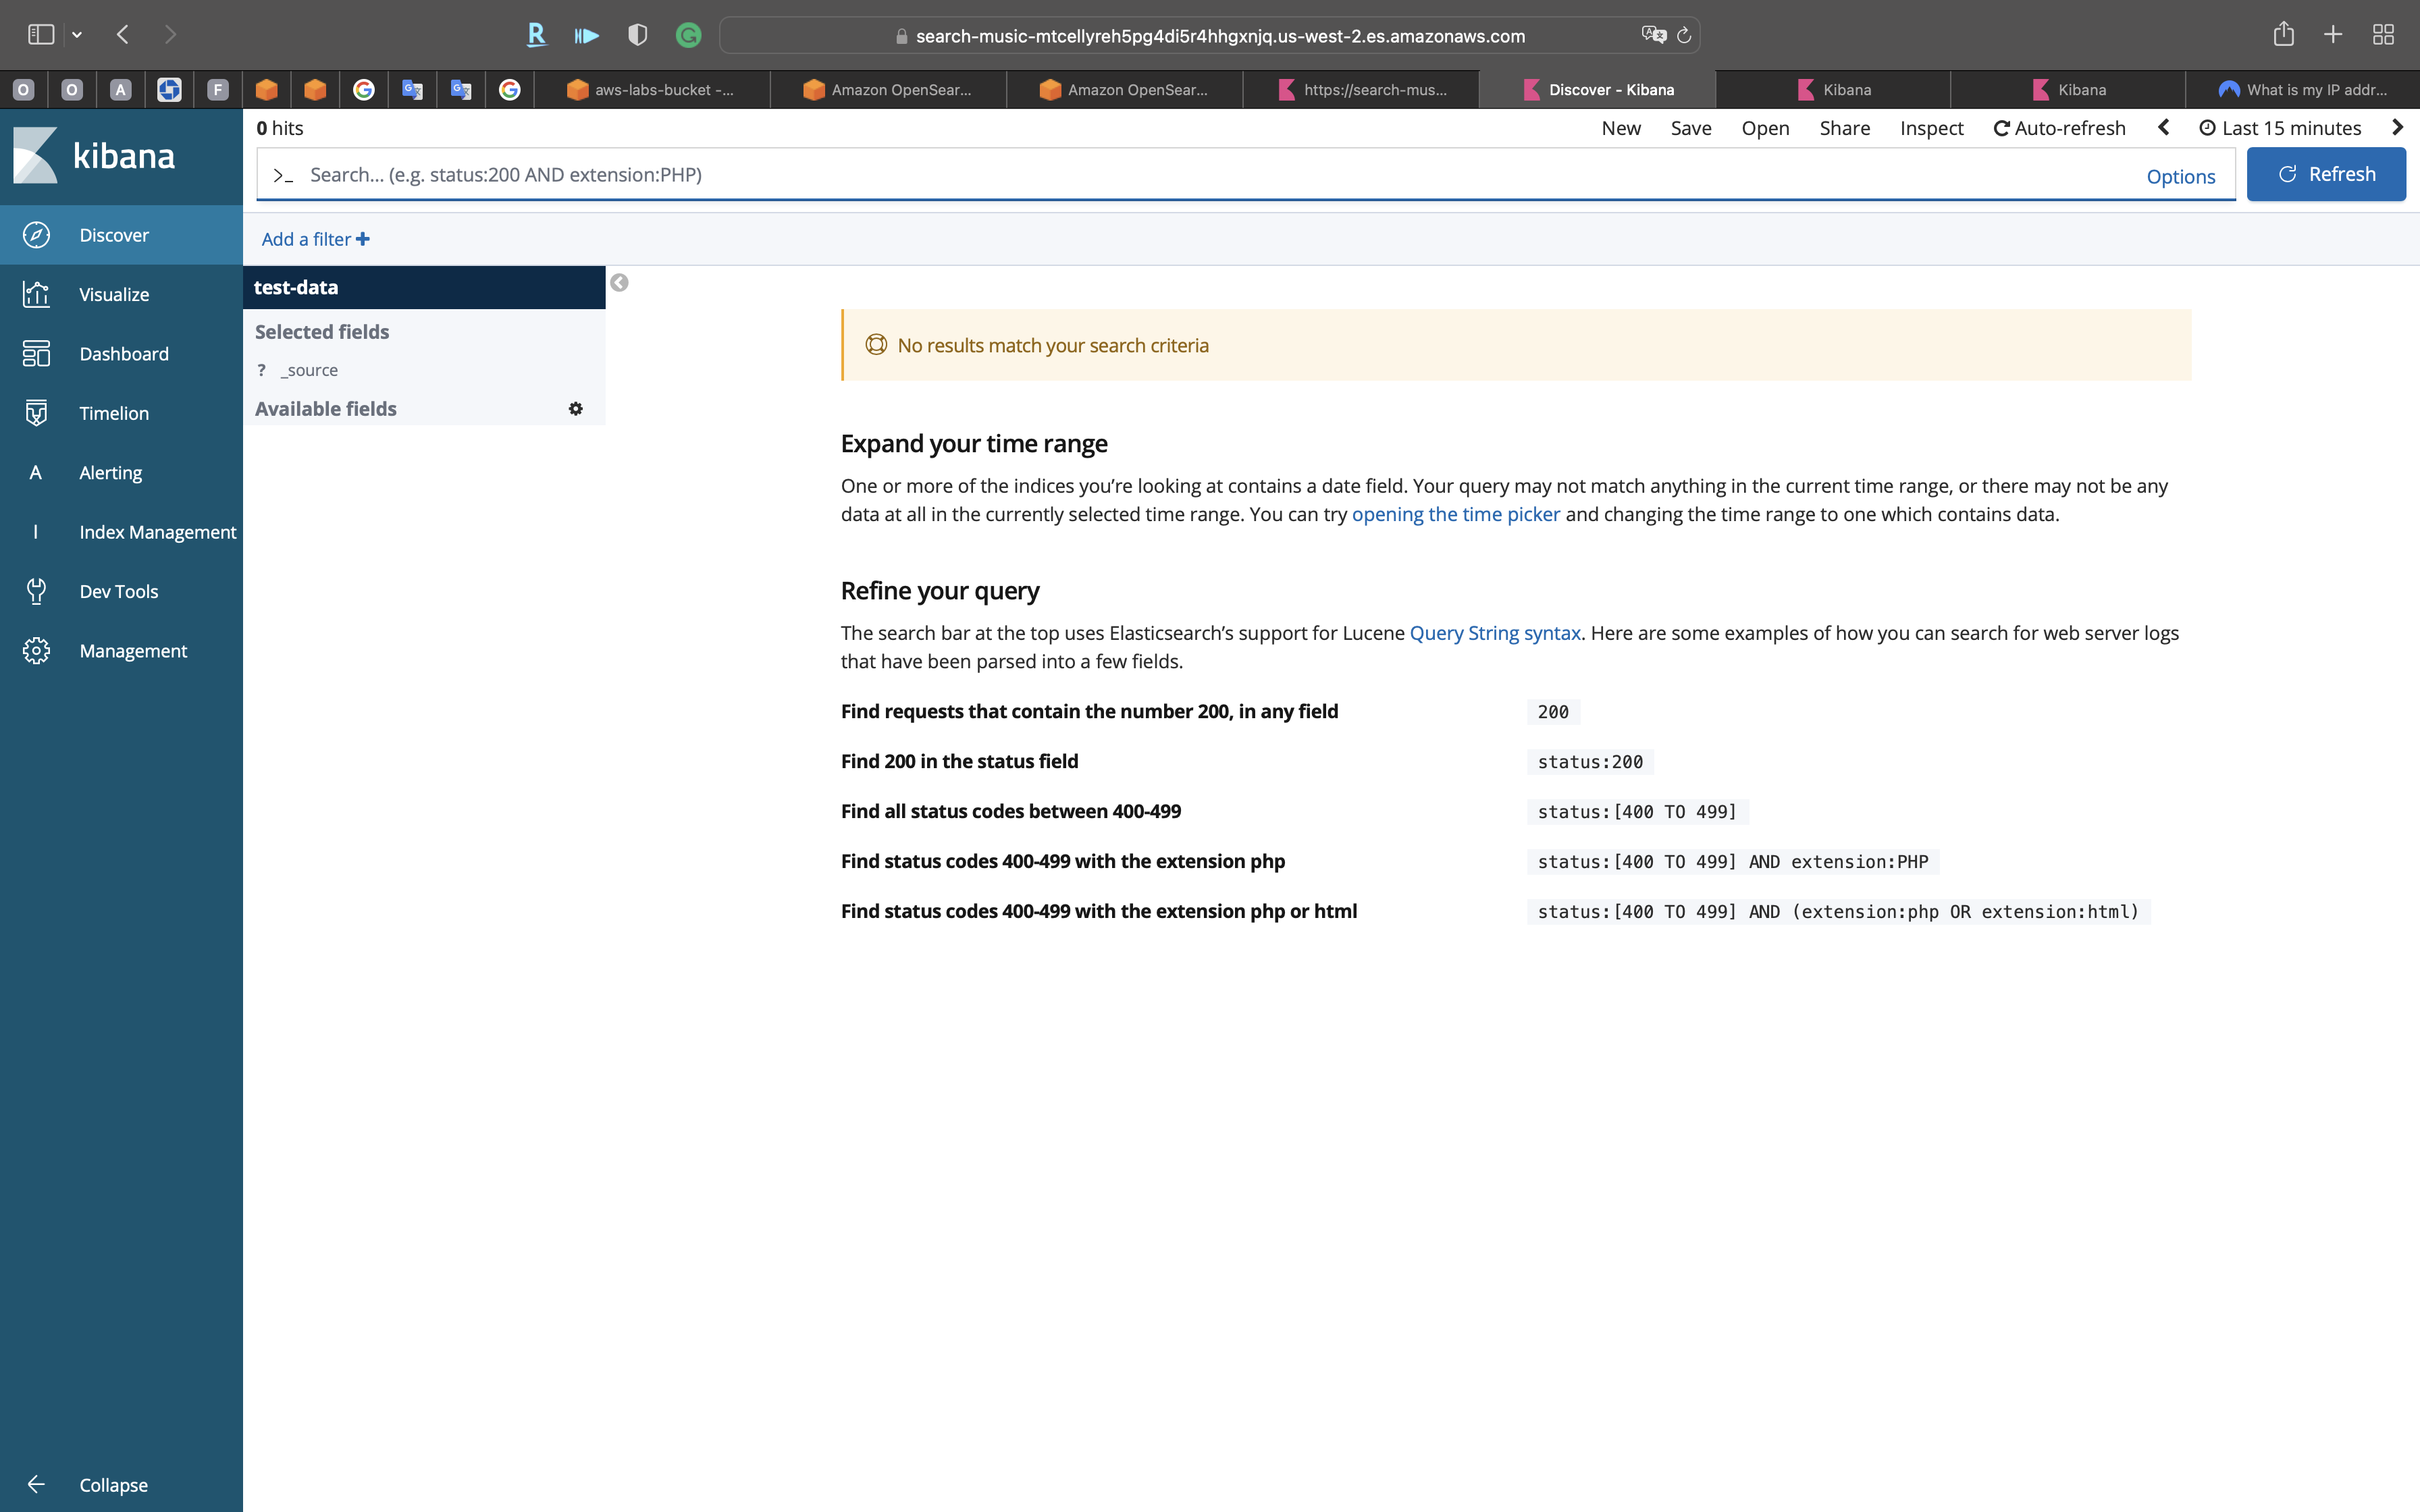
We want to use the time picker to pick the proper time range.
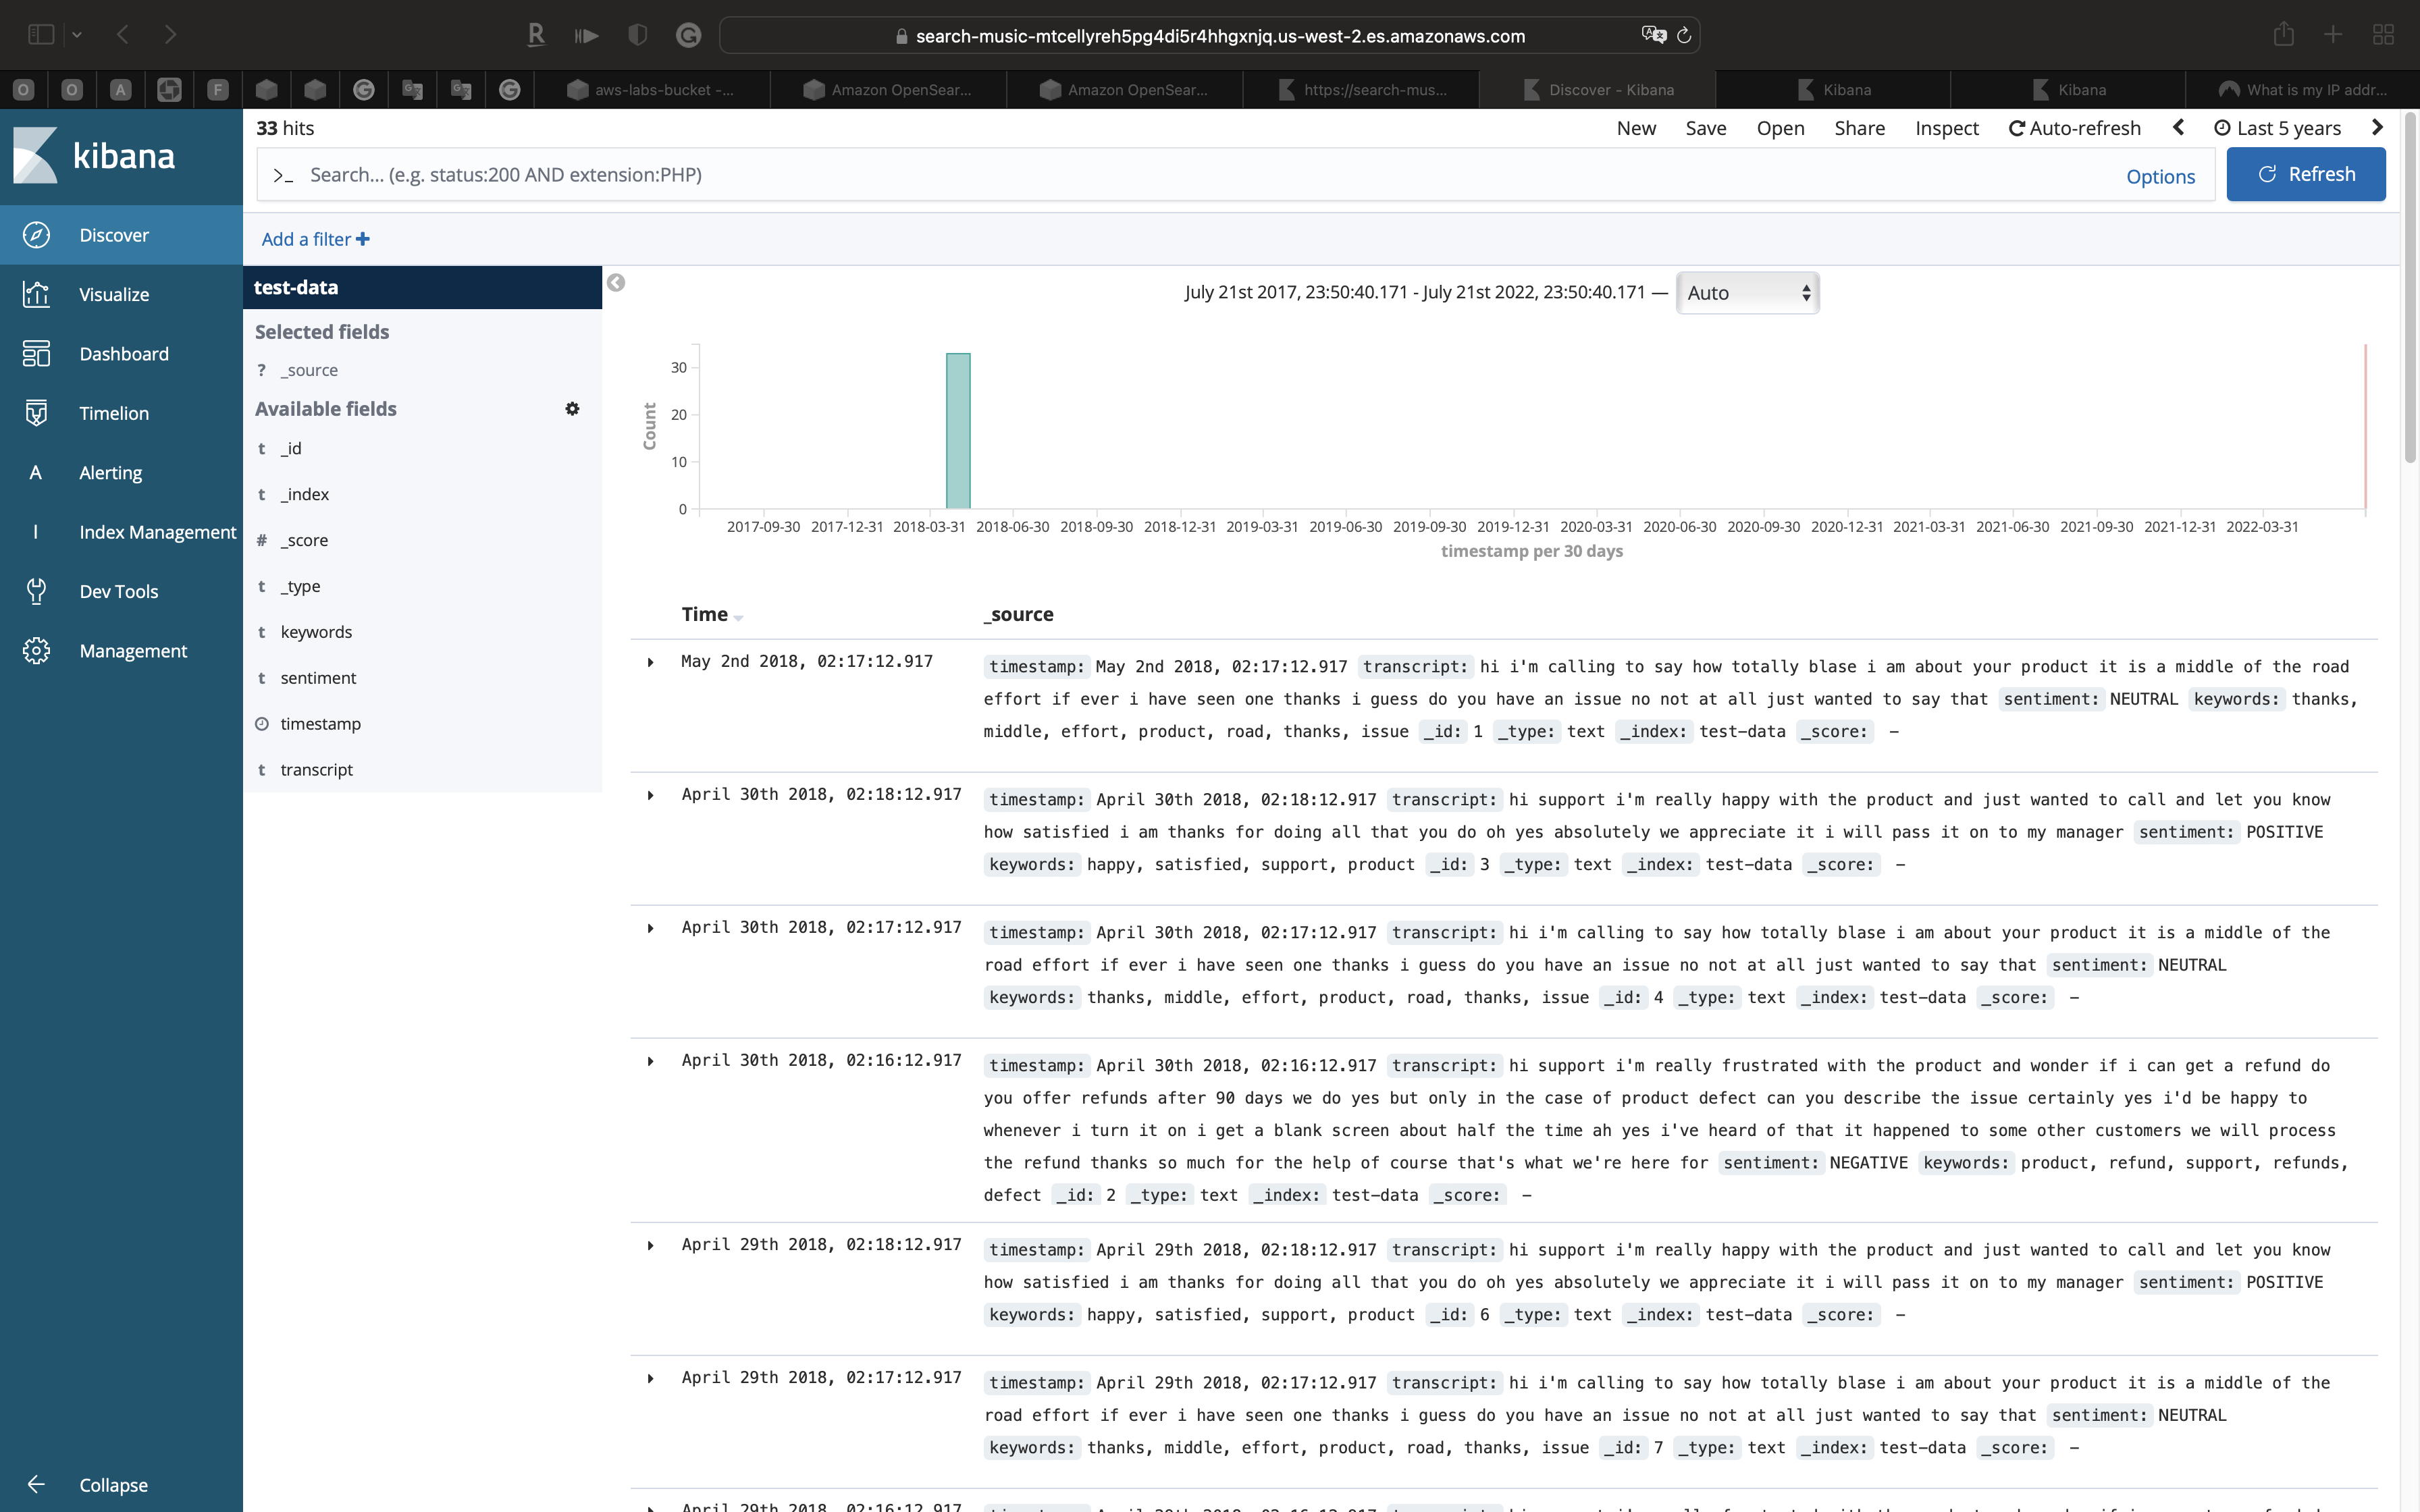
Click on Last 5 years
Now we have all of our data.
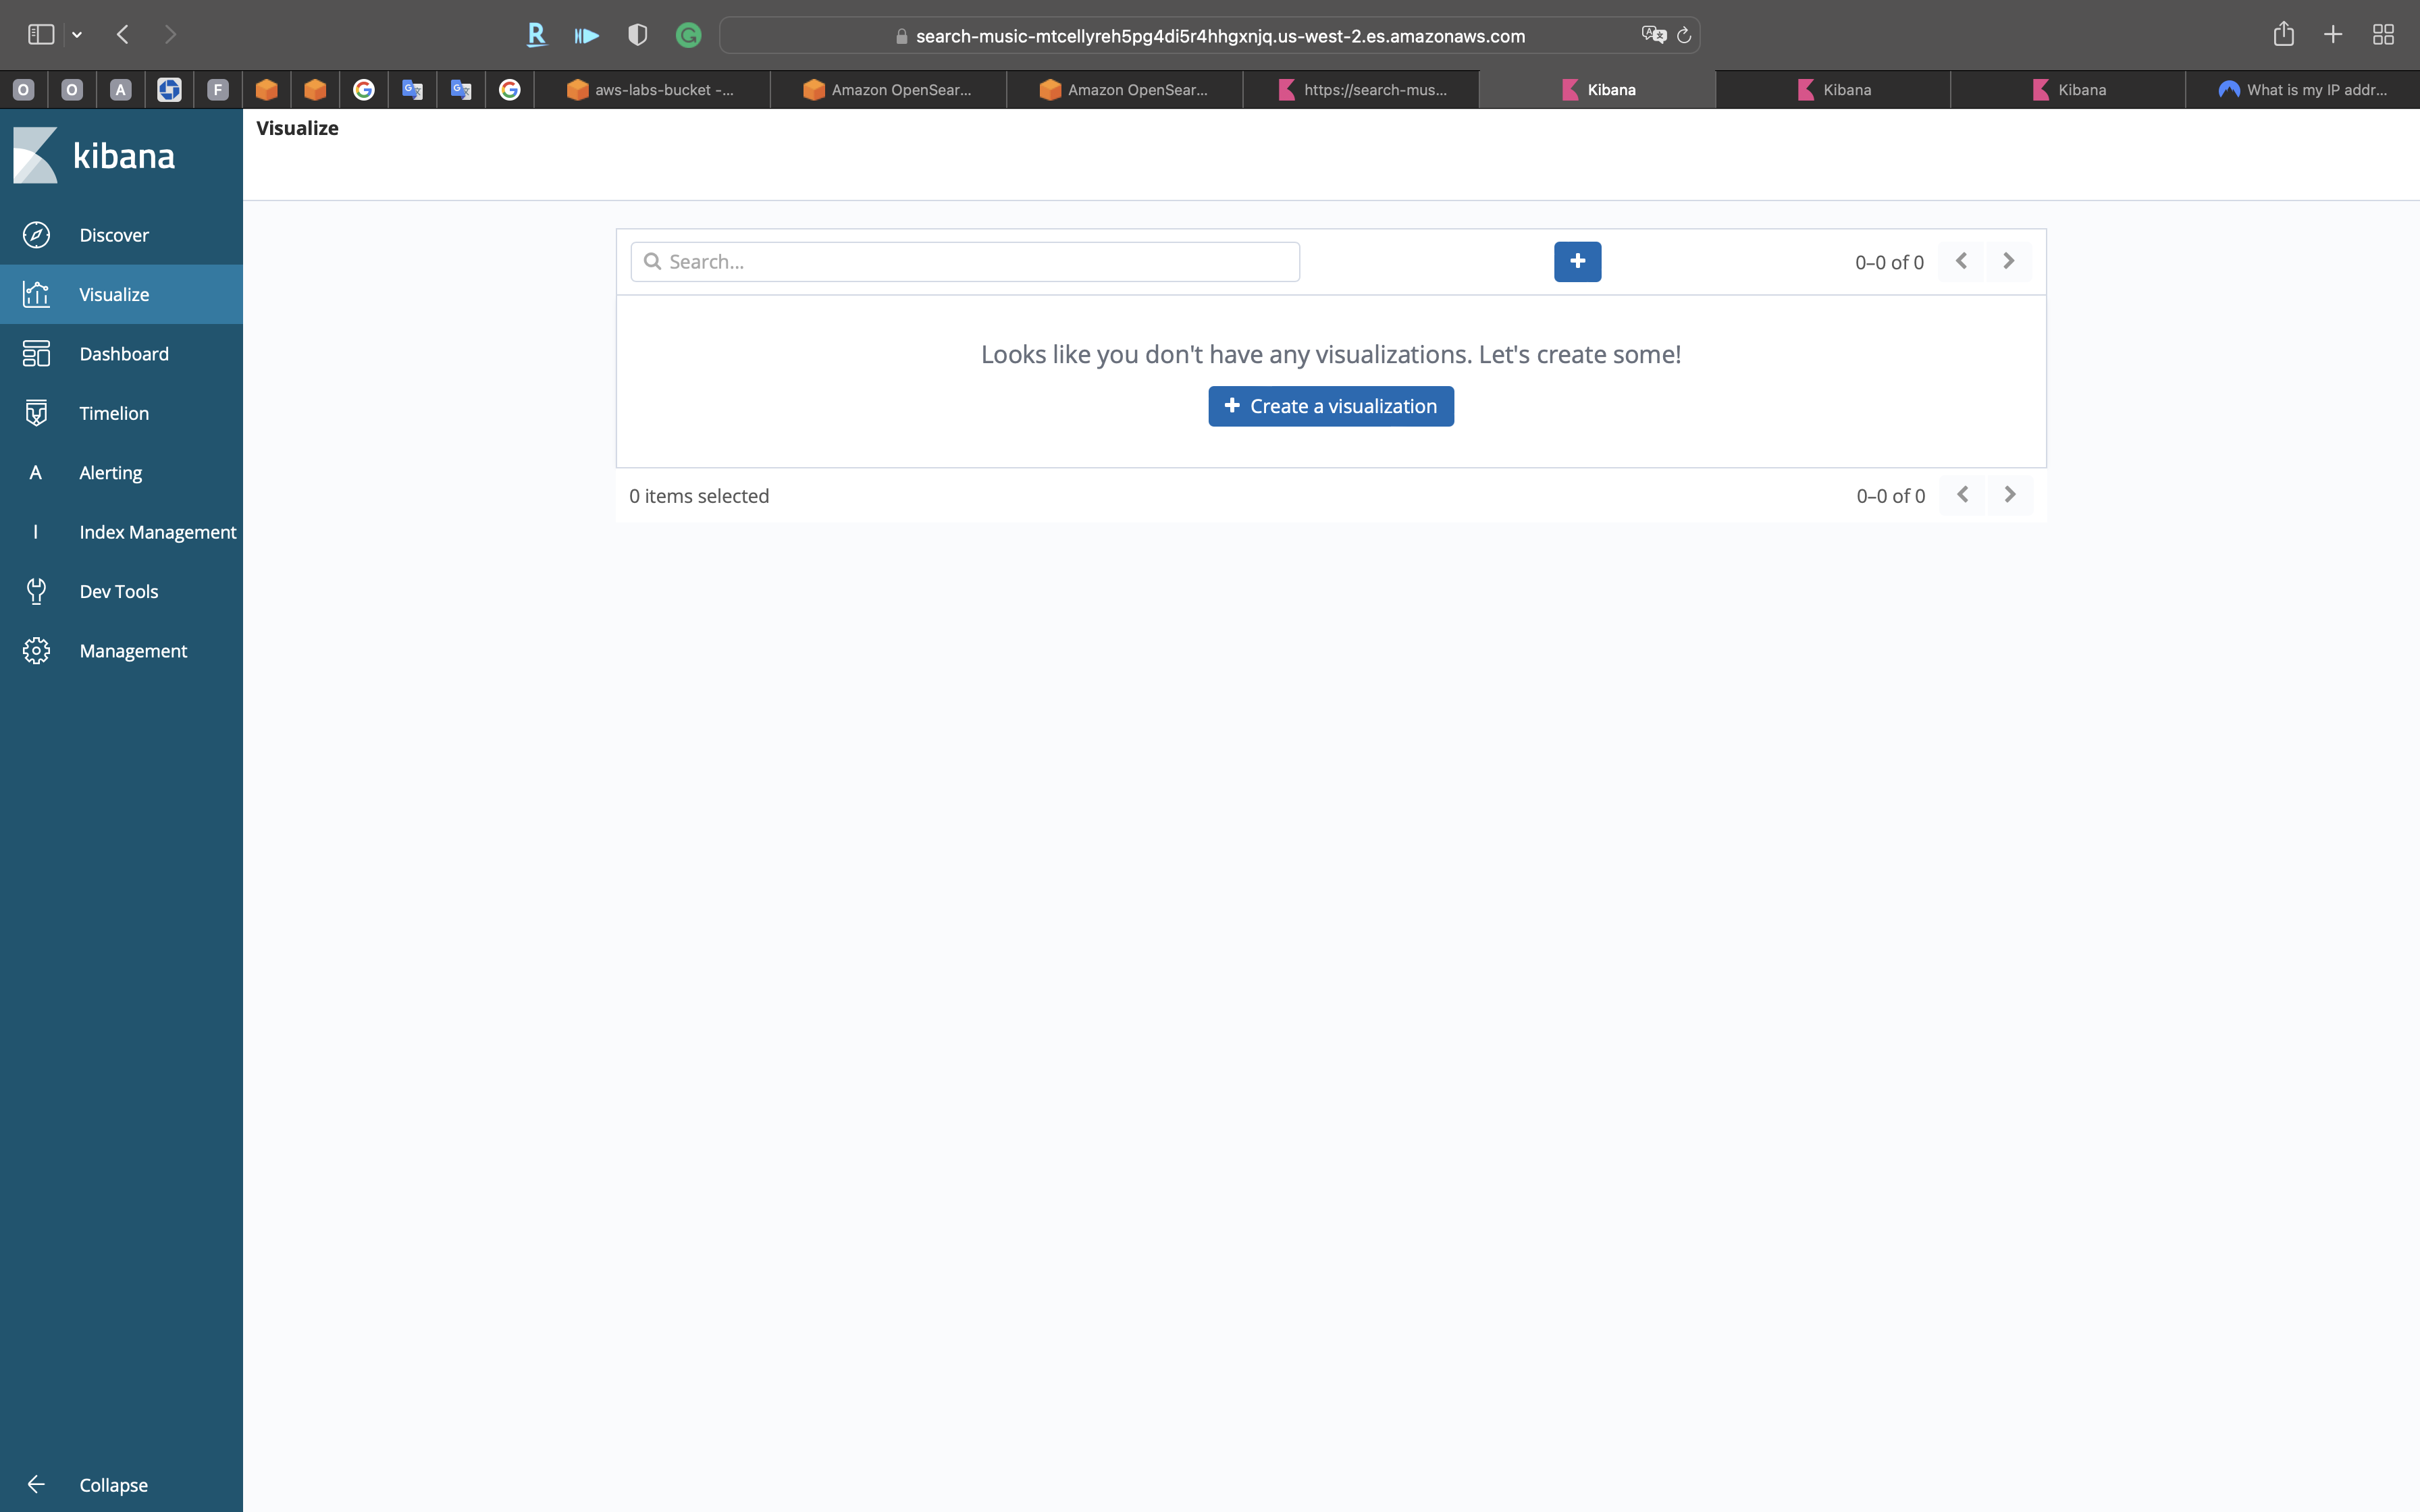
Click on Visualize on the navigation panel
Kibana Visualization
Pie
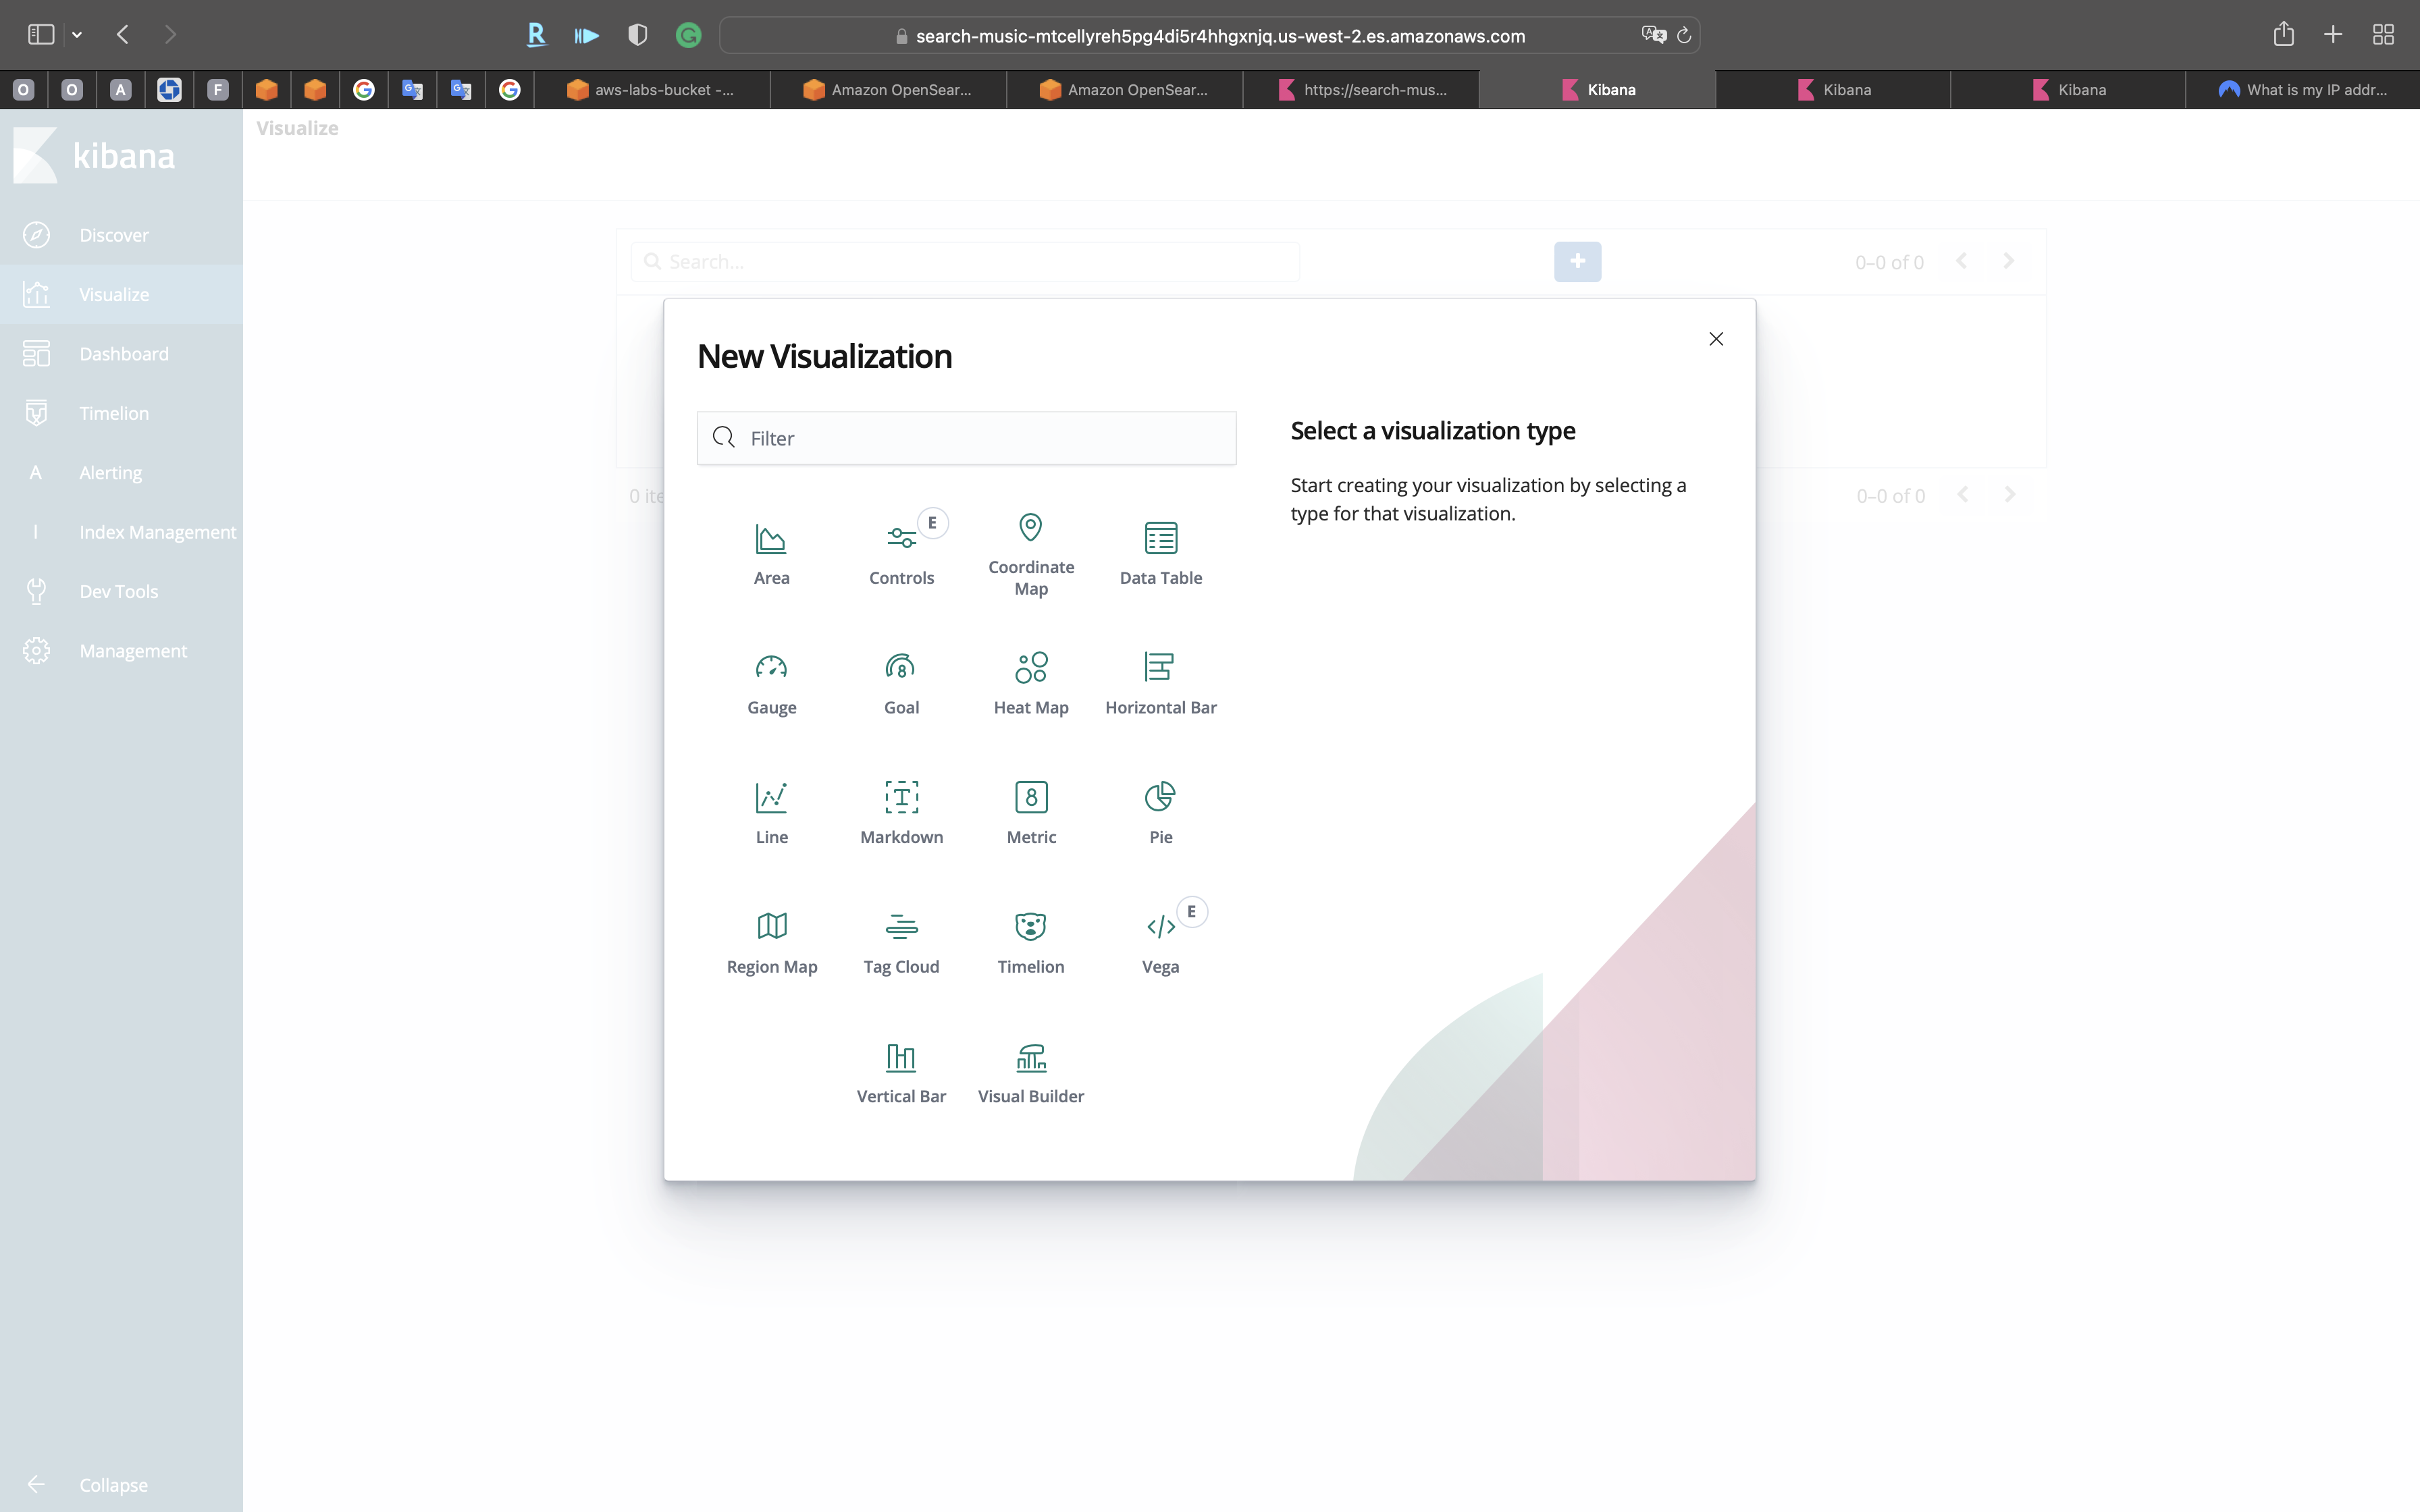
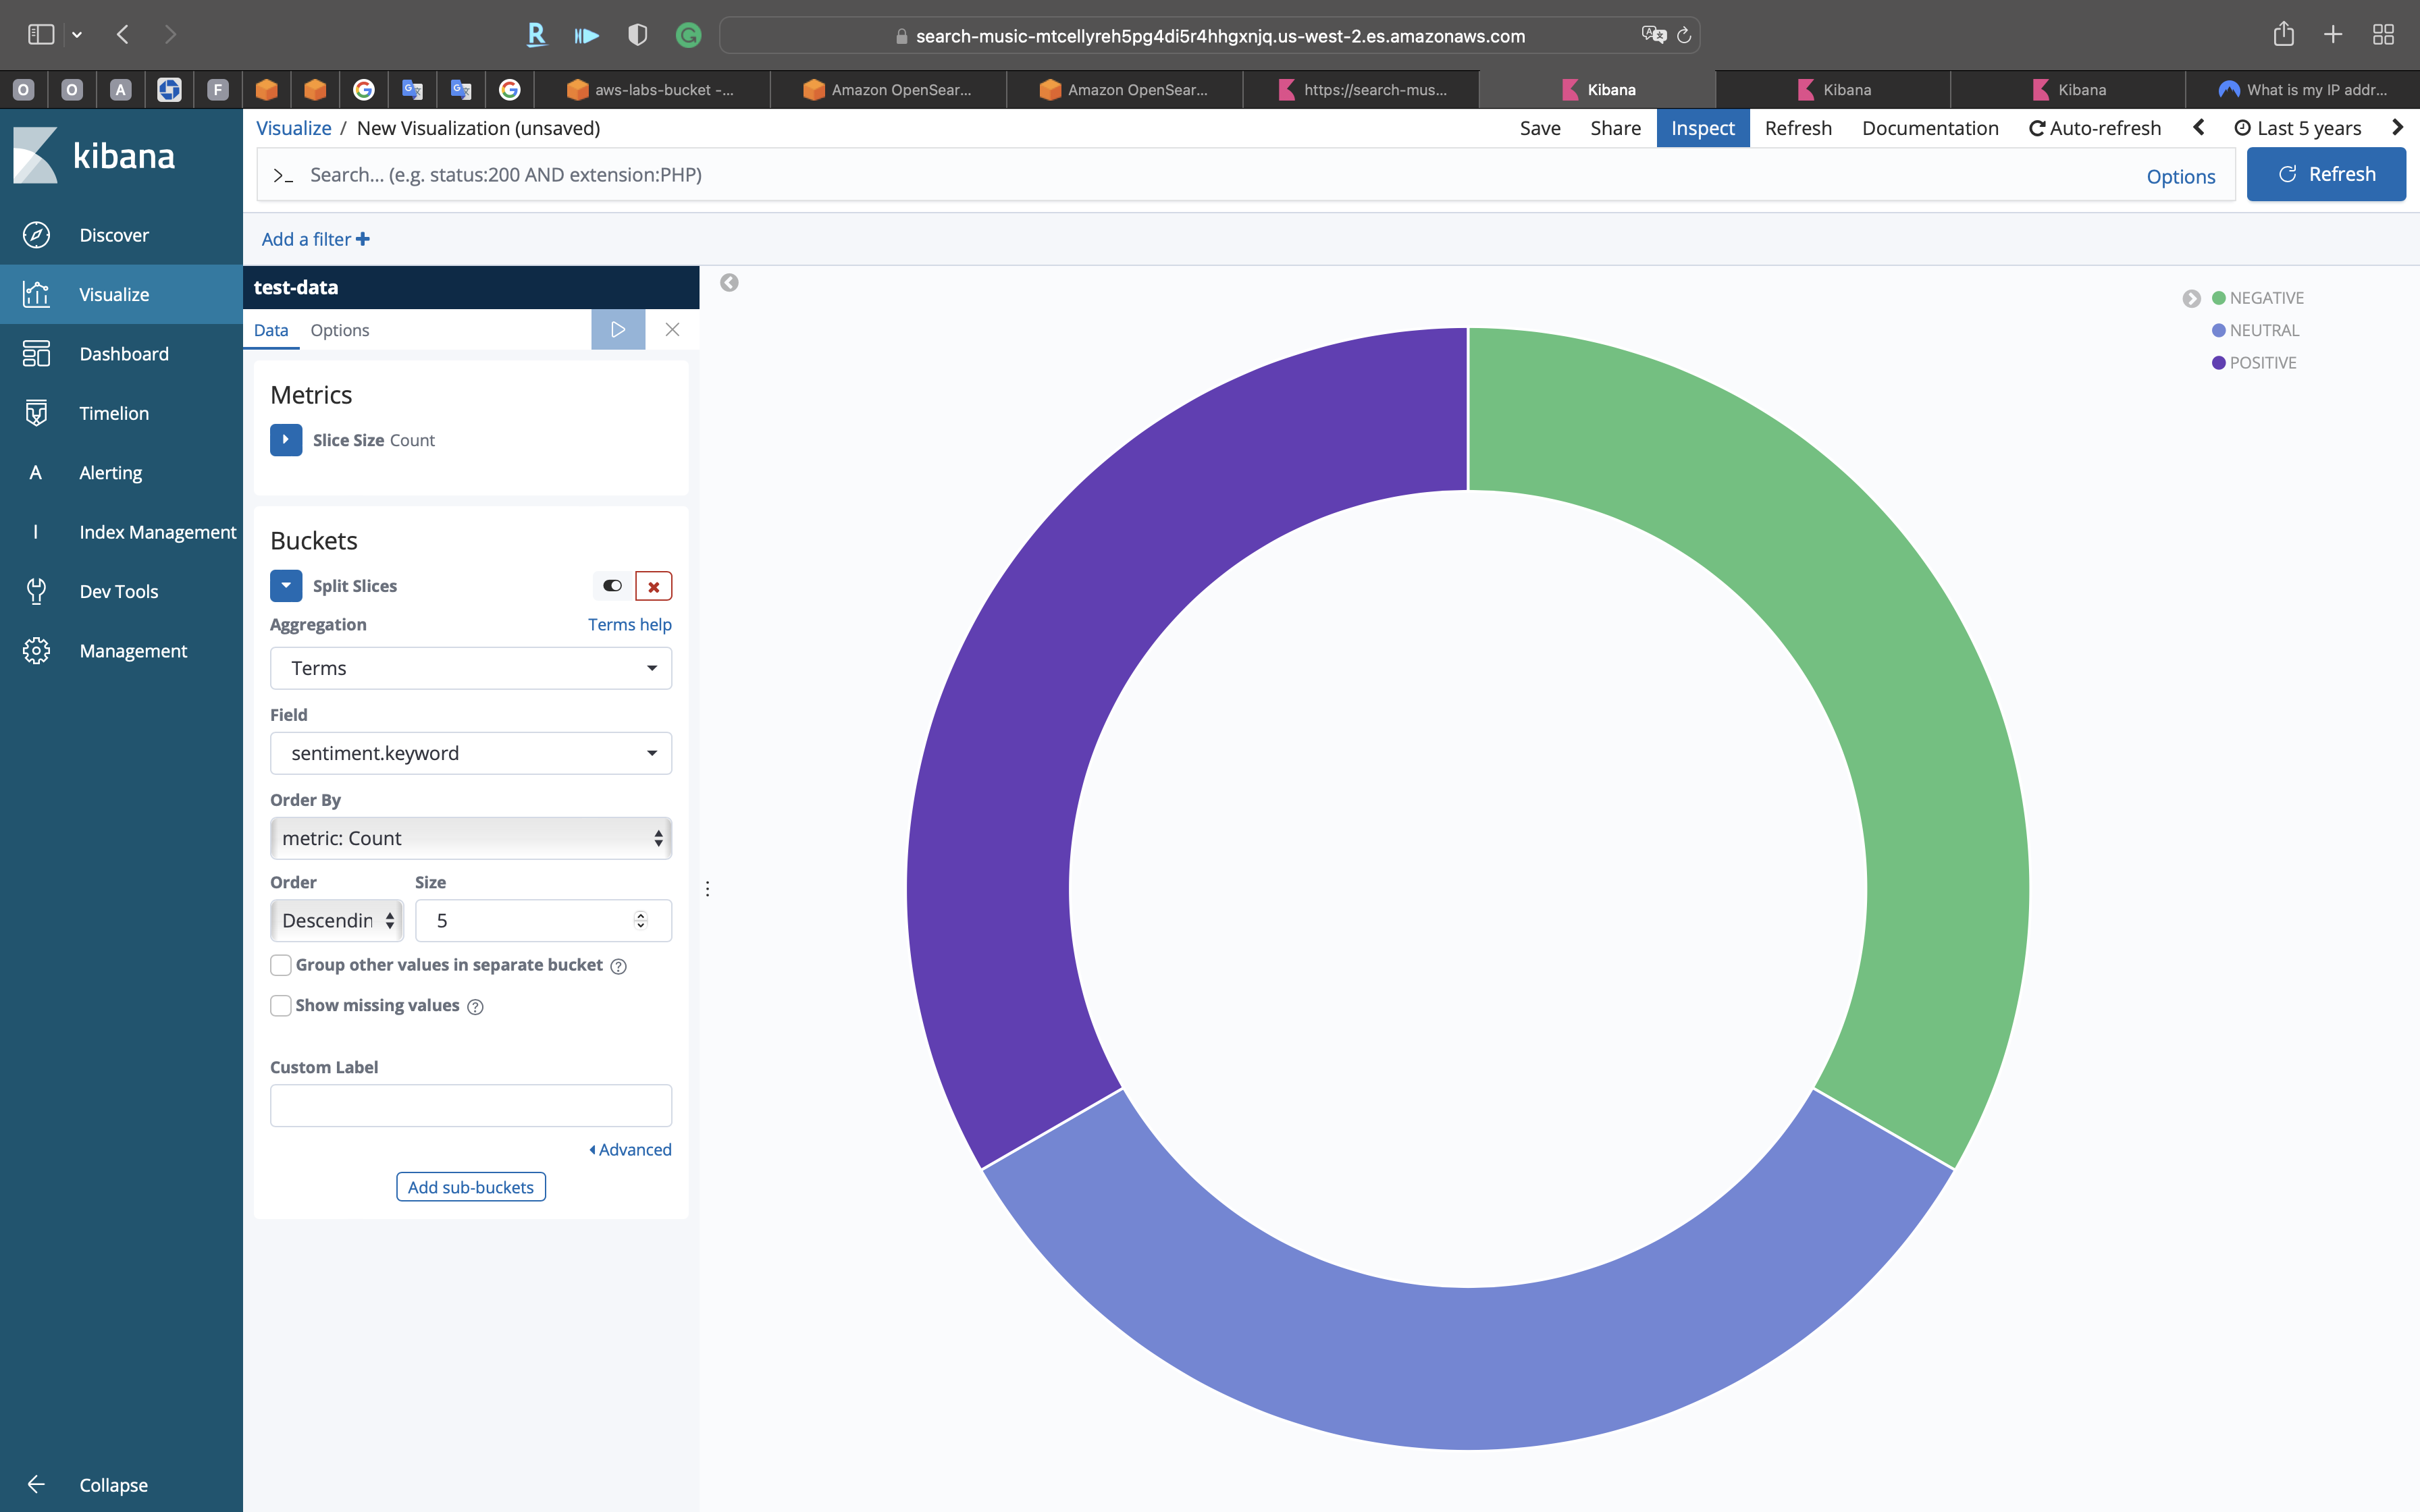
Click on Create a visualization
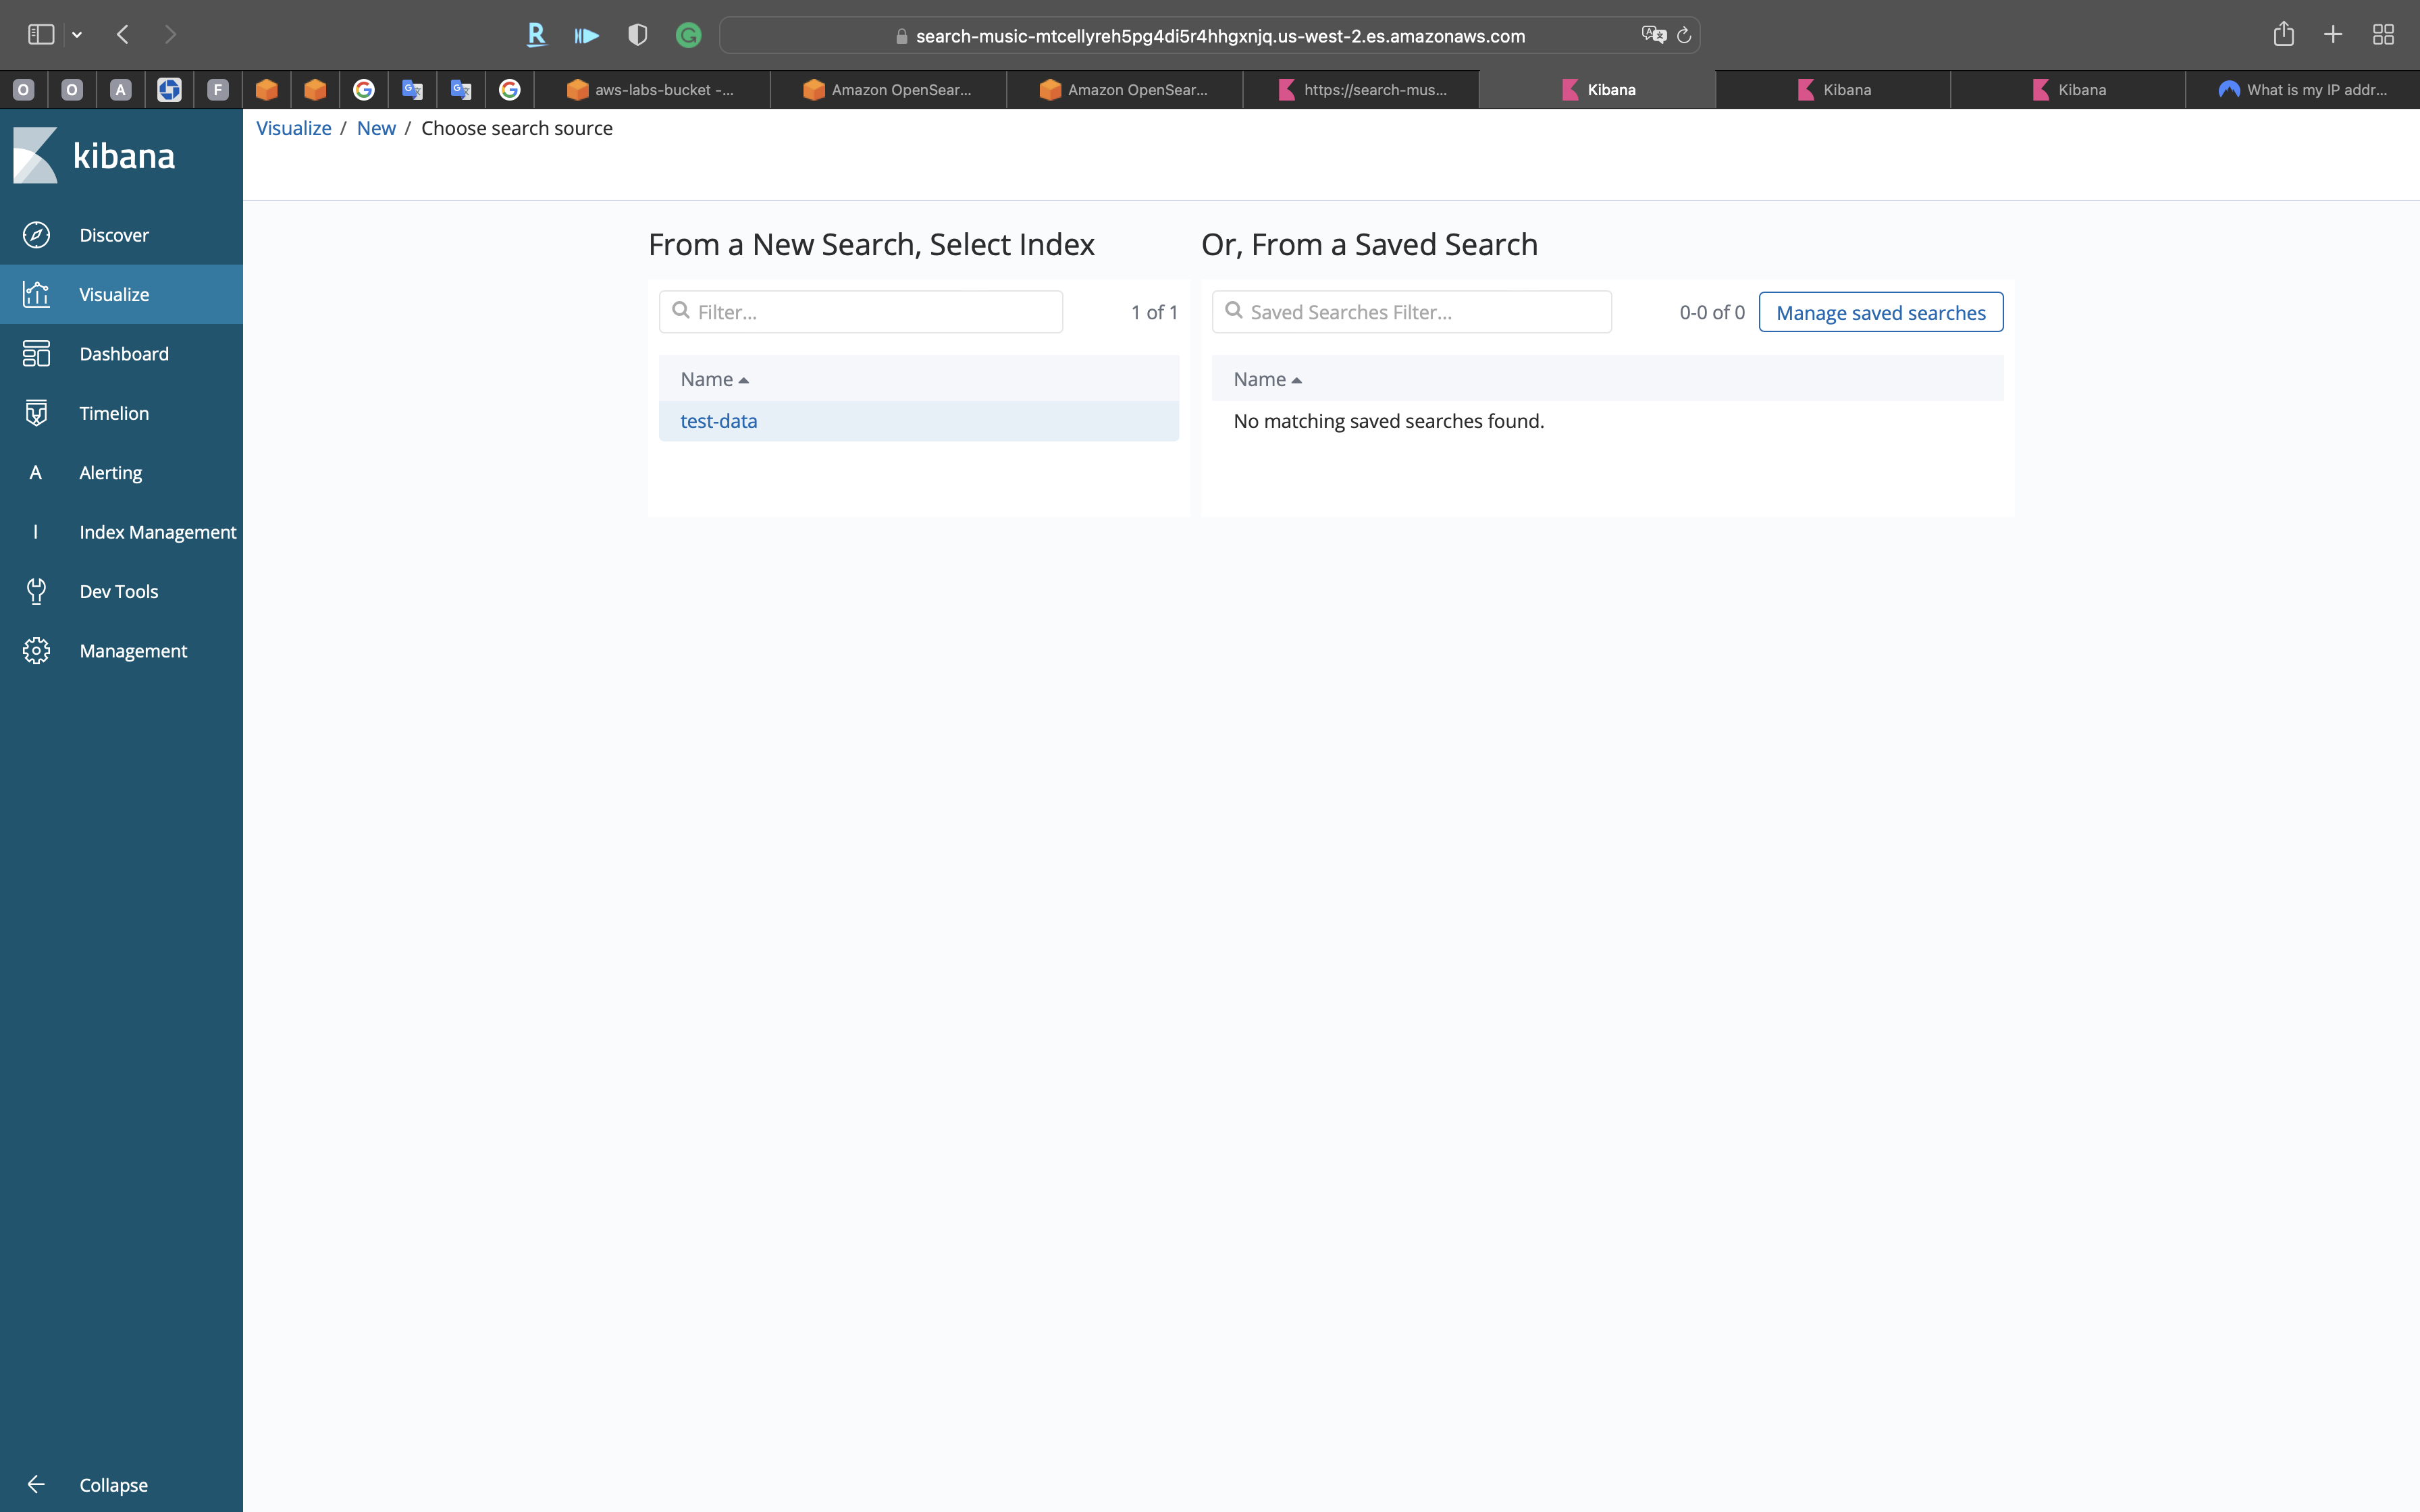
Click on Pie
Click on test-data
- Buckets type:
Split Slices - Aggregation:
Terms - Field:
sentiment.keyword
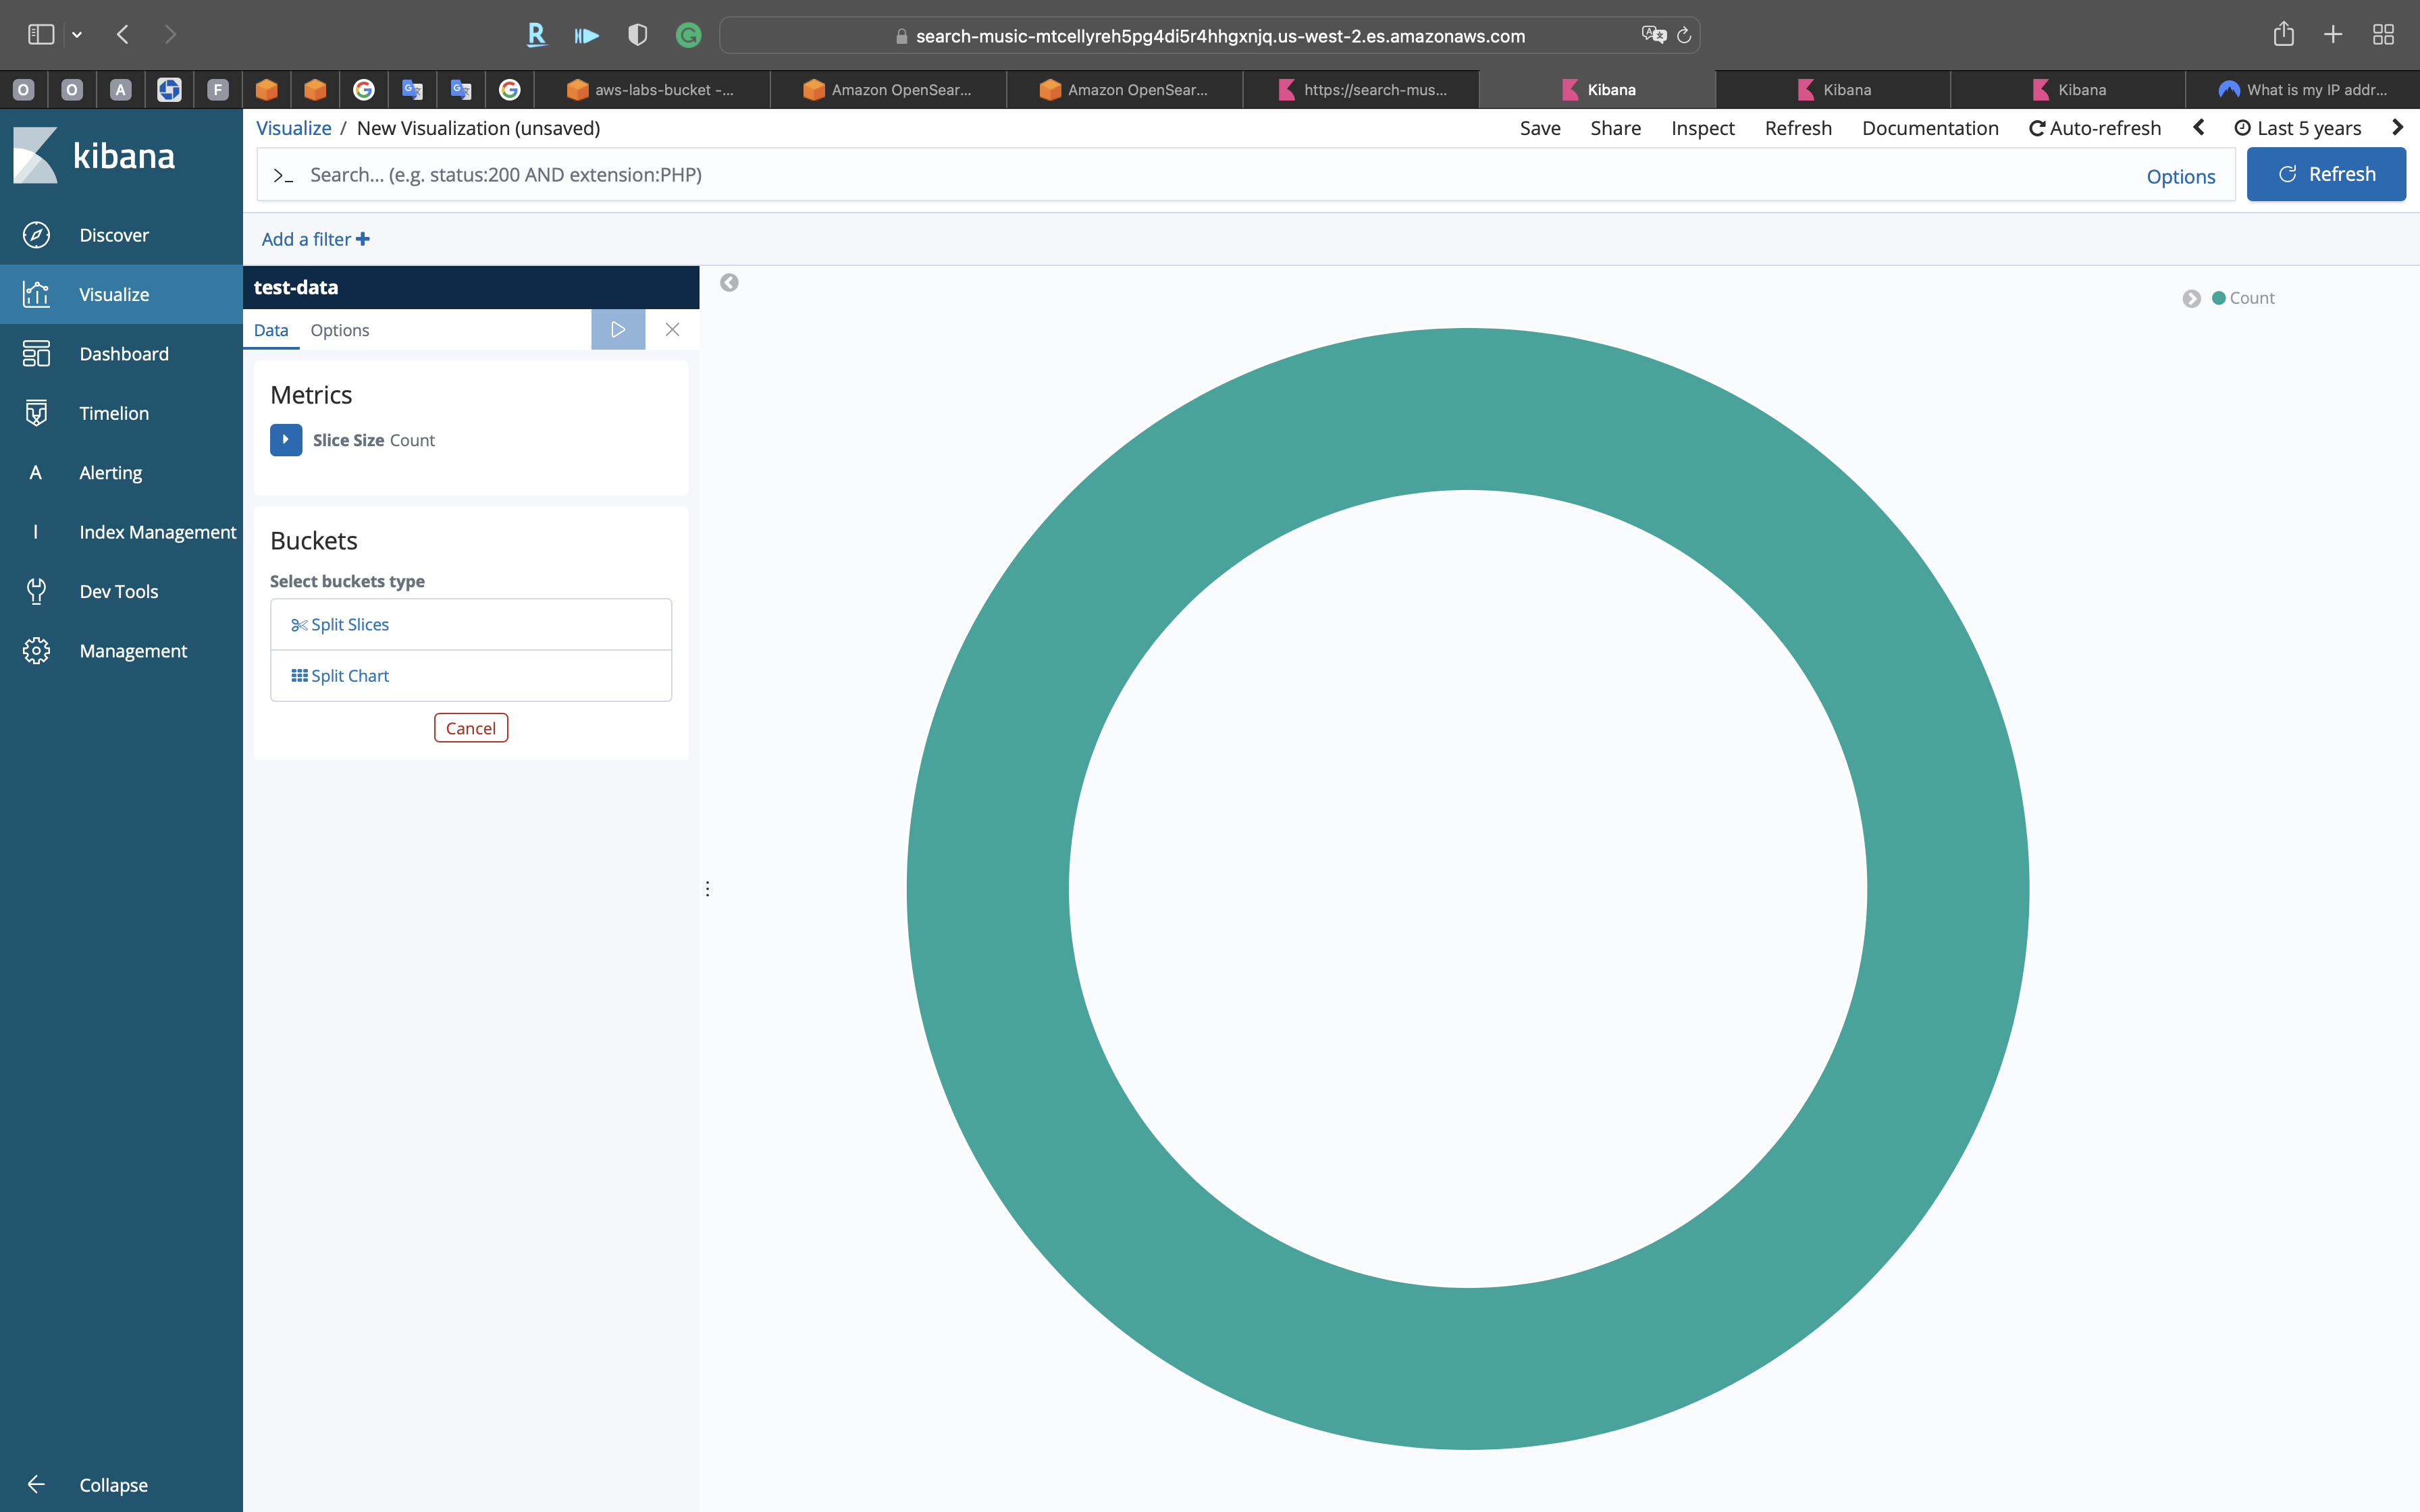
Click on Apply changes
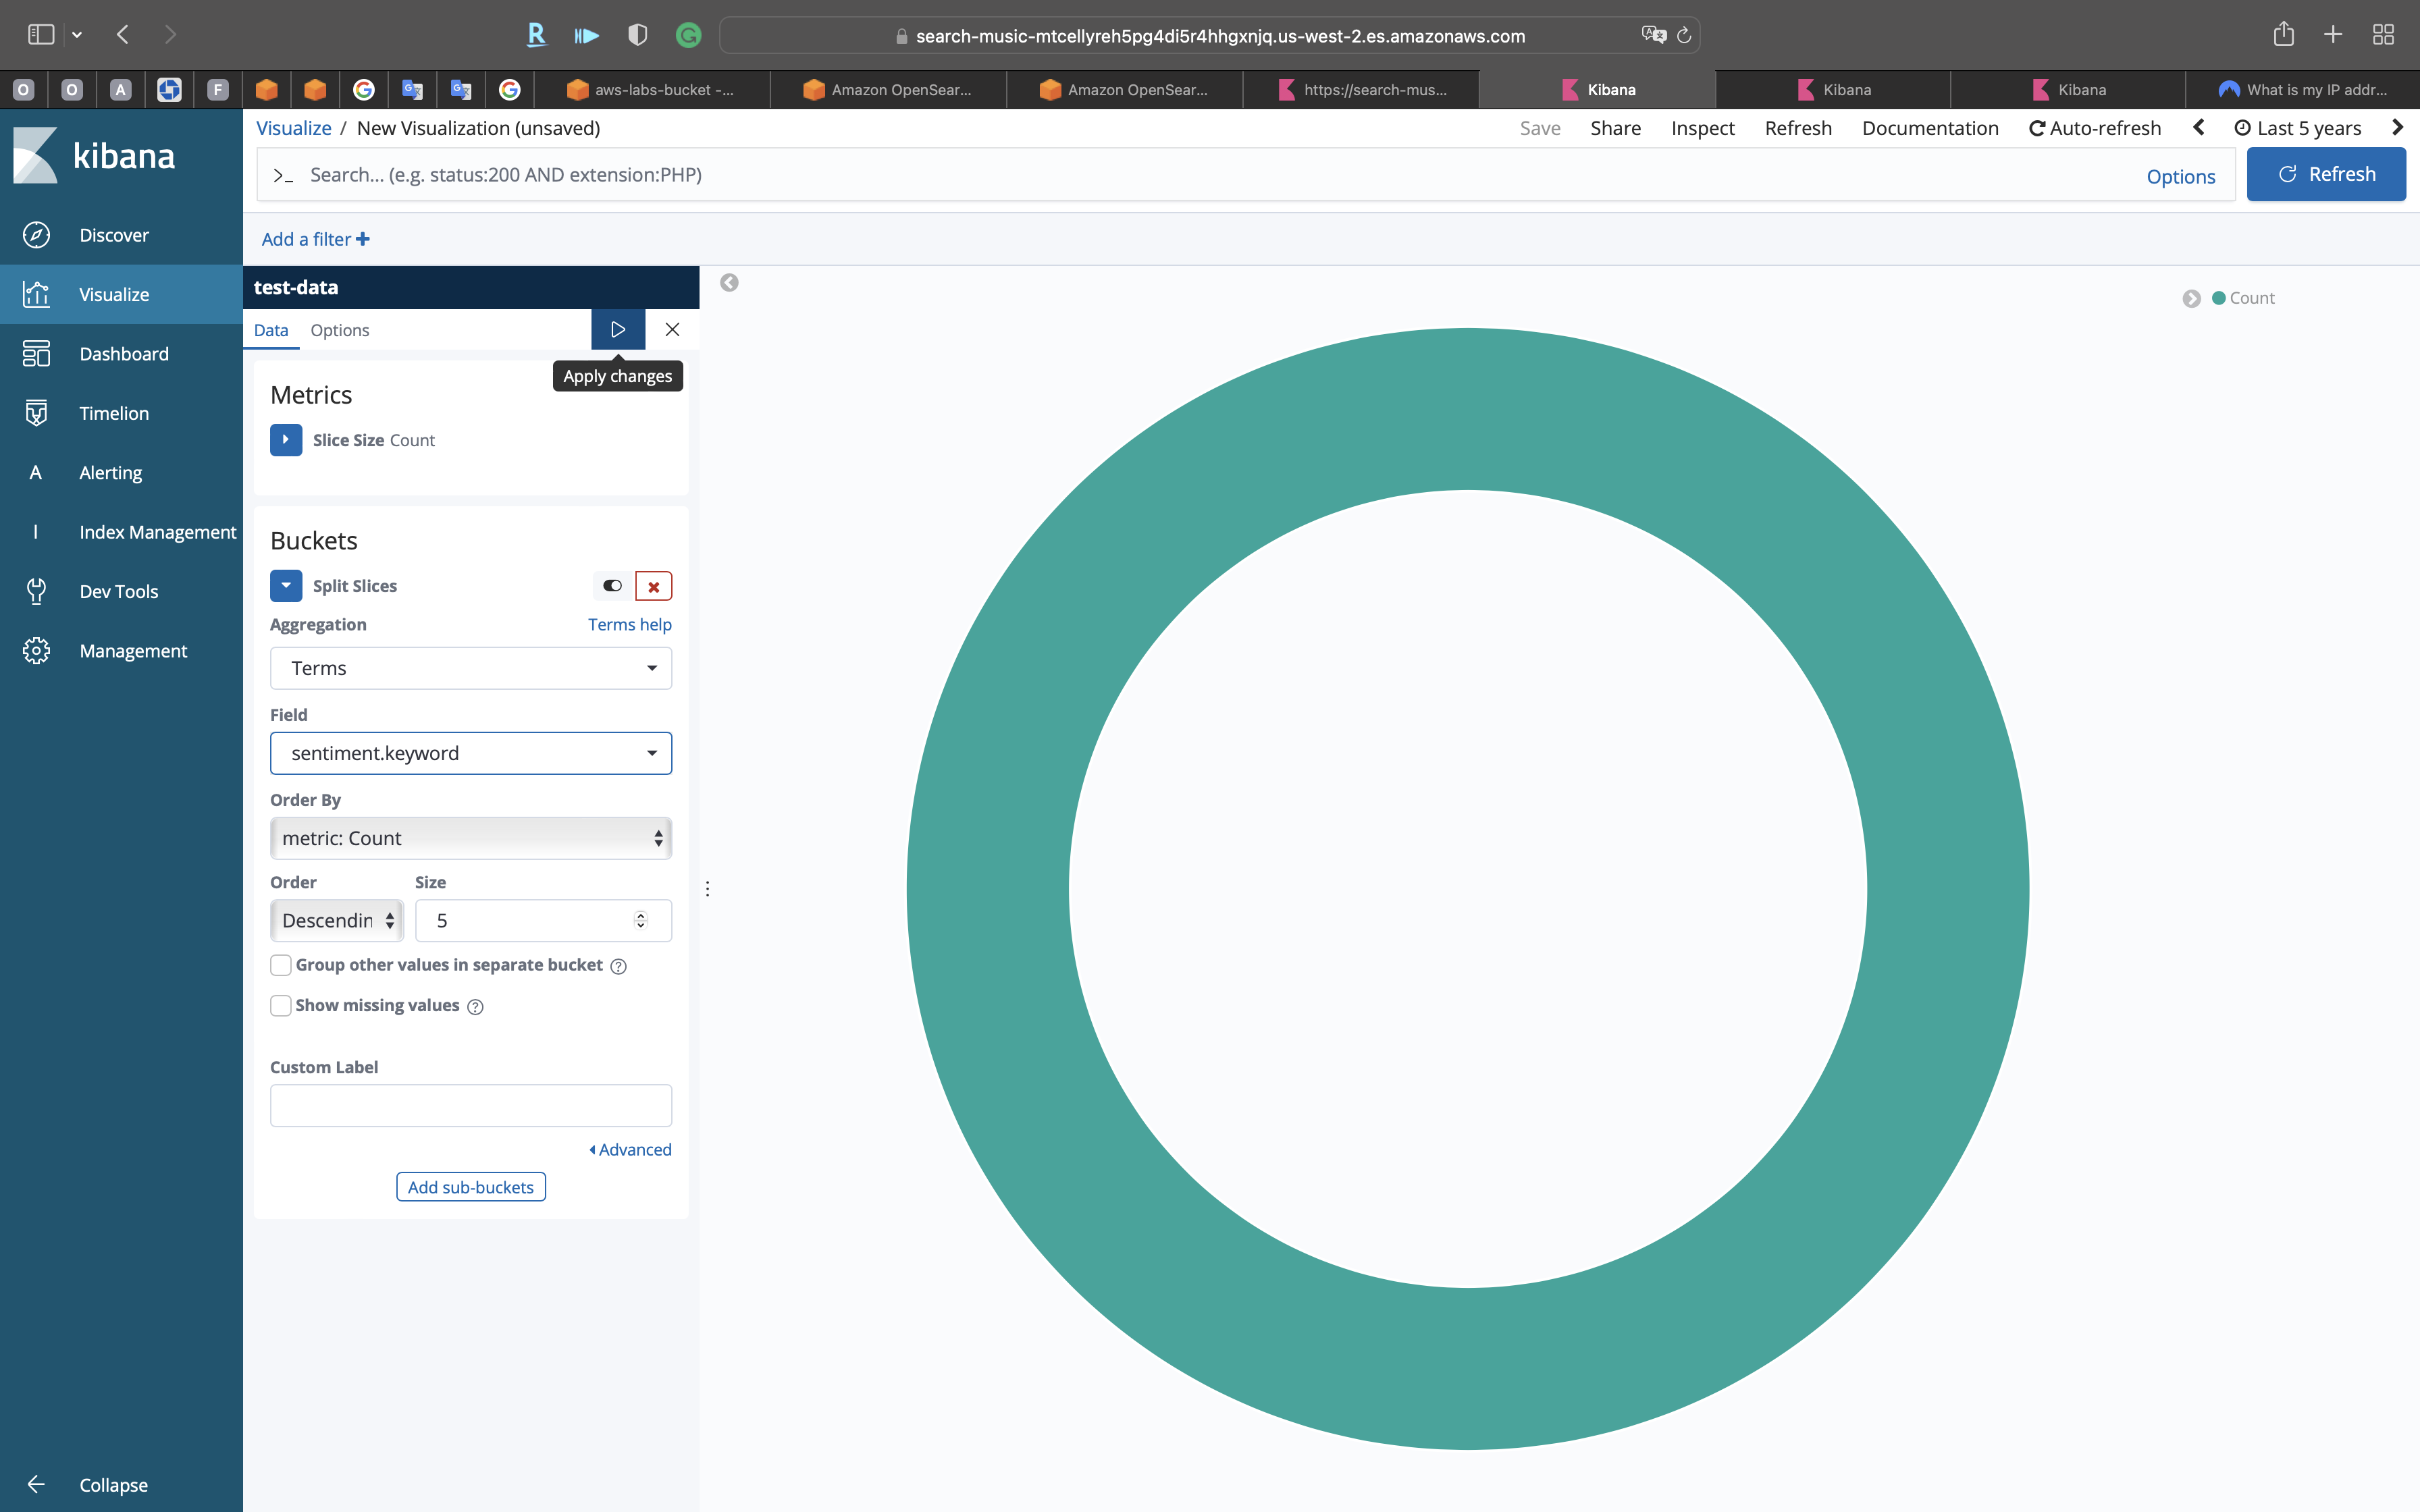
We can see there are three sentiments: NEGATIVE, NEUTRAL, and POSITIVE
Click on Visualize on the navigation panel.

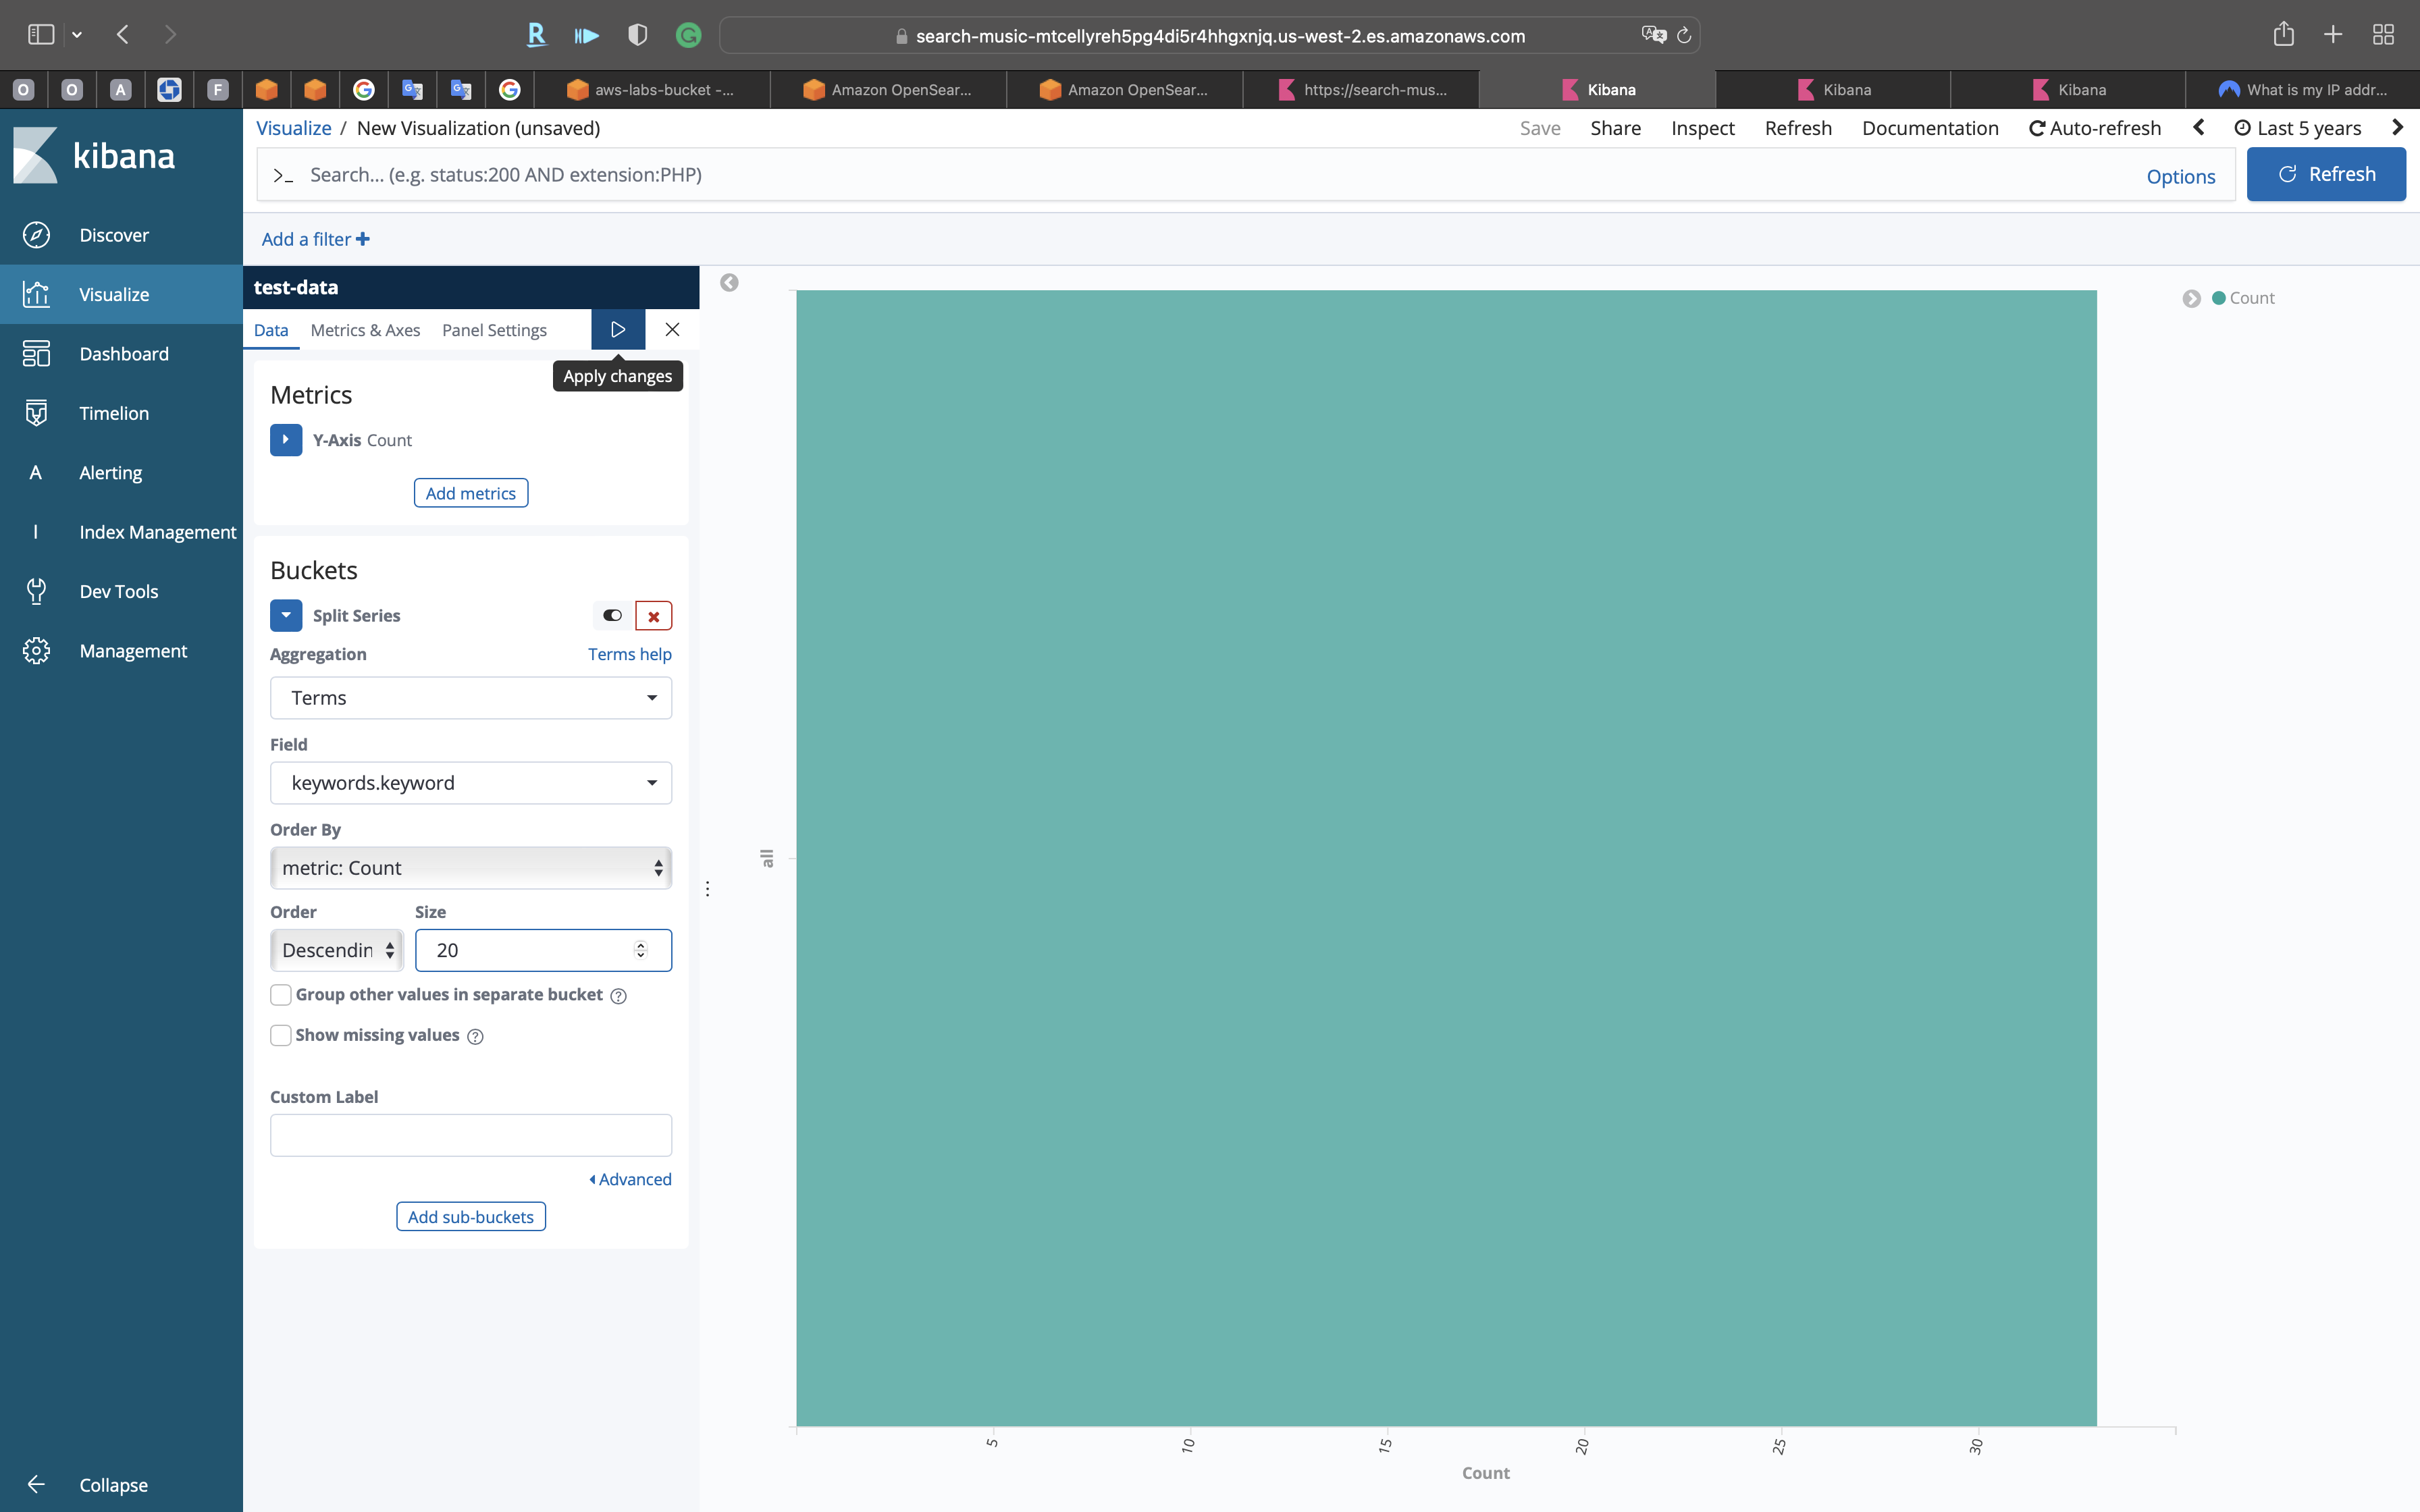
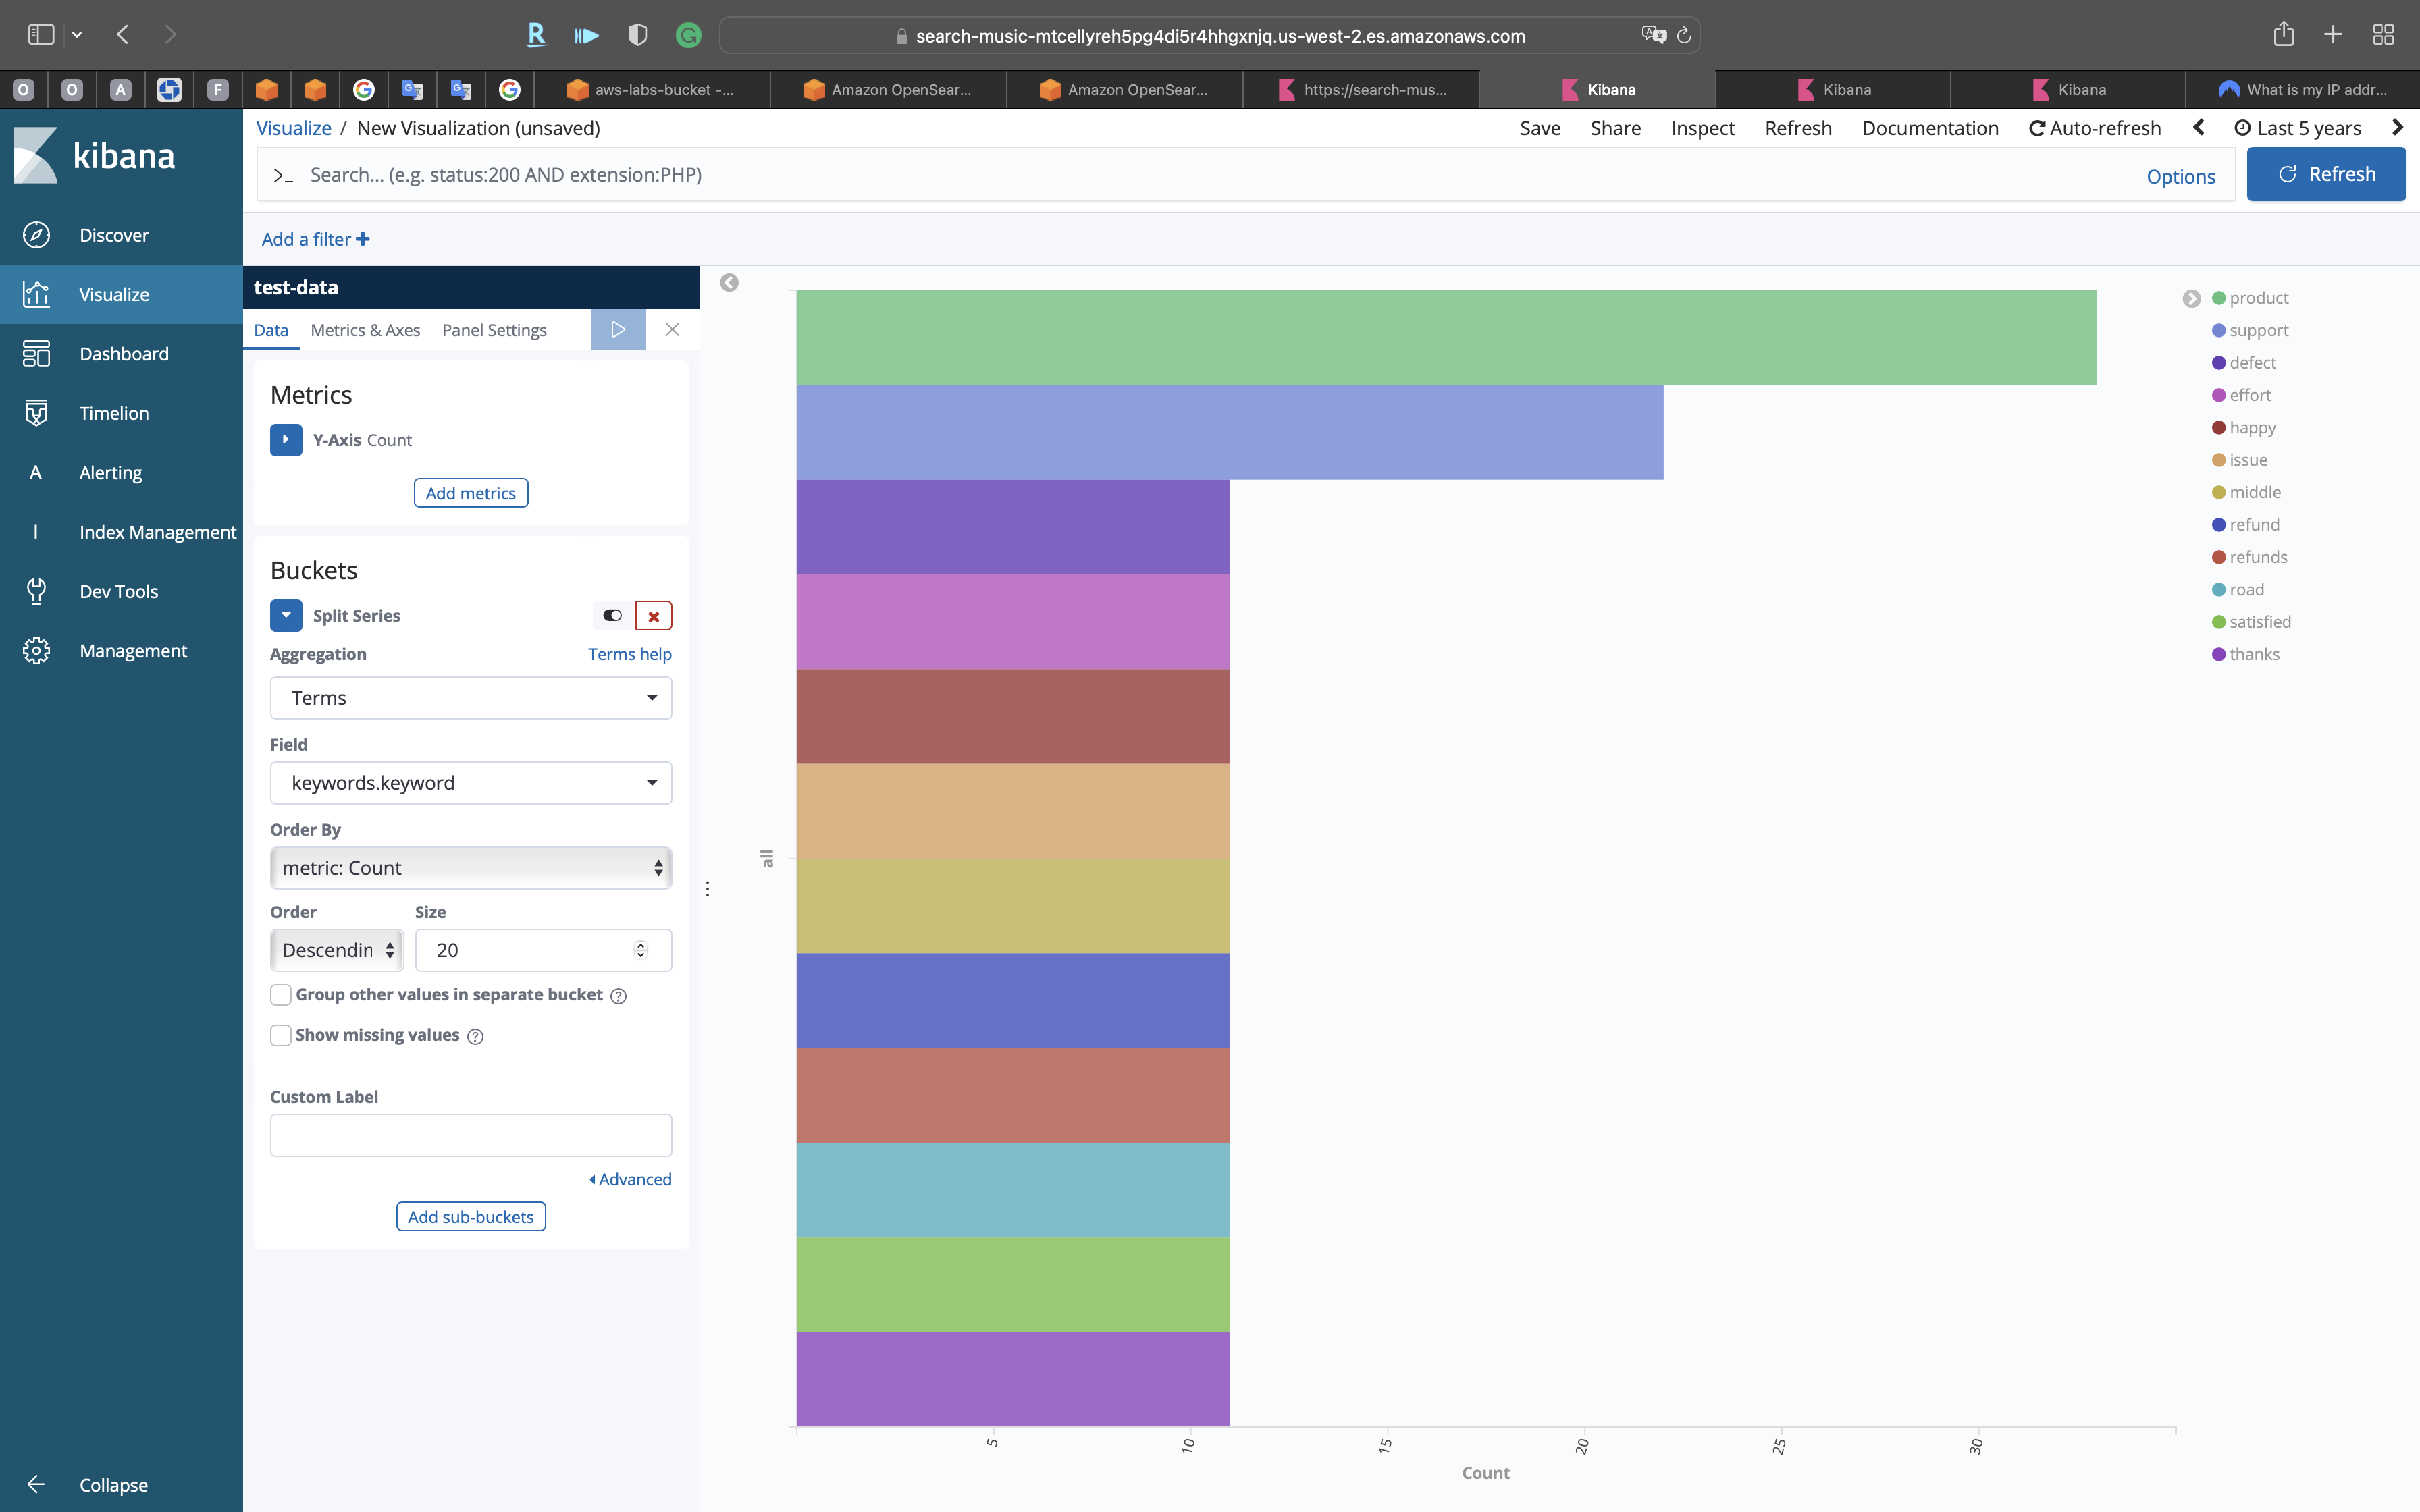
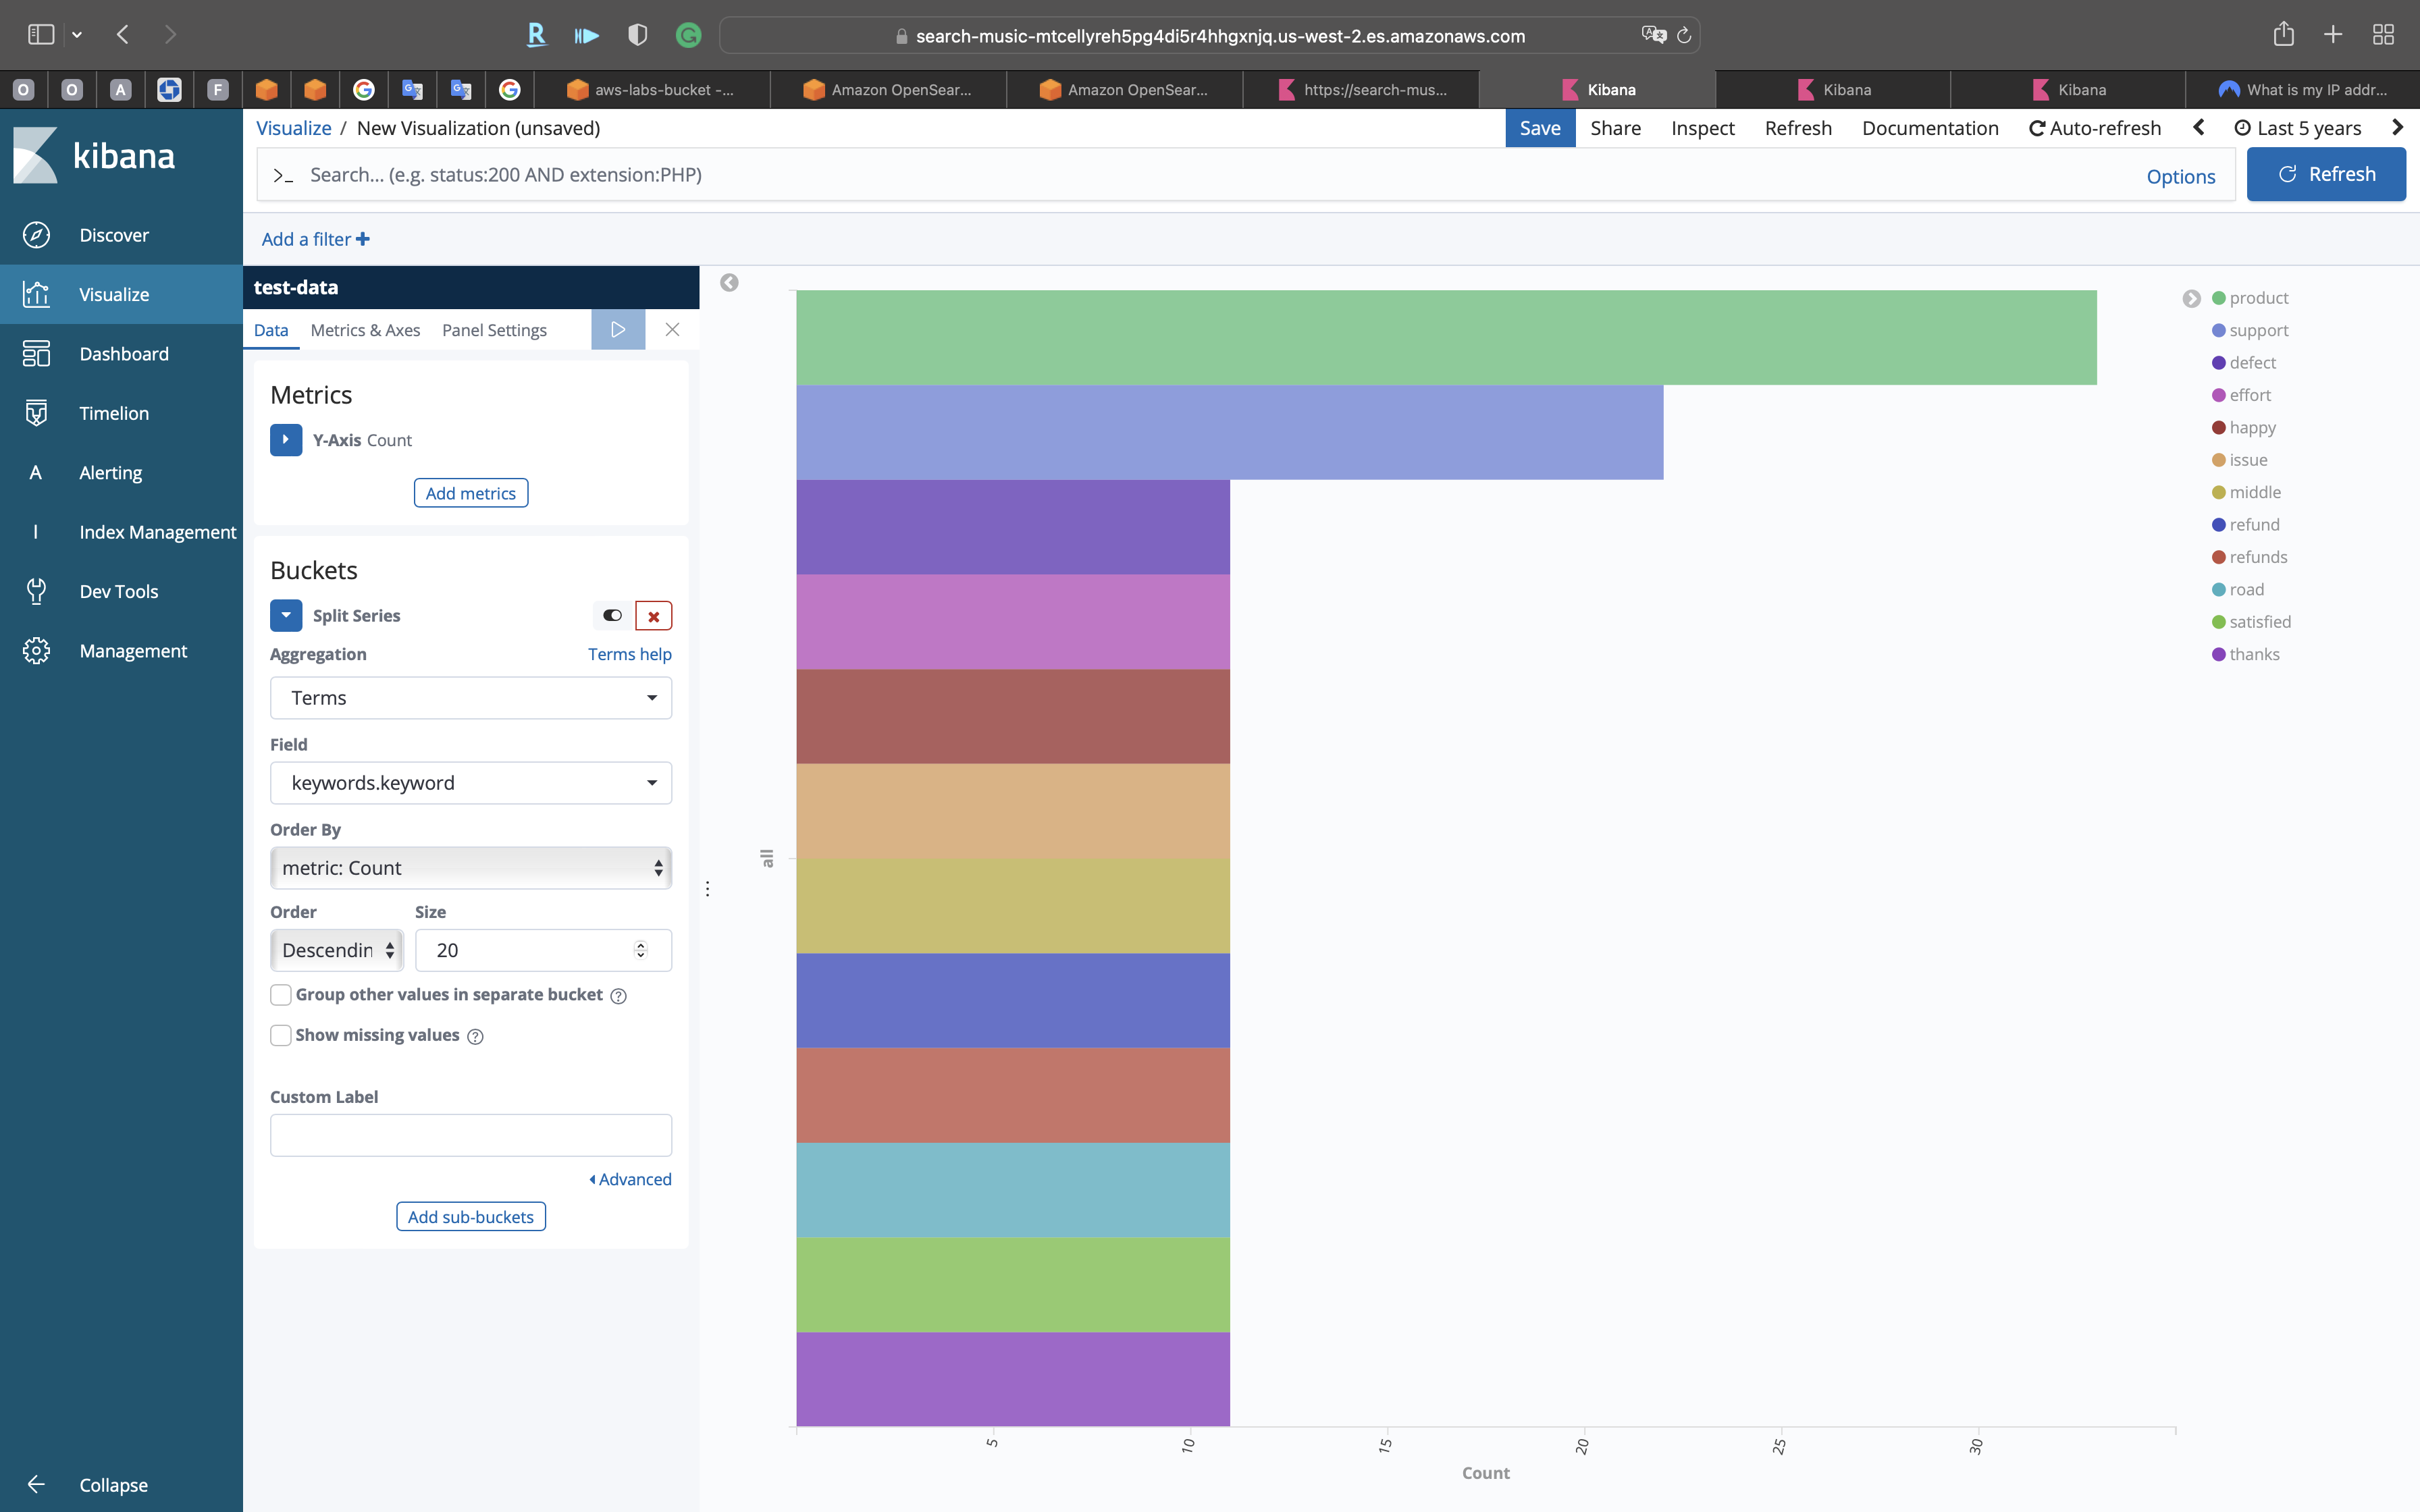
Horizontal Bar
Click on Visualize -> Create a visualization -> Horizontal Bar -> test-data
- Buckets:
Split Series - Aggregation:
Terms - Field:
keywords.keyword - Size:
20
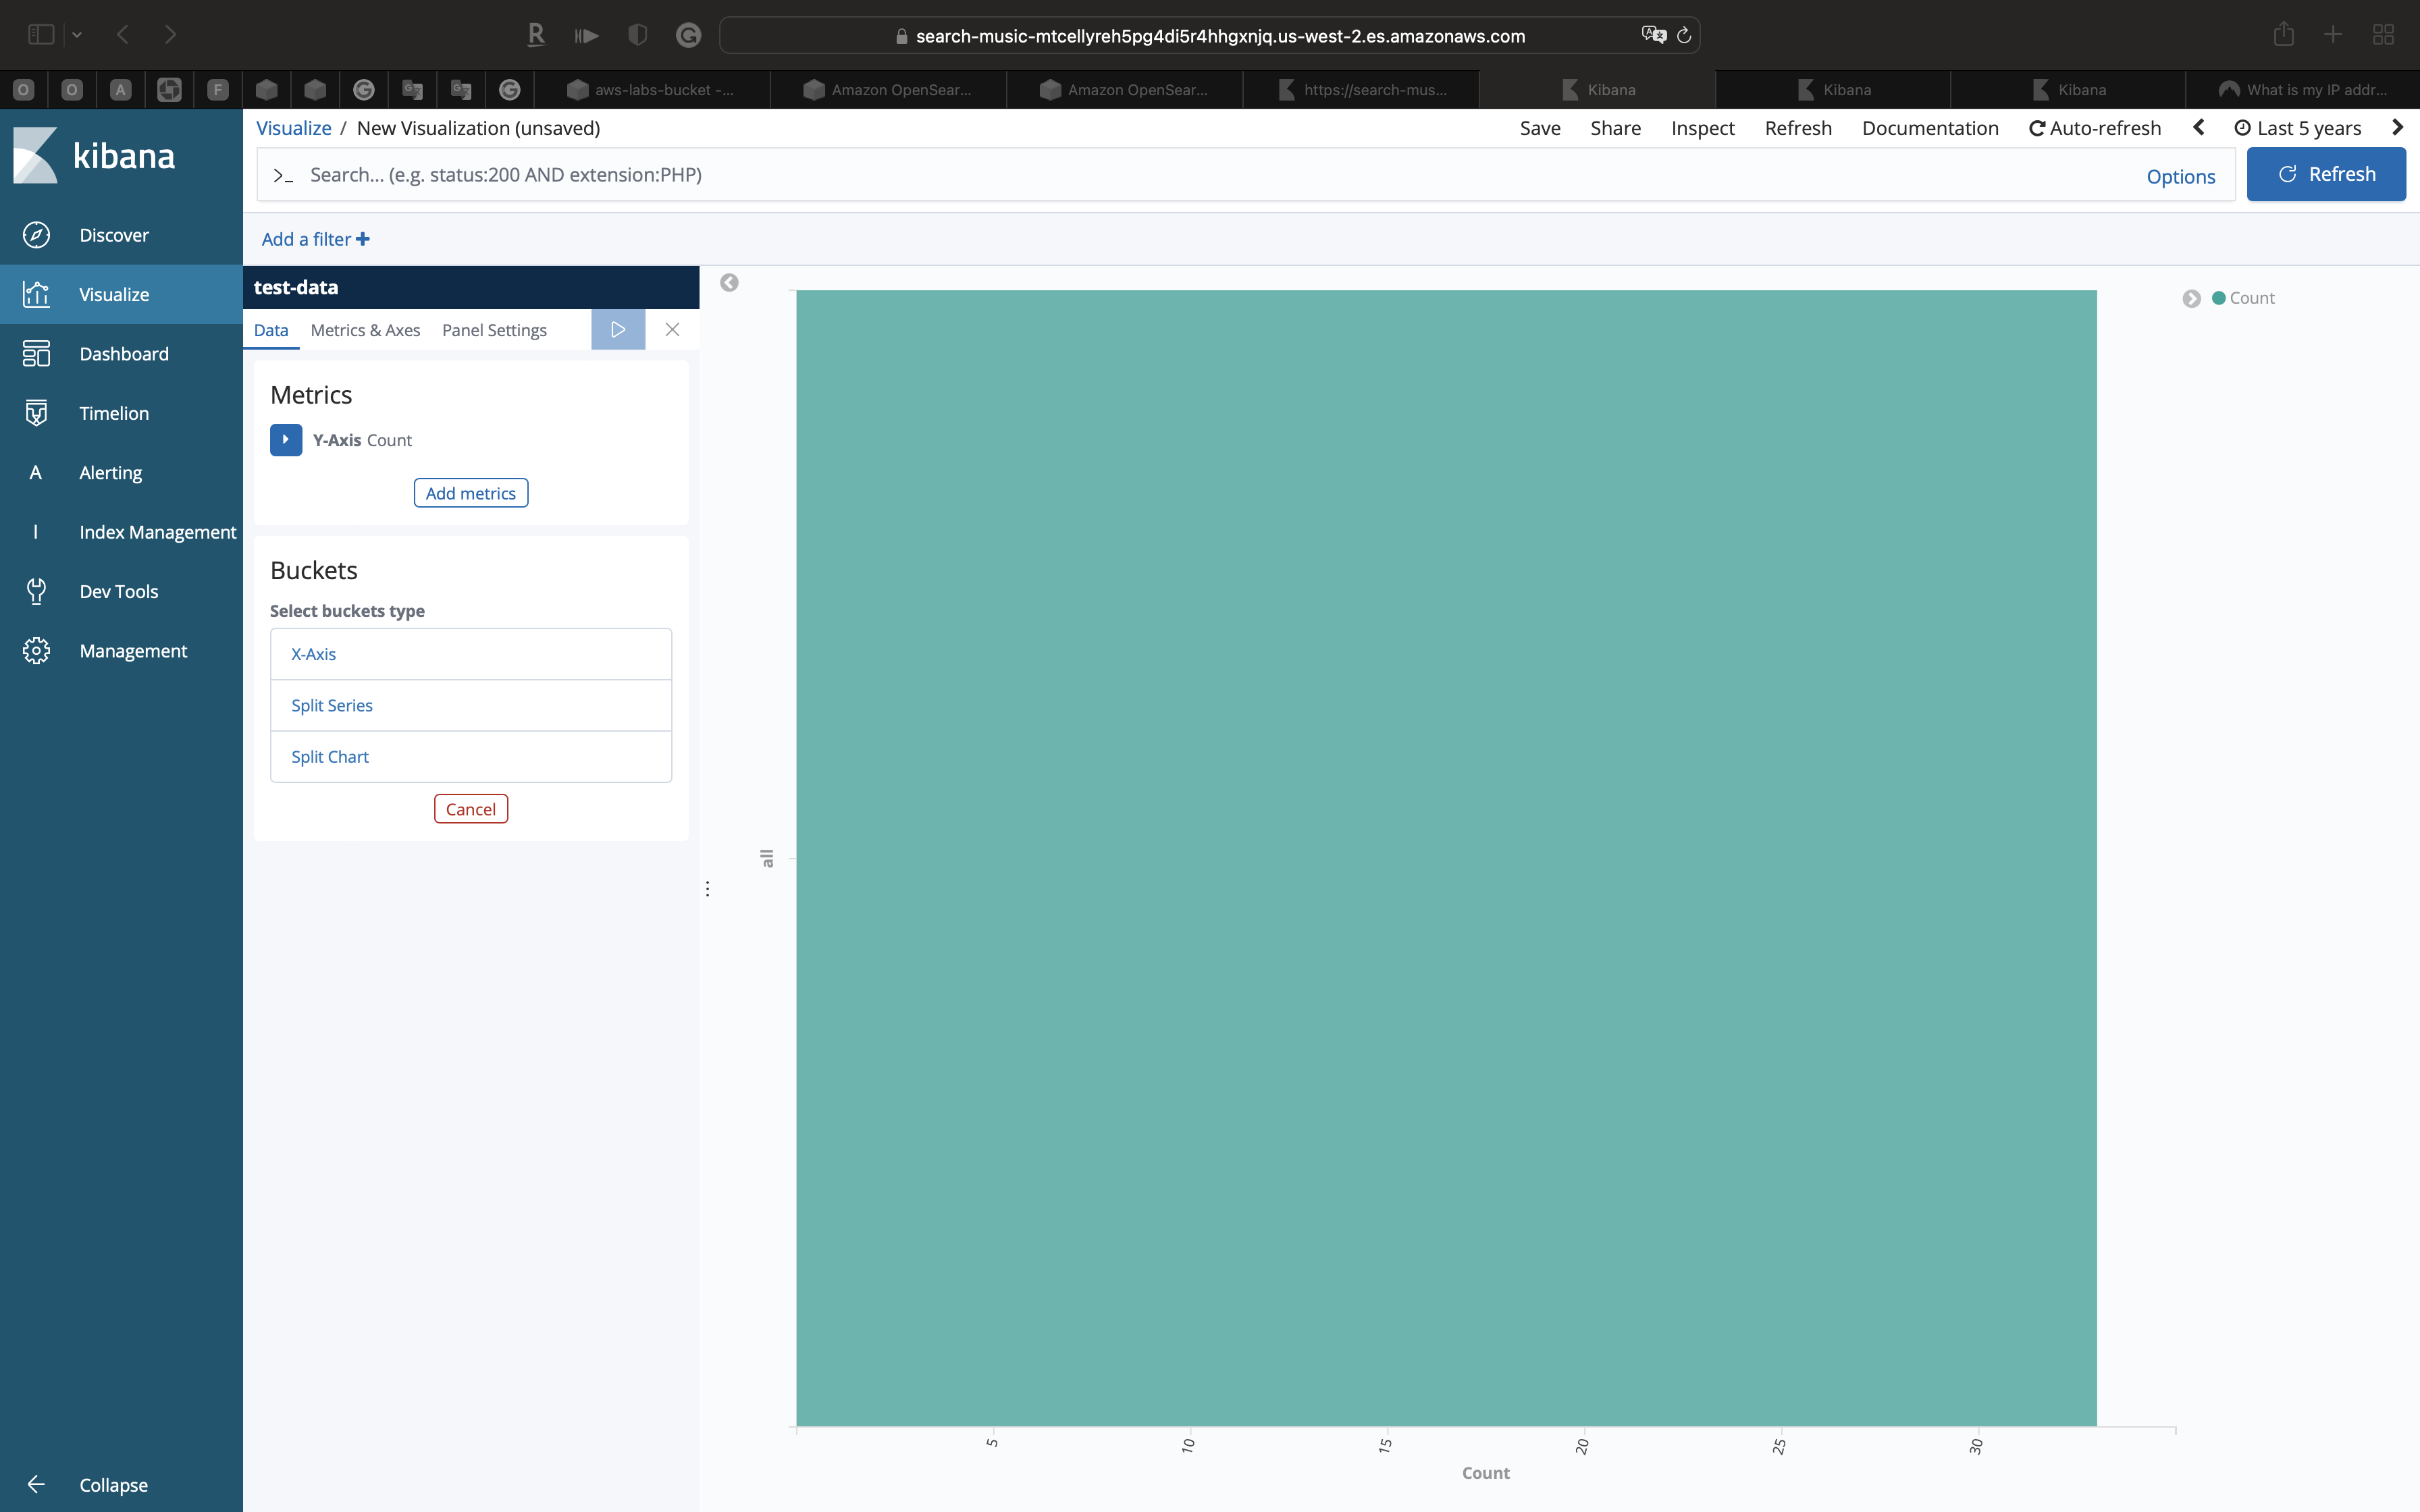
Click on Apply changes
We can see there are 12 keywords
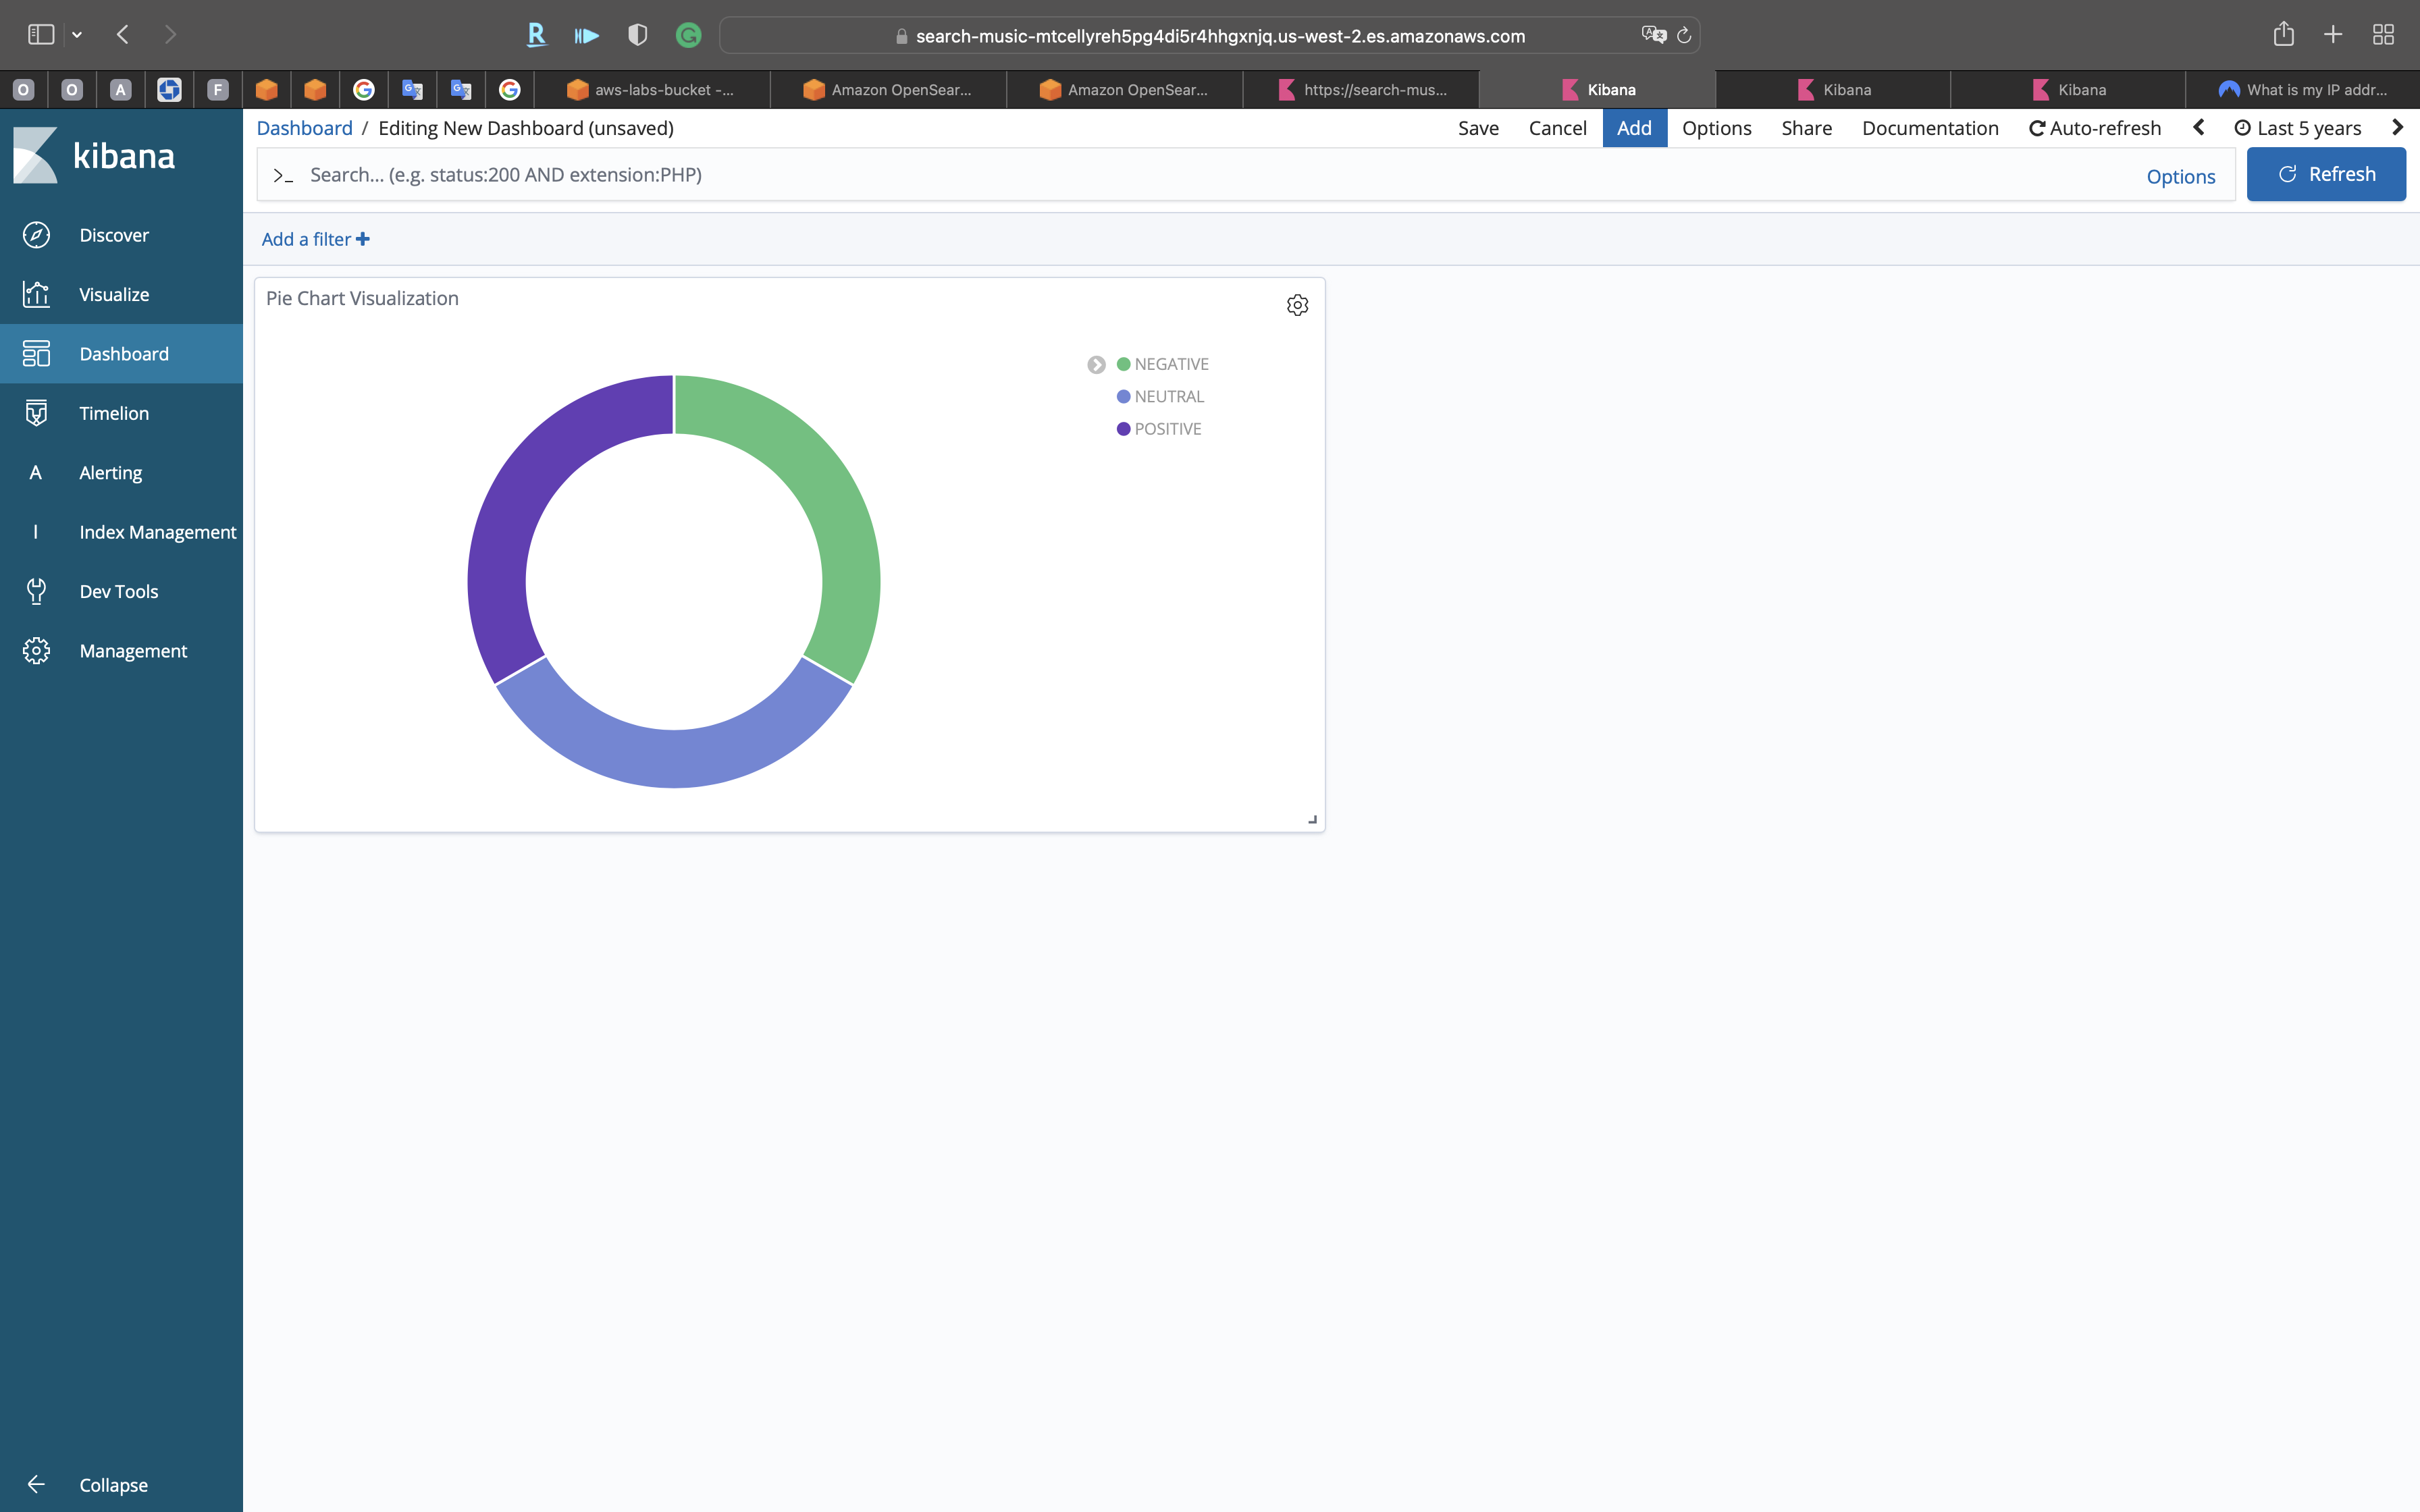
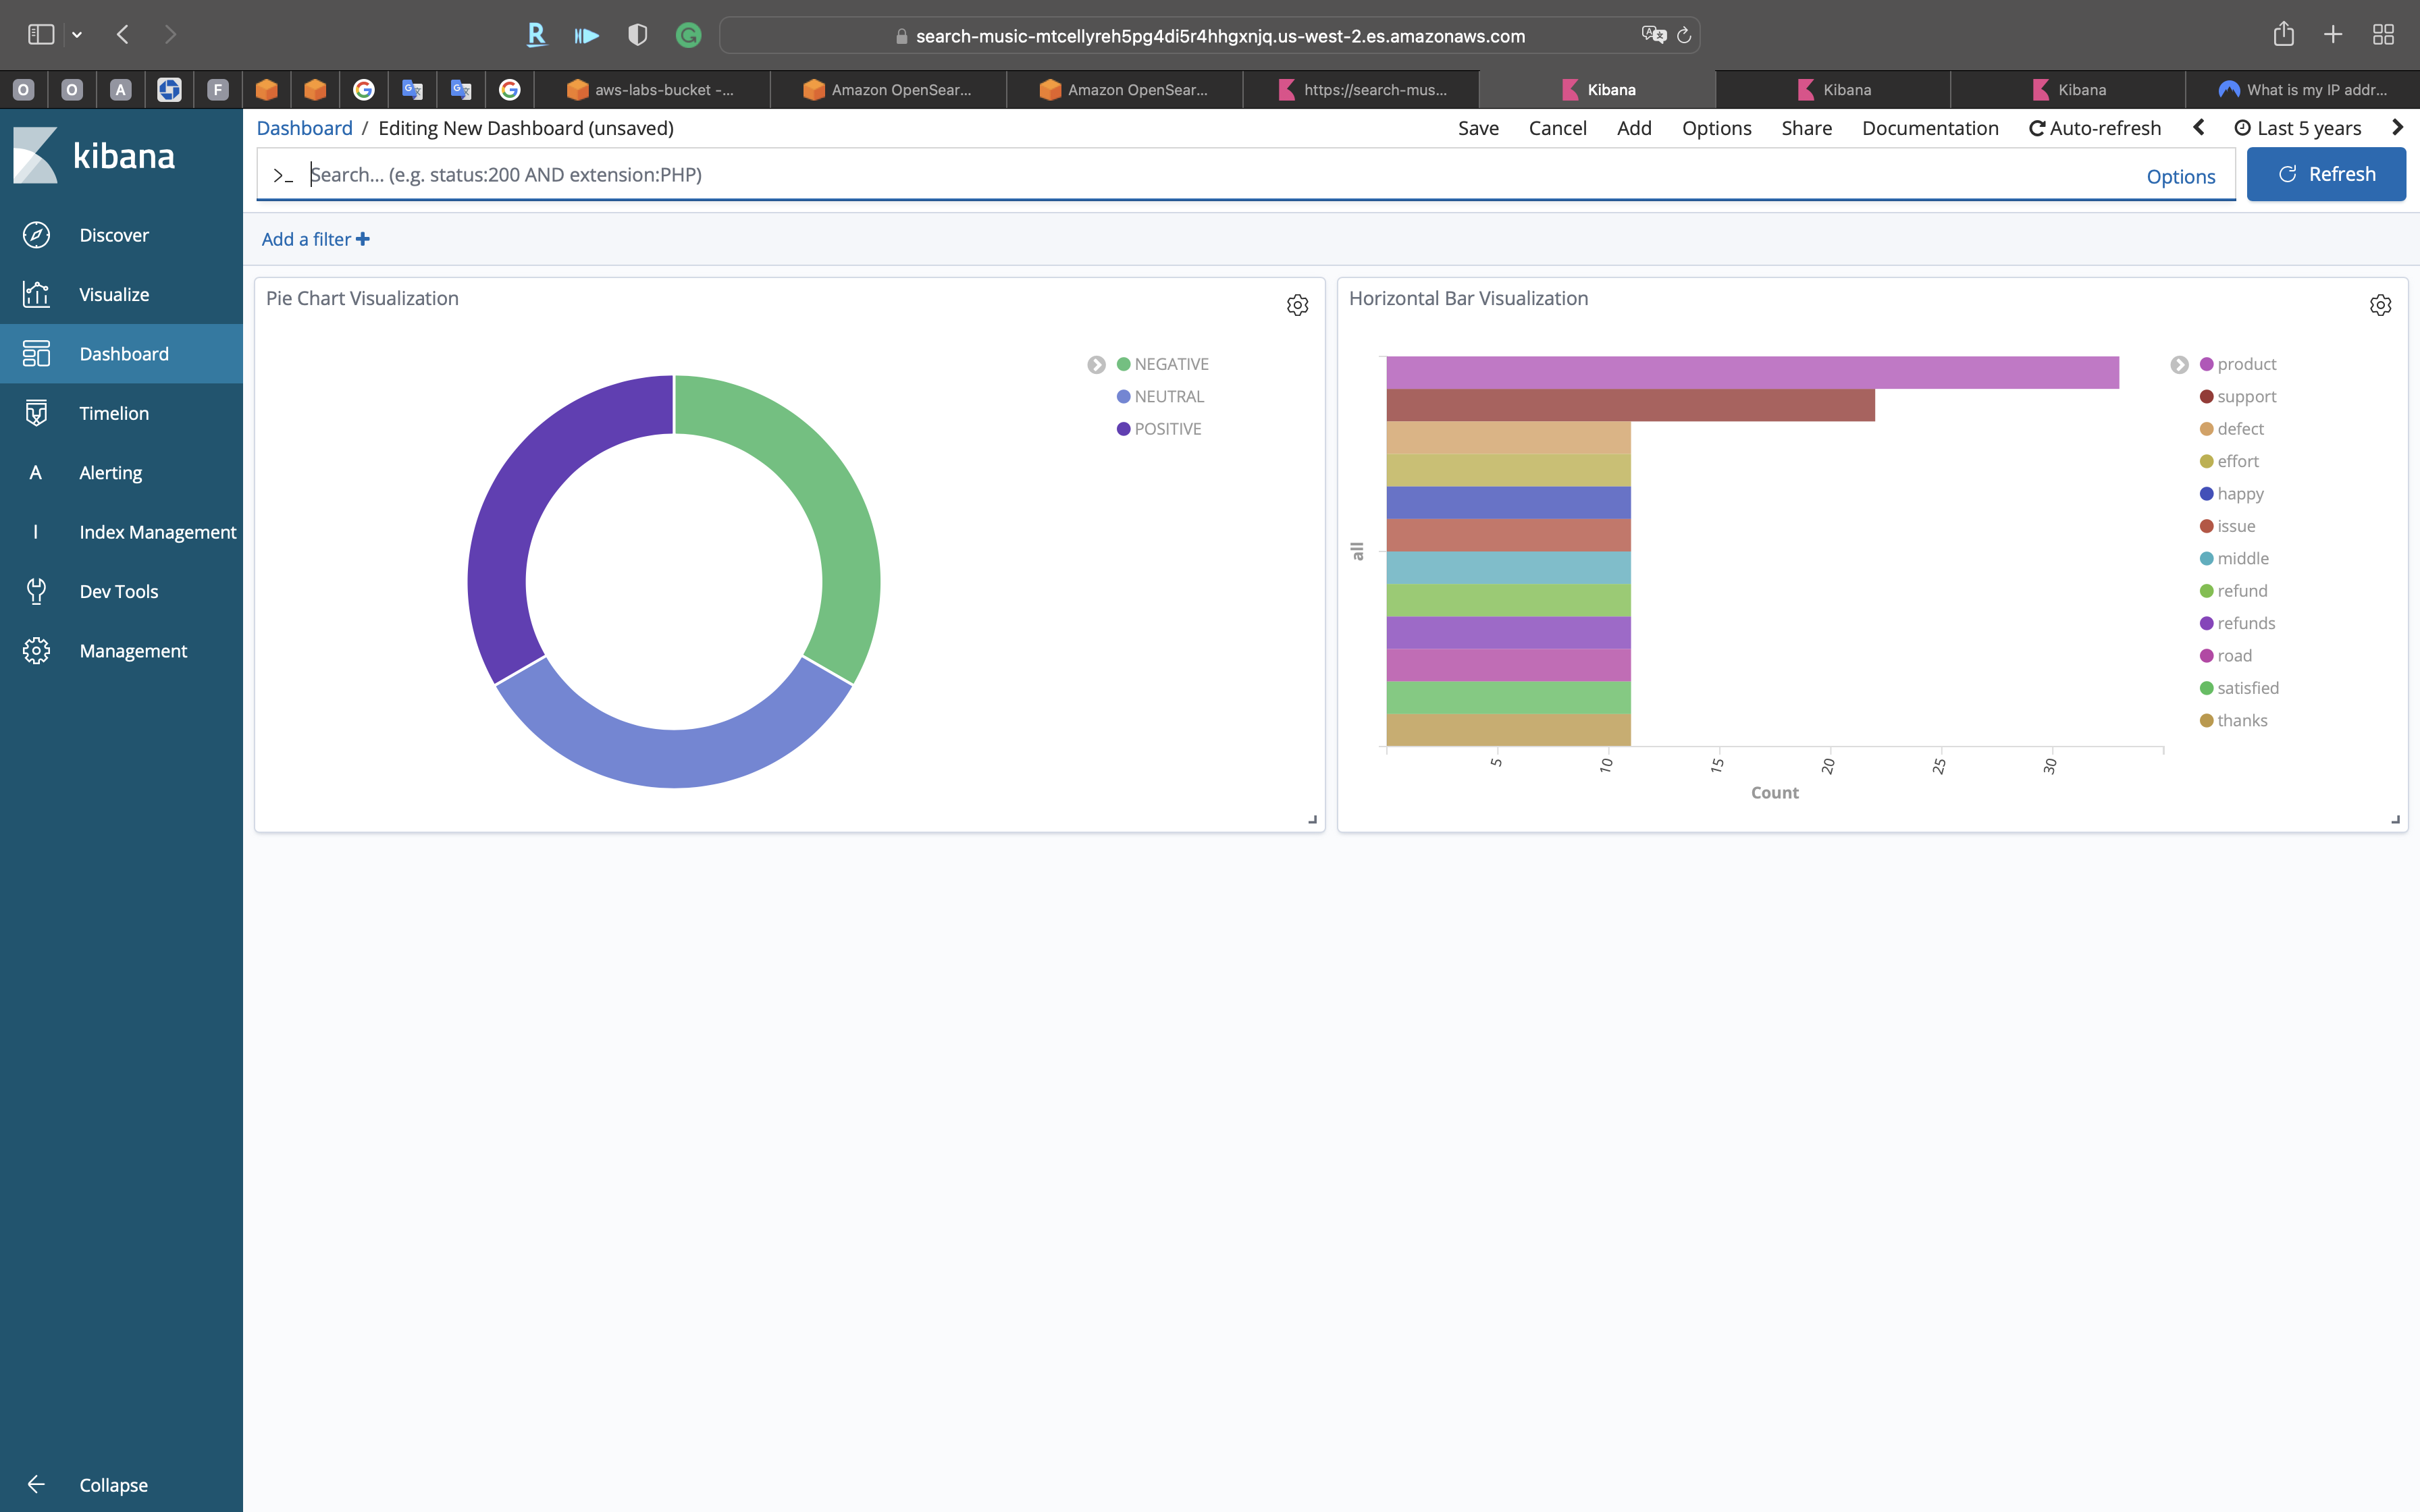
Dashboard
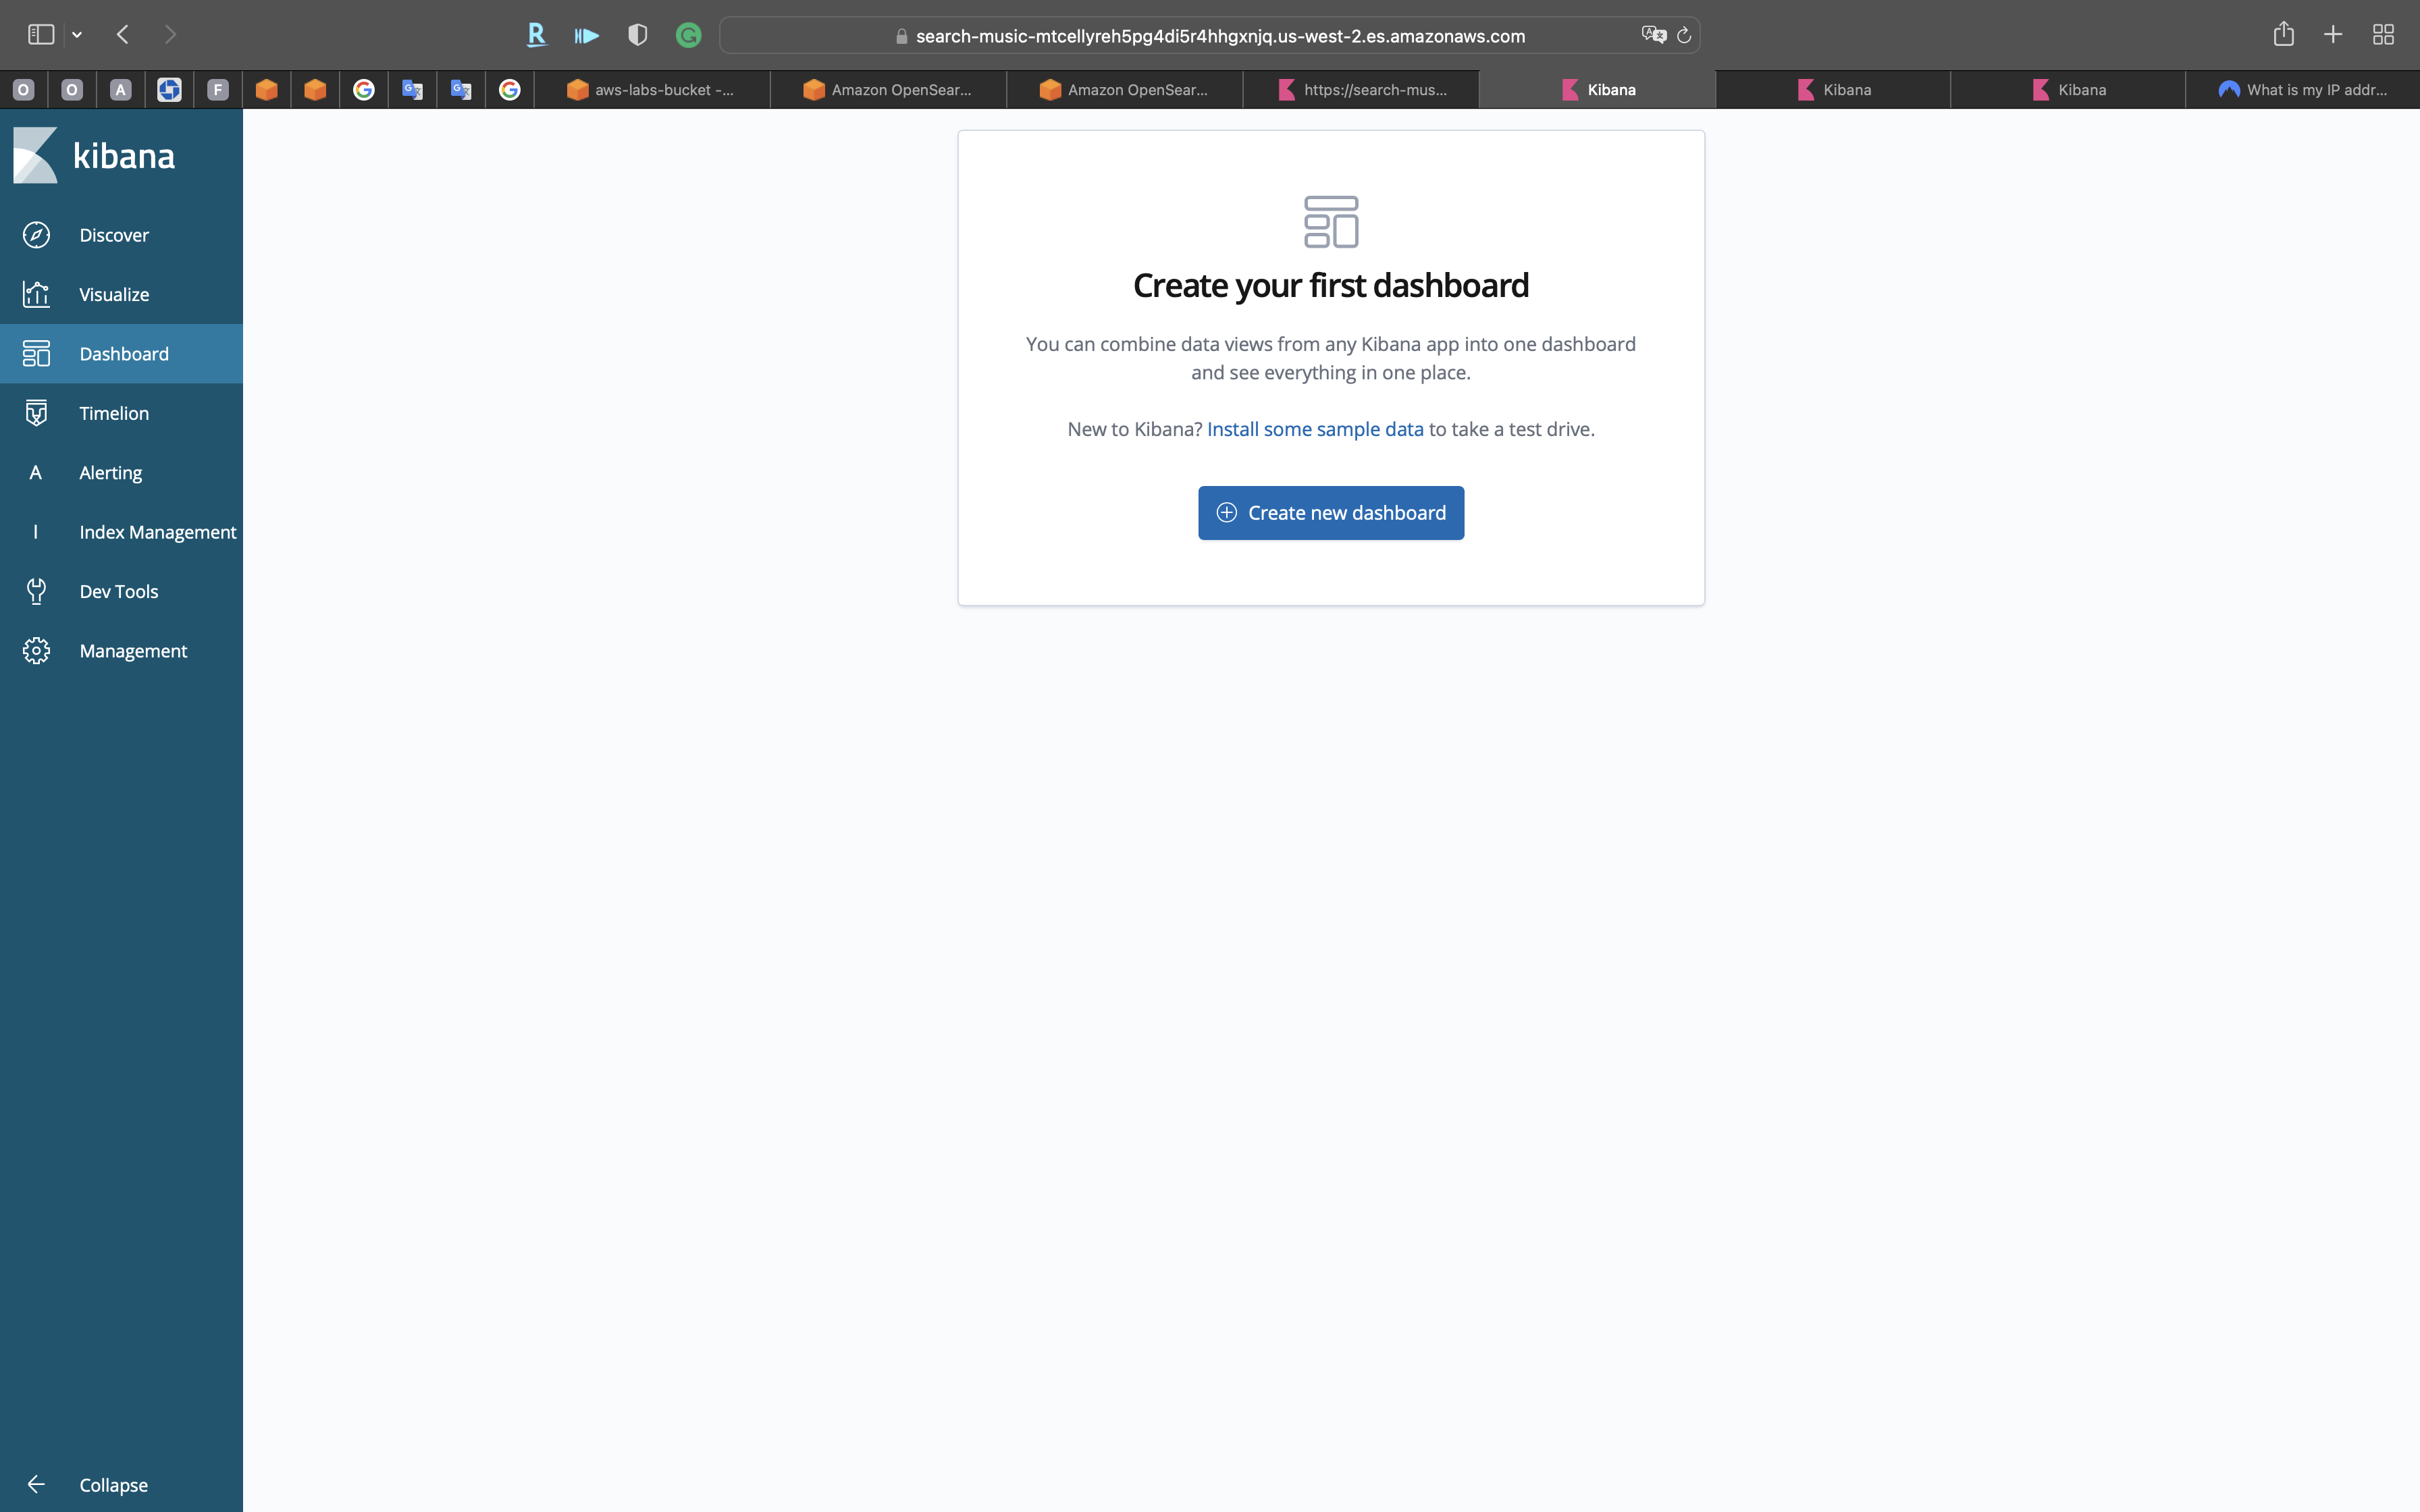
Click on Dashboard on the navigation panel.
Click on Create a dashboard
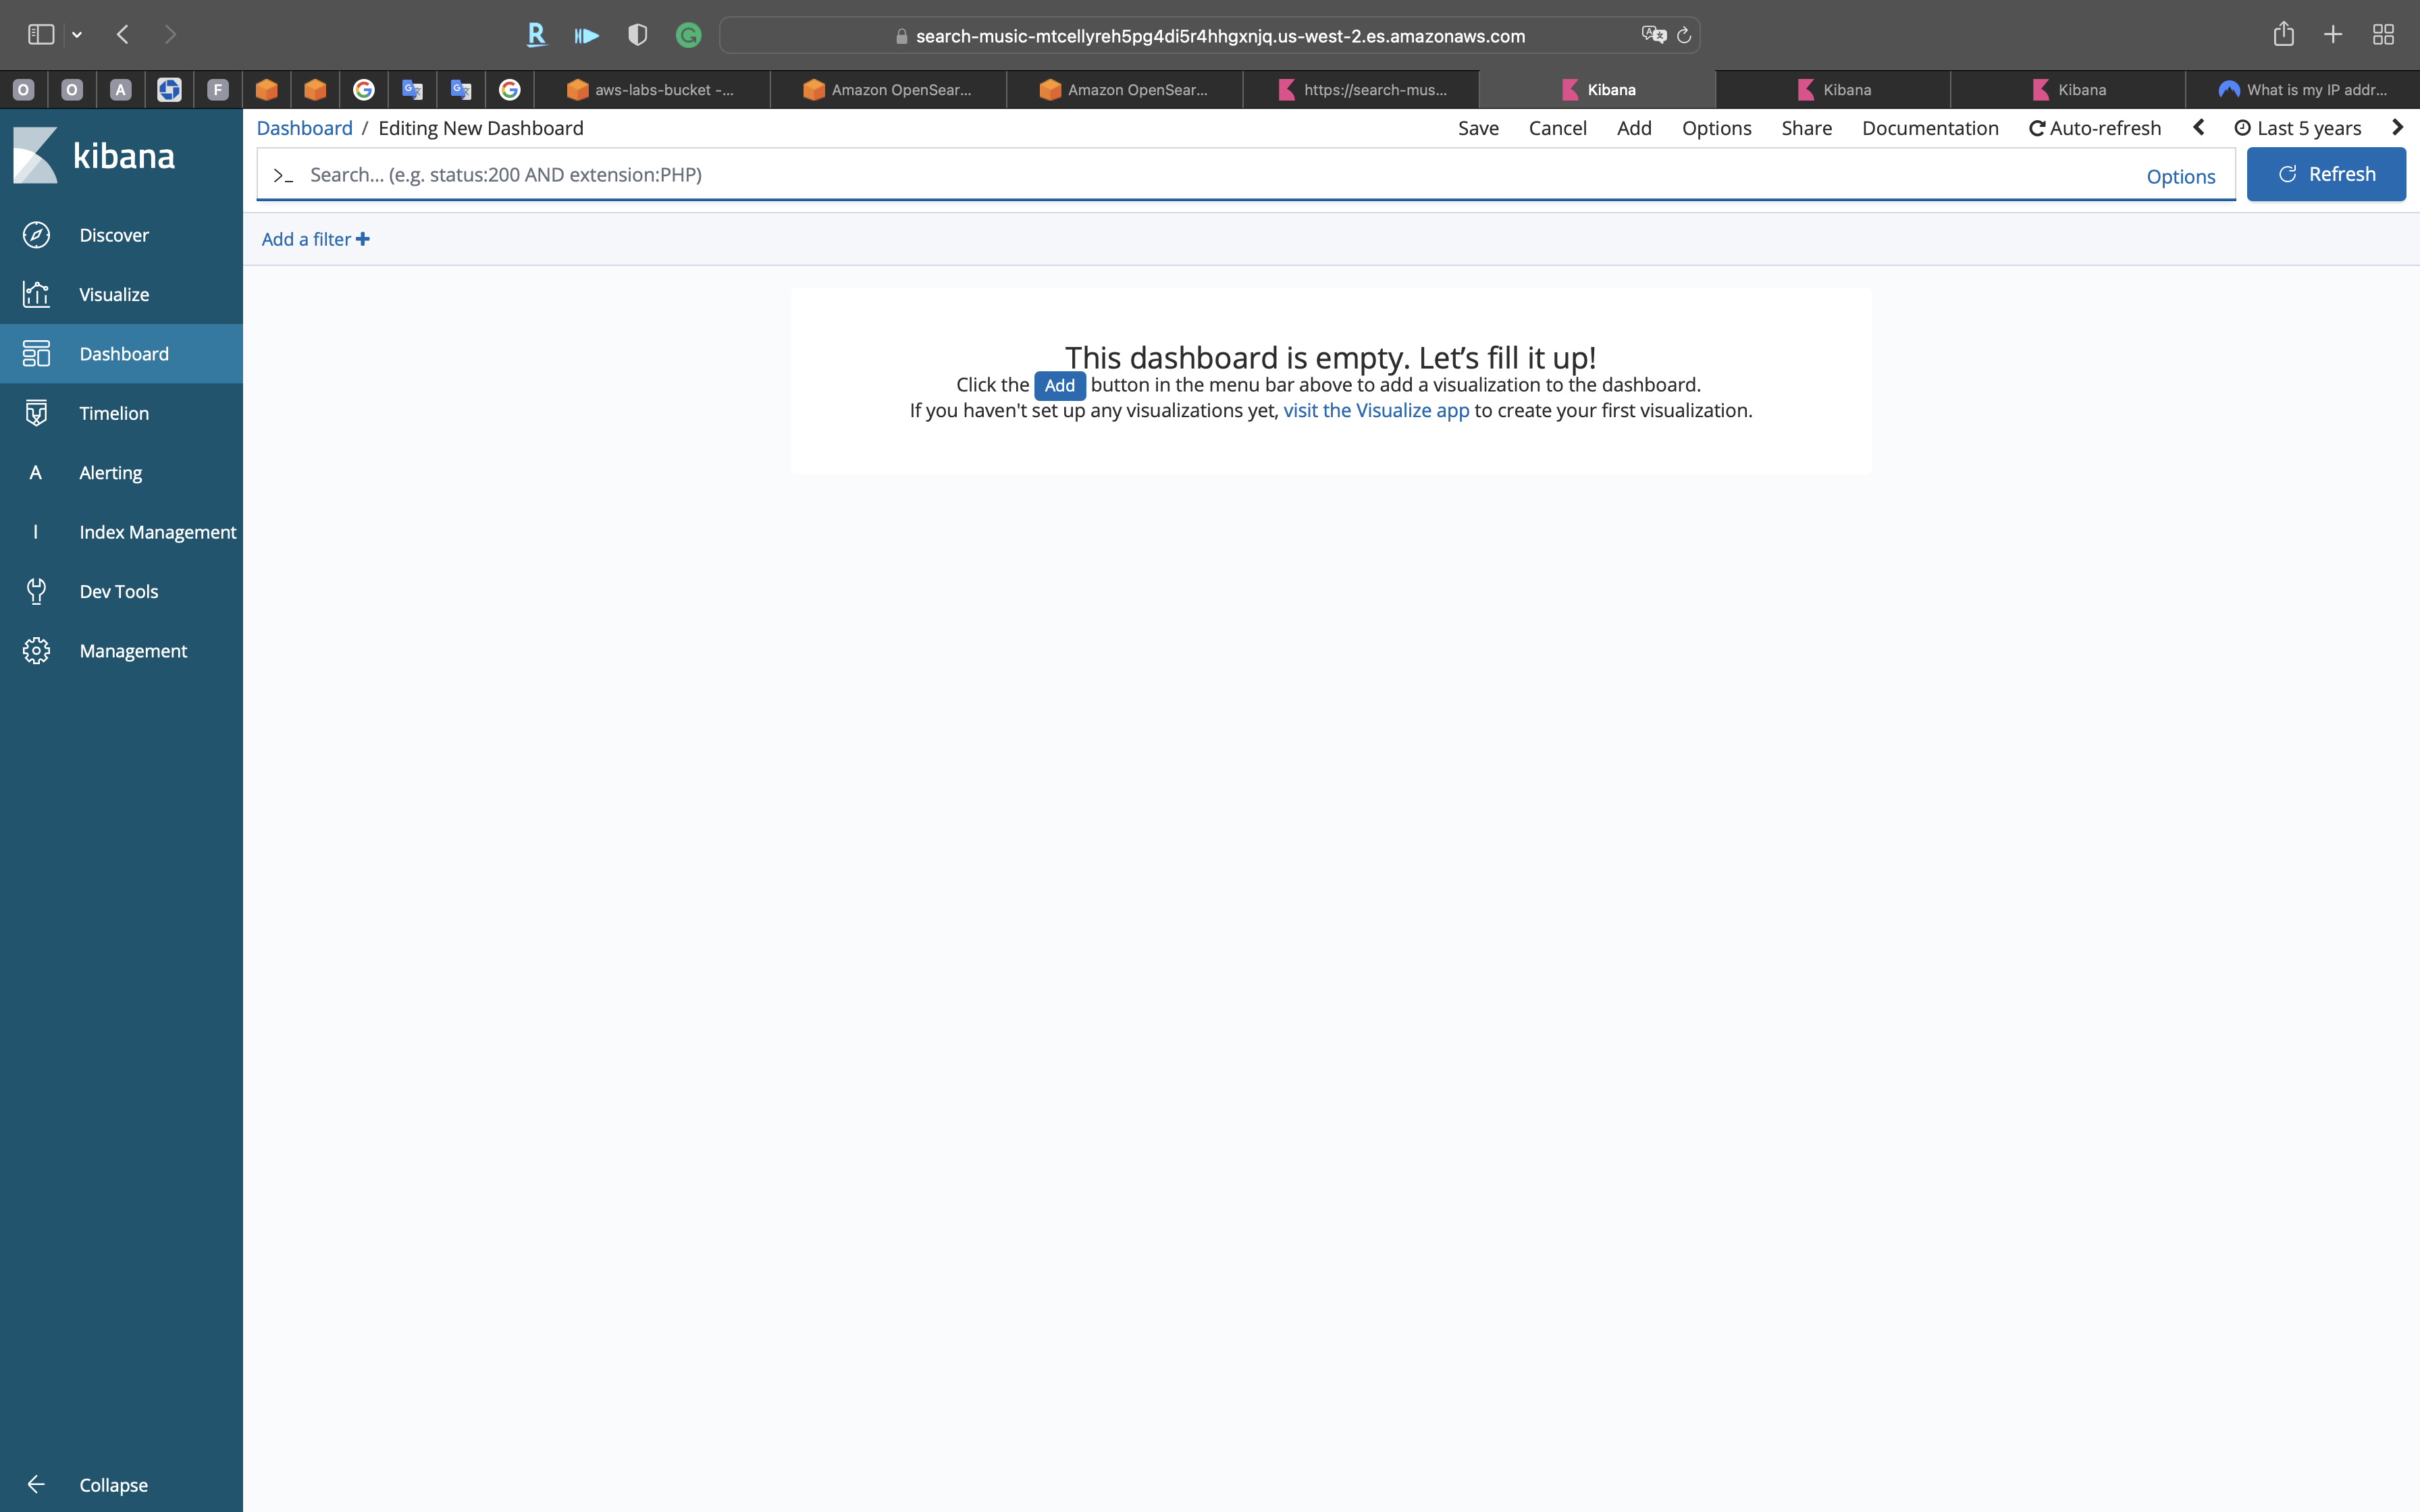
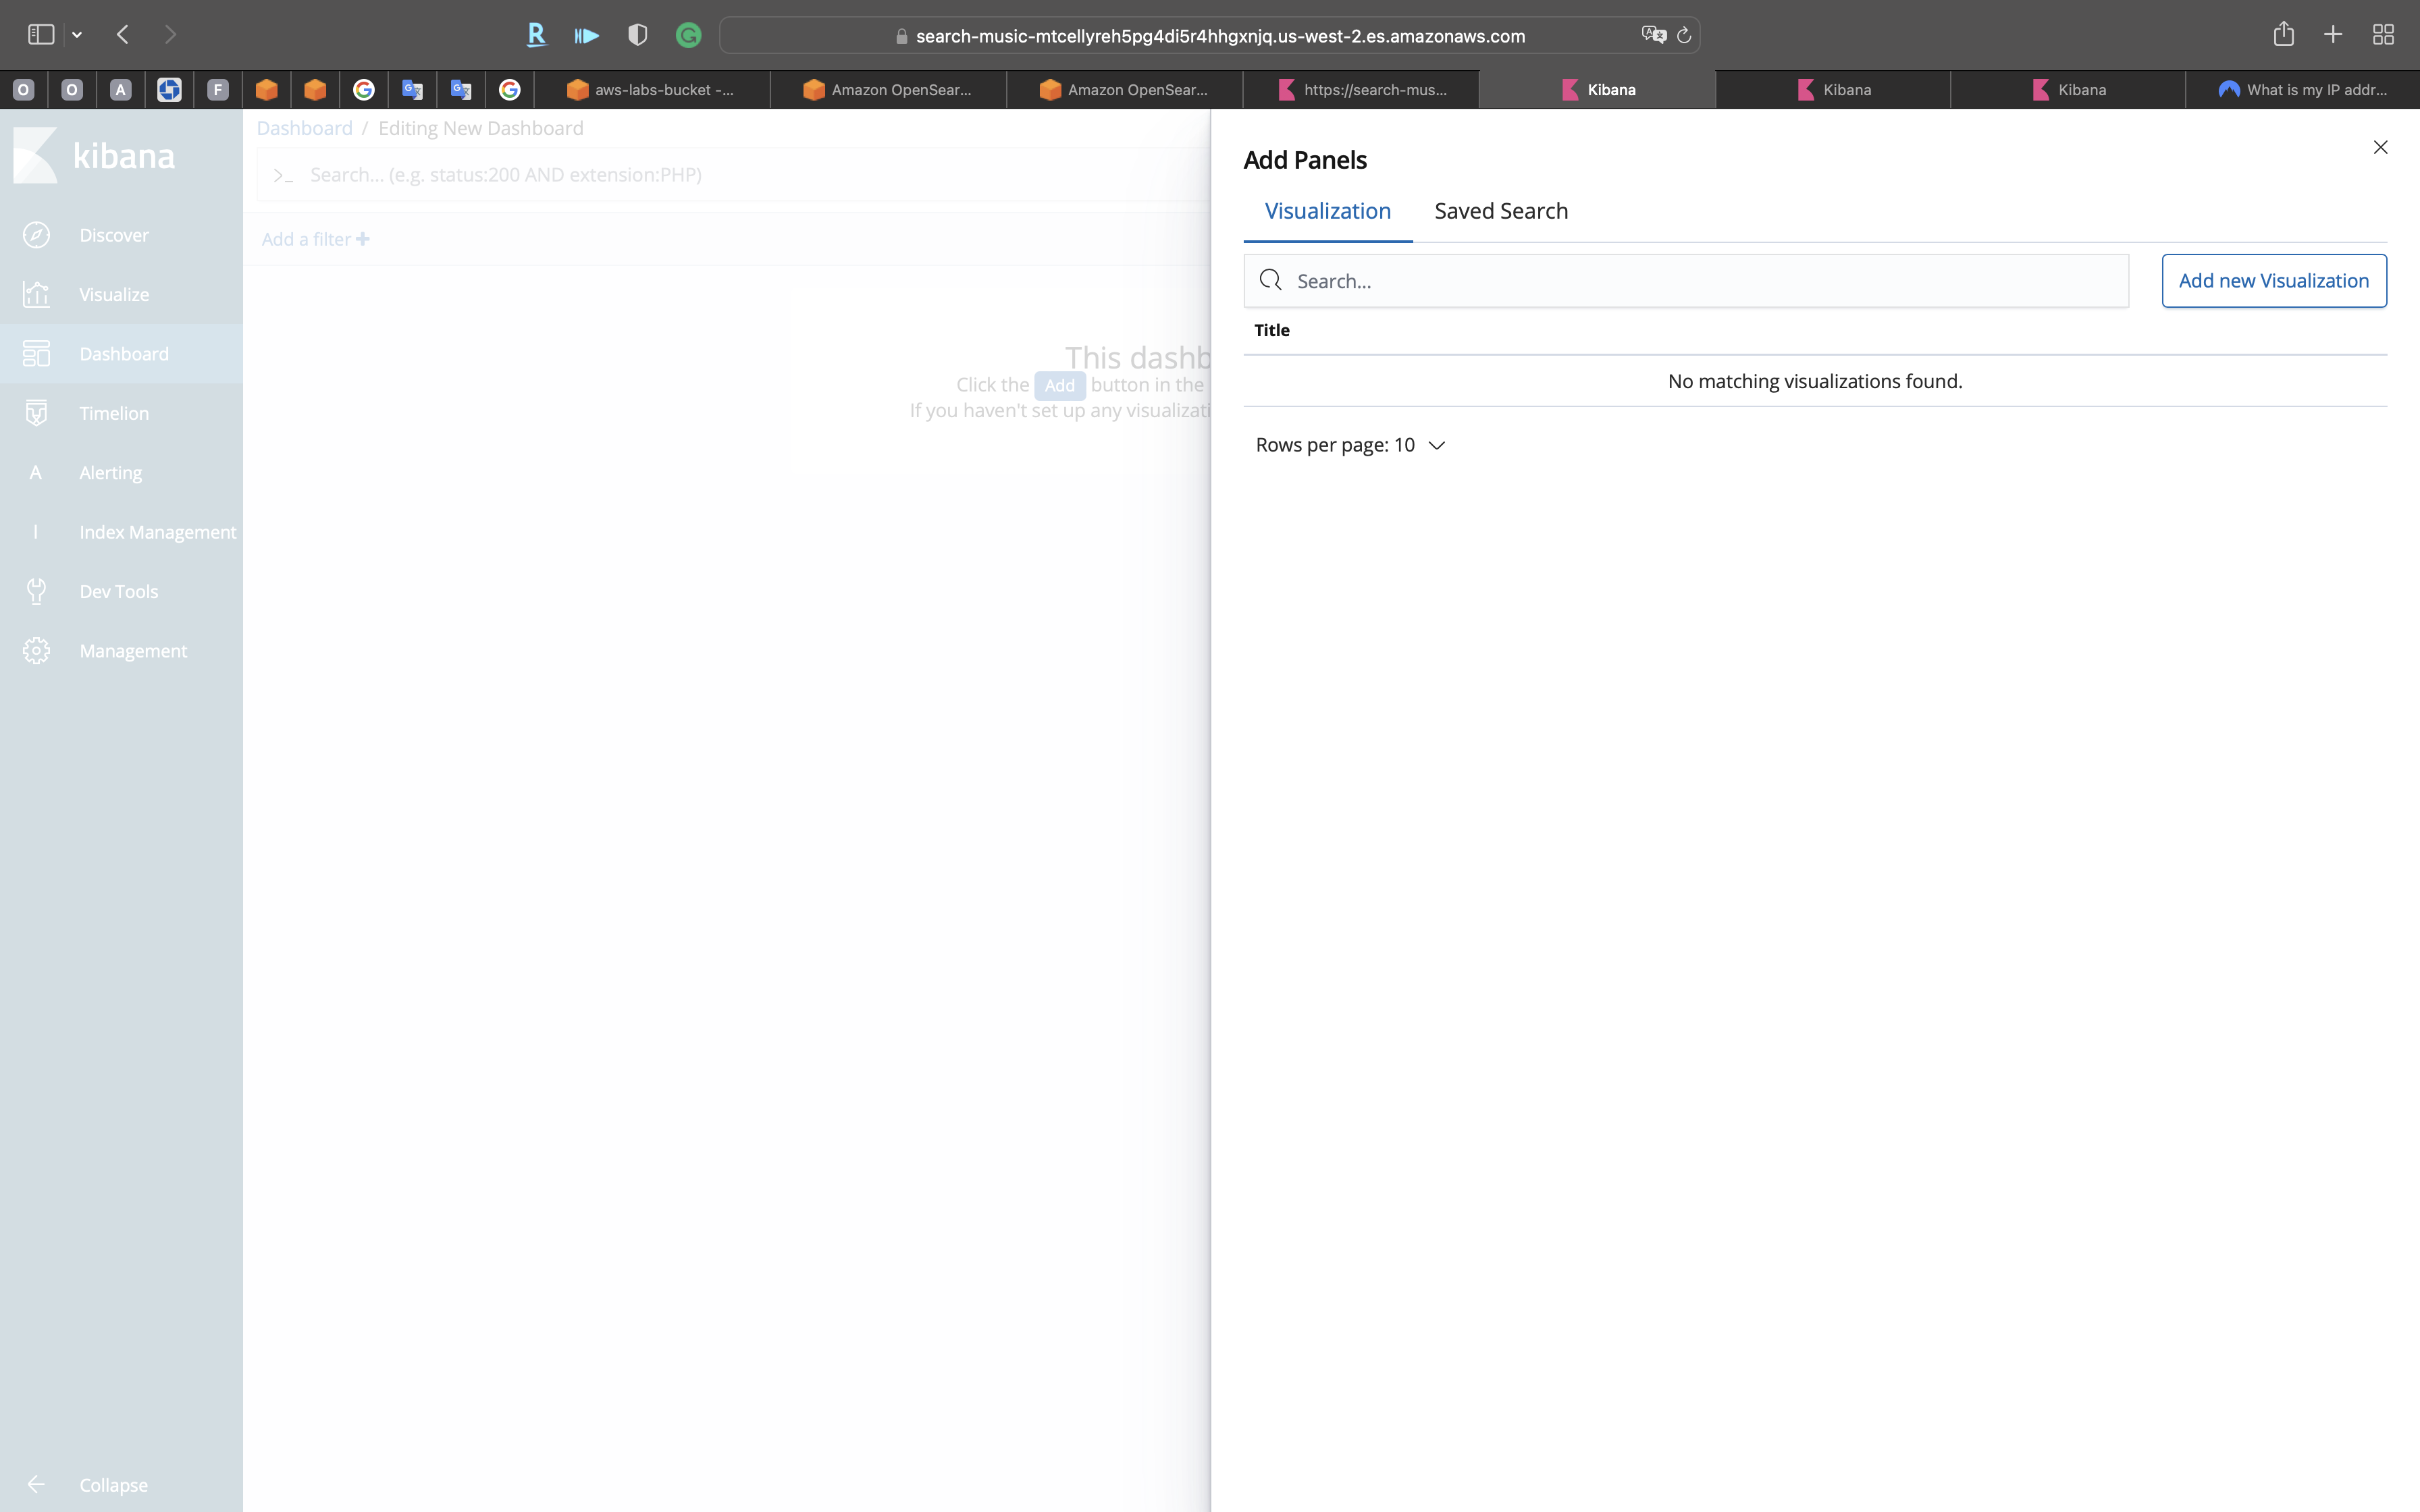
Click on Add
Click on Add new visualization
Pie
Add the same pie chart we did on above steps:
- Select buckets type:
Split Slices - Aggregation:
Terms - Field:
sentiment.keyword
Click on Apply changes
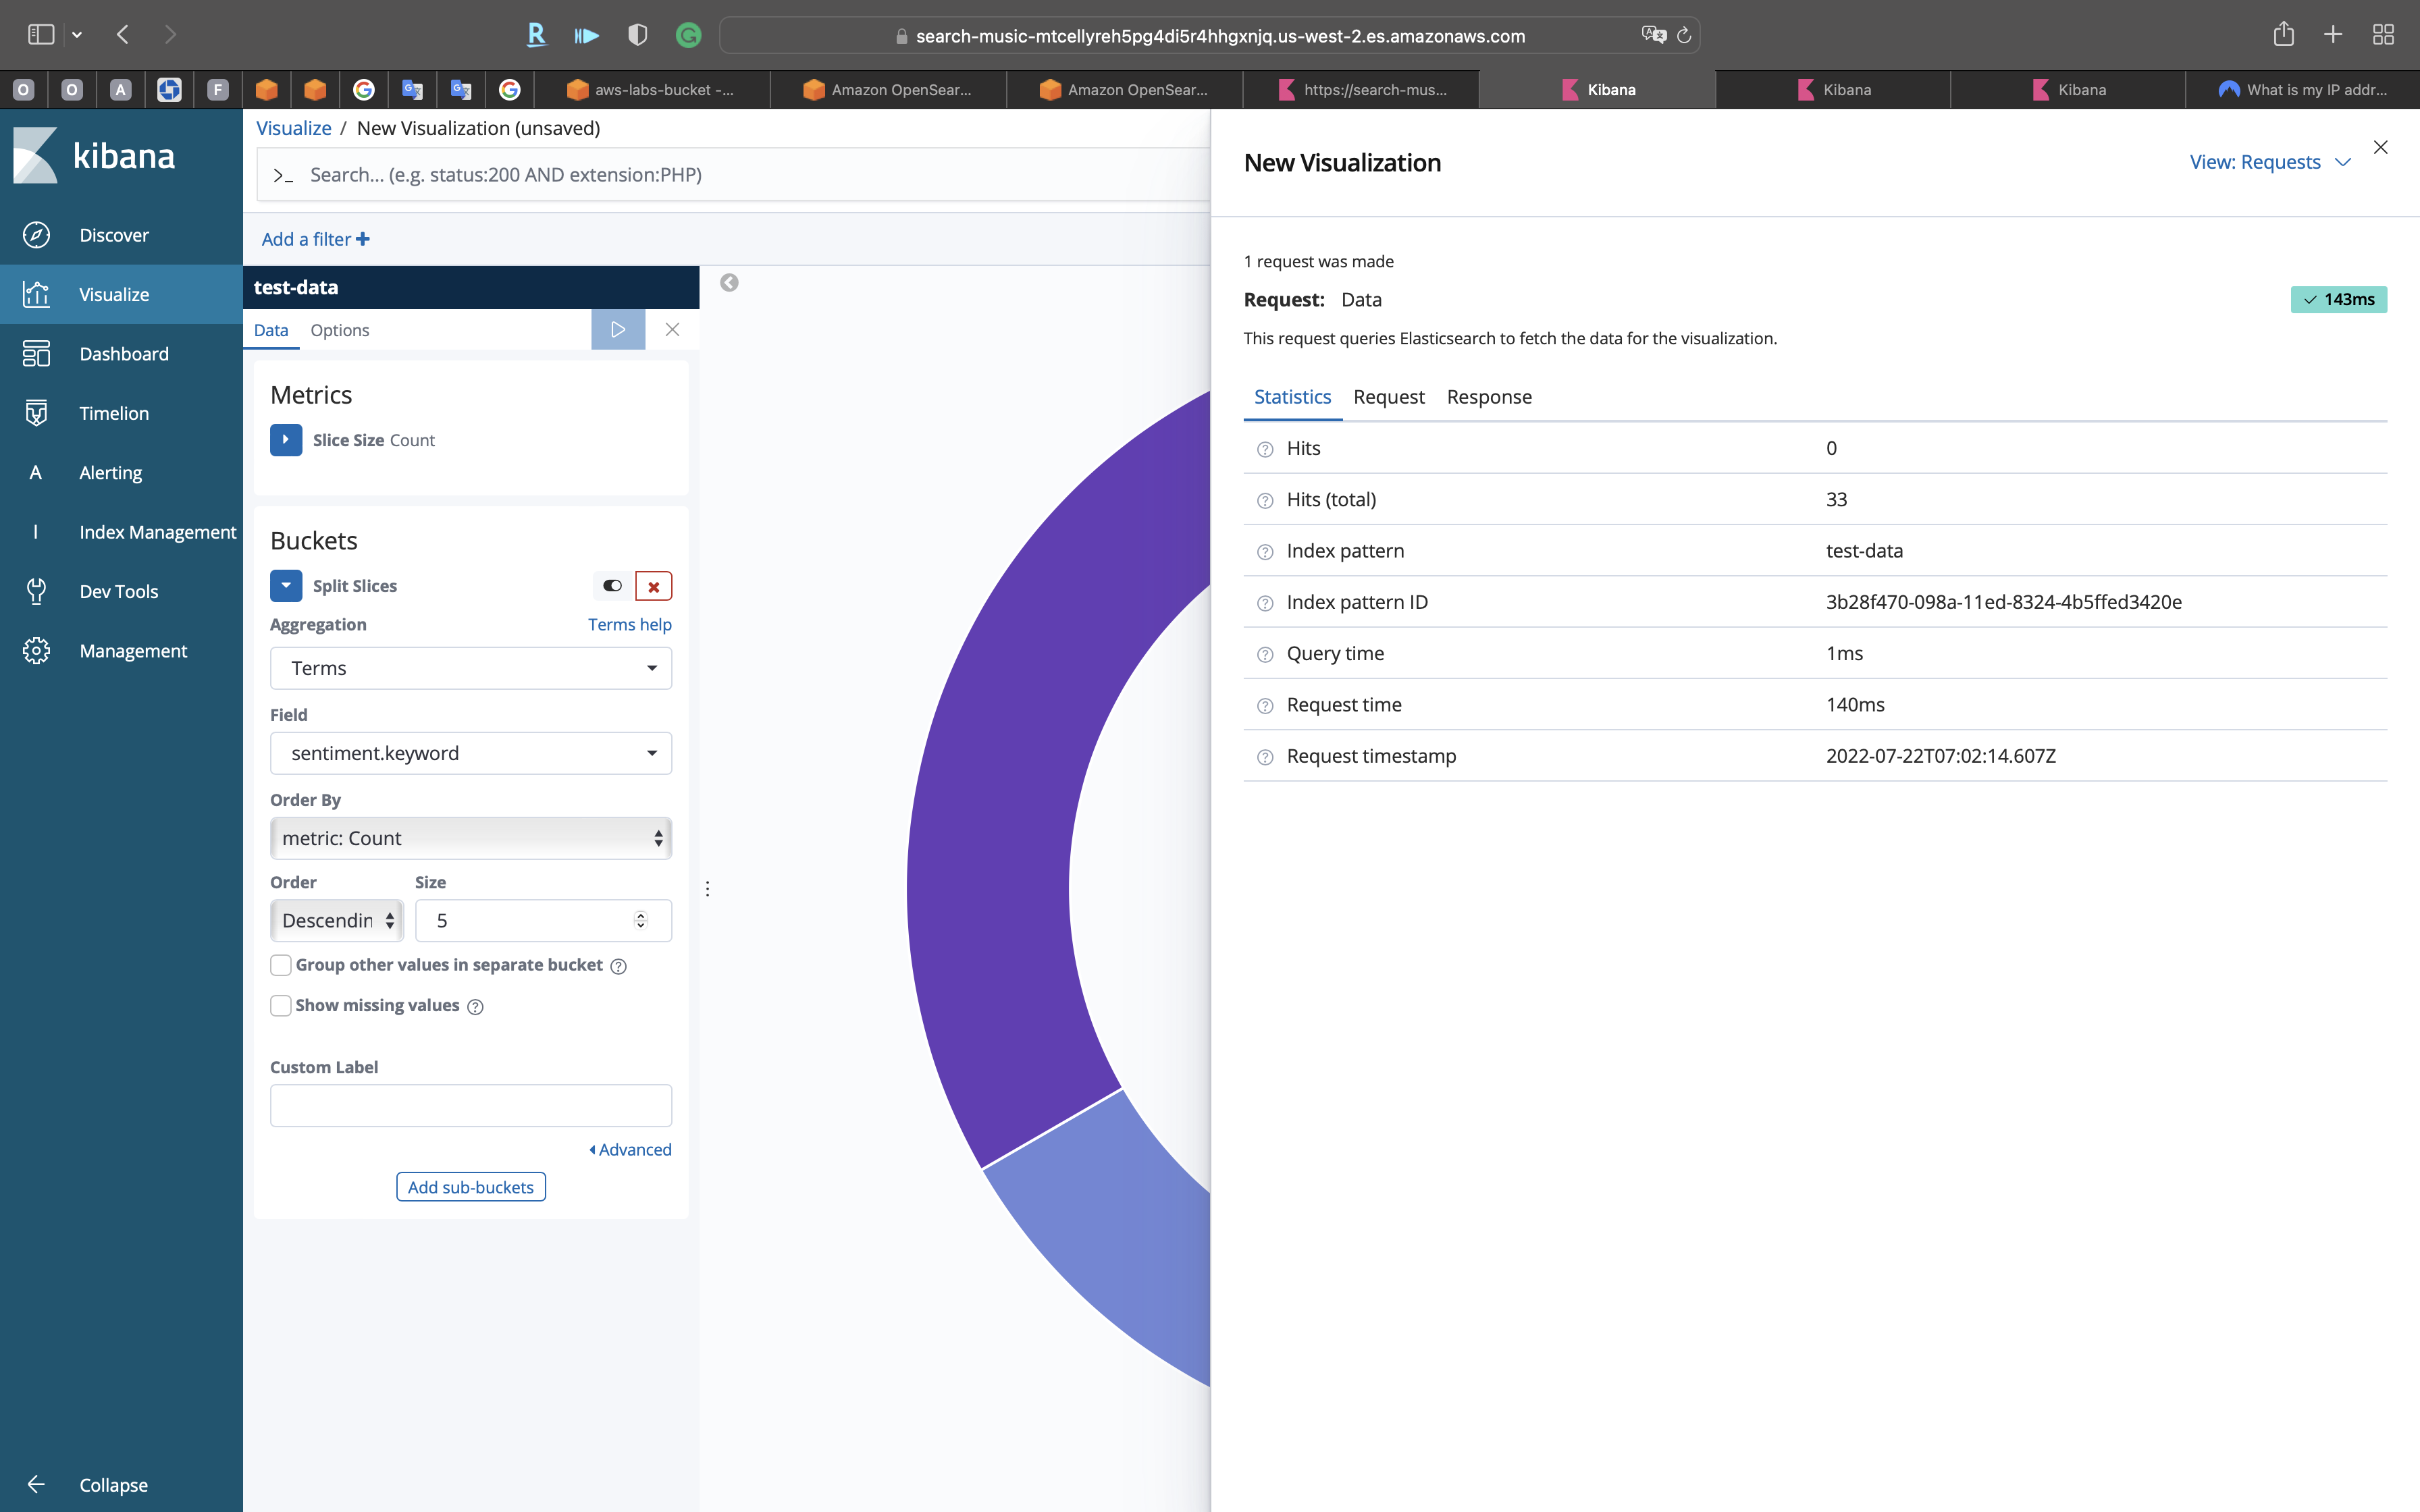
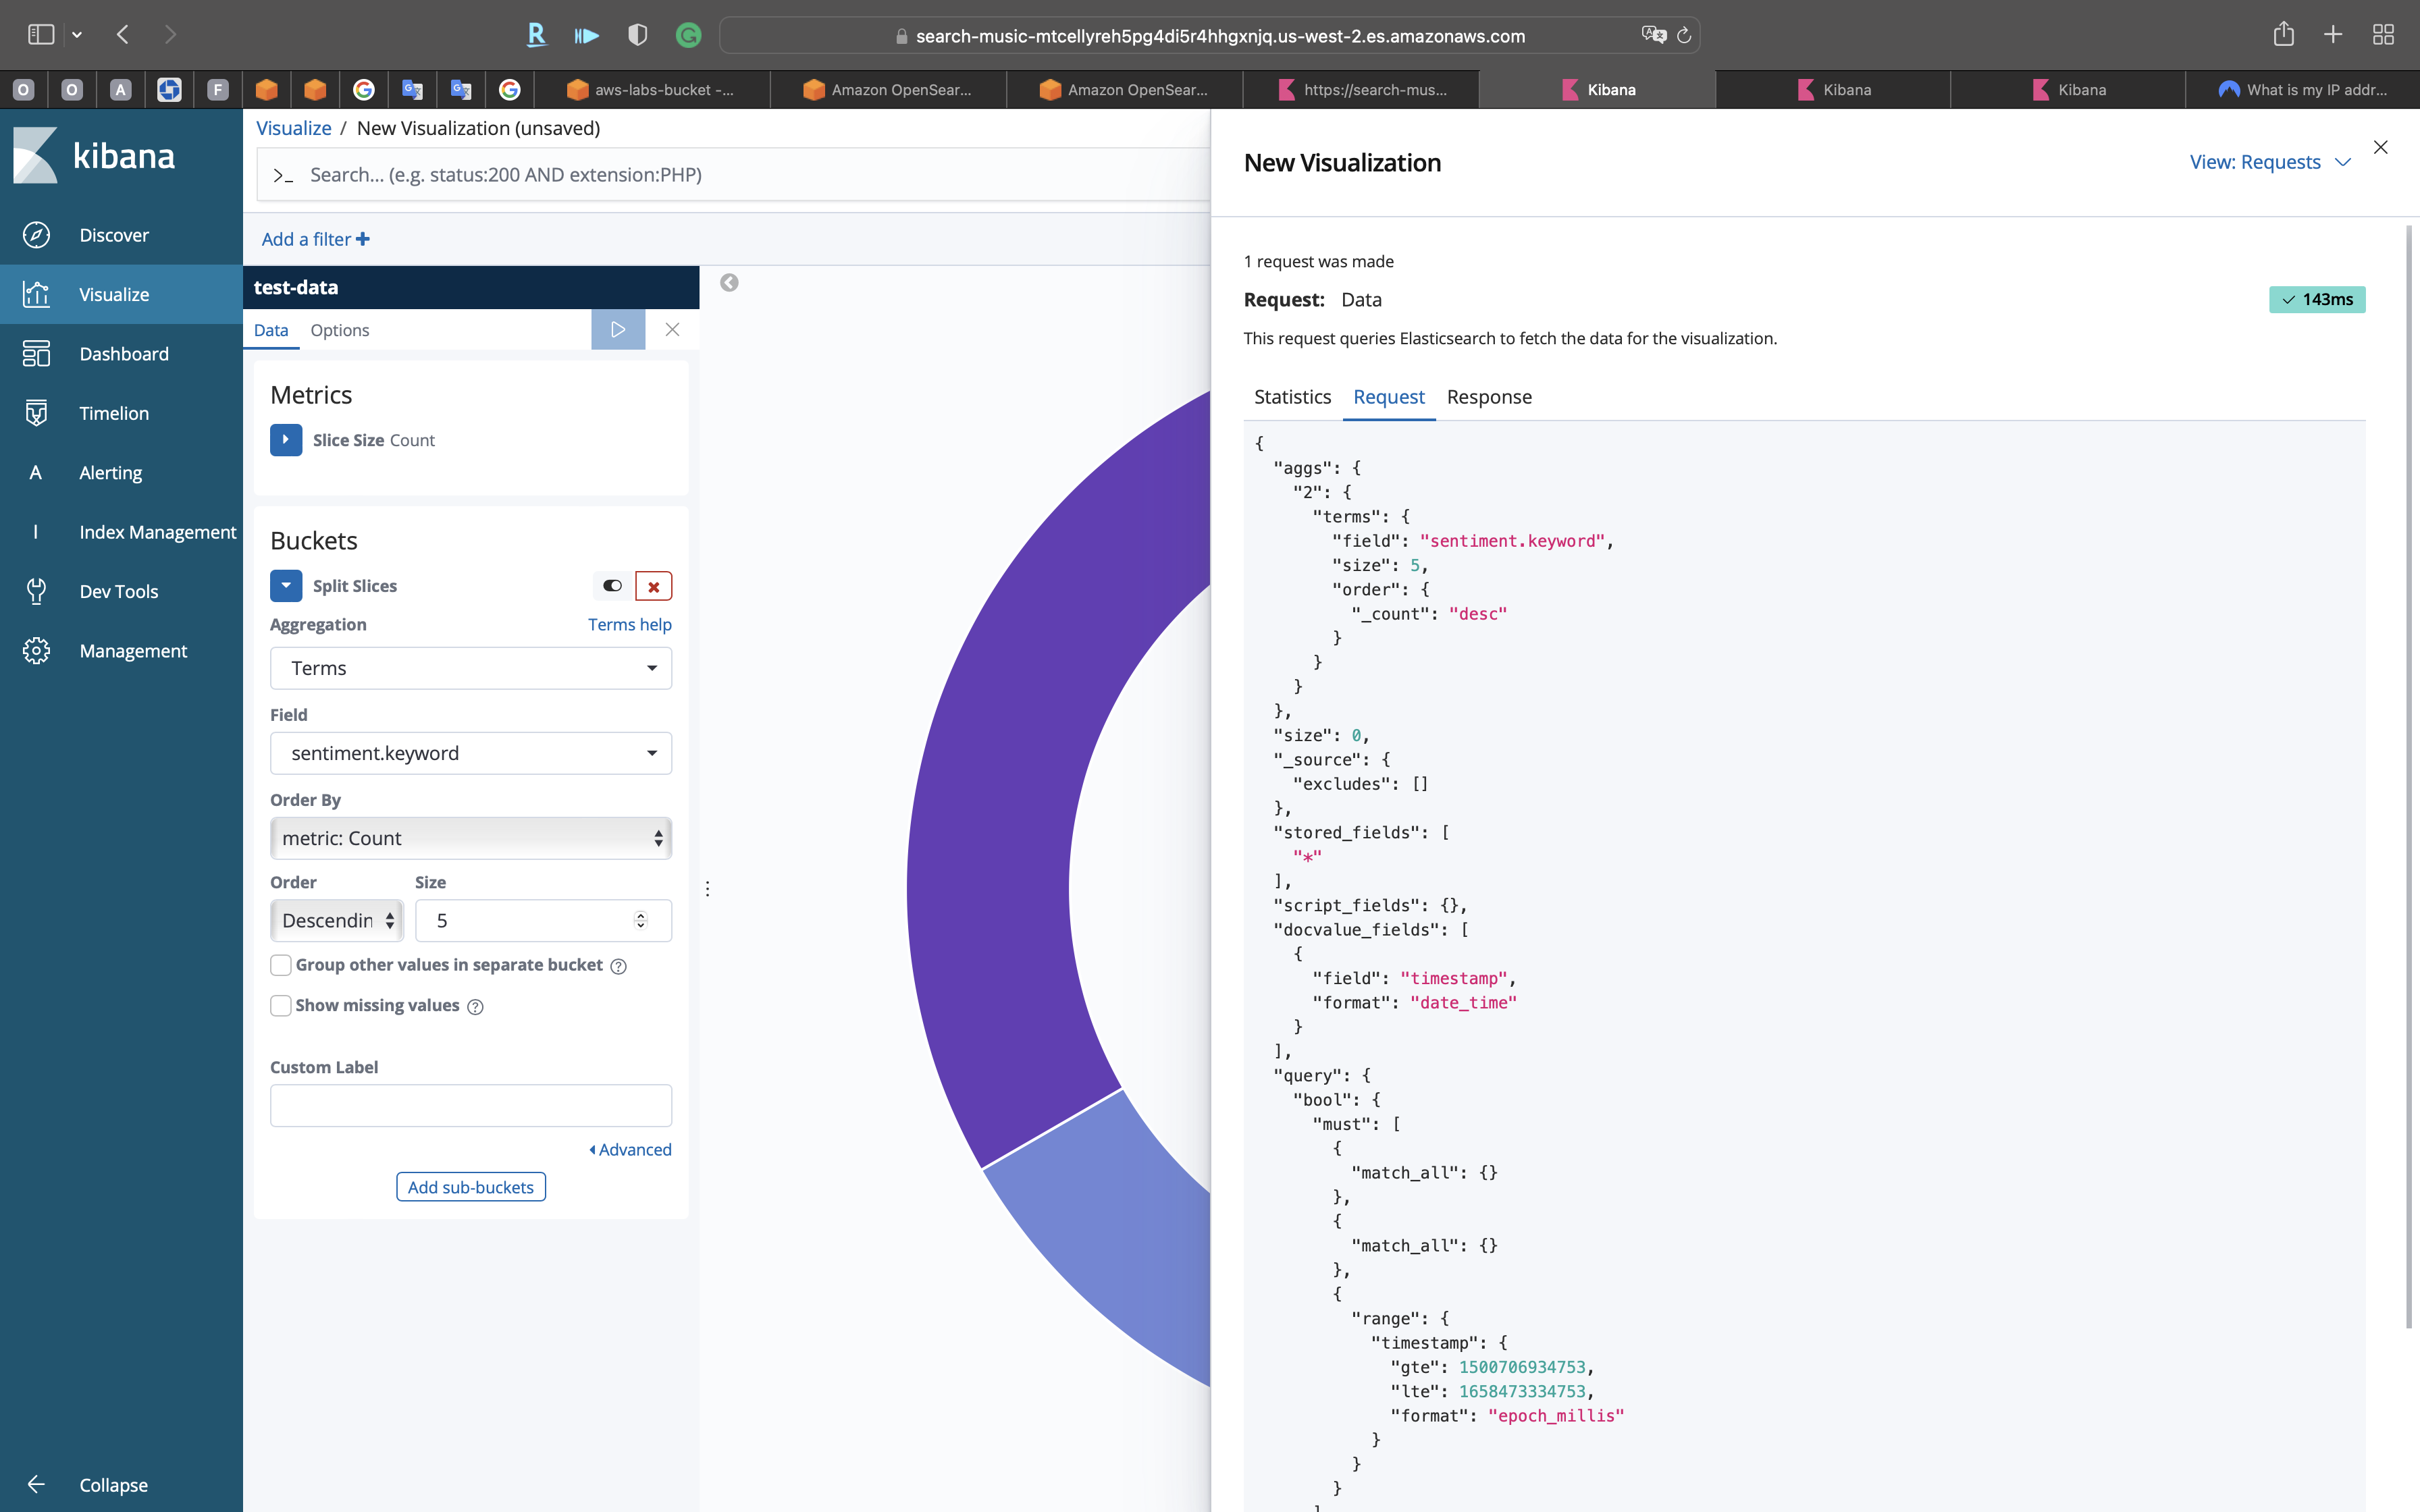
Click on Inspect on the top of the page.
Click on View: Data -> Requests
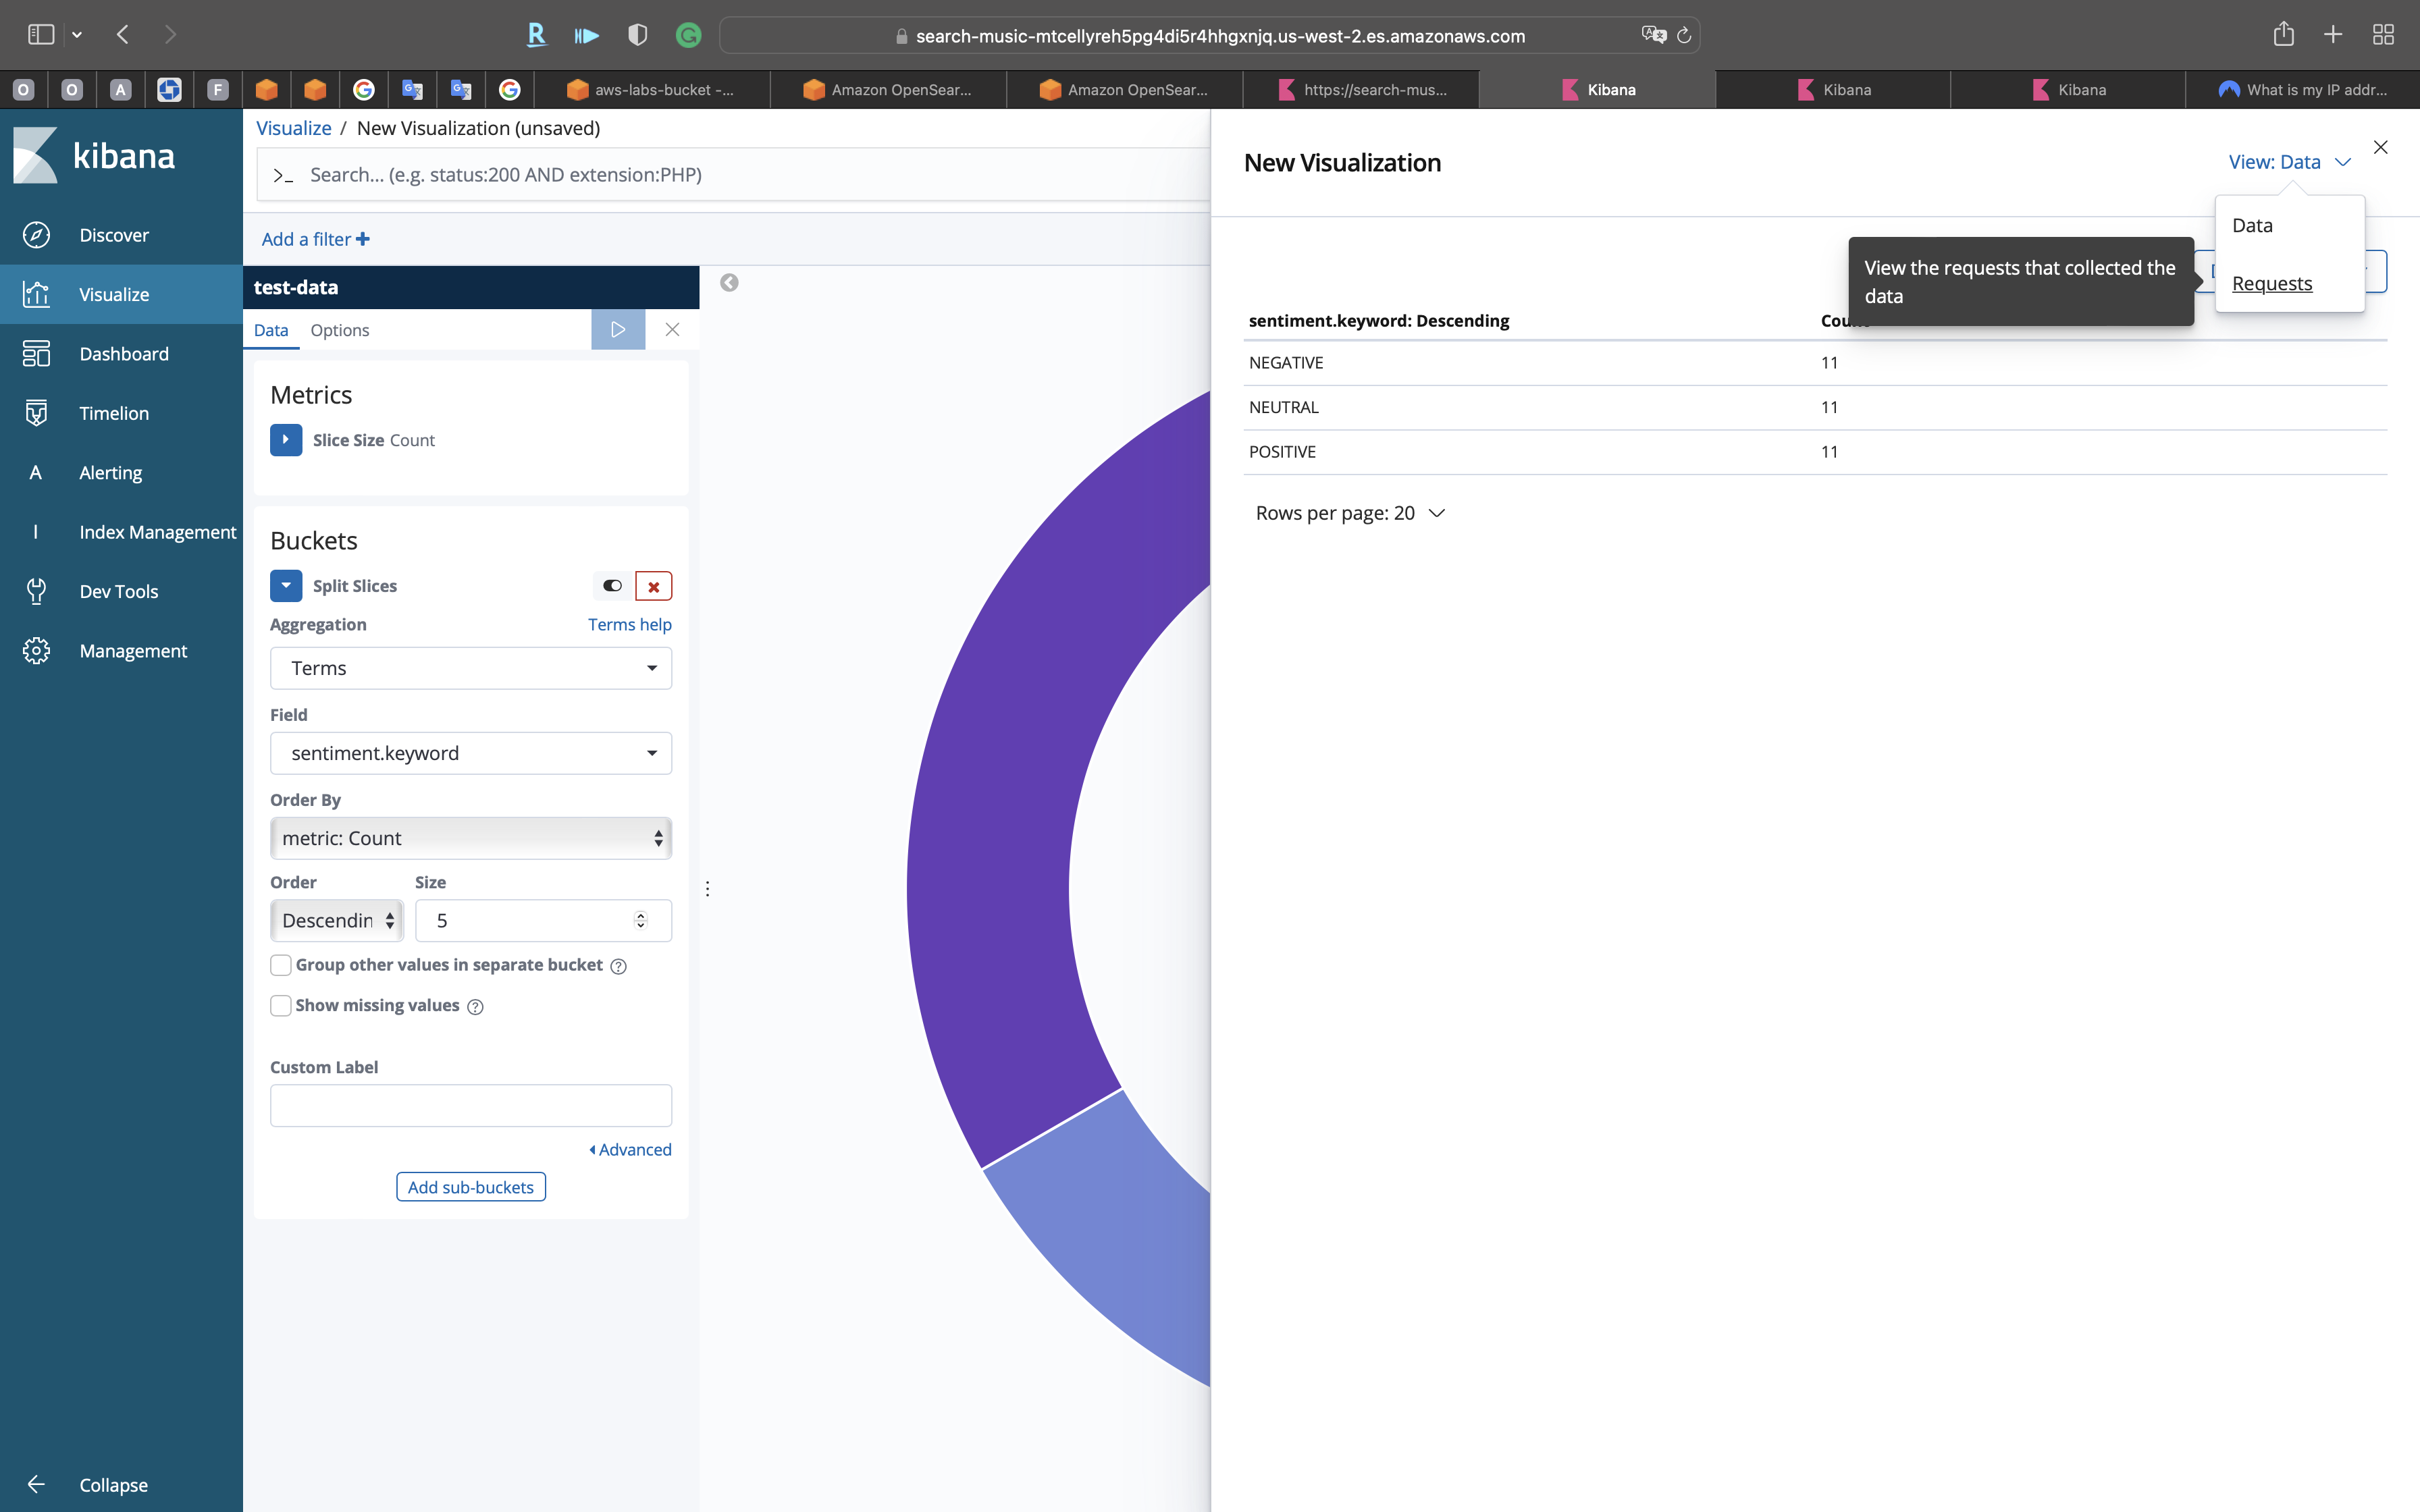
Statistics
Request
Response

Click on Save on the top of the page
Give it a name Pie Chart Visualization
Click on Confirm Save

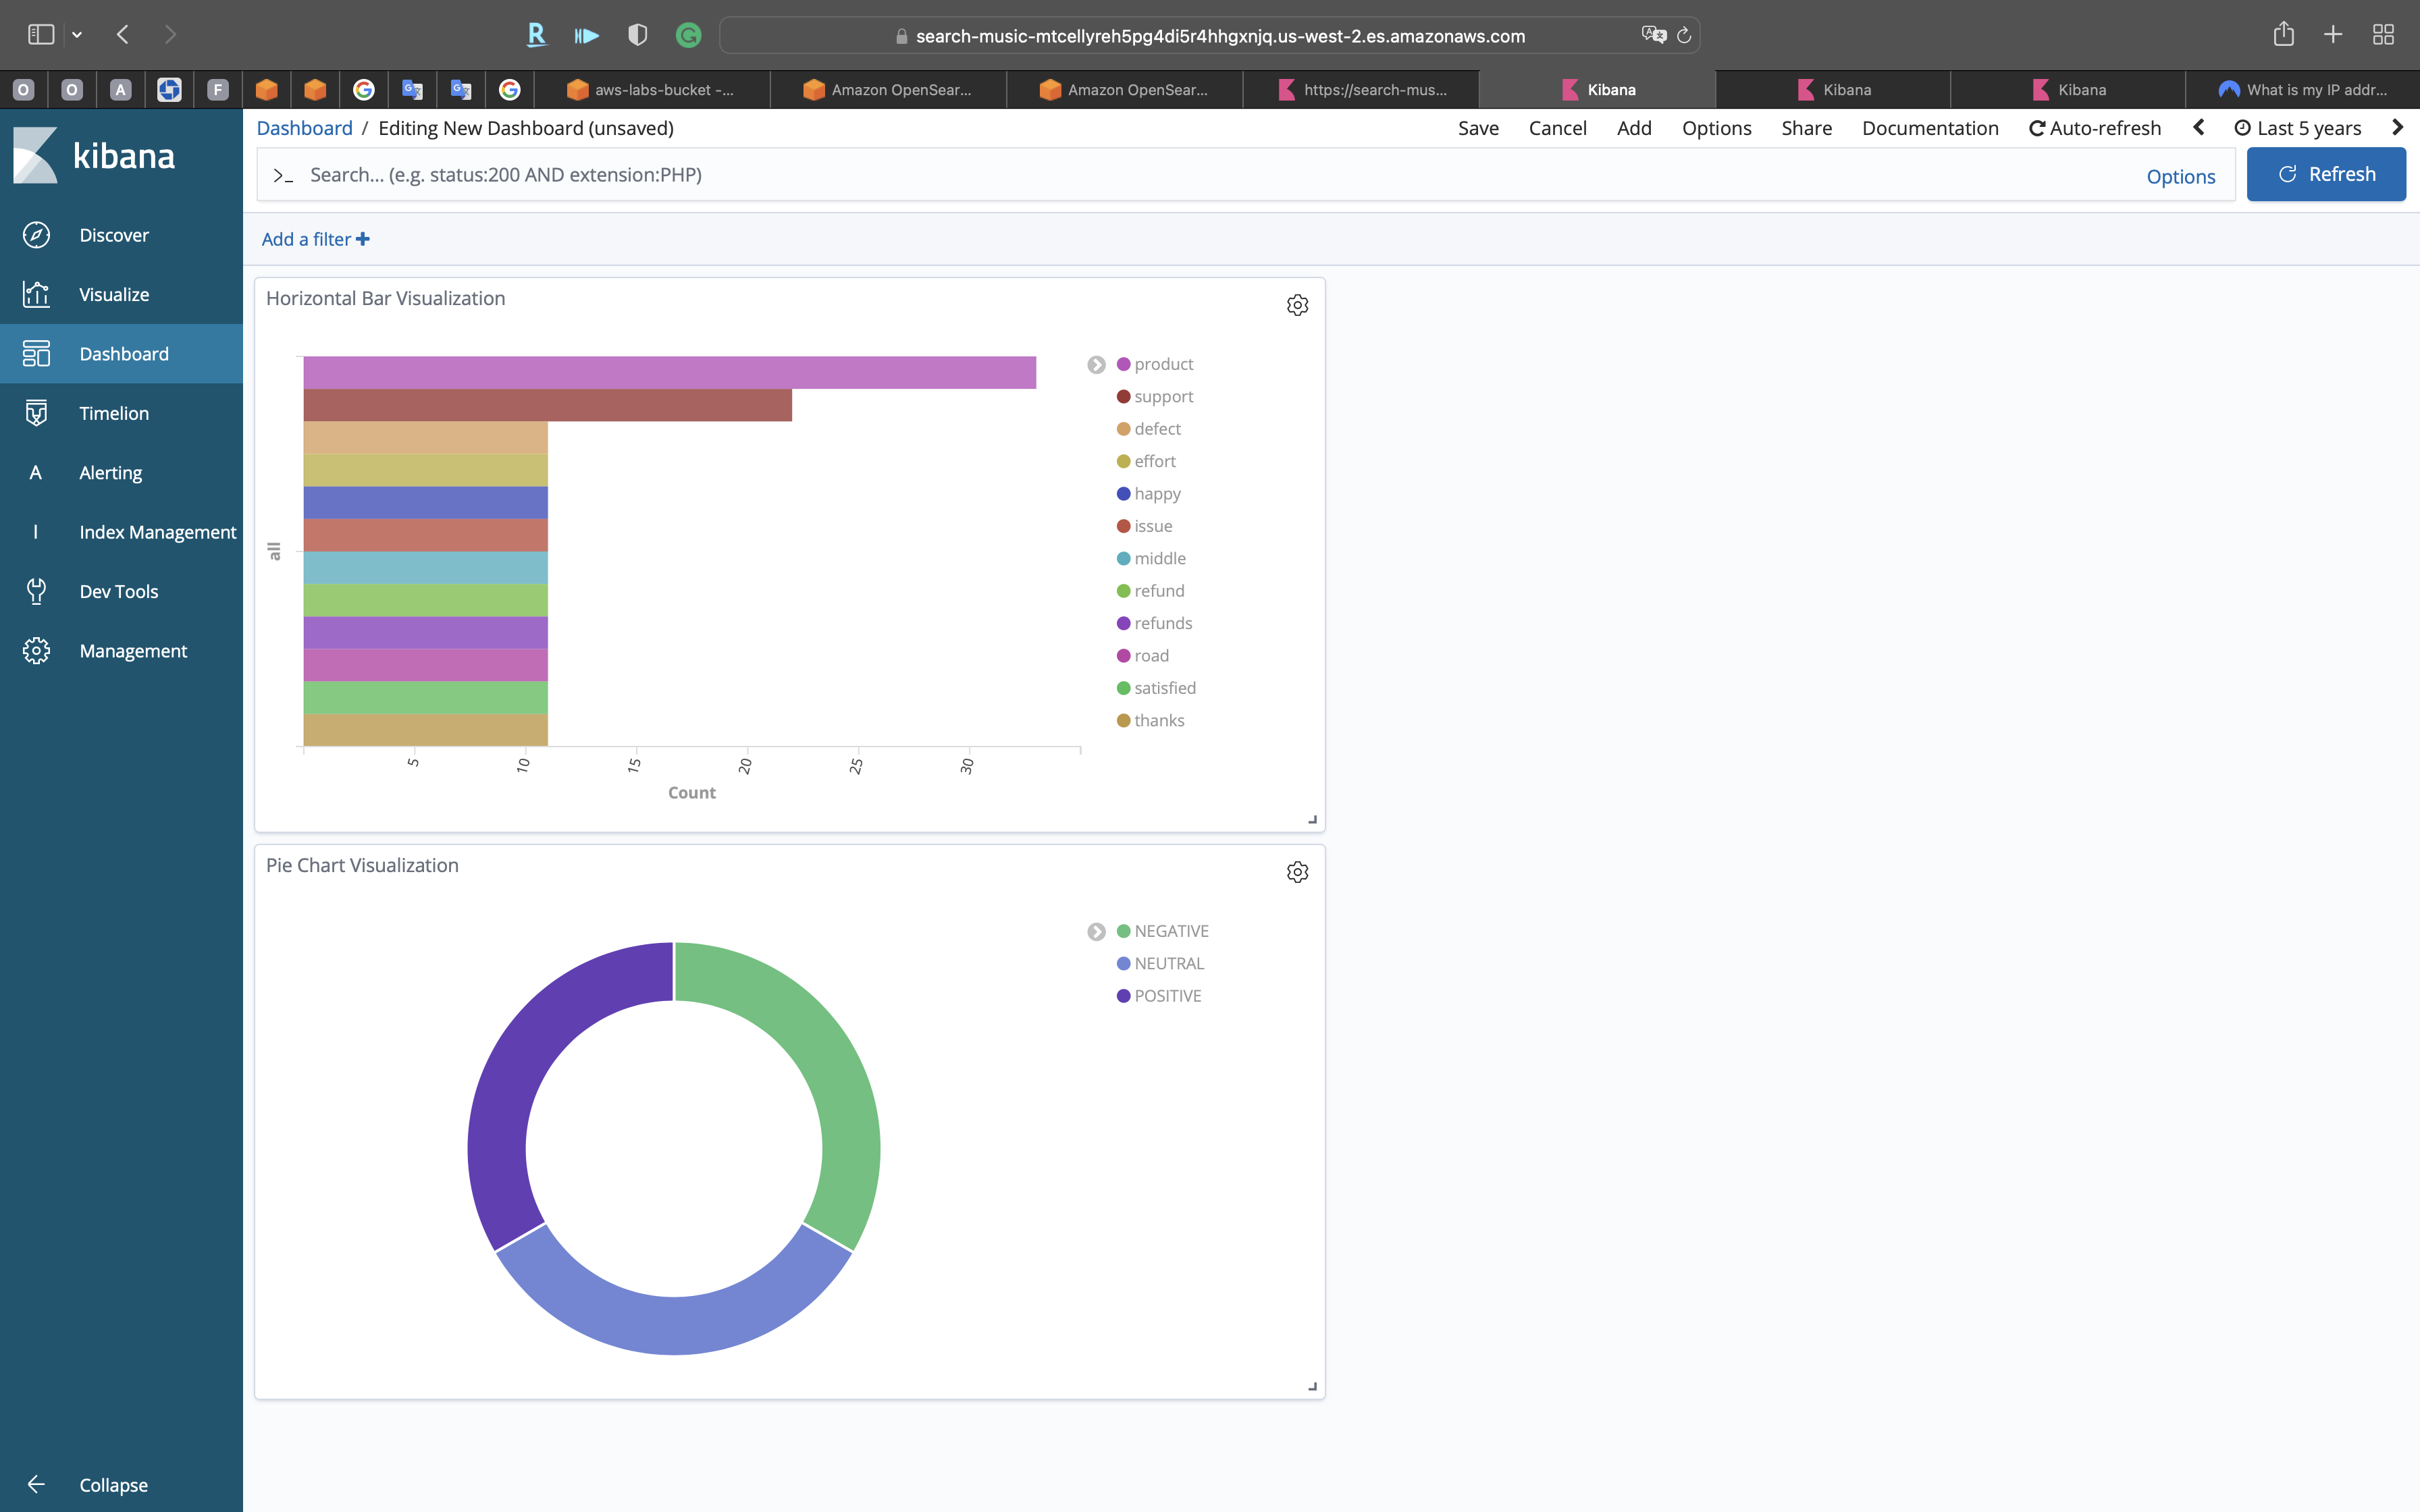
Horizontal Bar
Click on Add on the top of the page
Repeat the same steps to add new visualization —- a Horizontal Bar chart.
- Select buckets type:
Split Series - Aggregation:
Terms - Field:
keywords.keyword - Size:
20
Click on Apply changes
Click on Save on the top of the page
Give it a name Horizontal Bar Visualization
Click on Confirm Save
Dashboard Manipulating
You can drag the visualization for reordering the dashboard
Click on Save on the top of the page
- Title:
Music Dashboard
Click on Save

You can filter the data on dashboard.
Click on Add a filter.
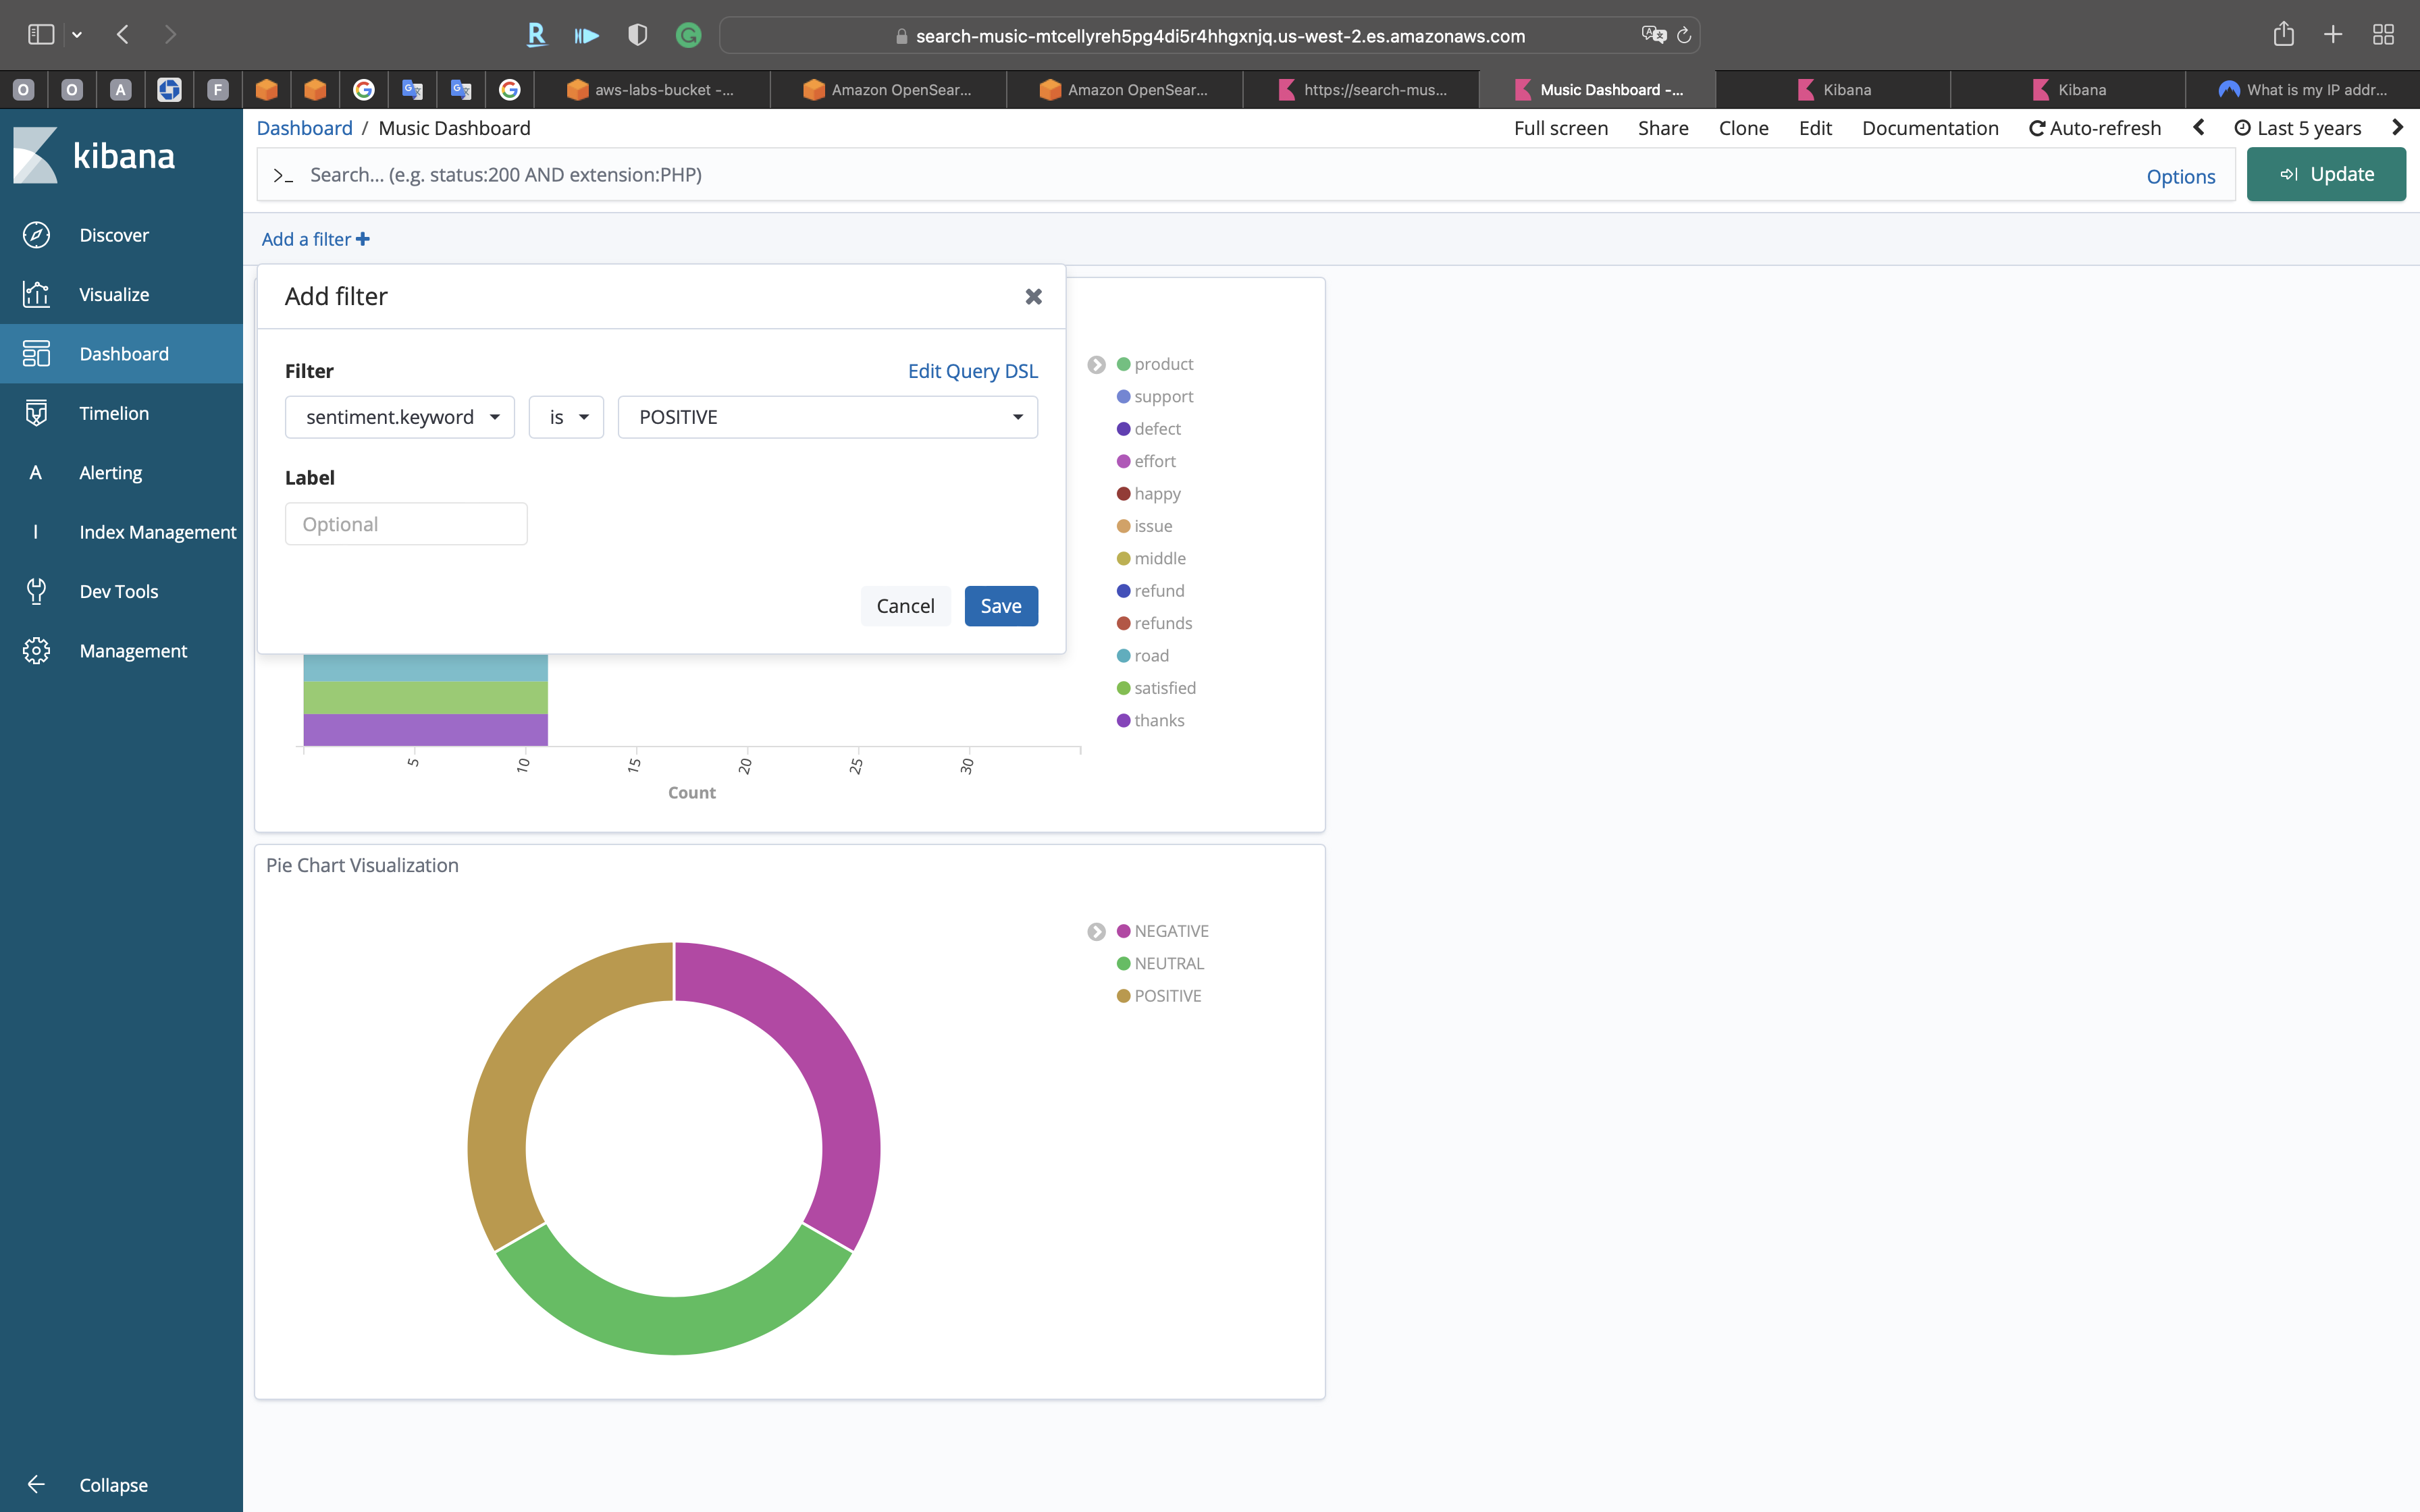
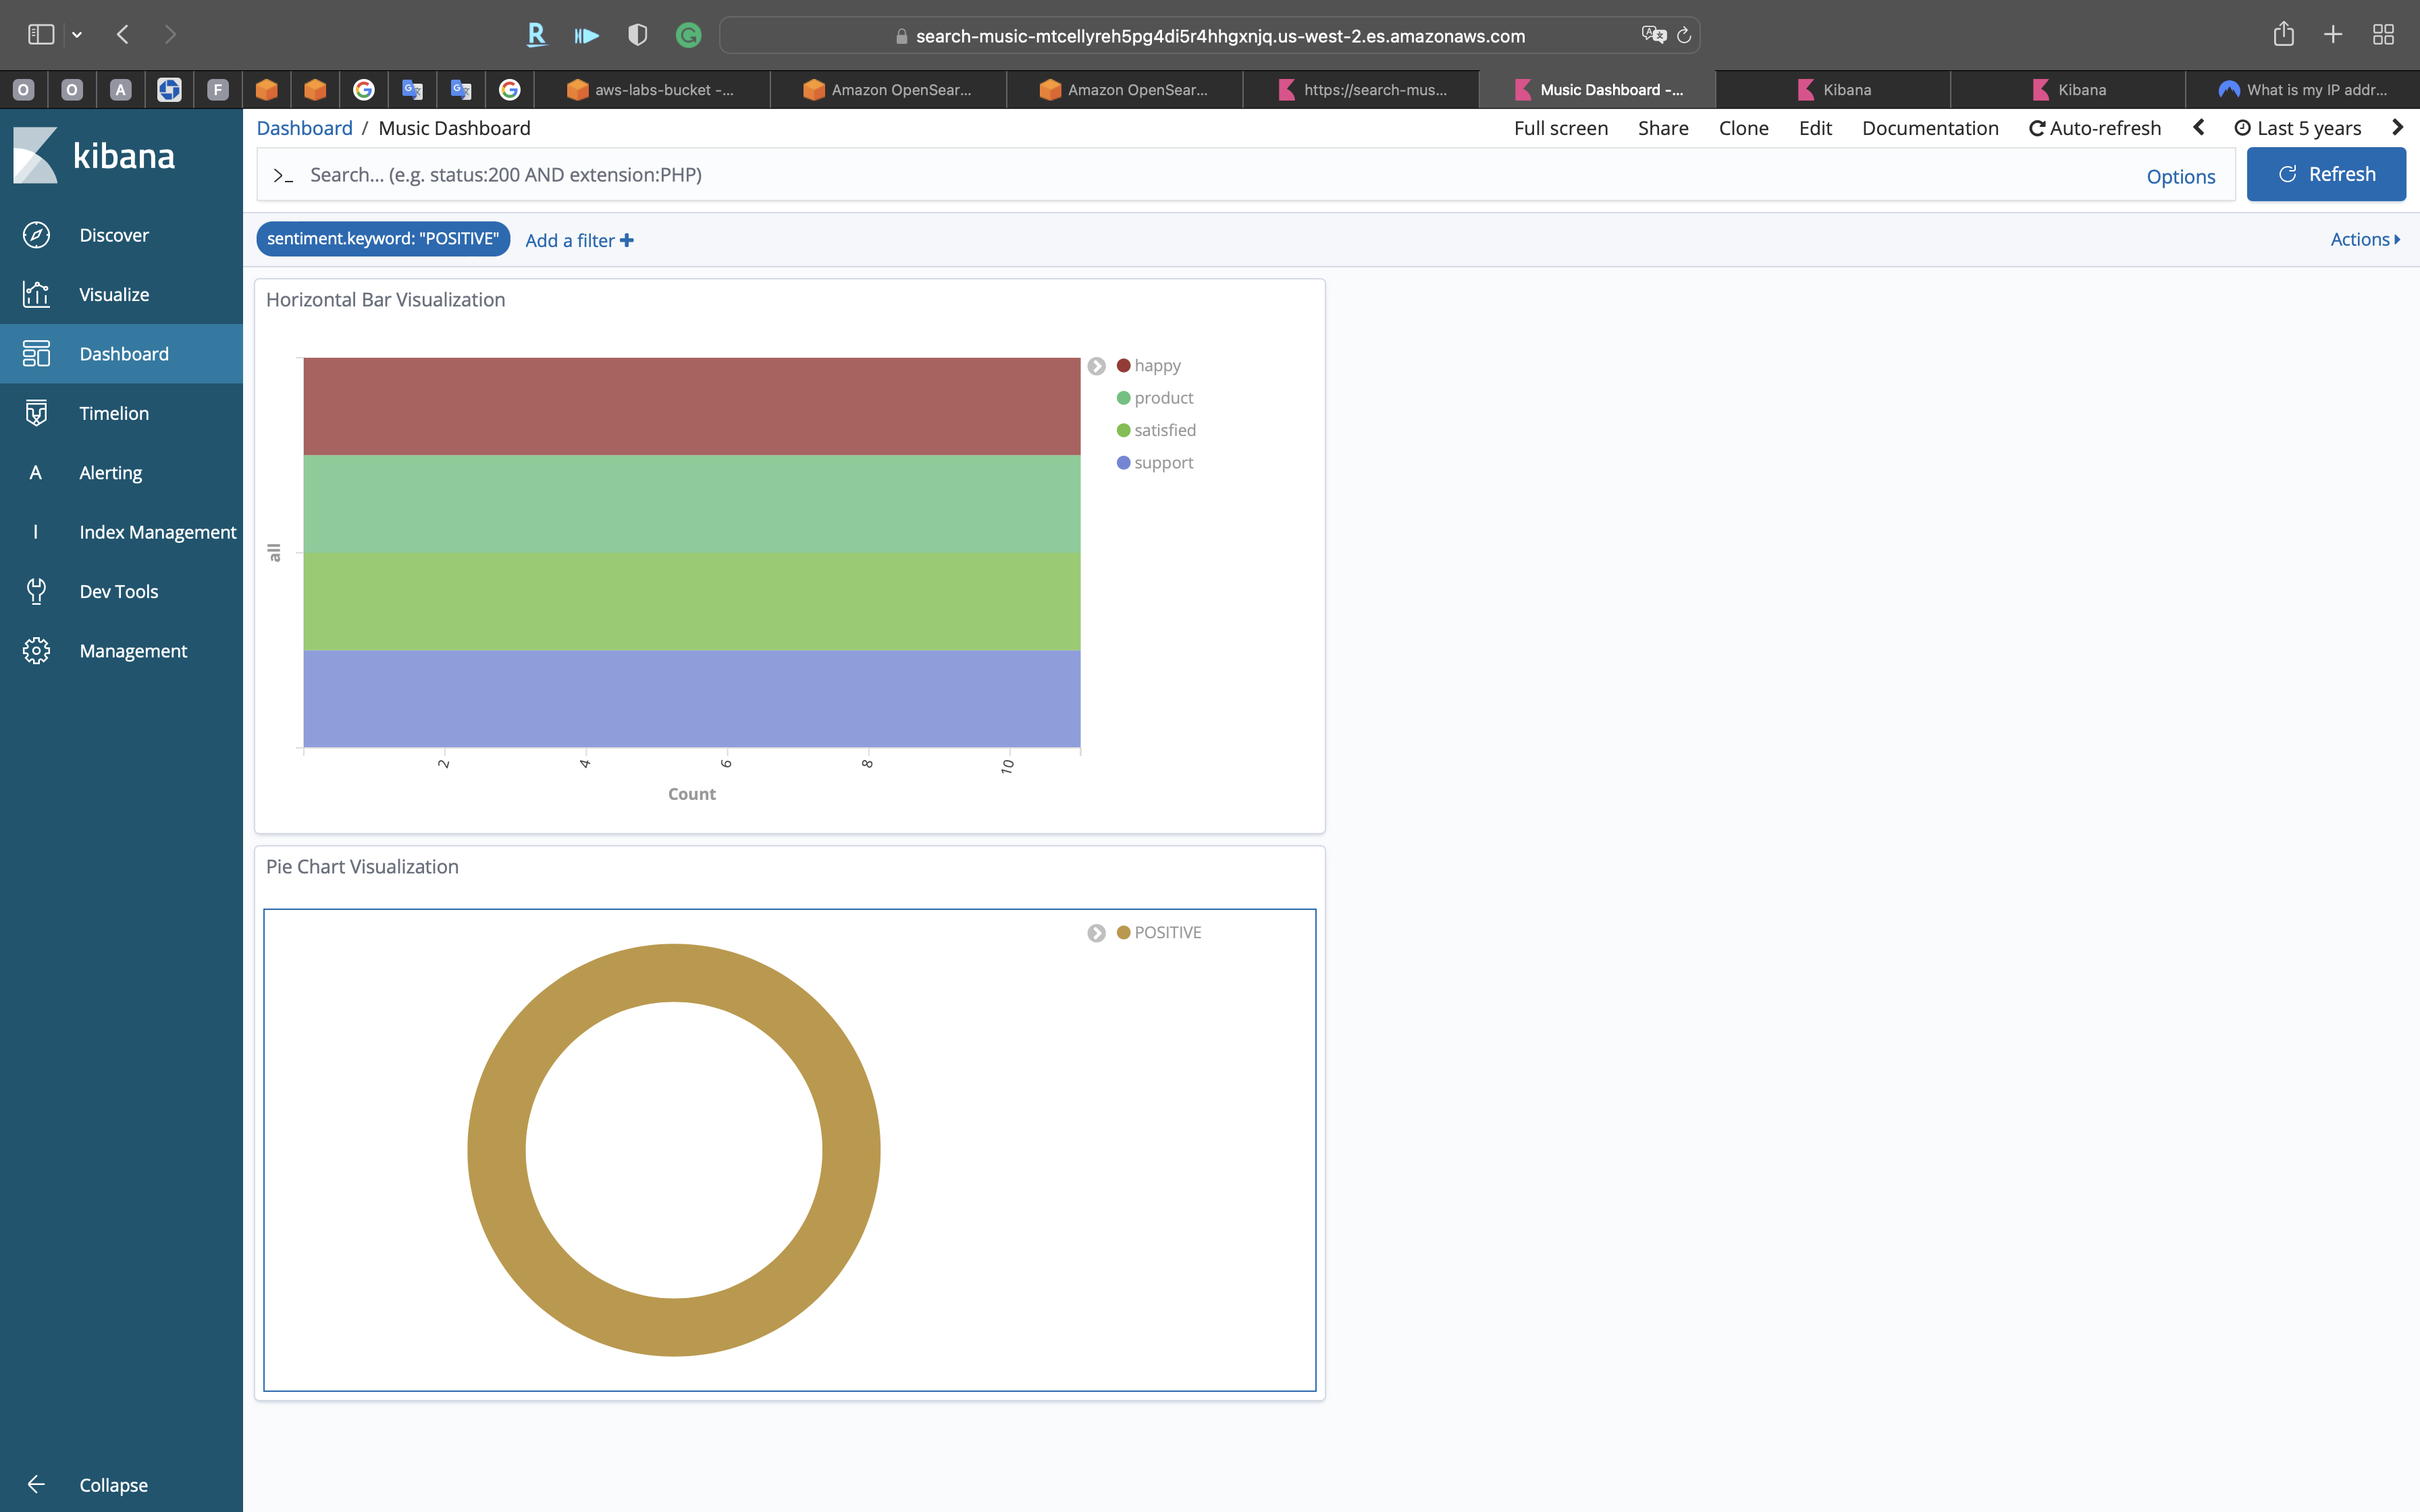
OR remove the previous filter then just select an area of a chart.
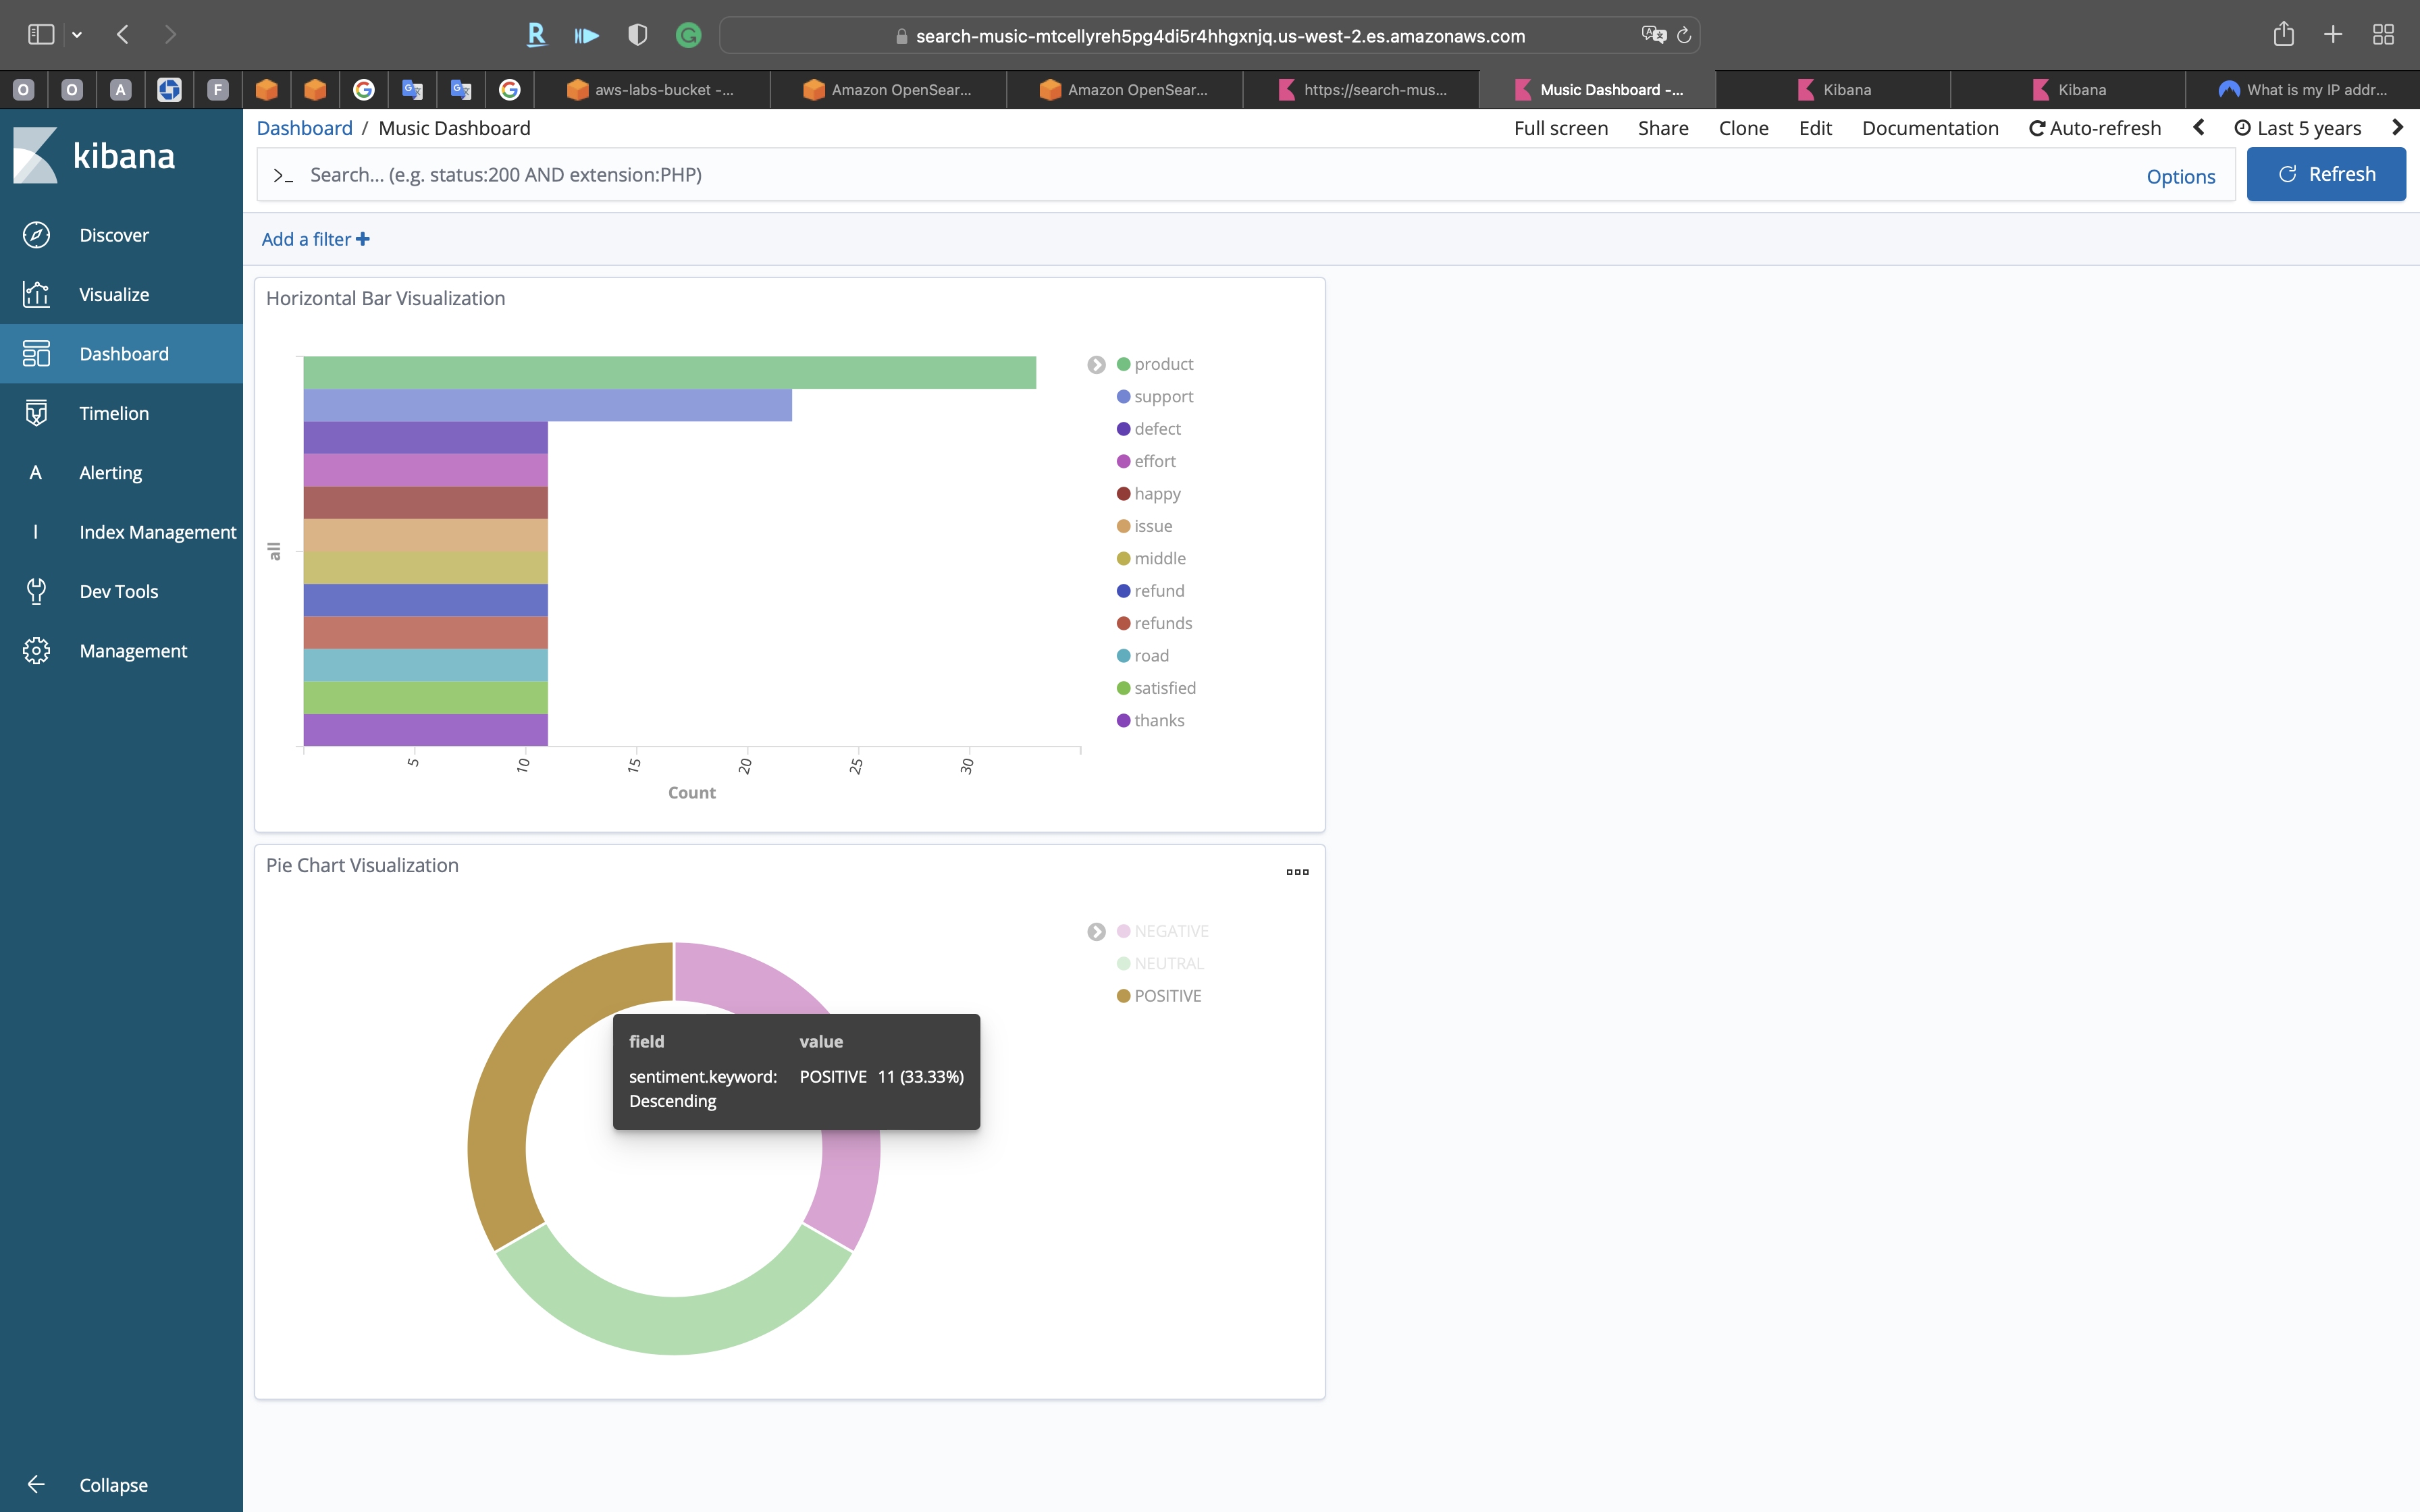
Remember the filer is just a SQL query statement.
Share Dashboard
Click on Share on the top of the page

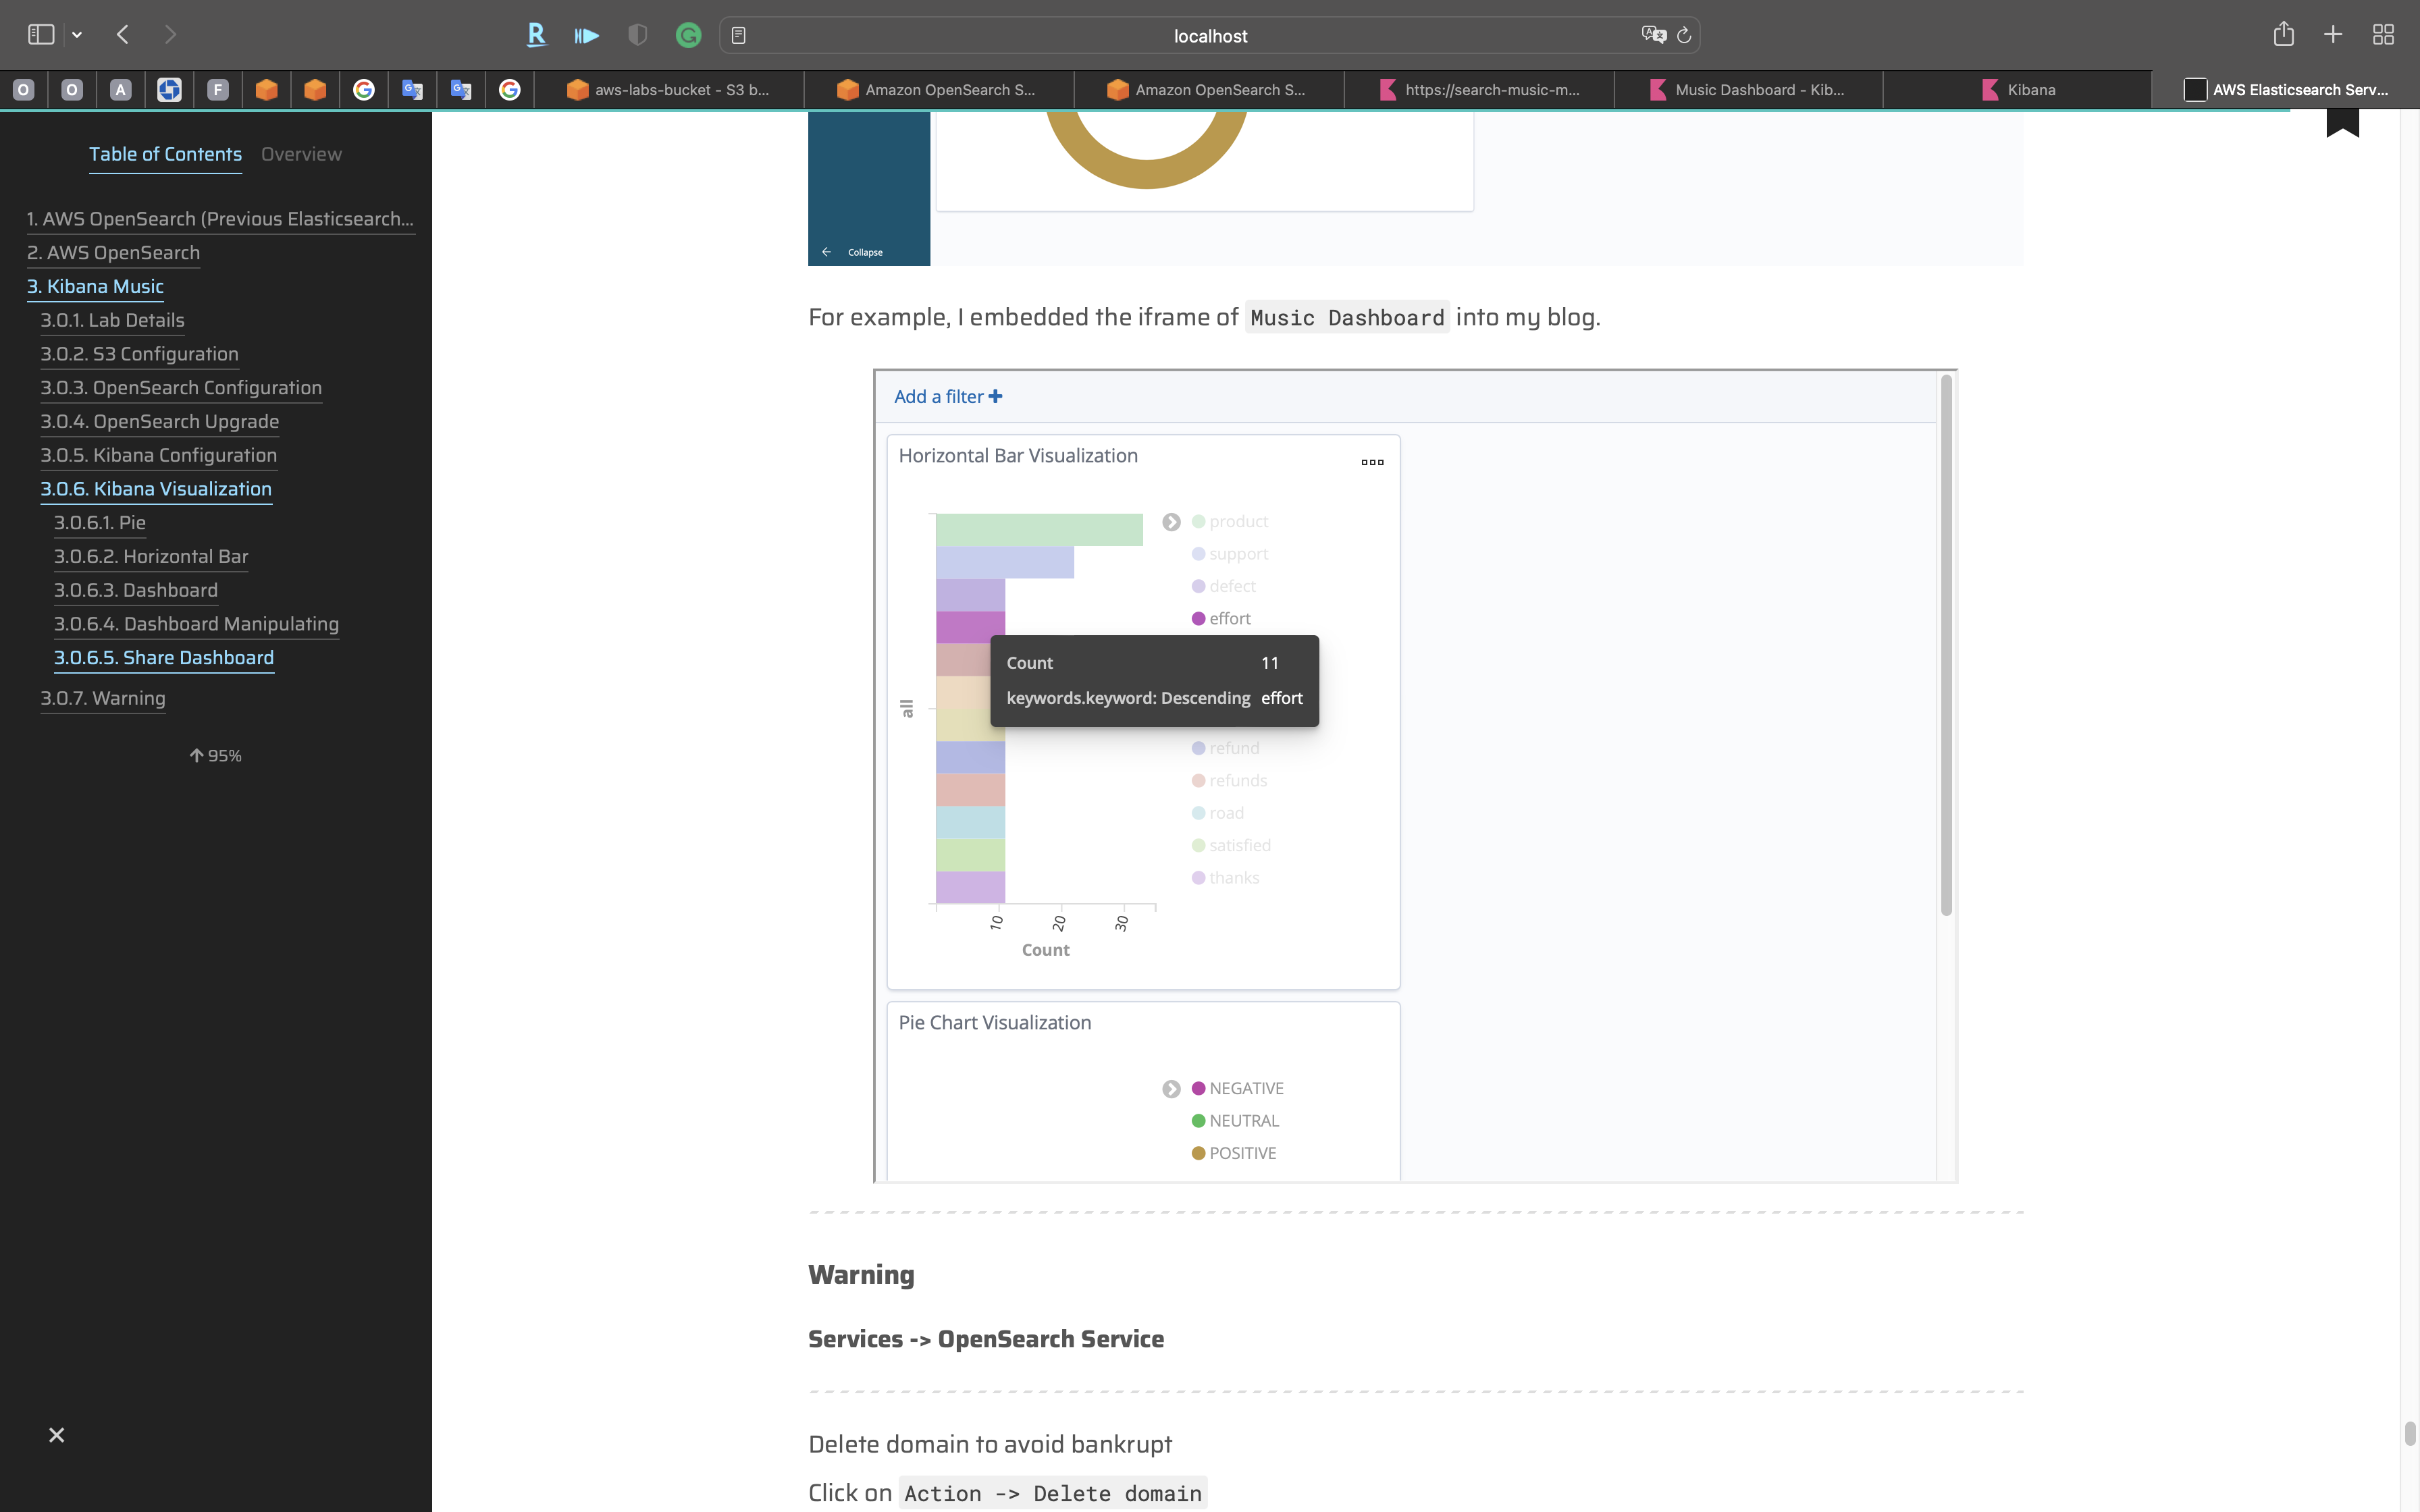
Embed the Embedded code into your website, you can view and manipulate the dashboard
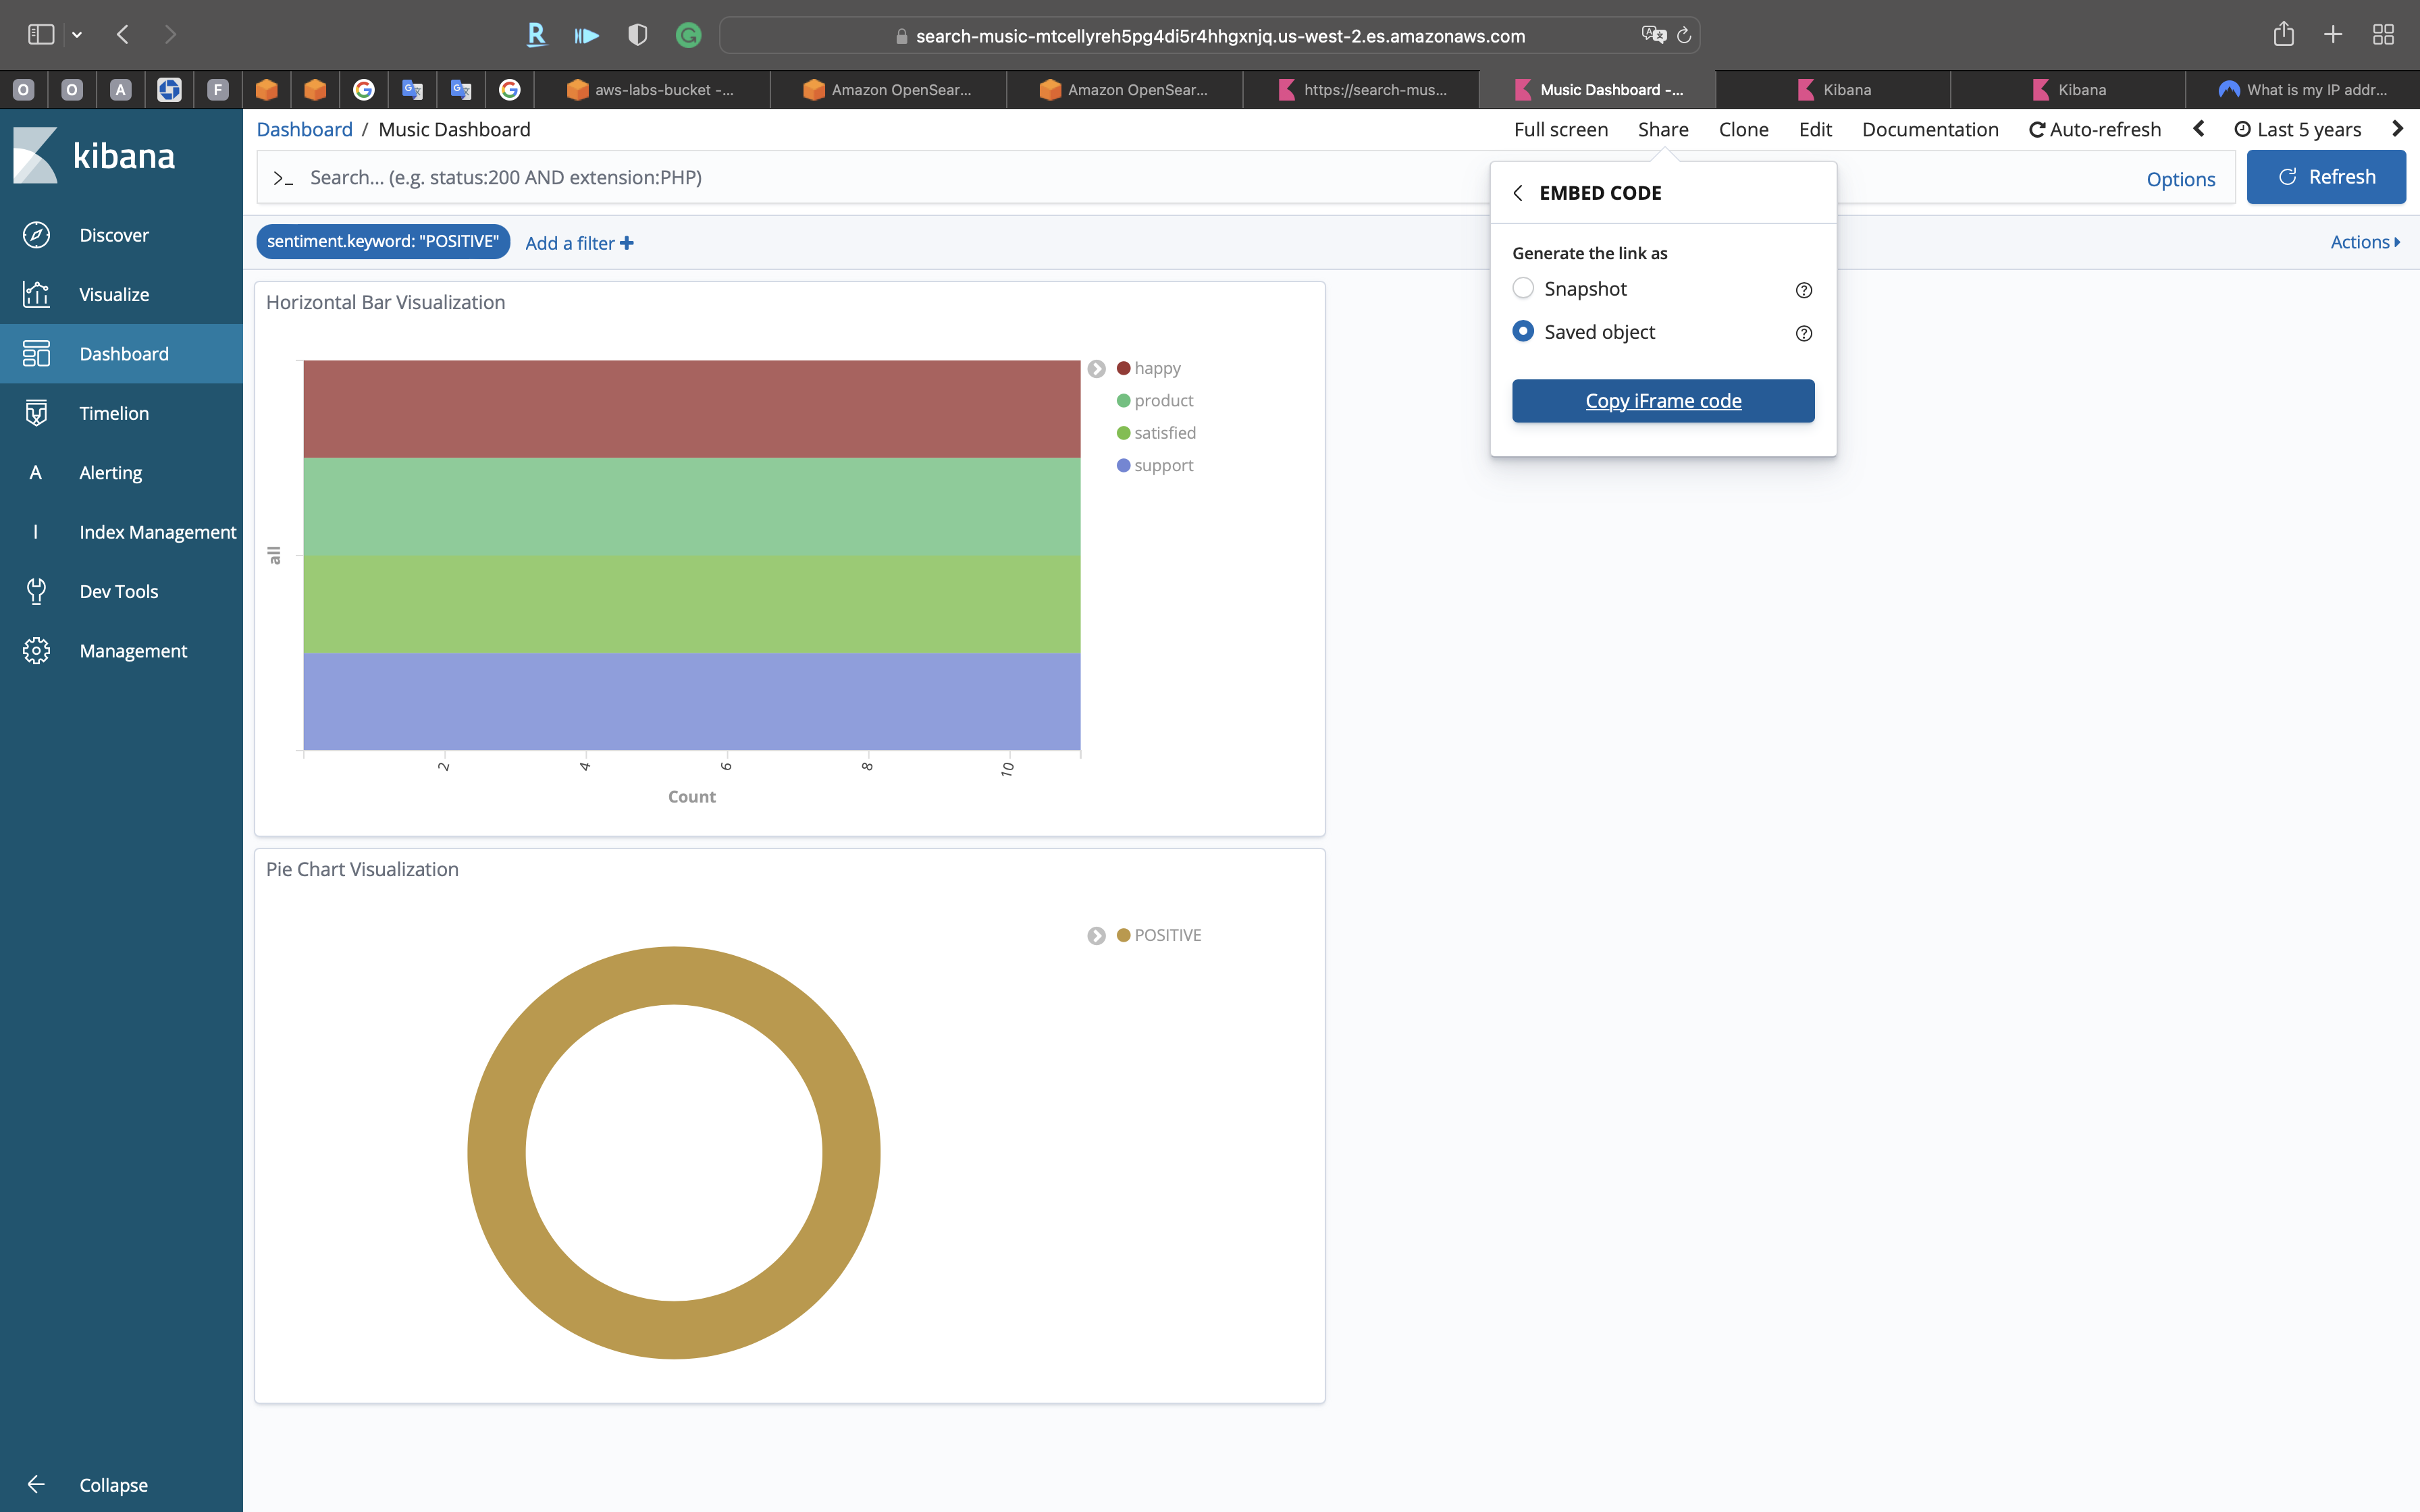
For example, I embedded the iframe of Music Dashboard into my blog.
You can also share your Kibana dashboard through Permalinks.
Warning
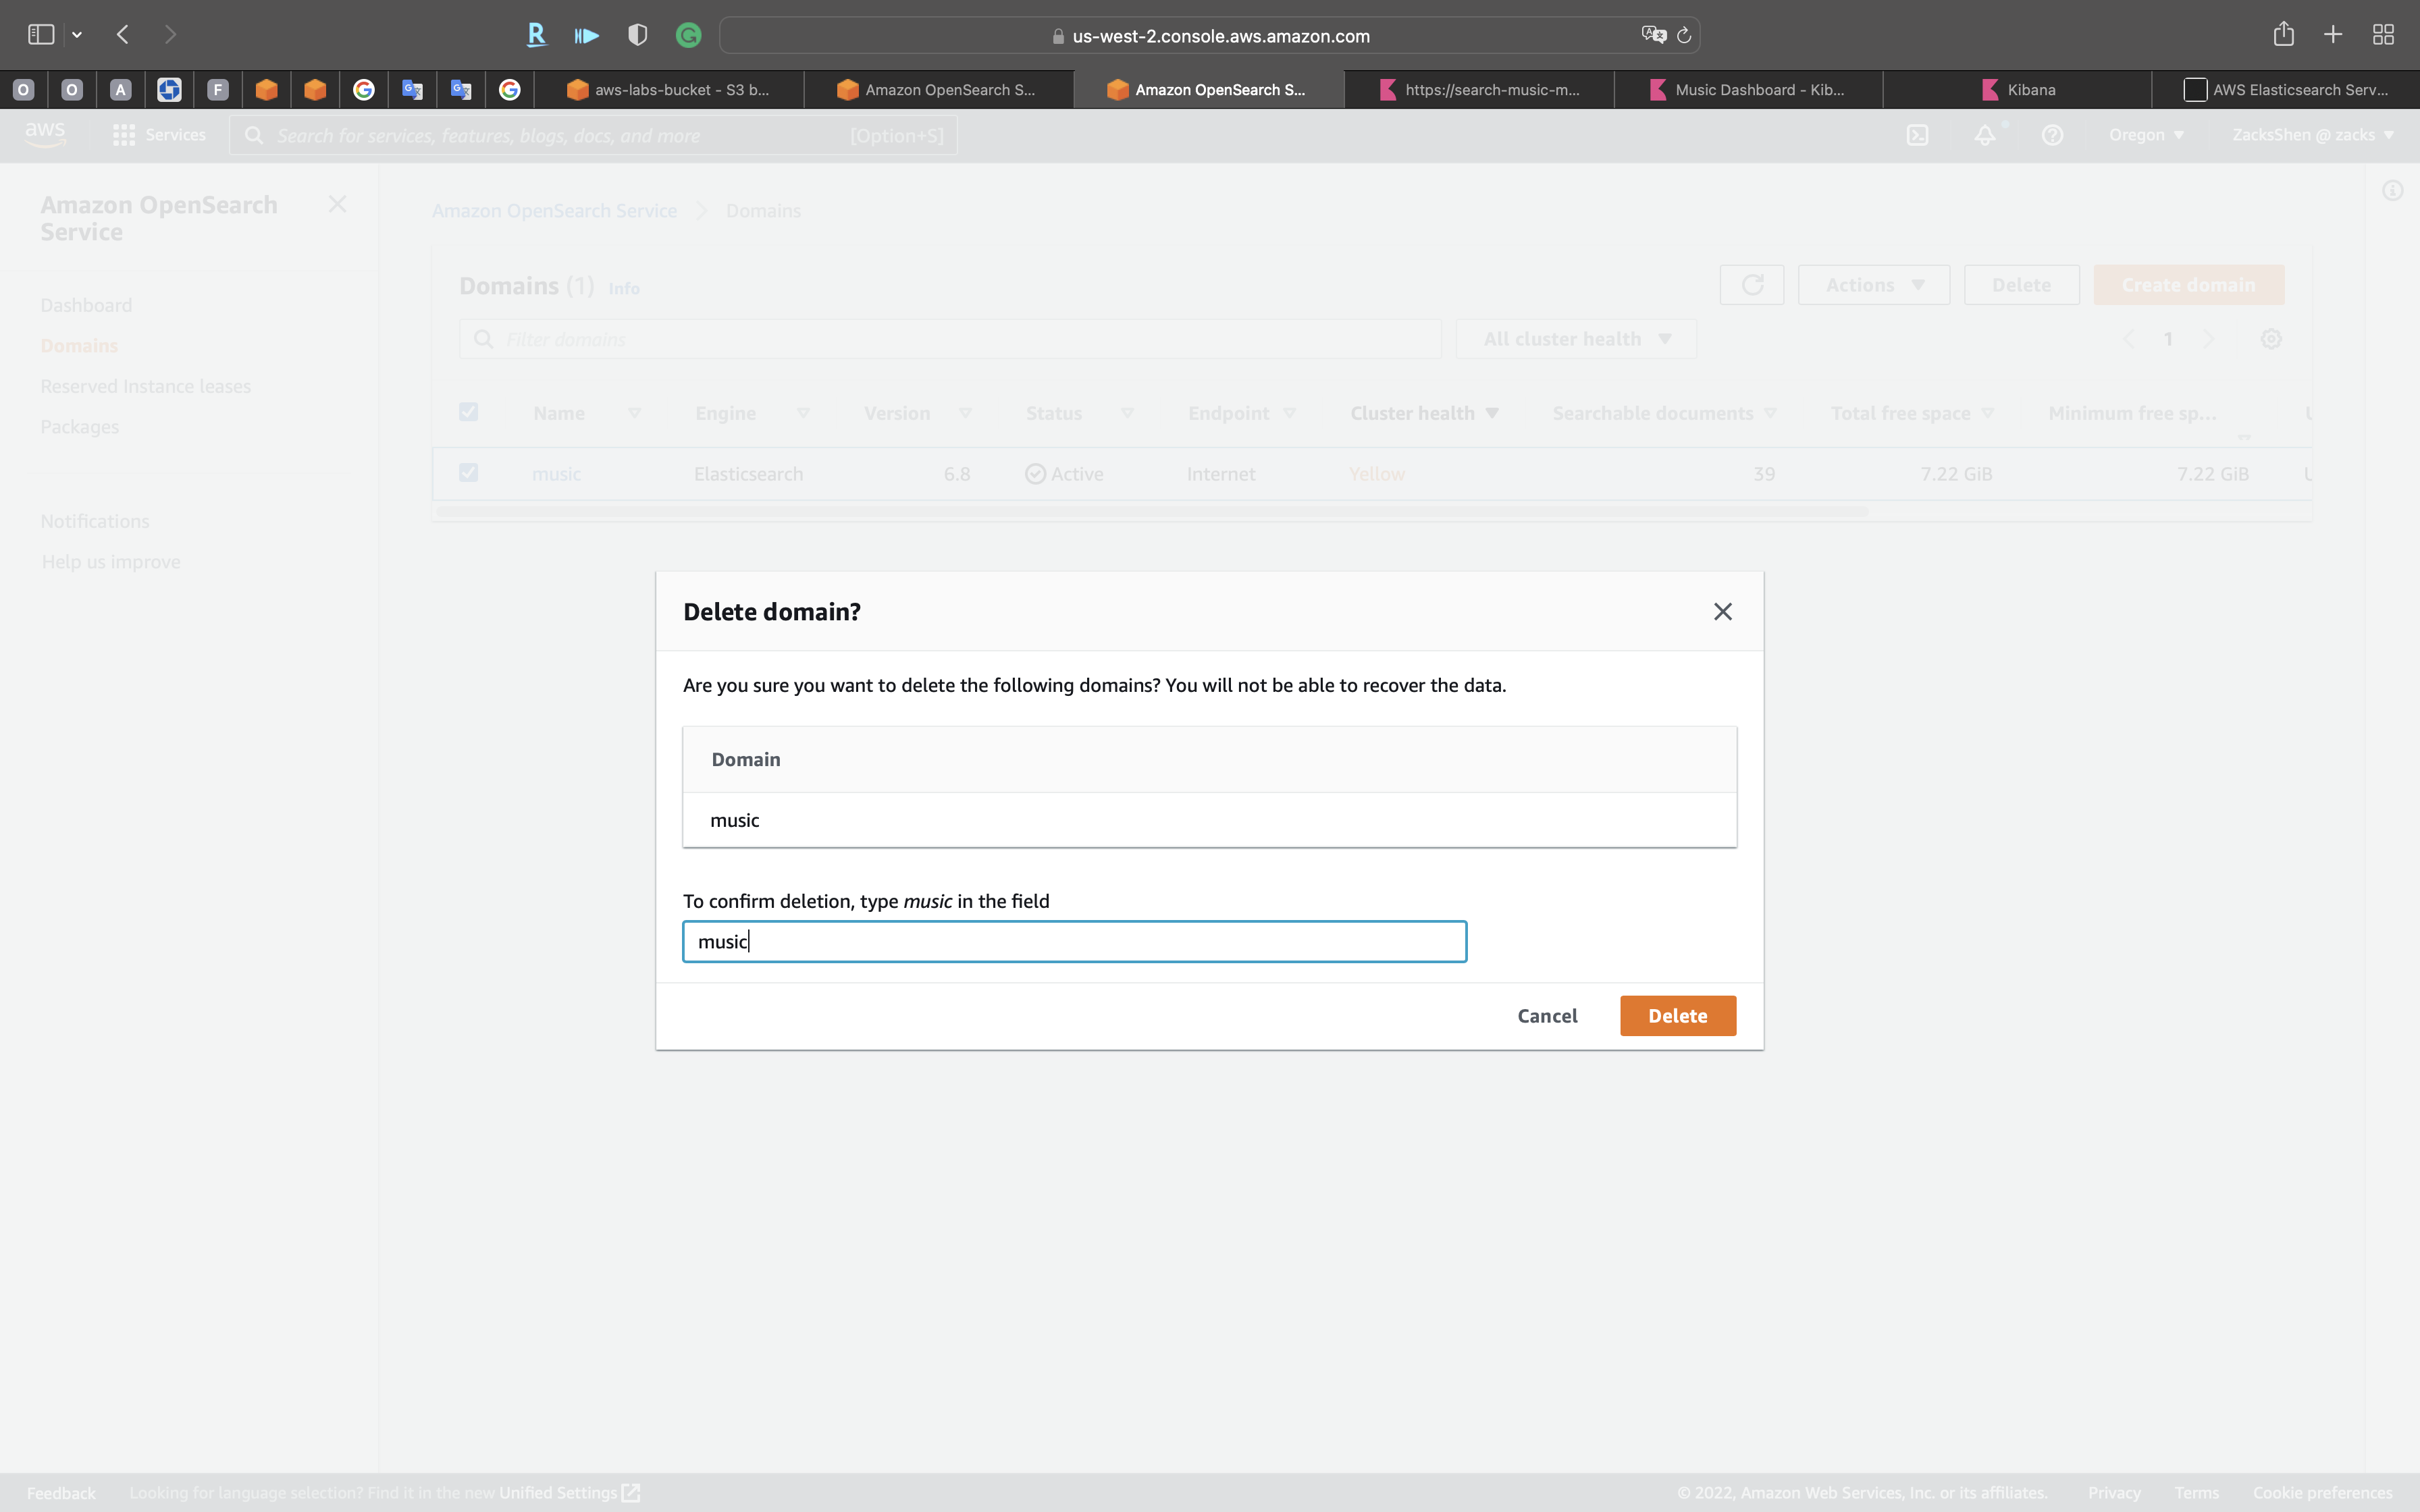
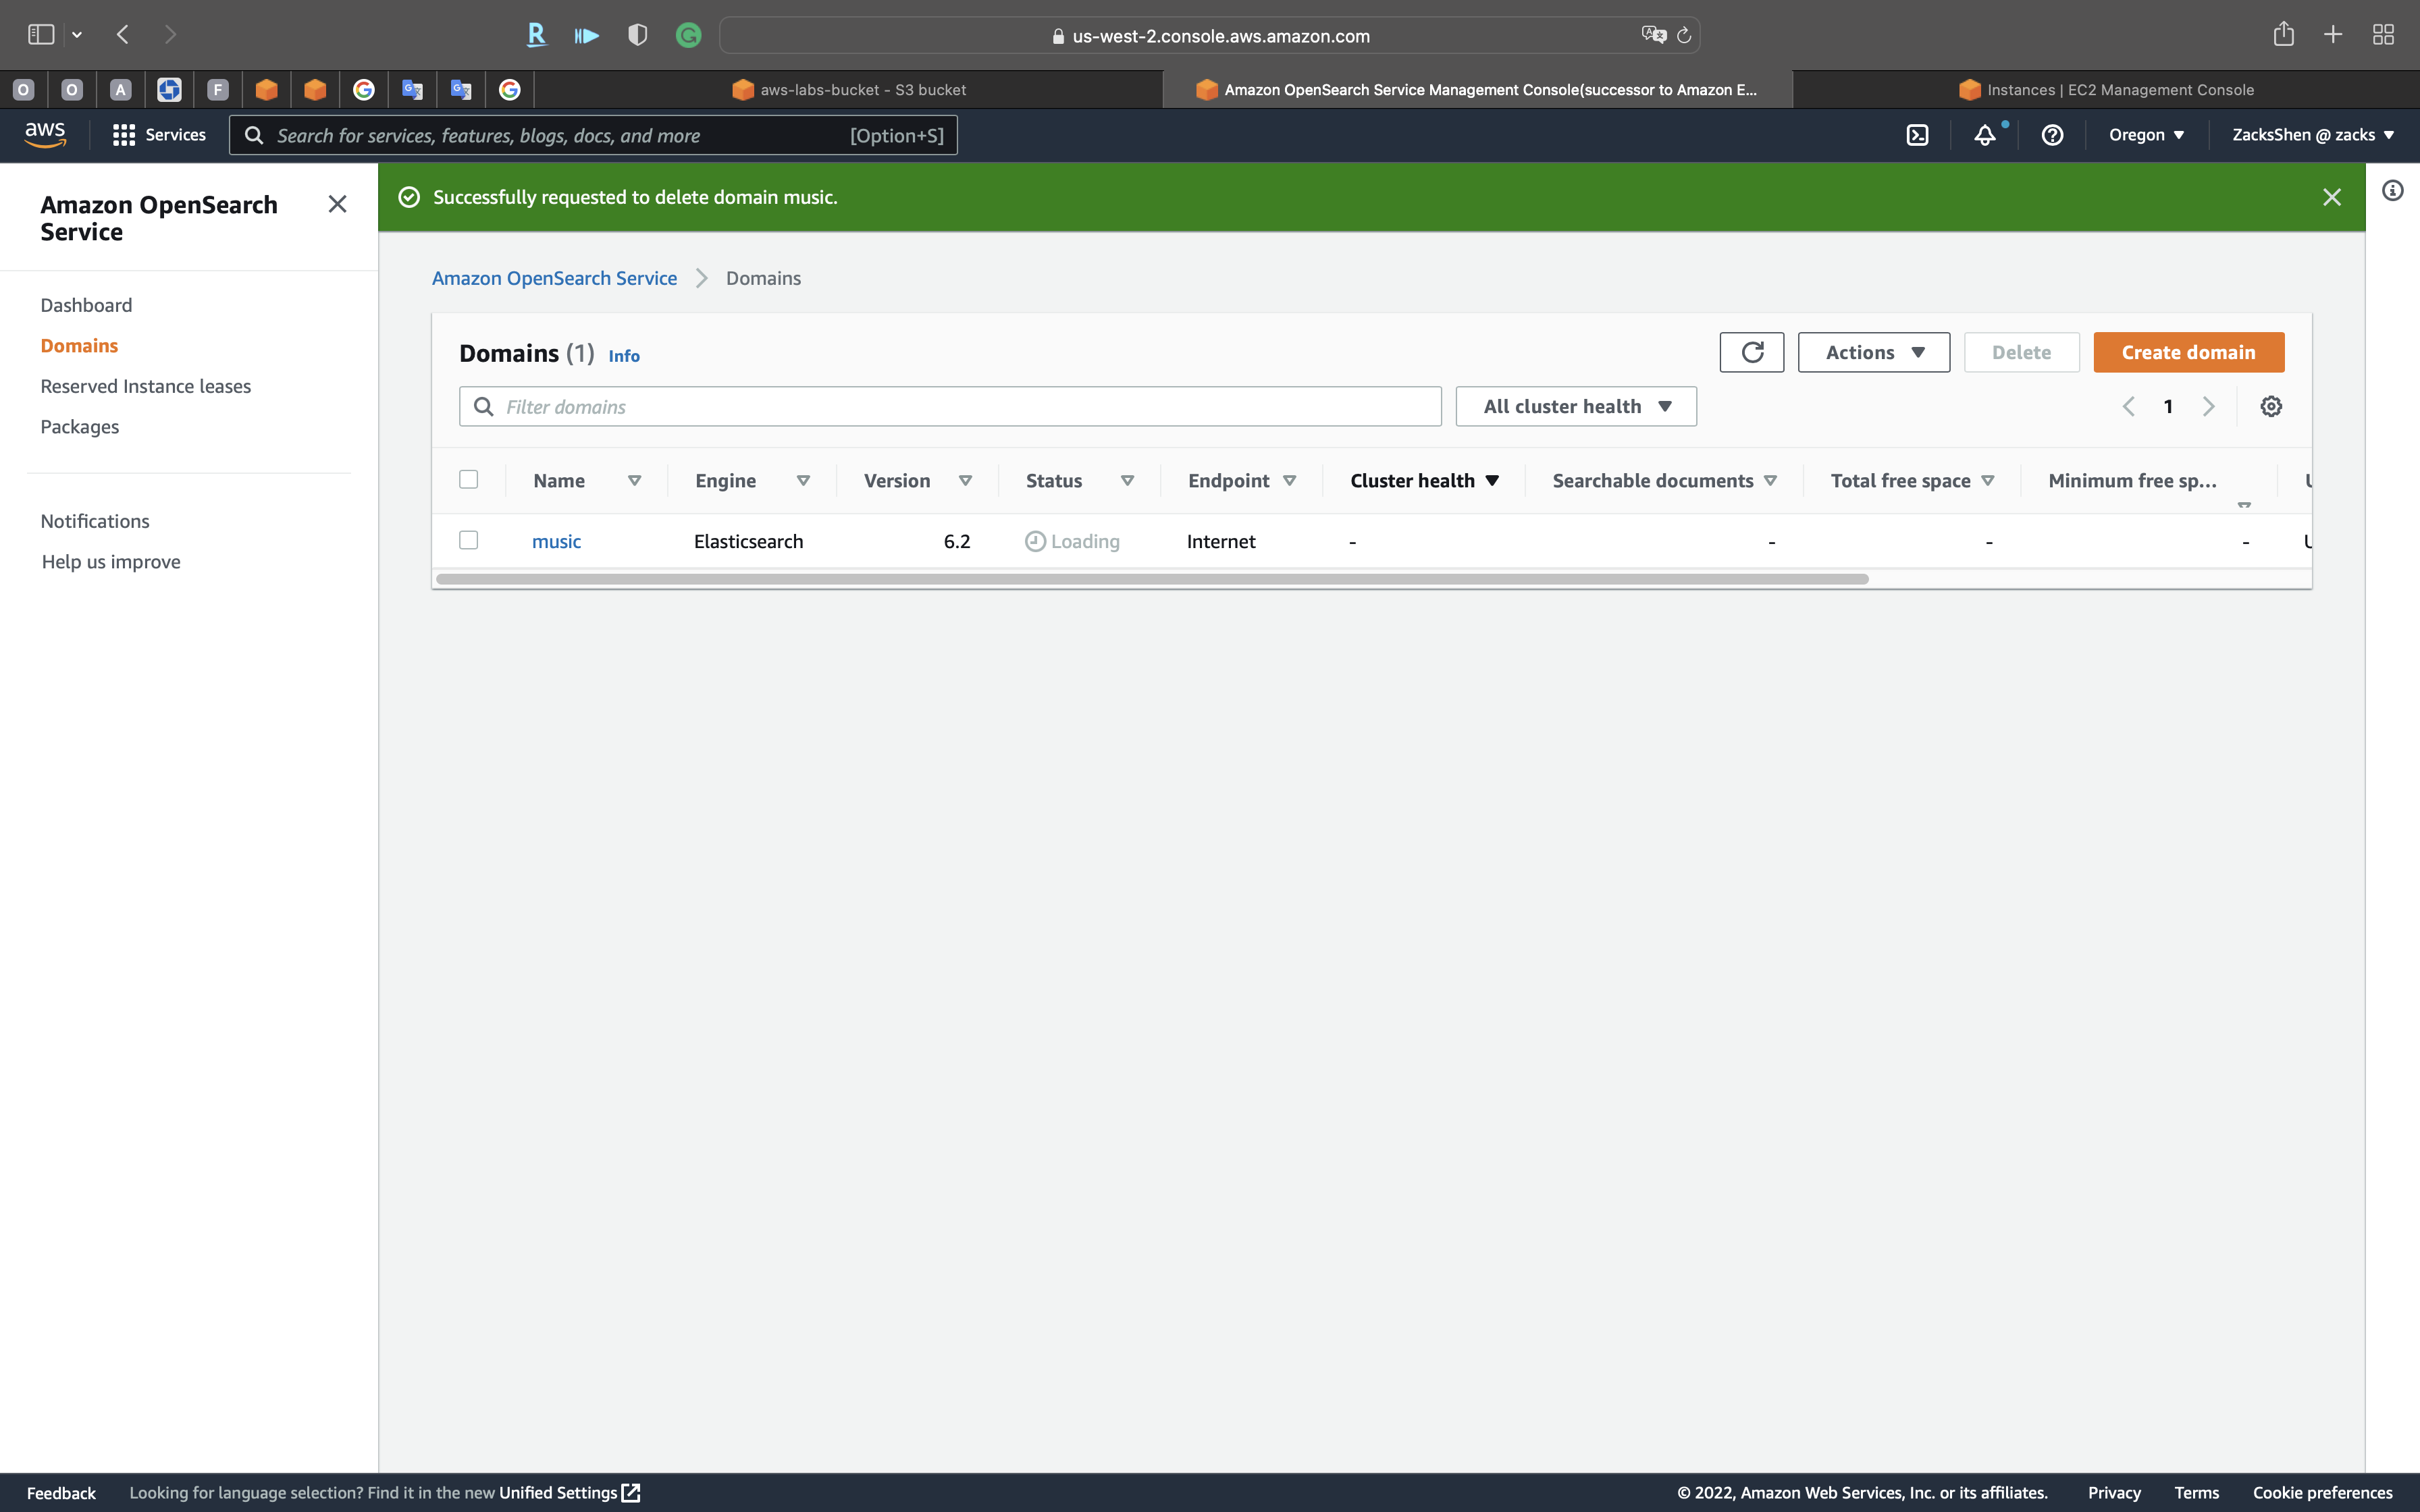
Services -> OpenSearch Service
Delete domain to avoid bankrupt.
Click on Delete
Click on Delete