AWS CloudWatch Lab
CloudWatch
Using CloudWatch for Resource Monitoring, Create CloudWatch Alarms and Dashboards
https://play.whizlabs.com/site/task_details?lab_type=1&task_id=33&quest_id=35
Lab Details
- This lab walks you through the various CloudWatch features available for resource monitoring.
Task Details
- Create EC2 Instance.
- Create SNS Topic. Subscribe via email address.
- Check EC2 CPU Utilization Metrics in CloudWatch Metrics.
- Create CloudWatch Alarm.
- Stress CPU to trigger SNS Notification Email from CloudWatch Alarm.
- Create a CloudWatch Dashboard and add various widgets.
Architecture Diagram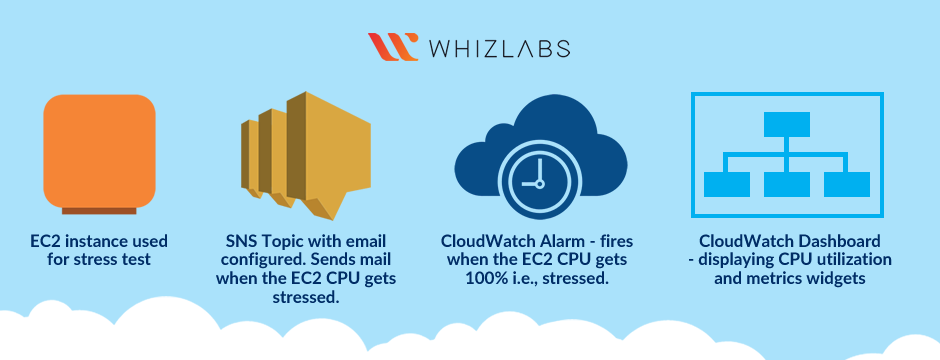
EC2 Configuration
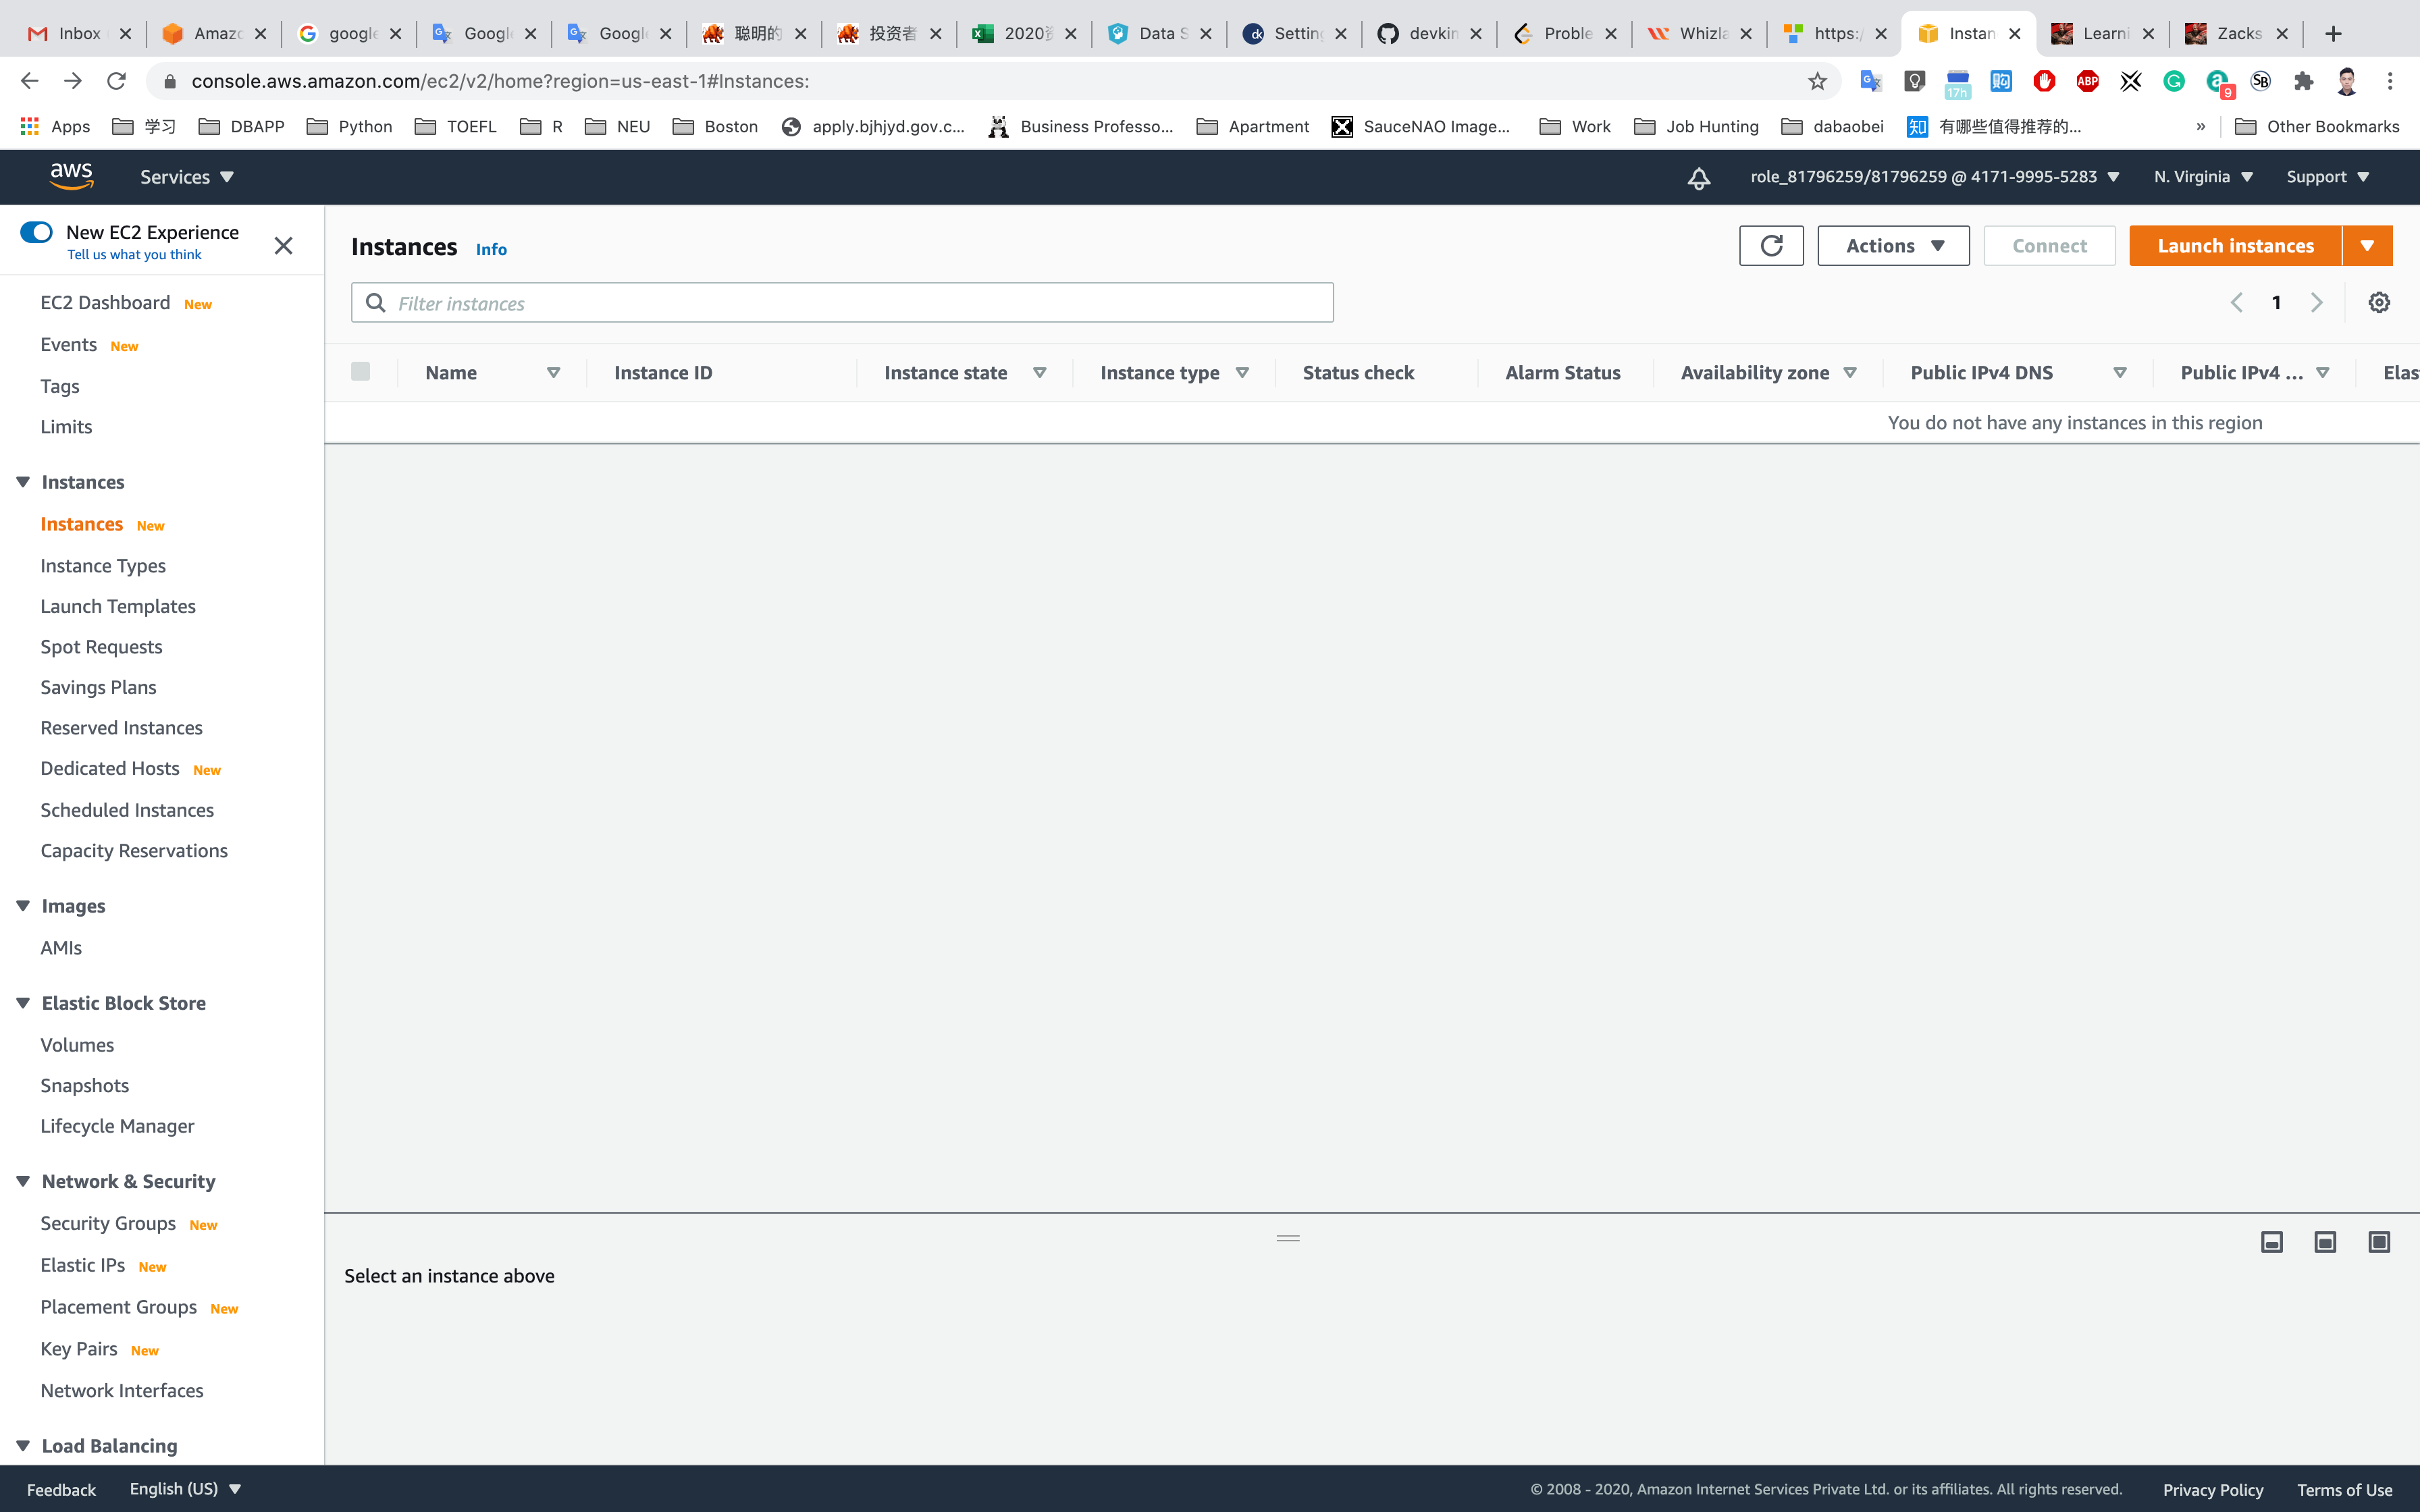
Services -> EC2 -> Instances
Click on Launch instances
Launching EC2 Instance
Step 1: Choose an Amazon Machine Image(AMI)
Select Amazon Linux 2 AMI (HVM), SSD Volume Type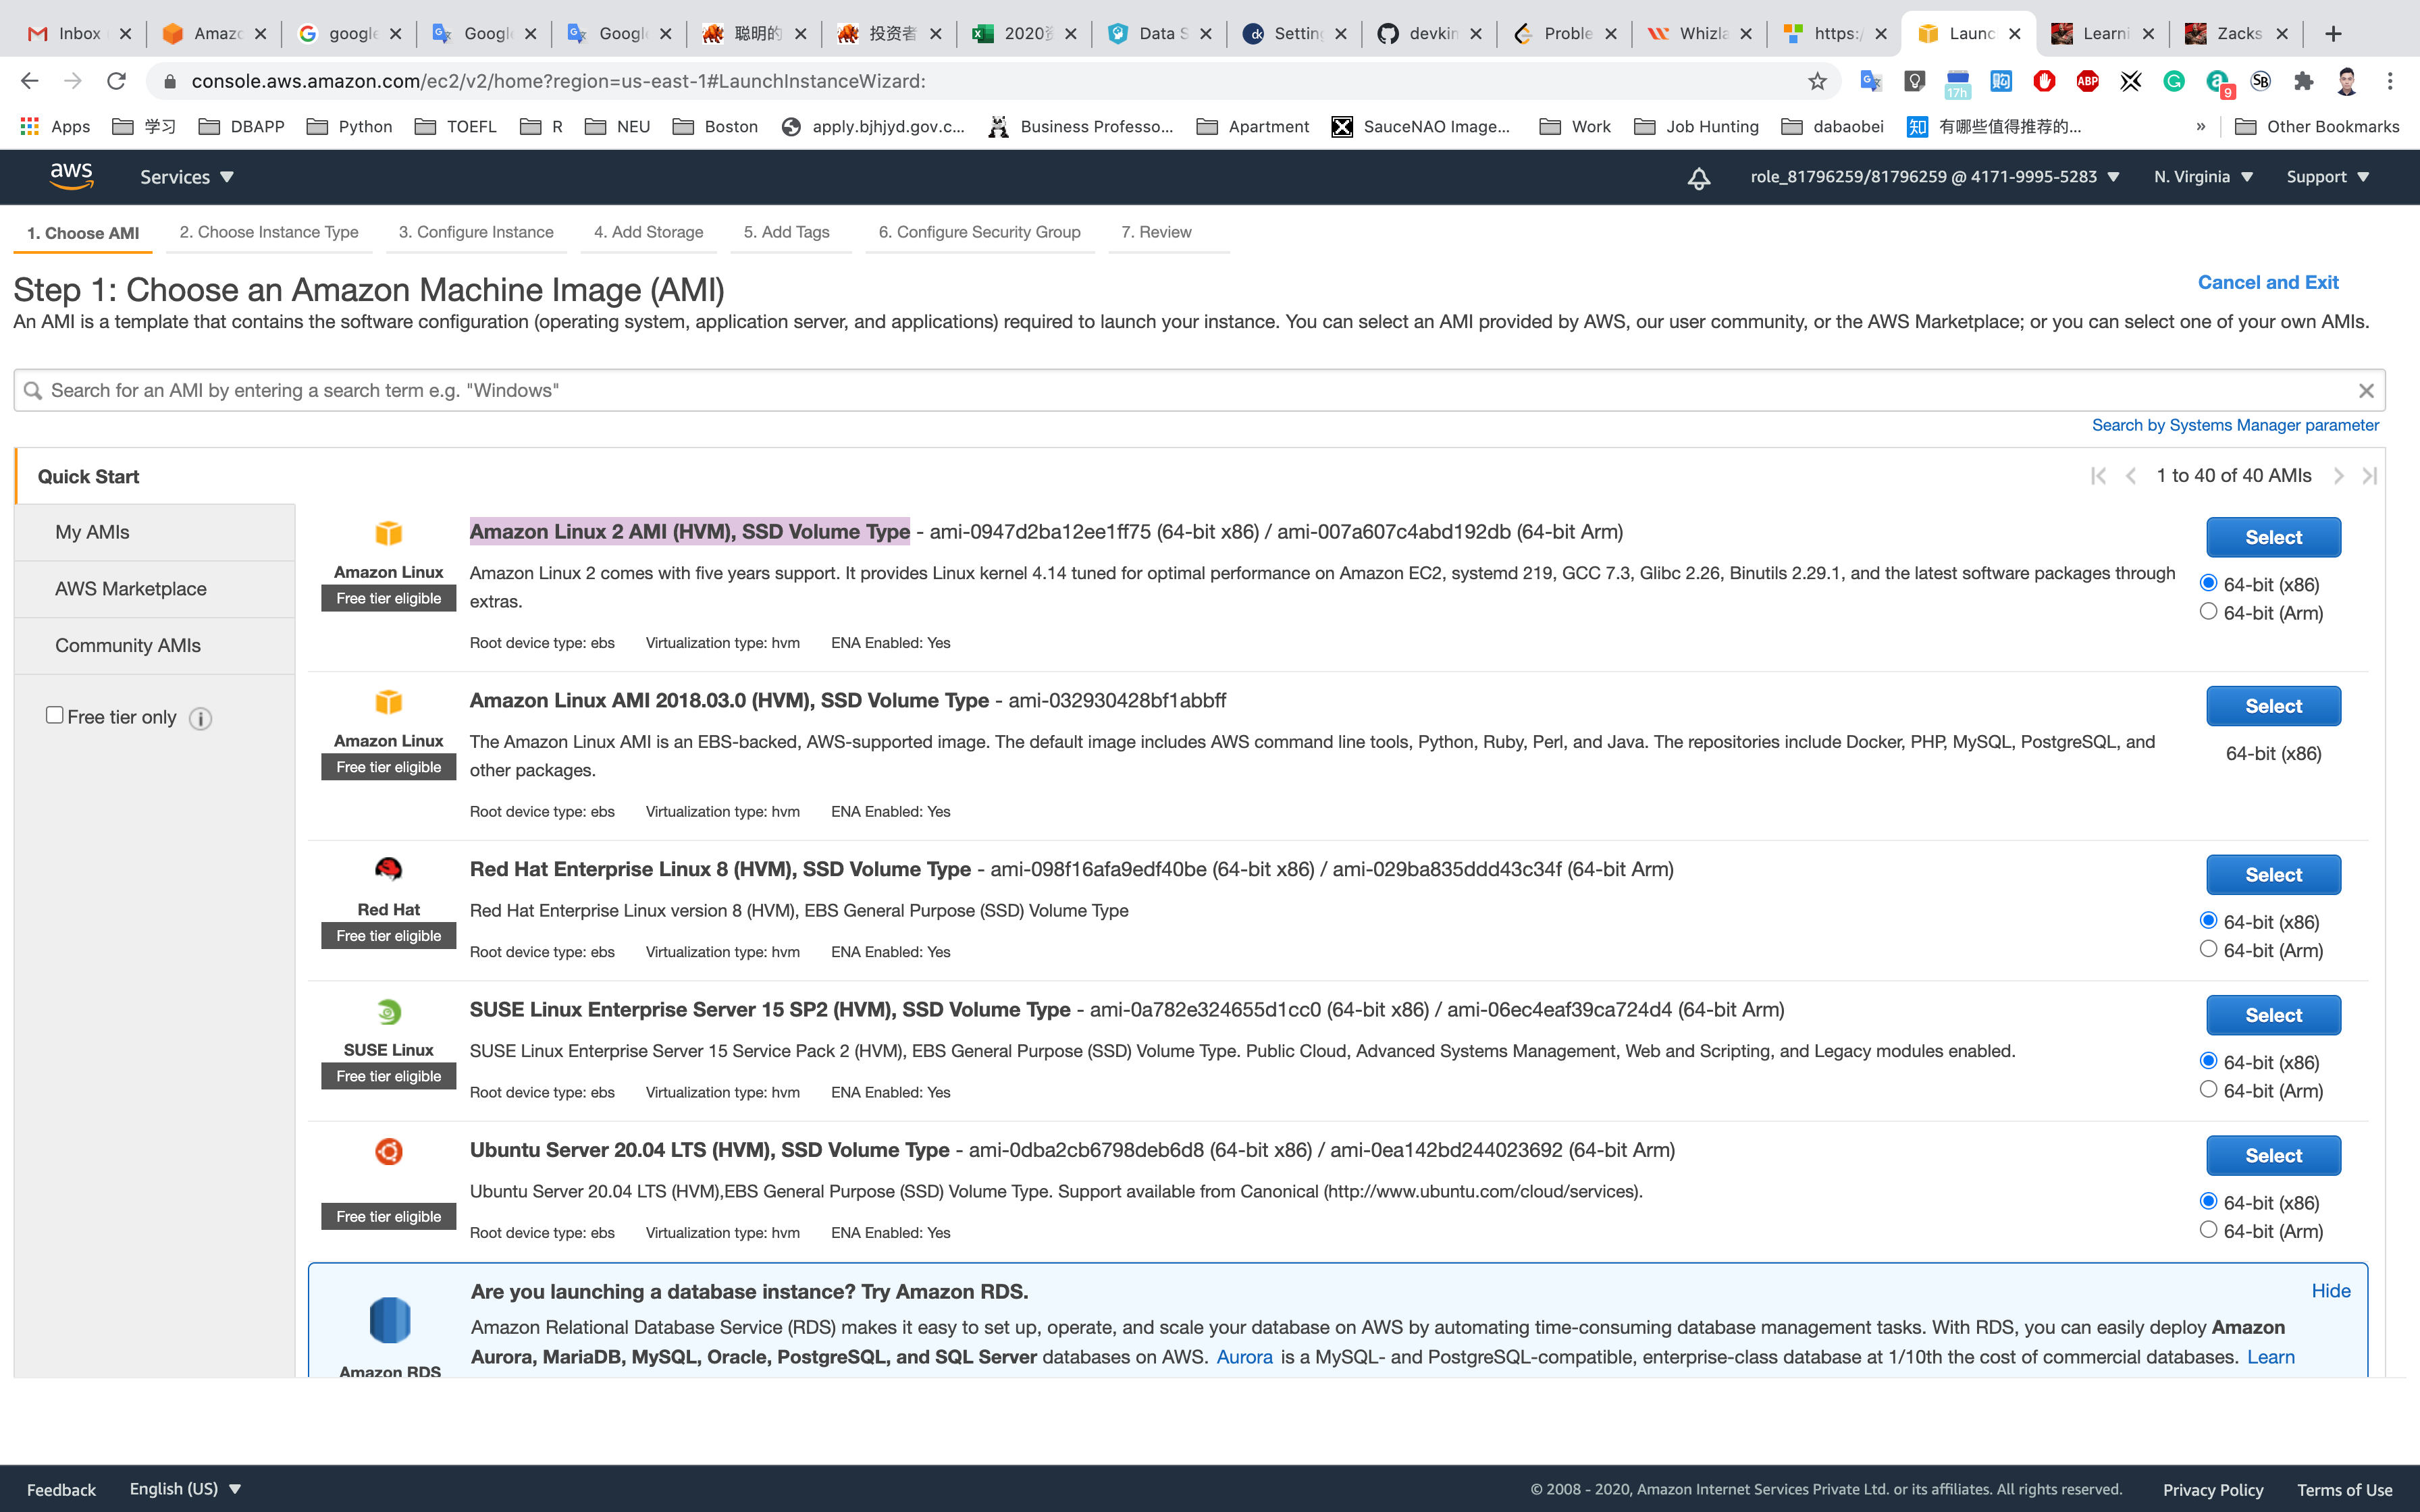
Step 2: Choose an Instance Type
Select t2.micro
Click on Next: Configure Instance Details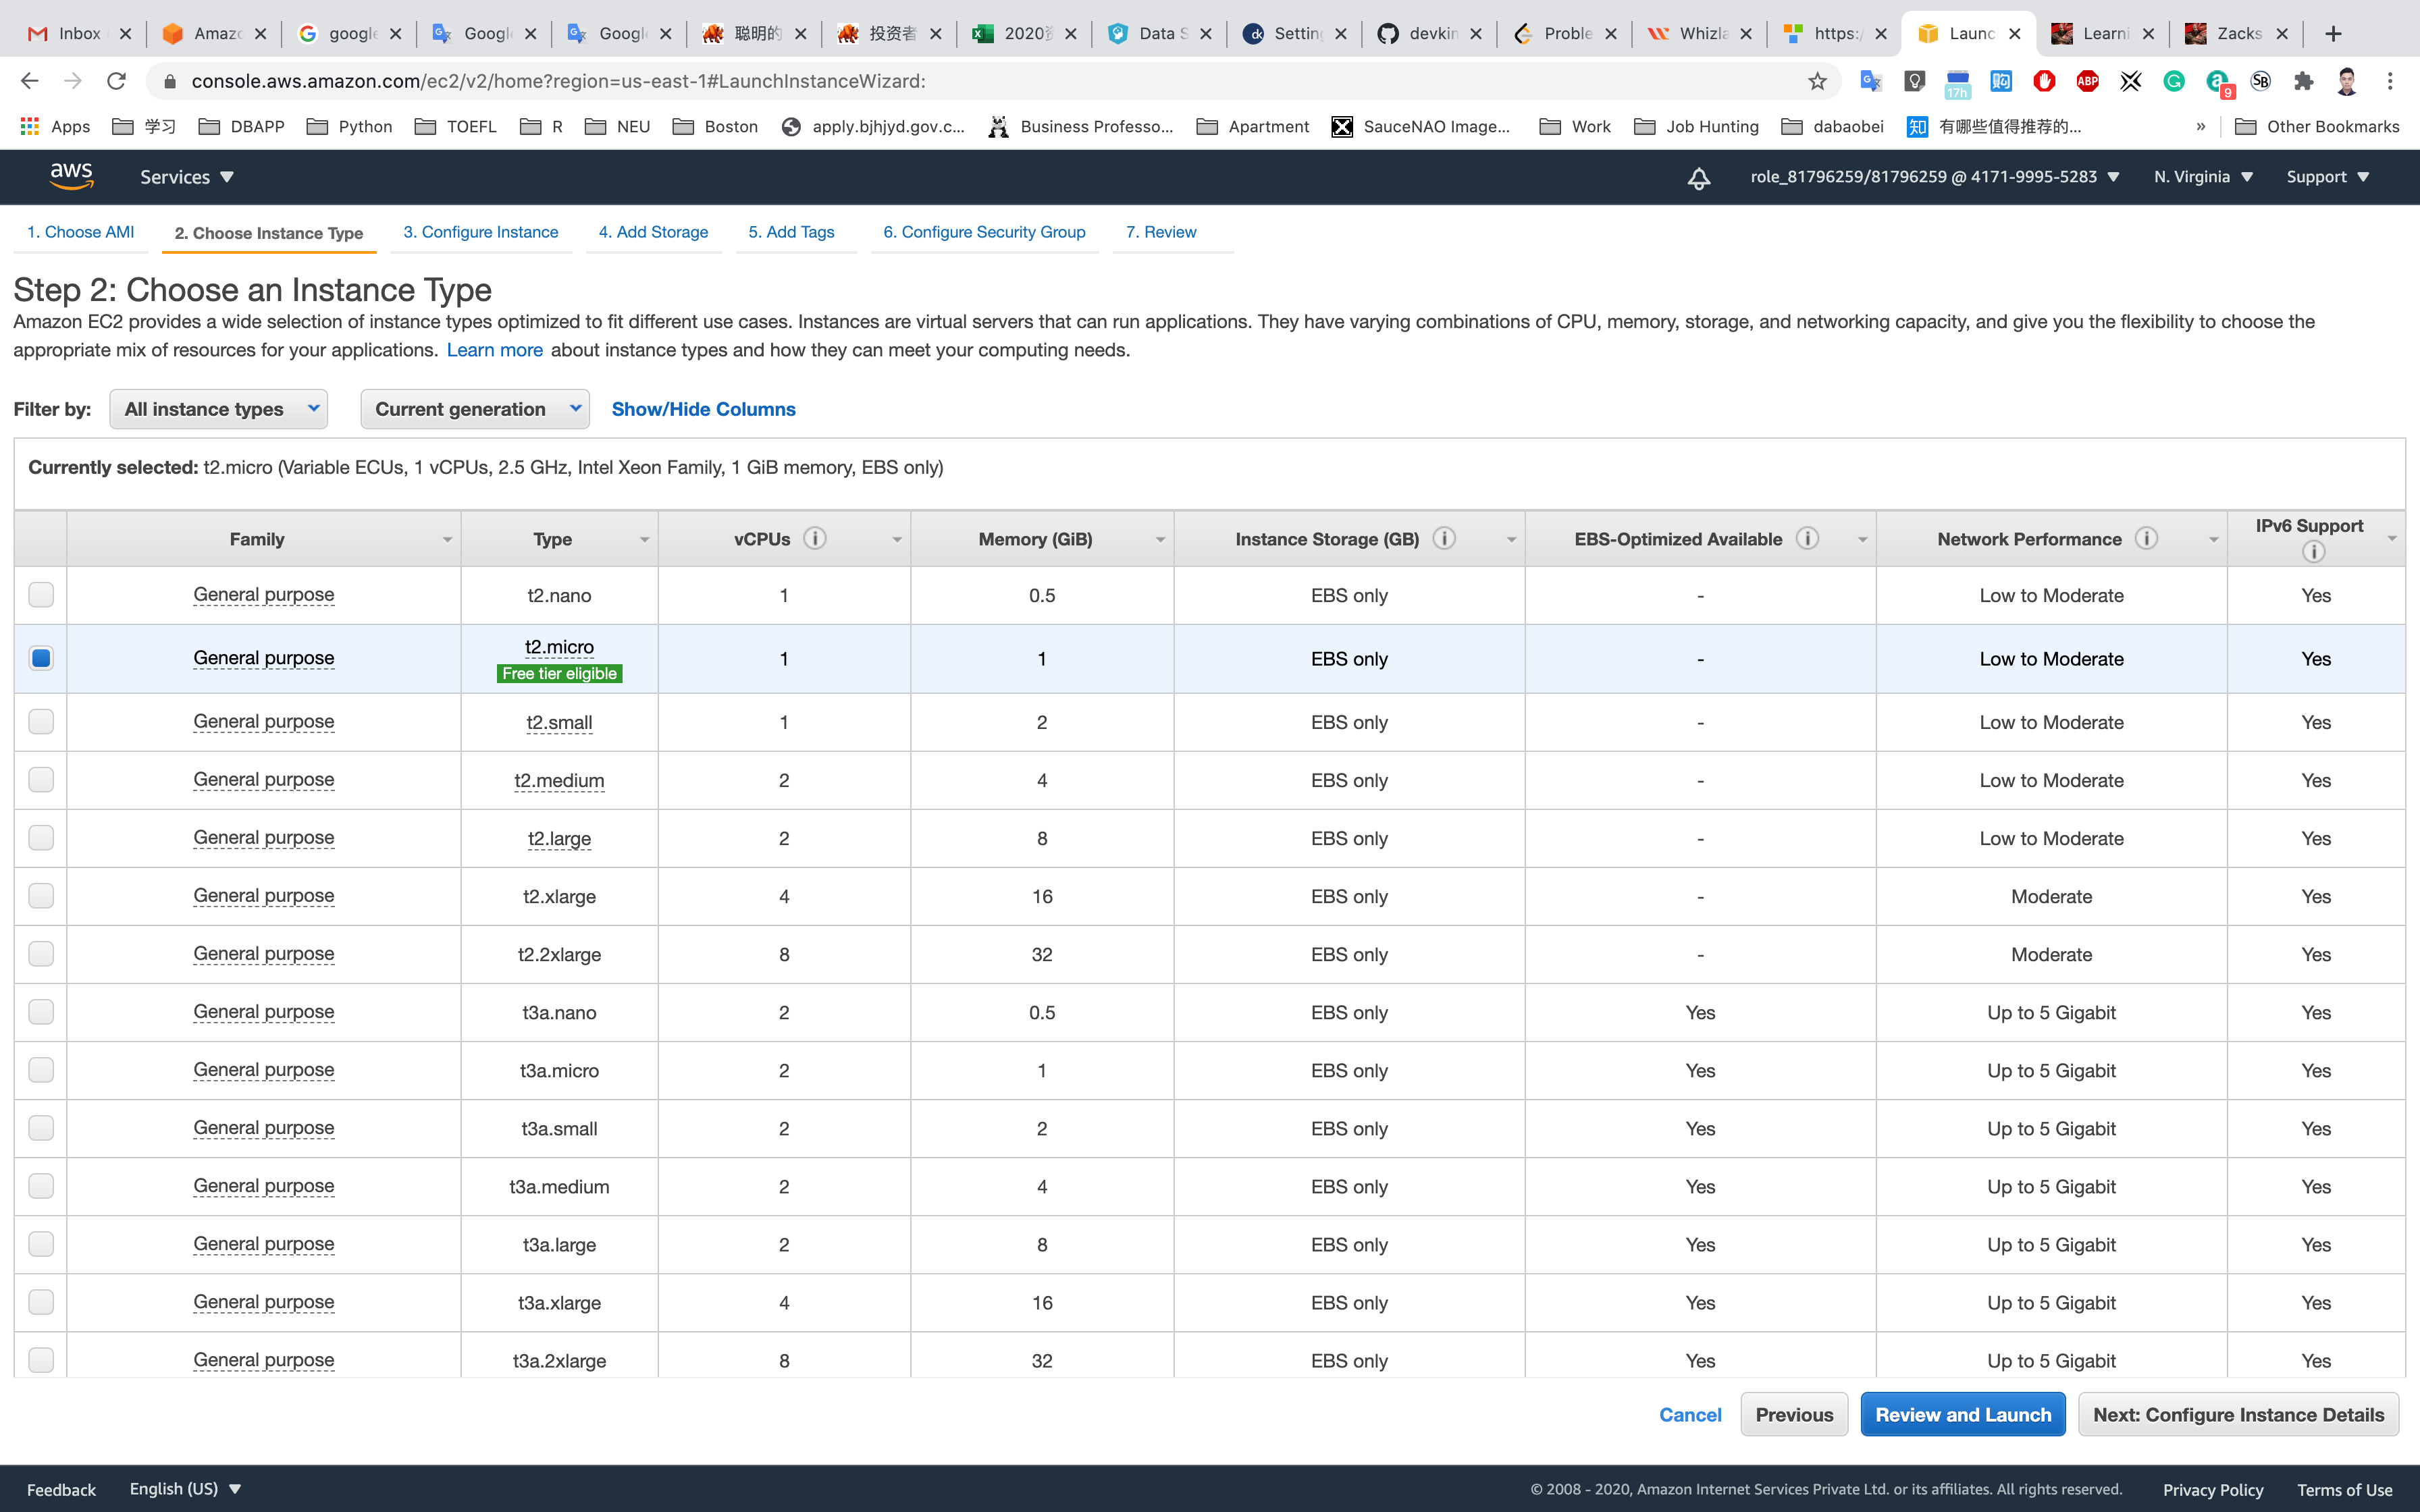
Step 3: Configure Instance Details
Leave it default settings
Click on Next: Add Storage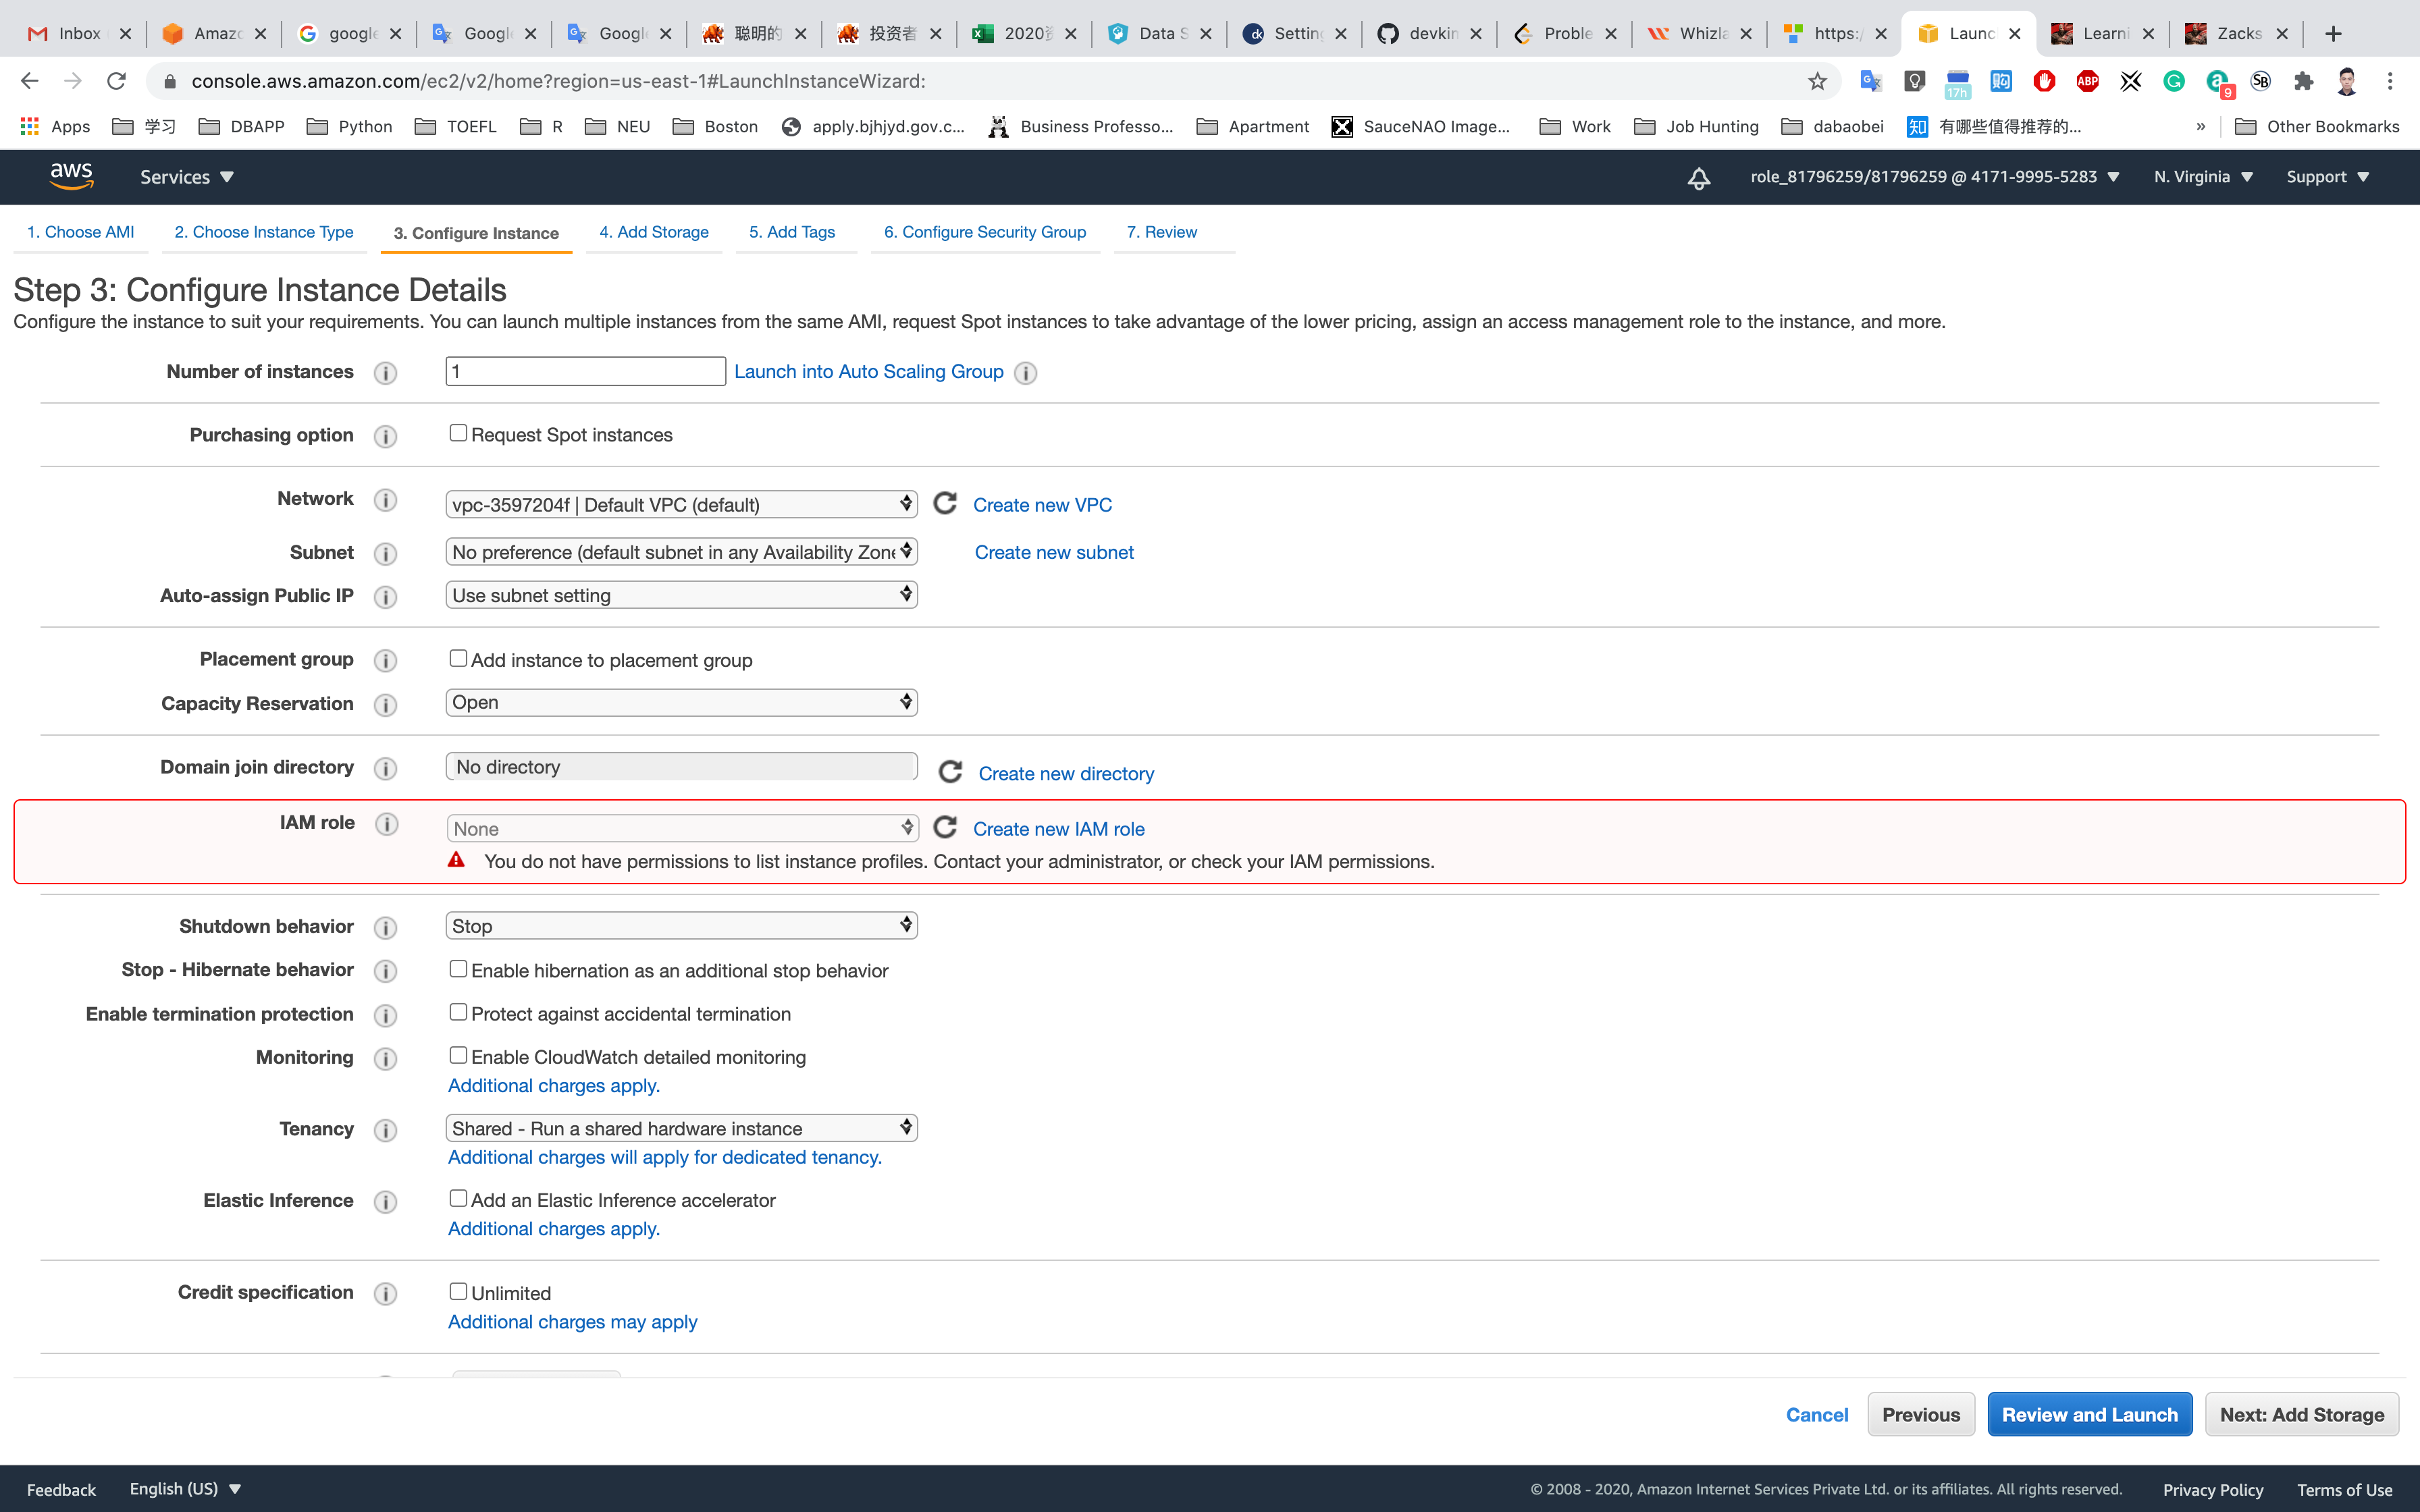
Step 4: Add Storage
Leave it default settings
Click on Next: Add Tags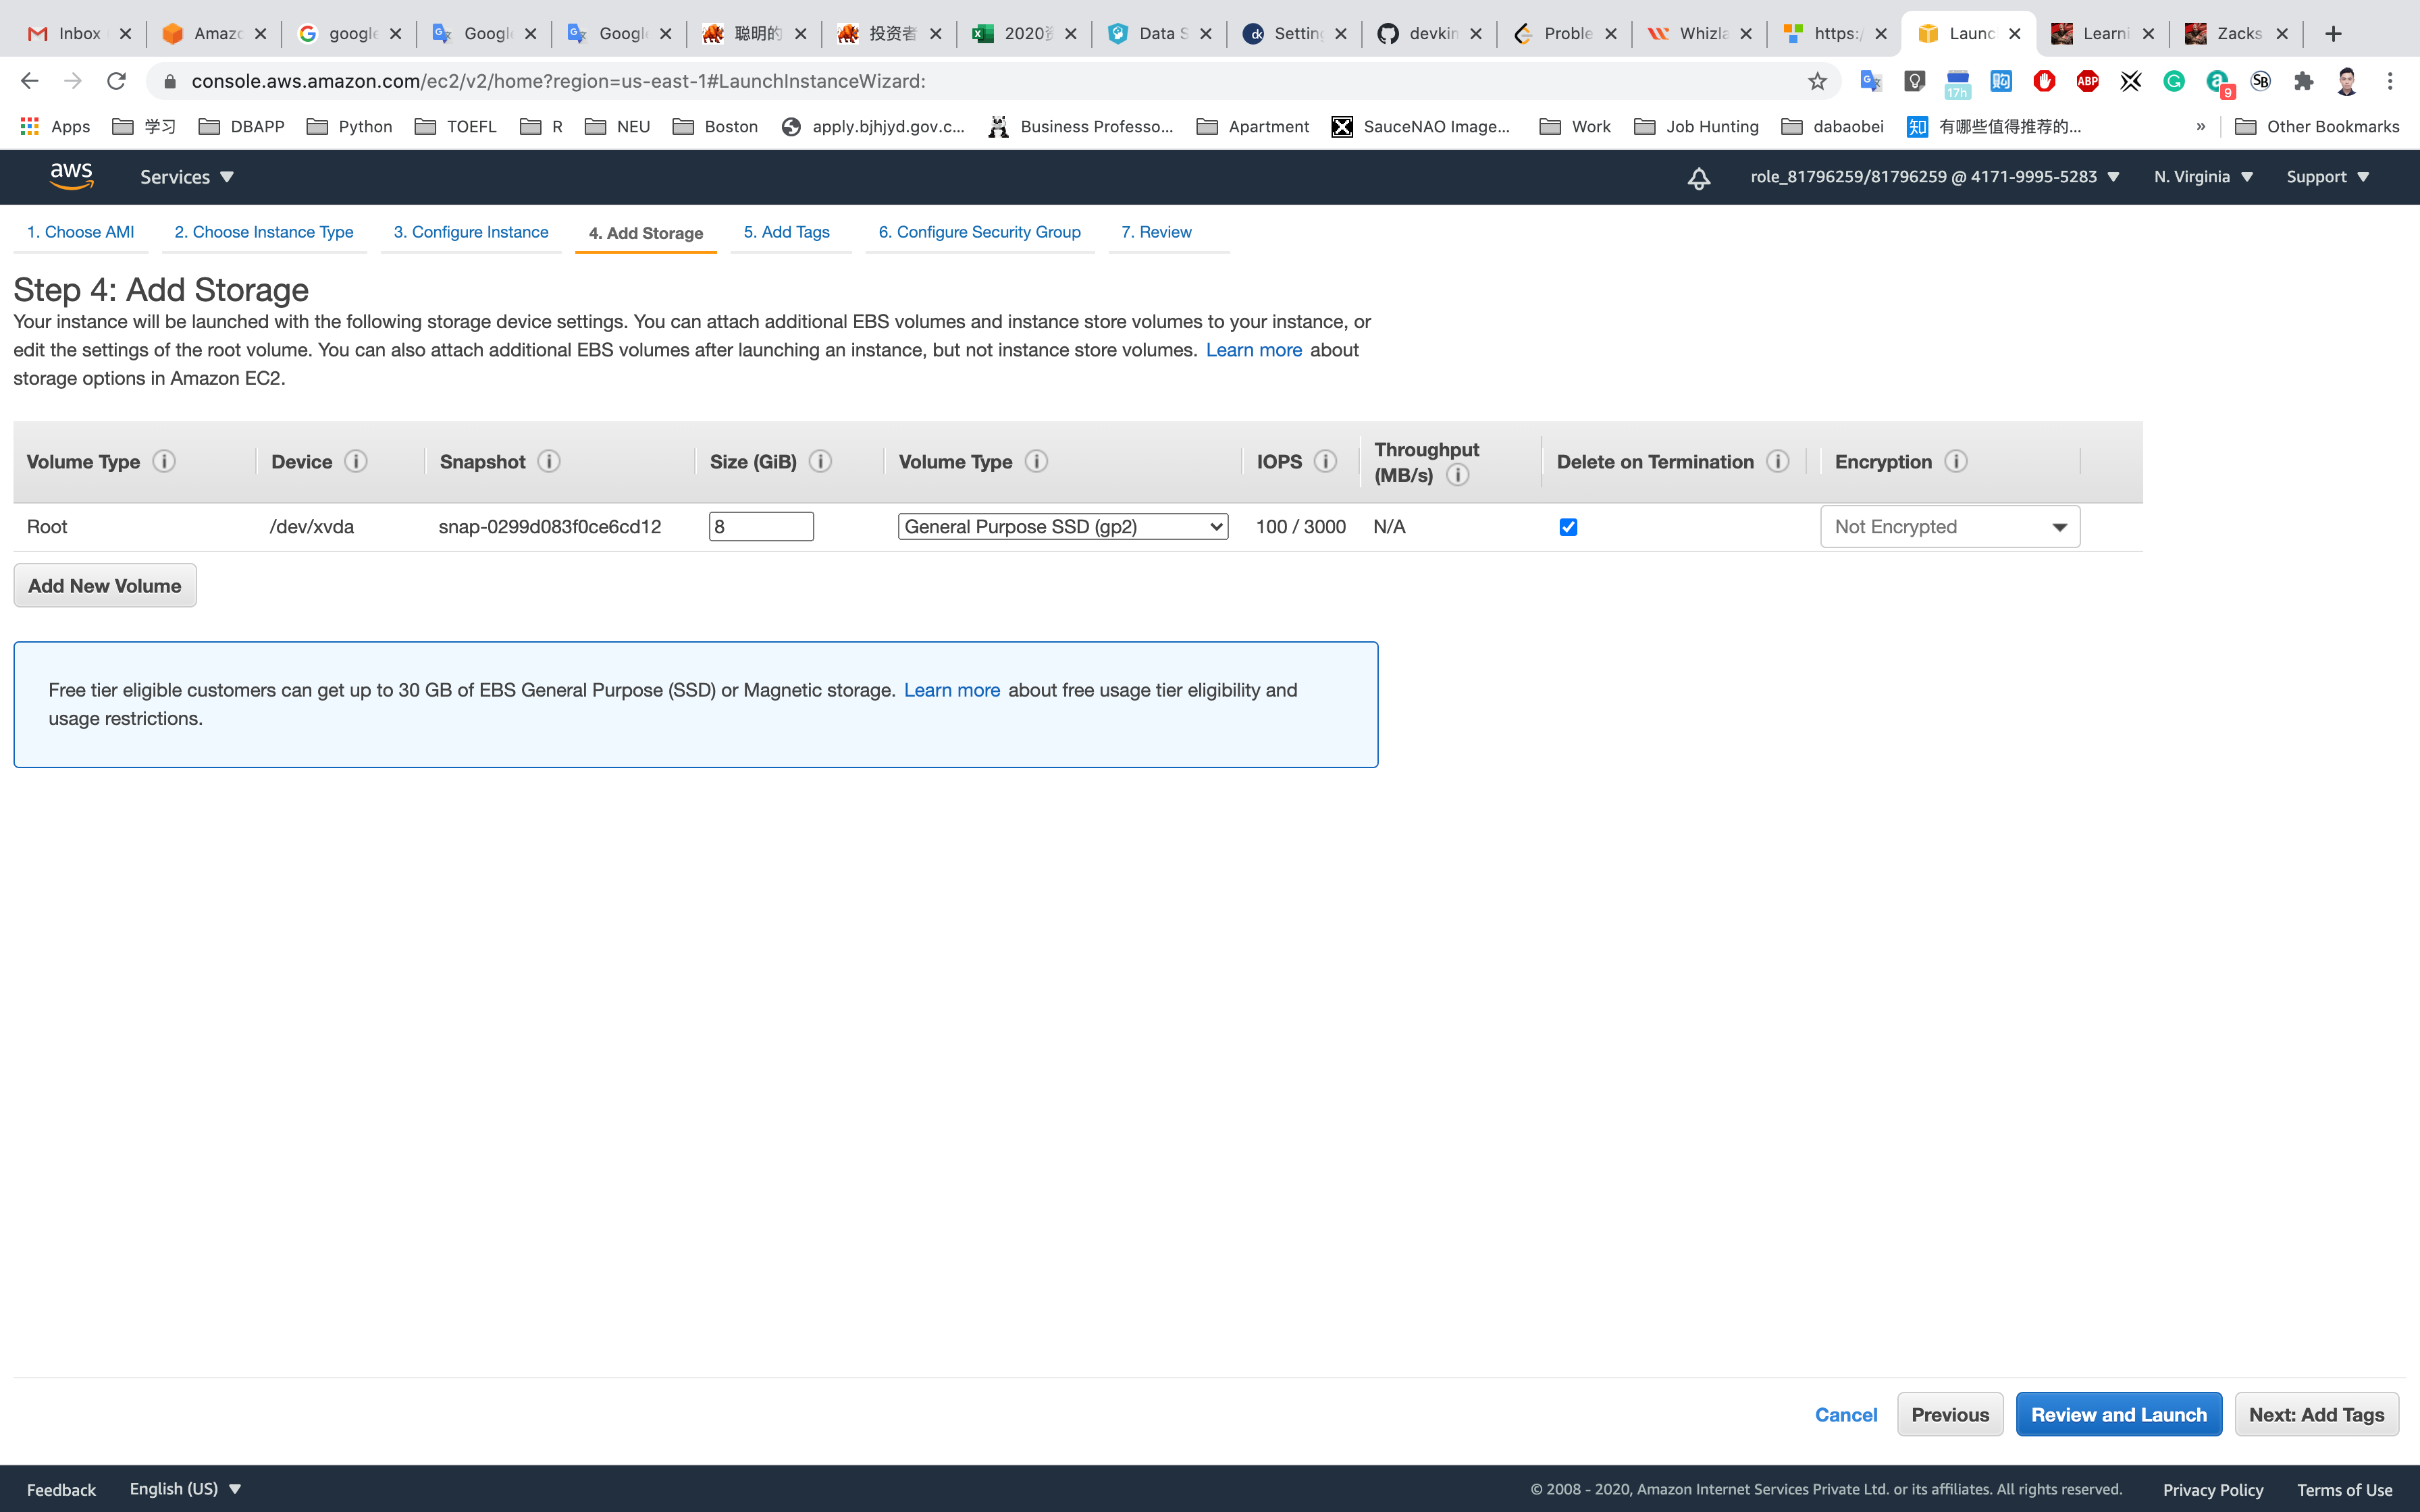
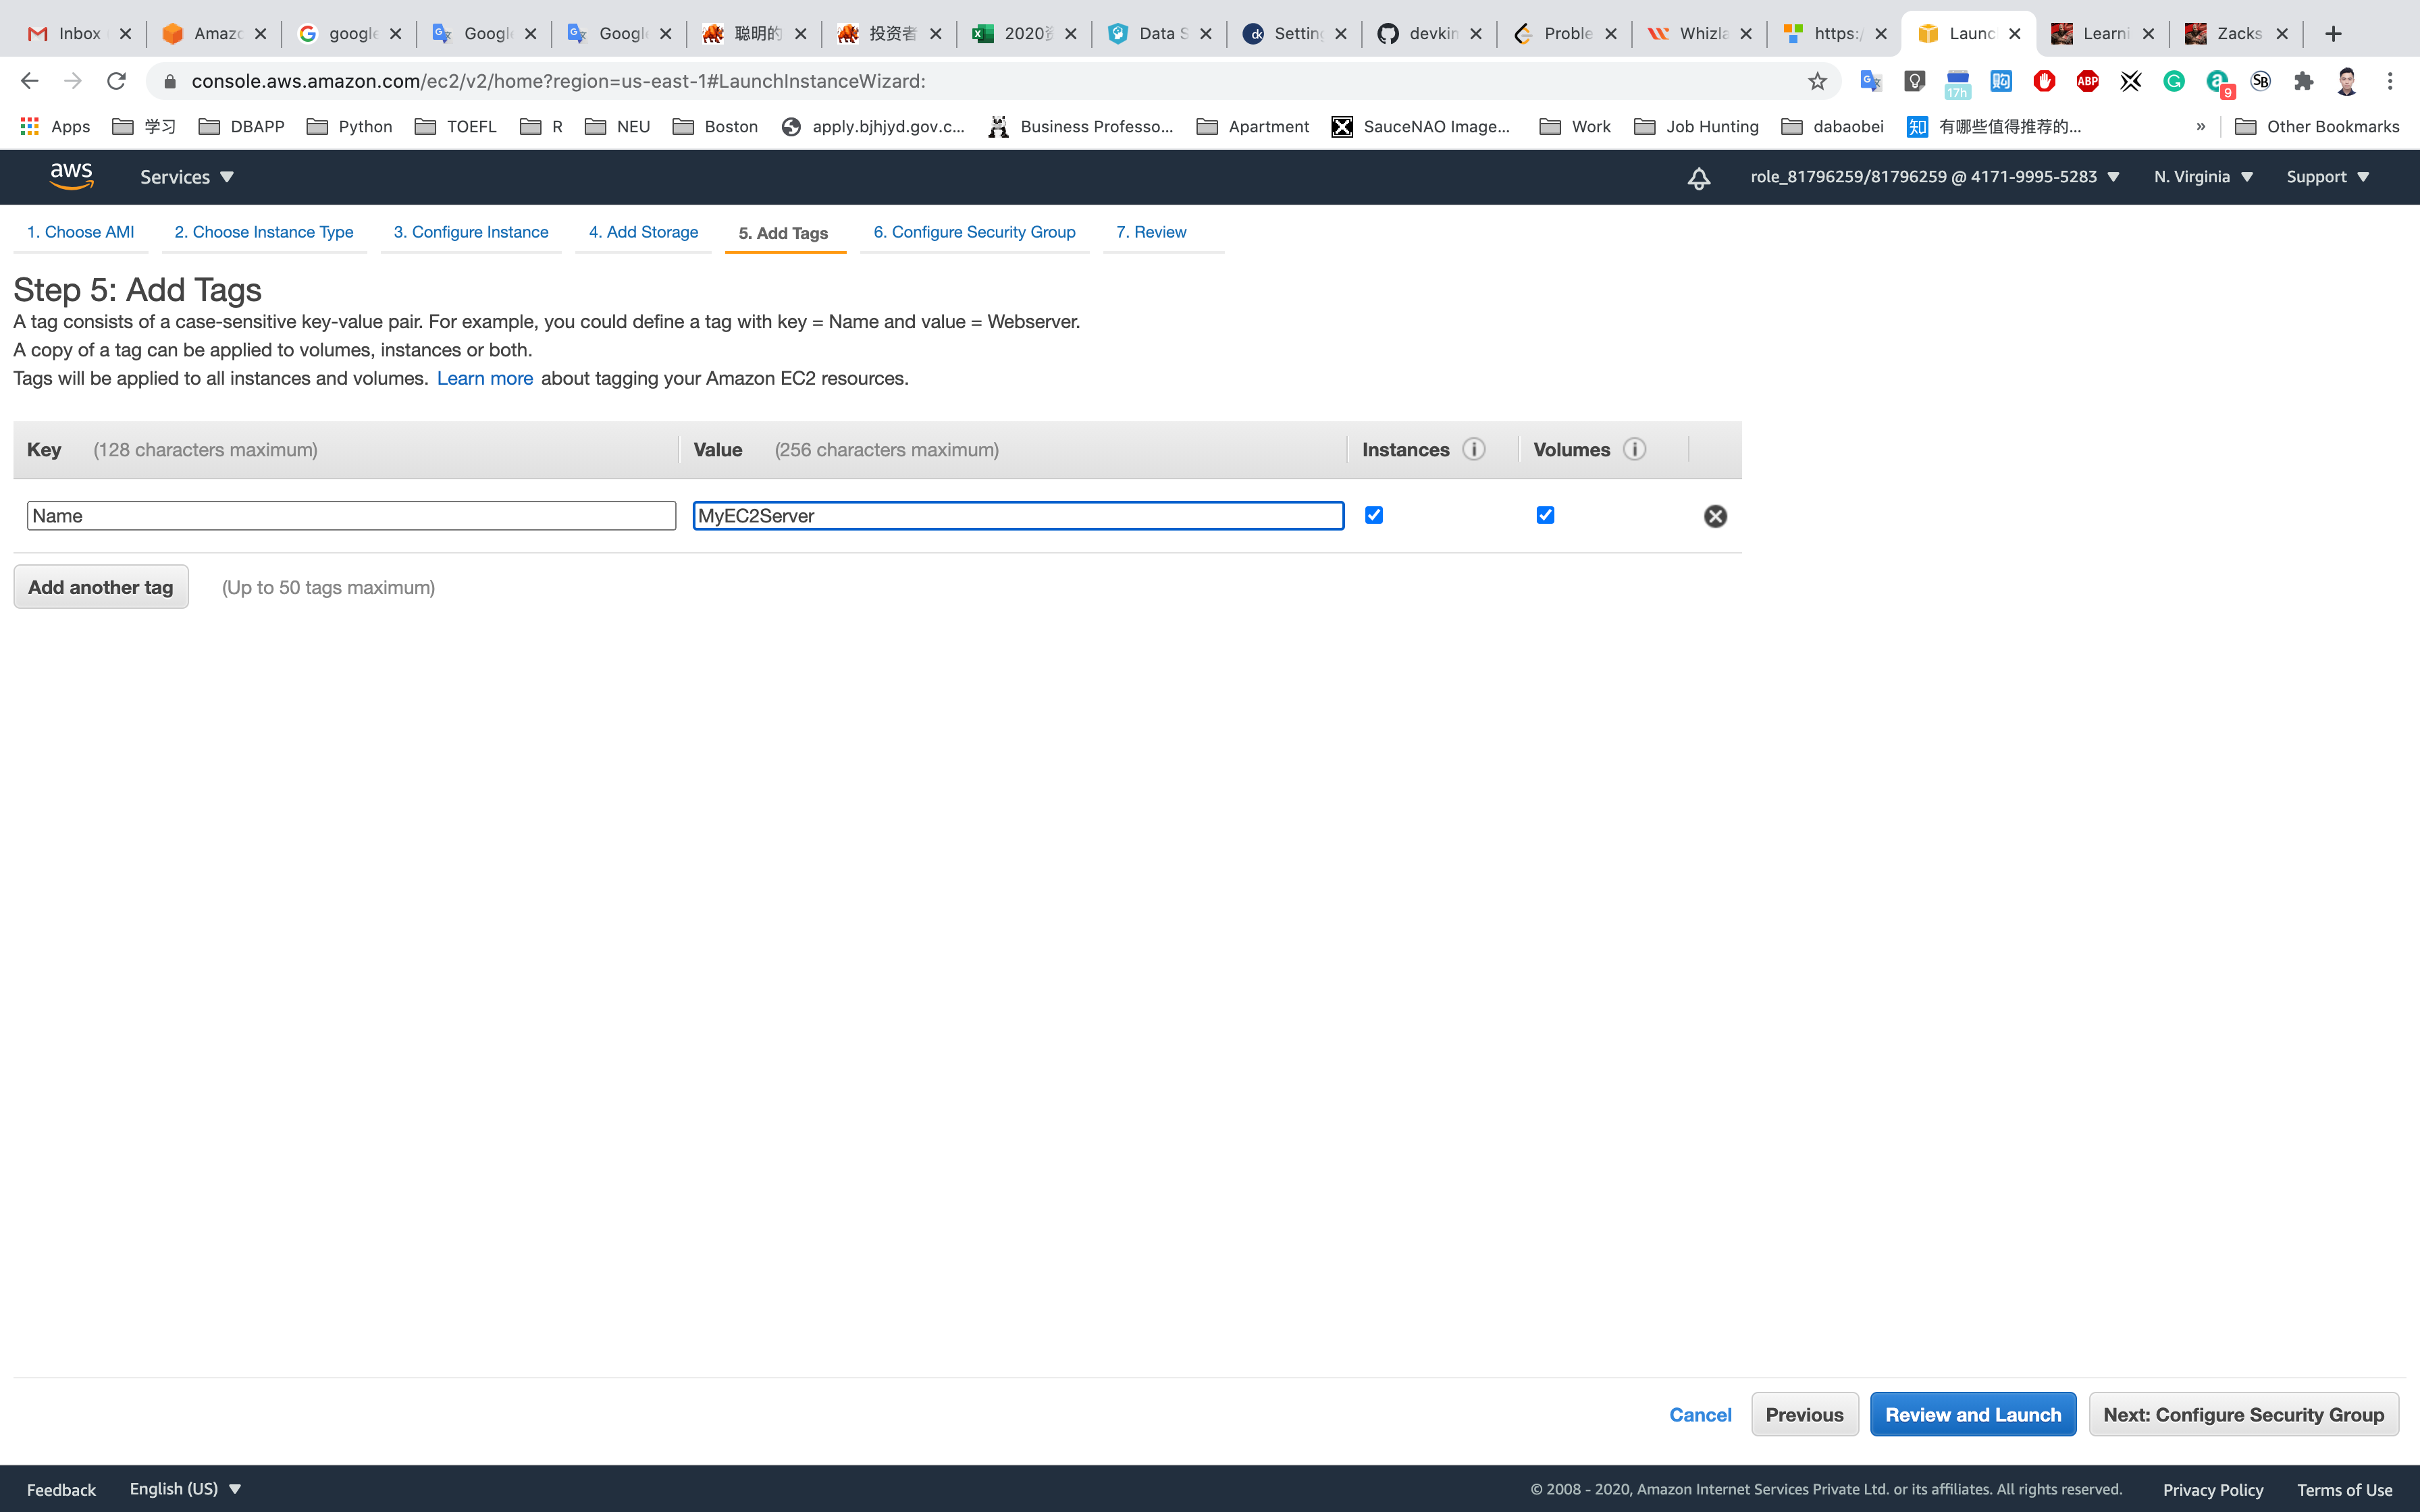
Step 5: Add Tags
Click on Add Tag
- Key:
Name - Value:
MyEC2Server
Click on Next: Configure Security Group
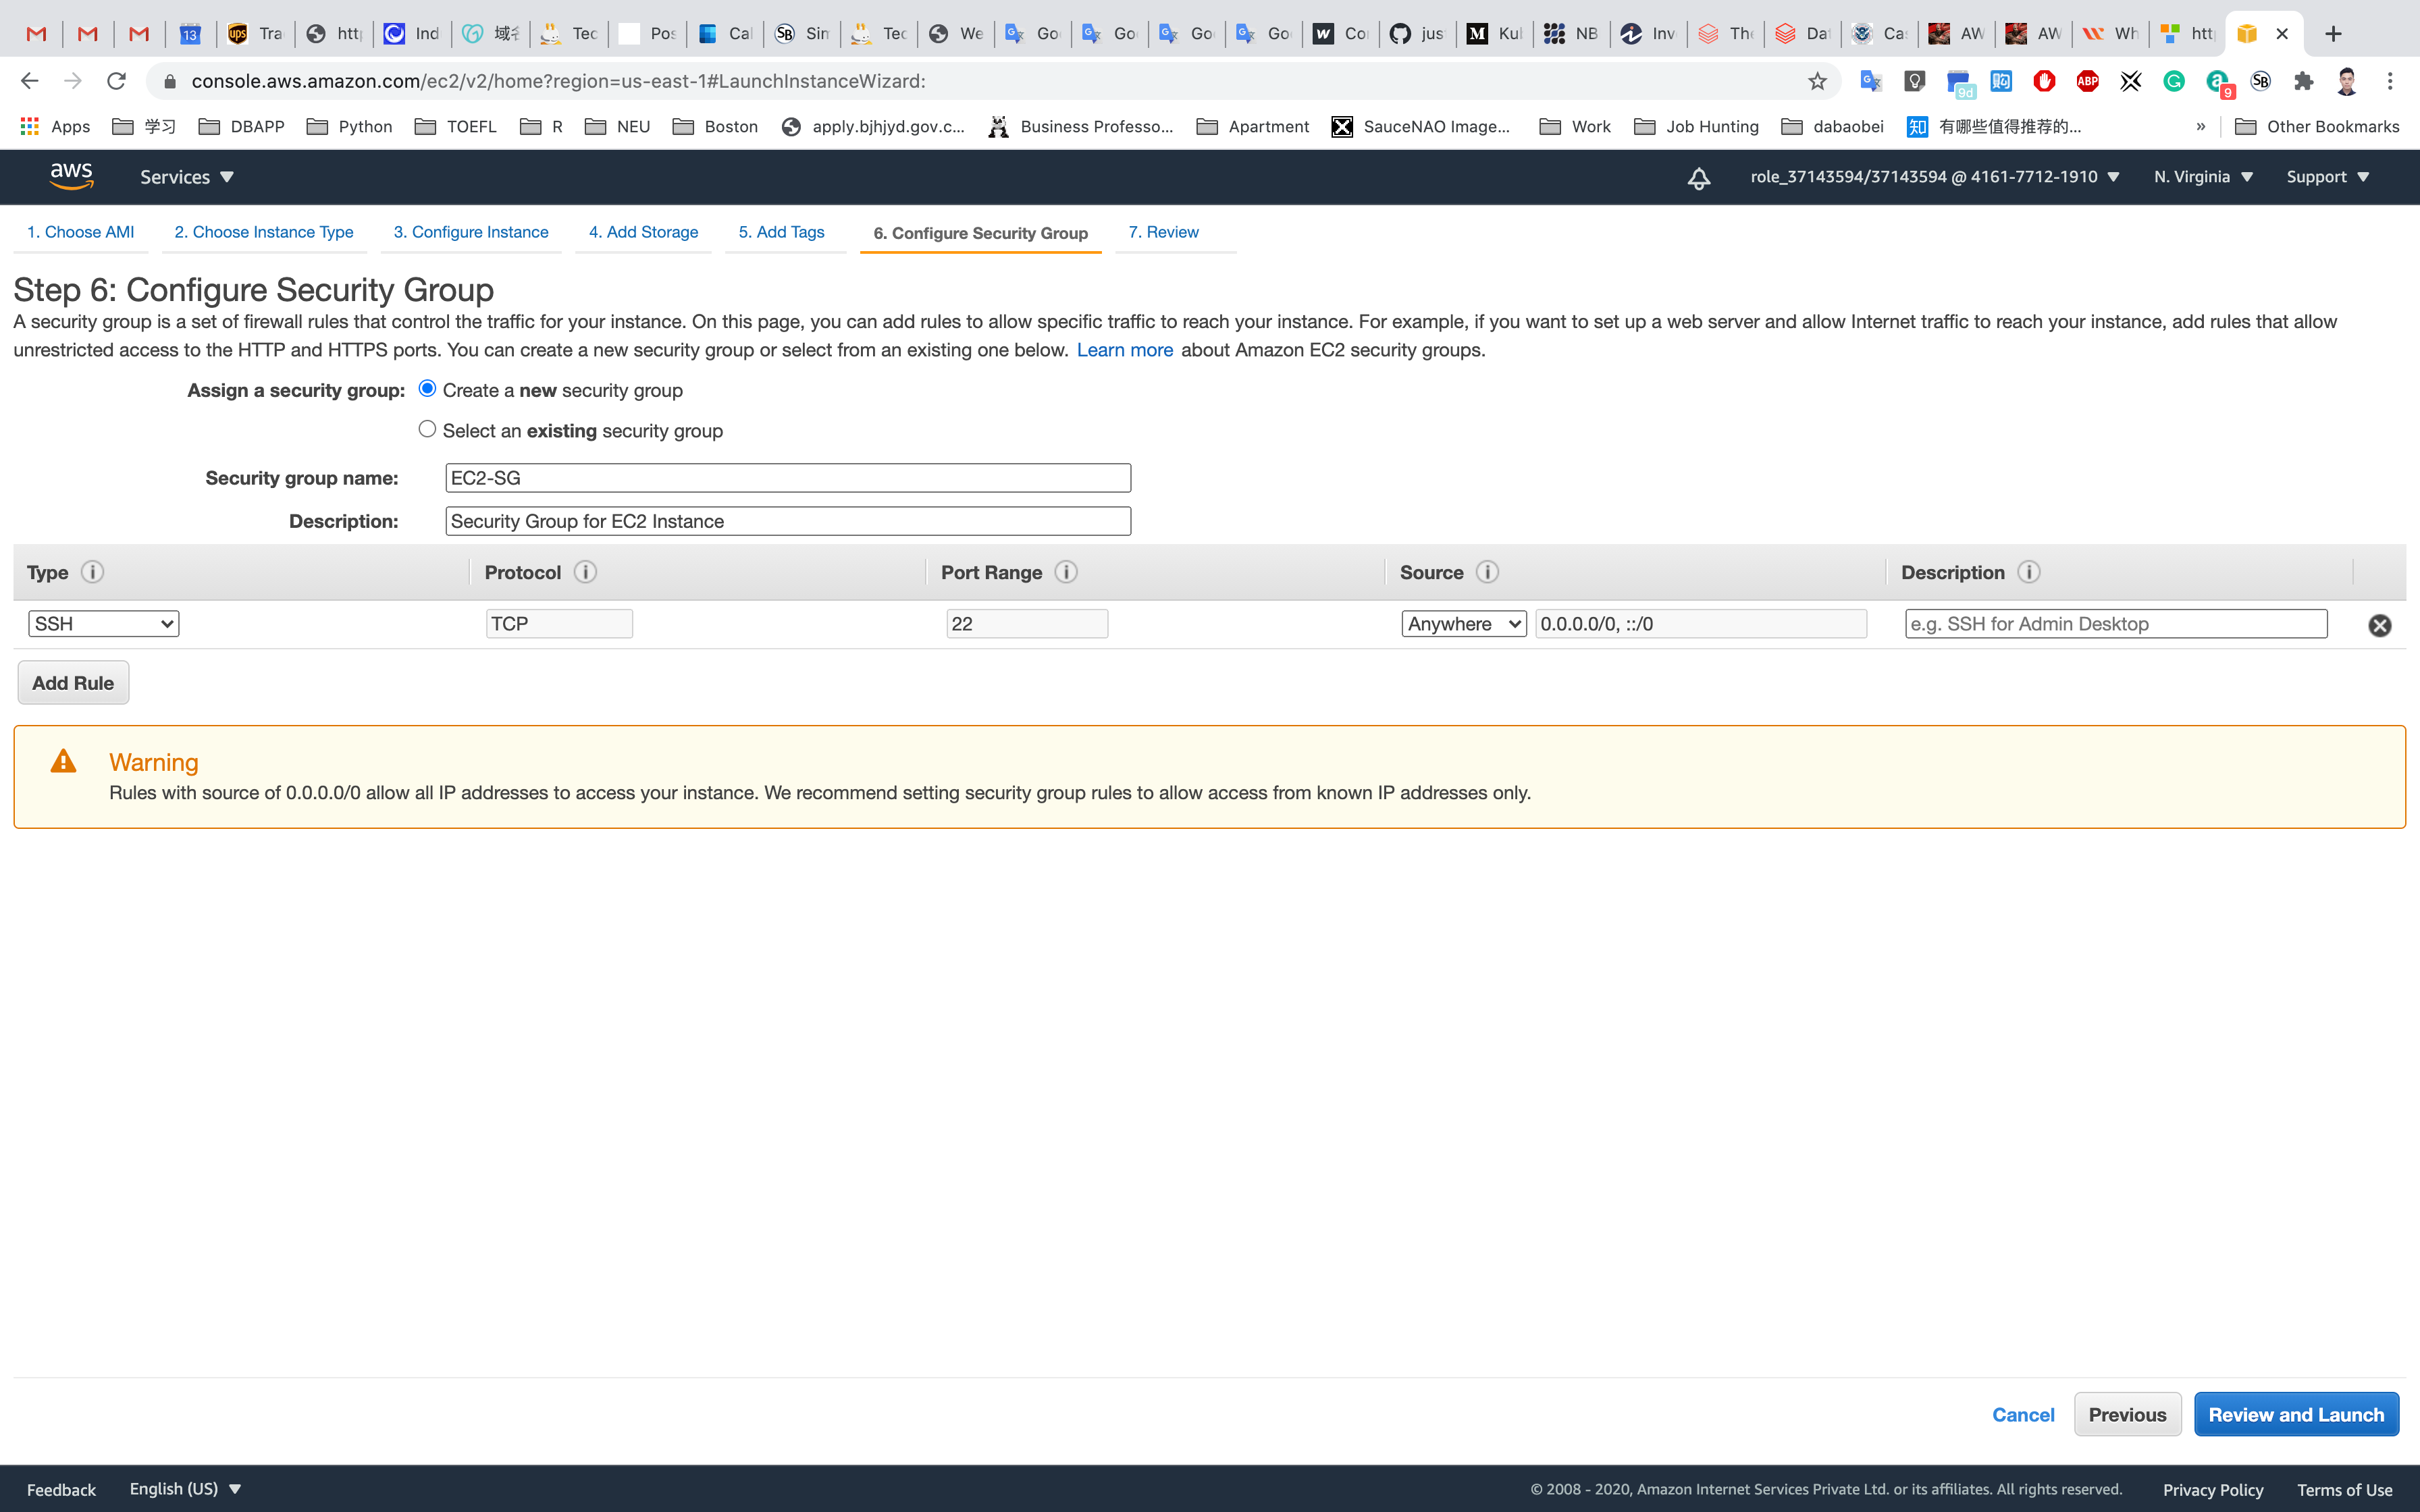
Step 6: Configure Security Group
Select Create a new security group
- Security group name:
EC2-SG - Description :
Security Group for EC2 Instance
For SSH:
- Source:
Anywhere
Step 7: Review Instance Launch
Click on Launch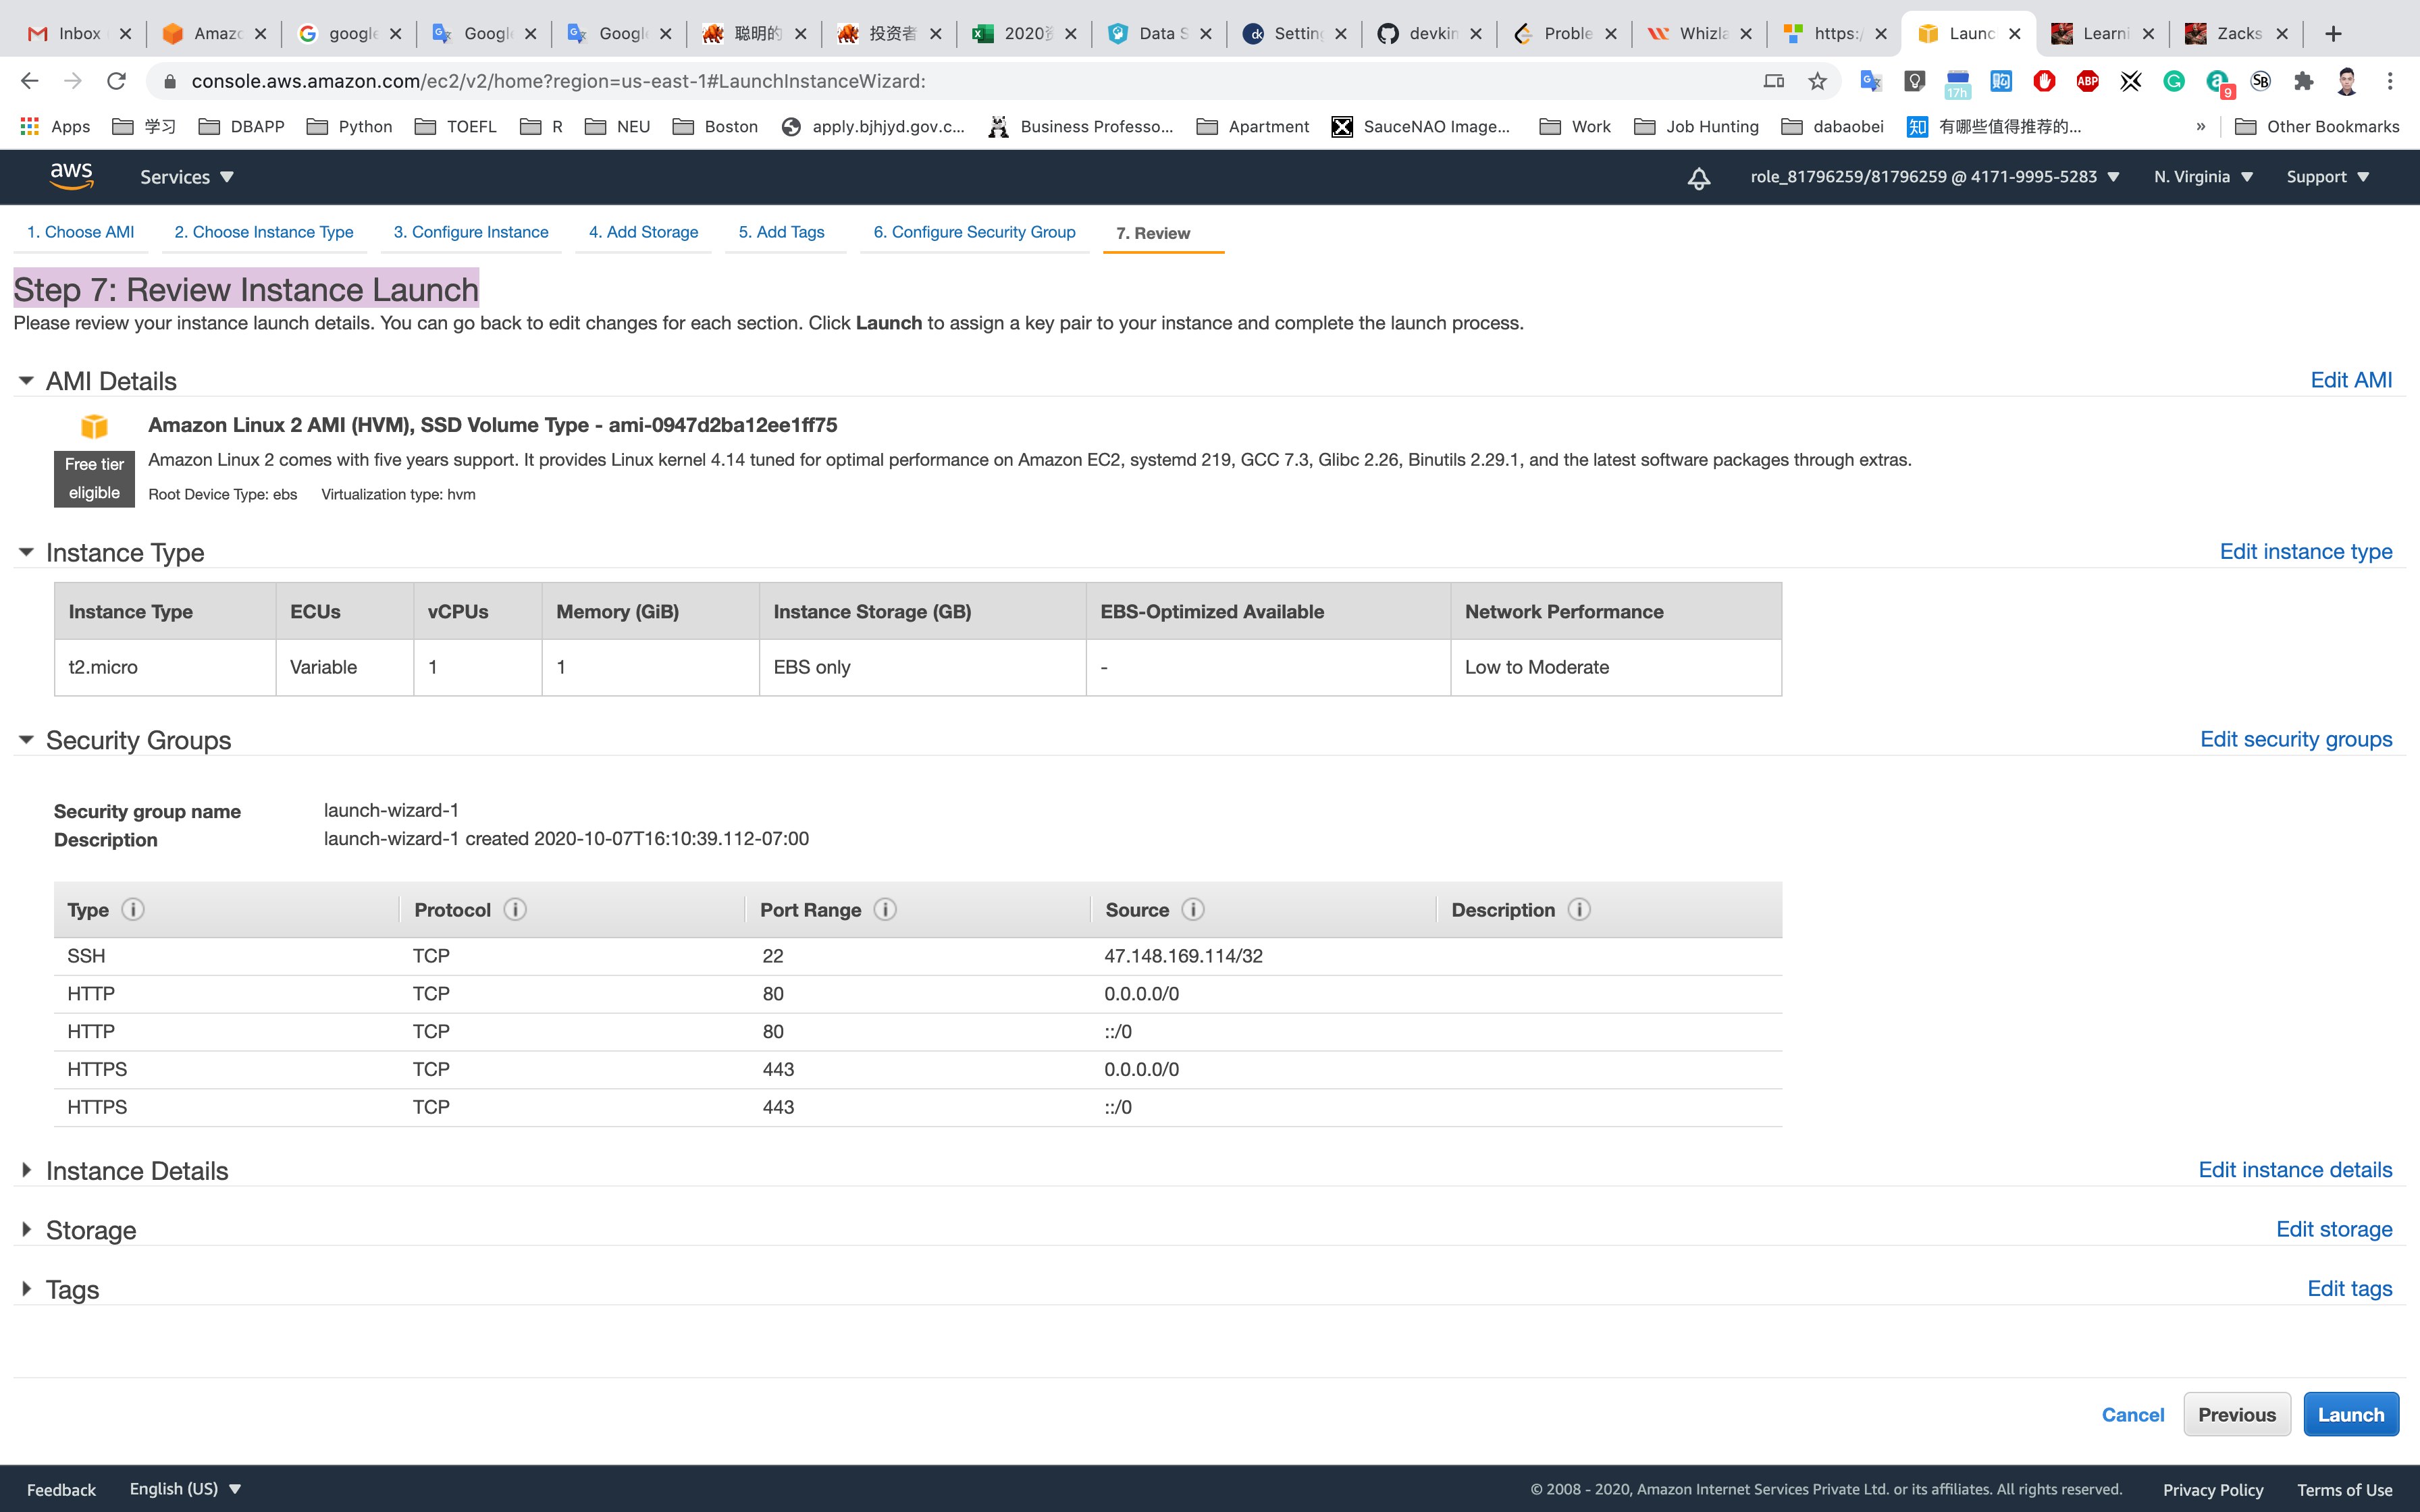
Select Create a new key pair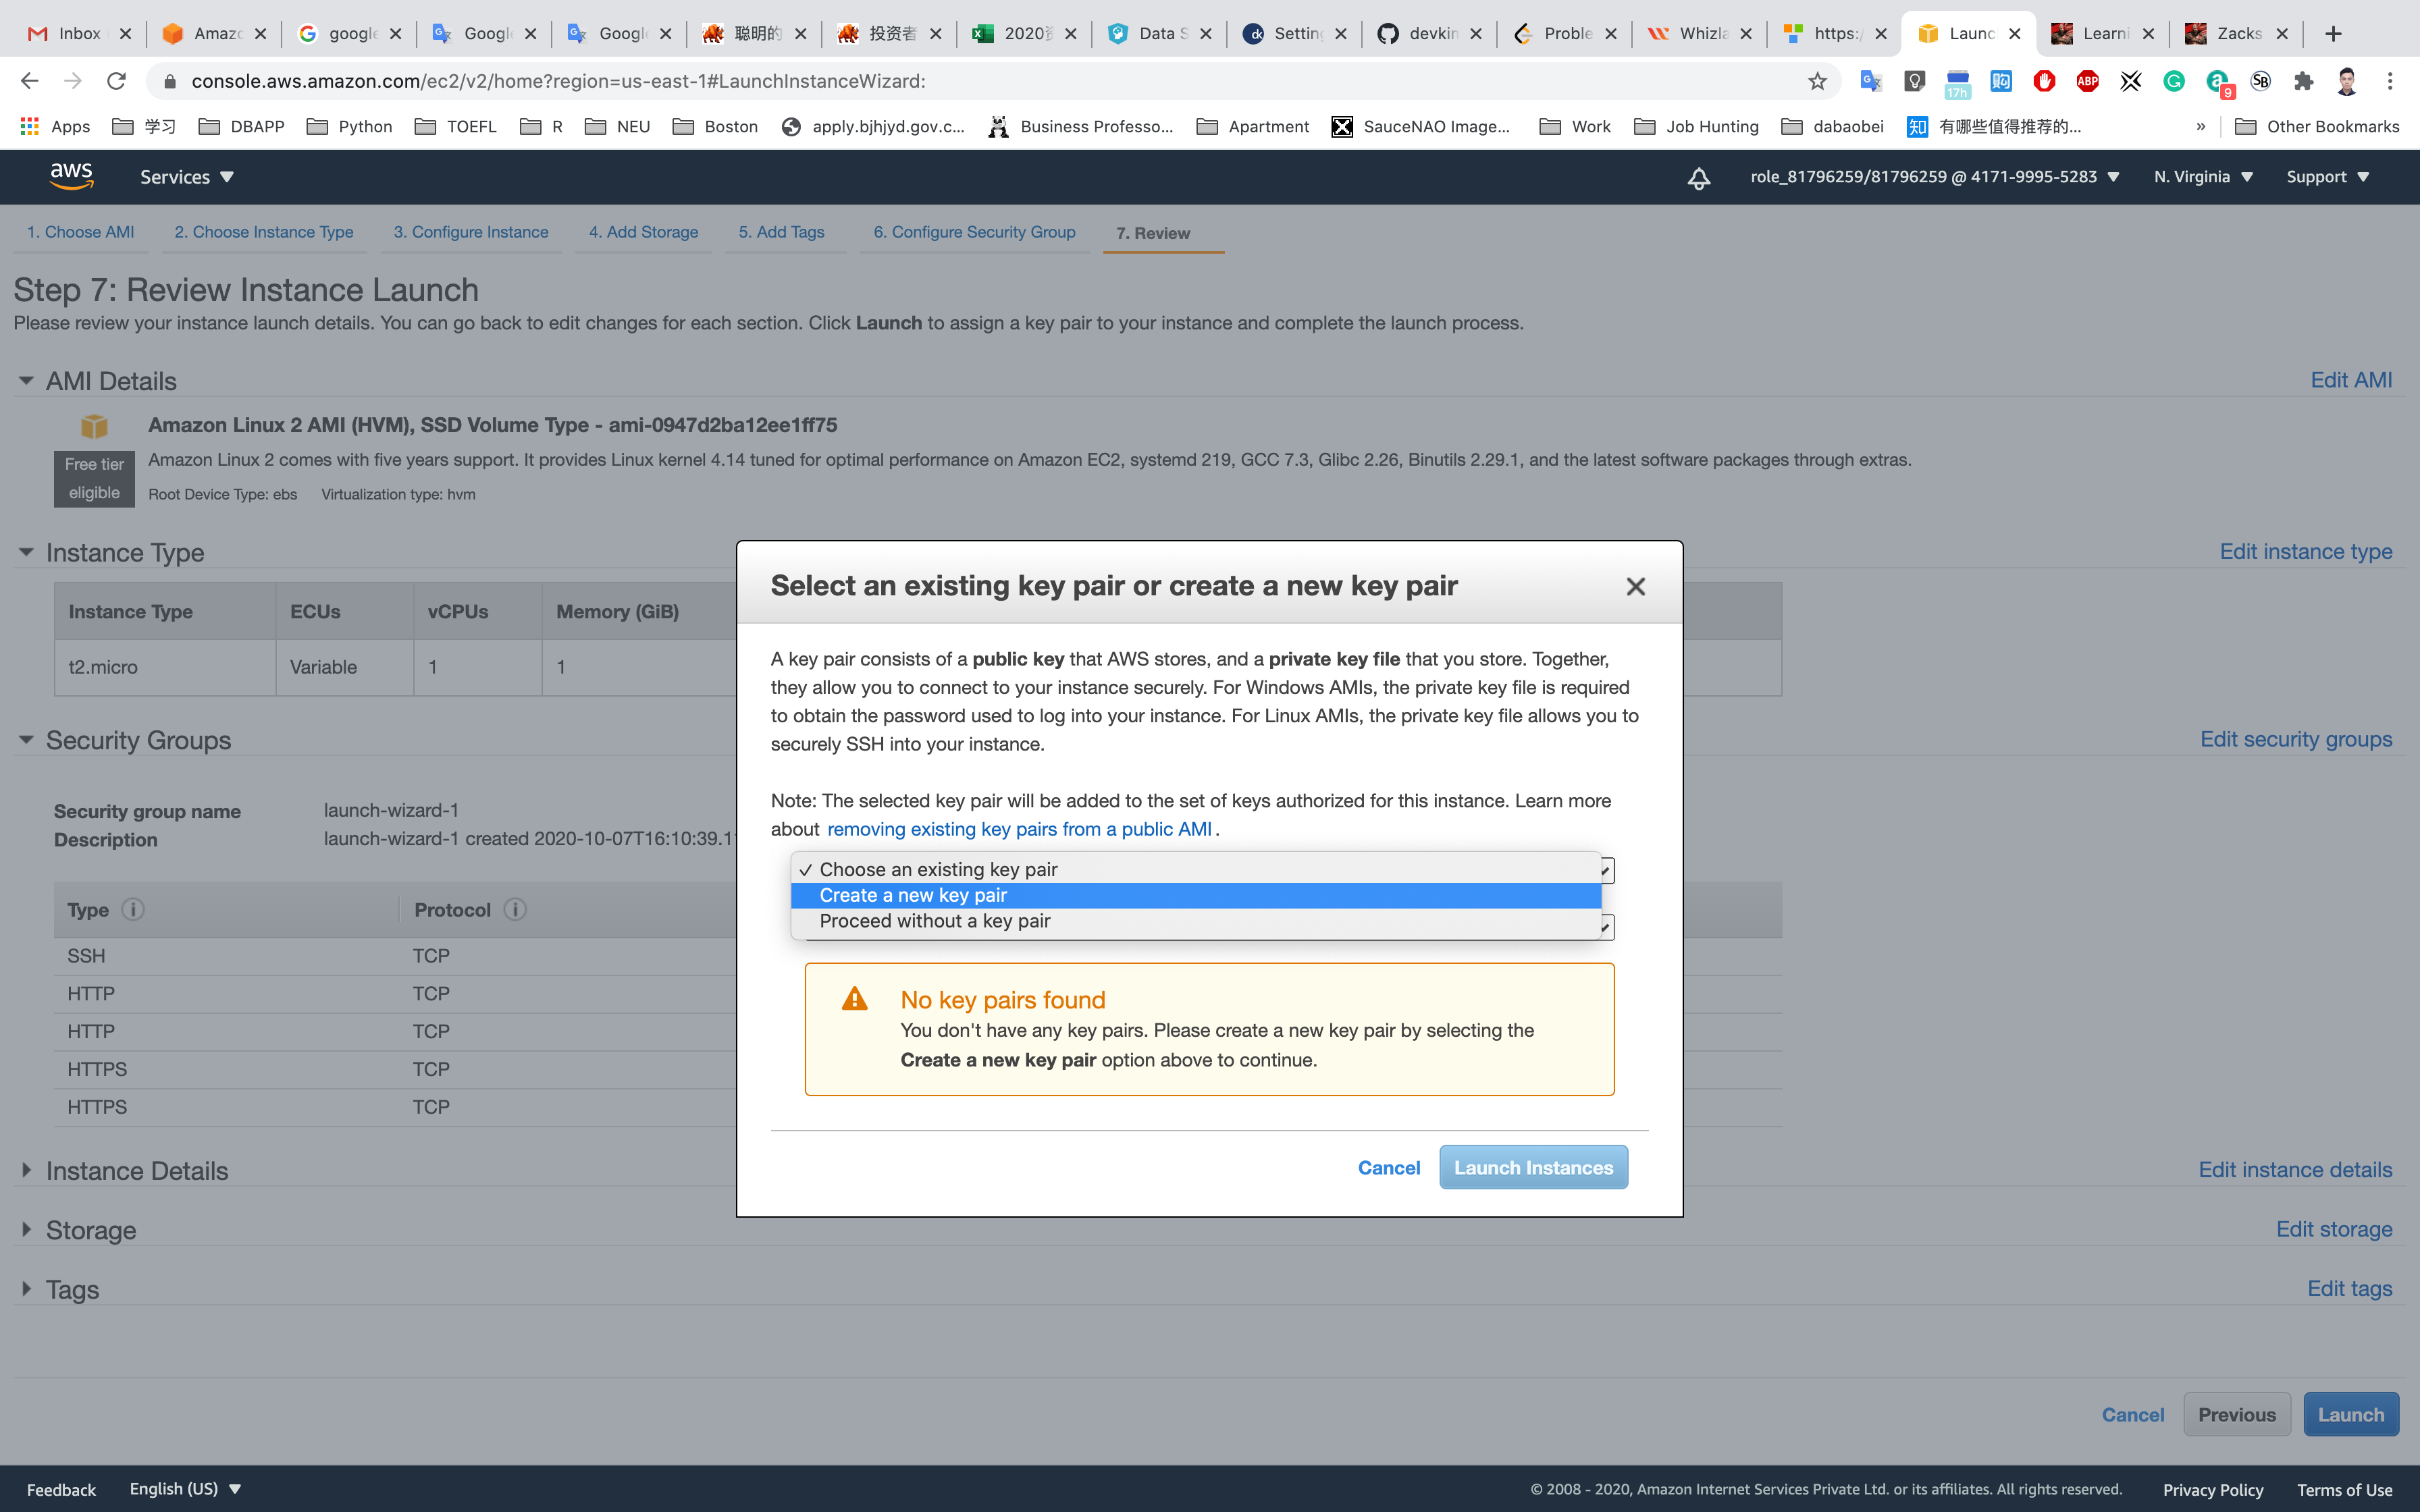
Set up the key pair name ec2
Click on Download Key Pair
See the left bottom of the screenshot, we have the file named ec2.pem
Click on Launch Instances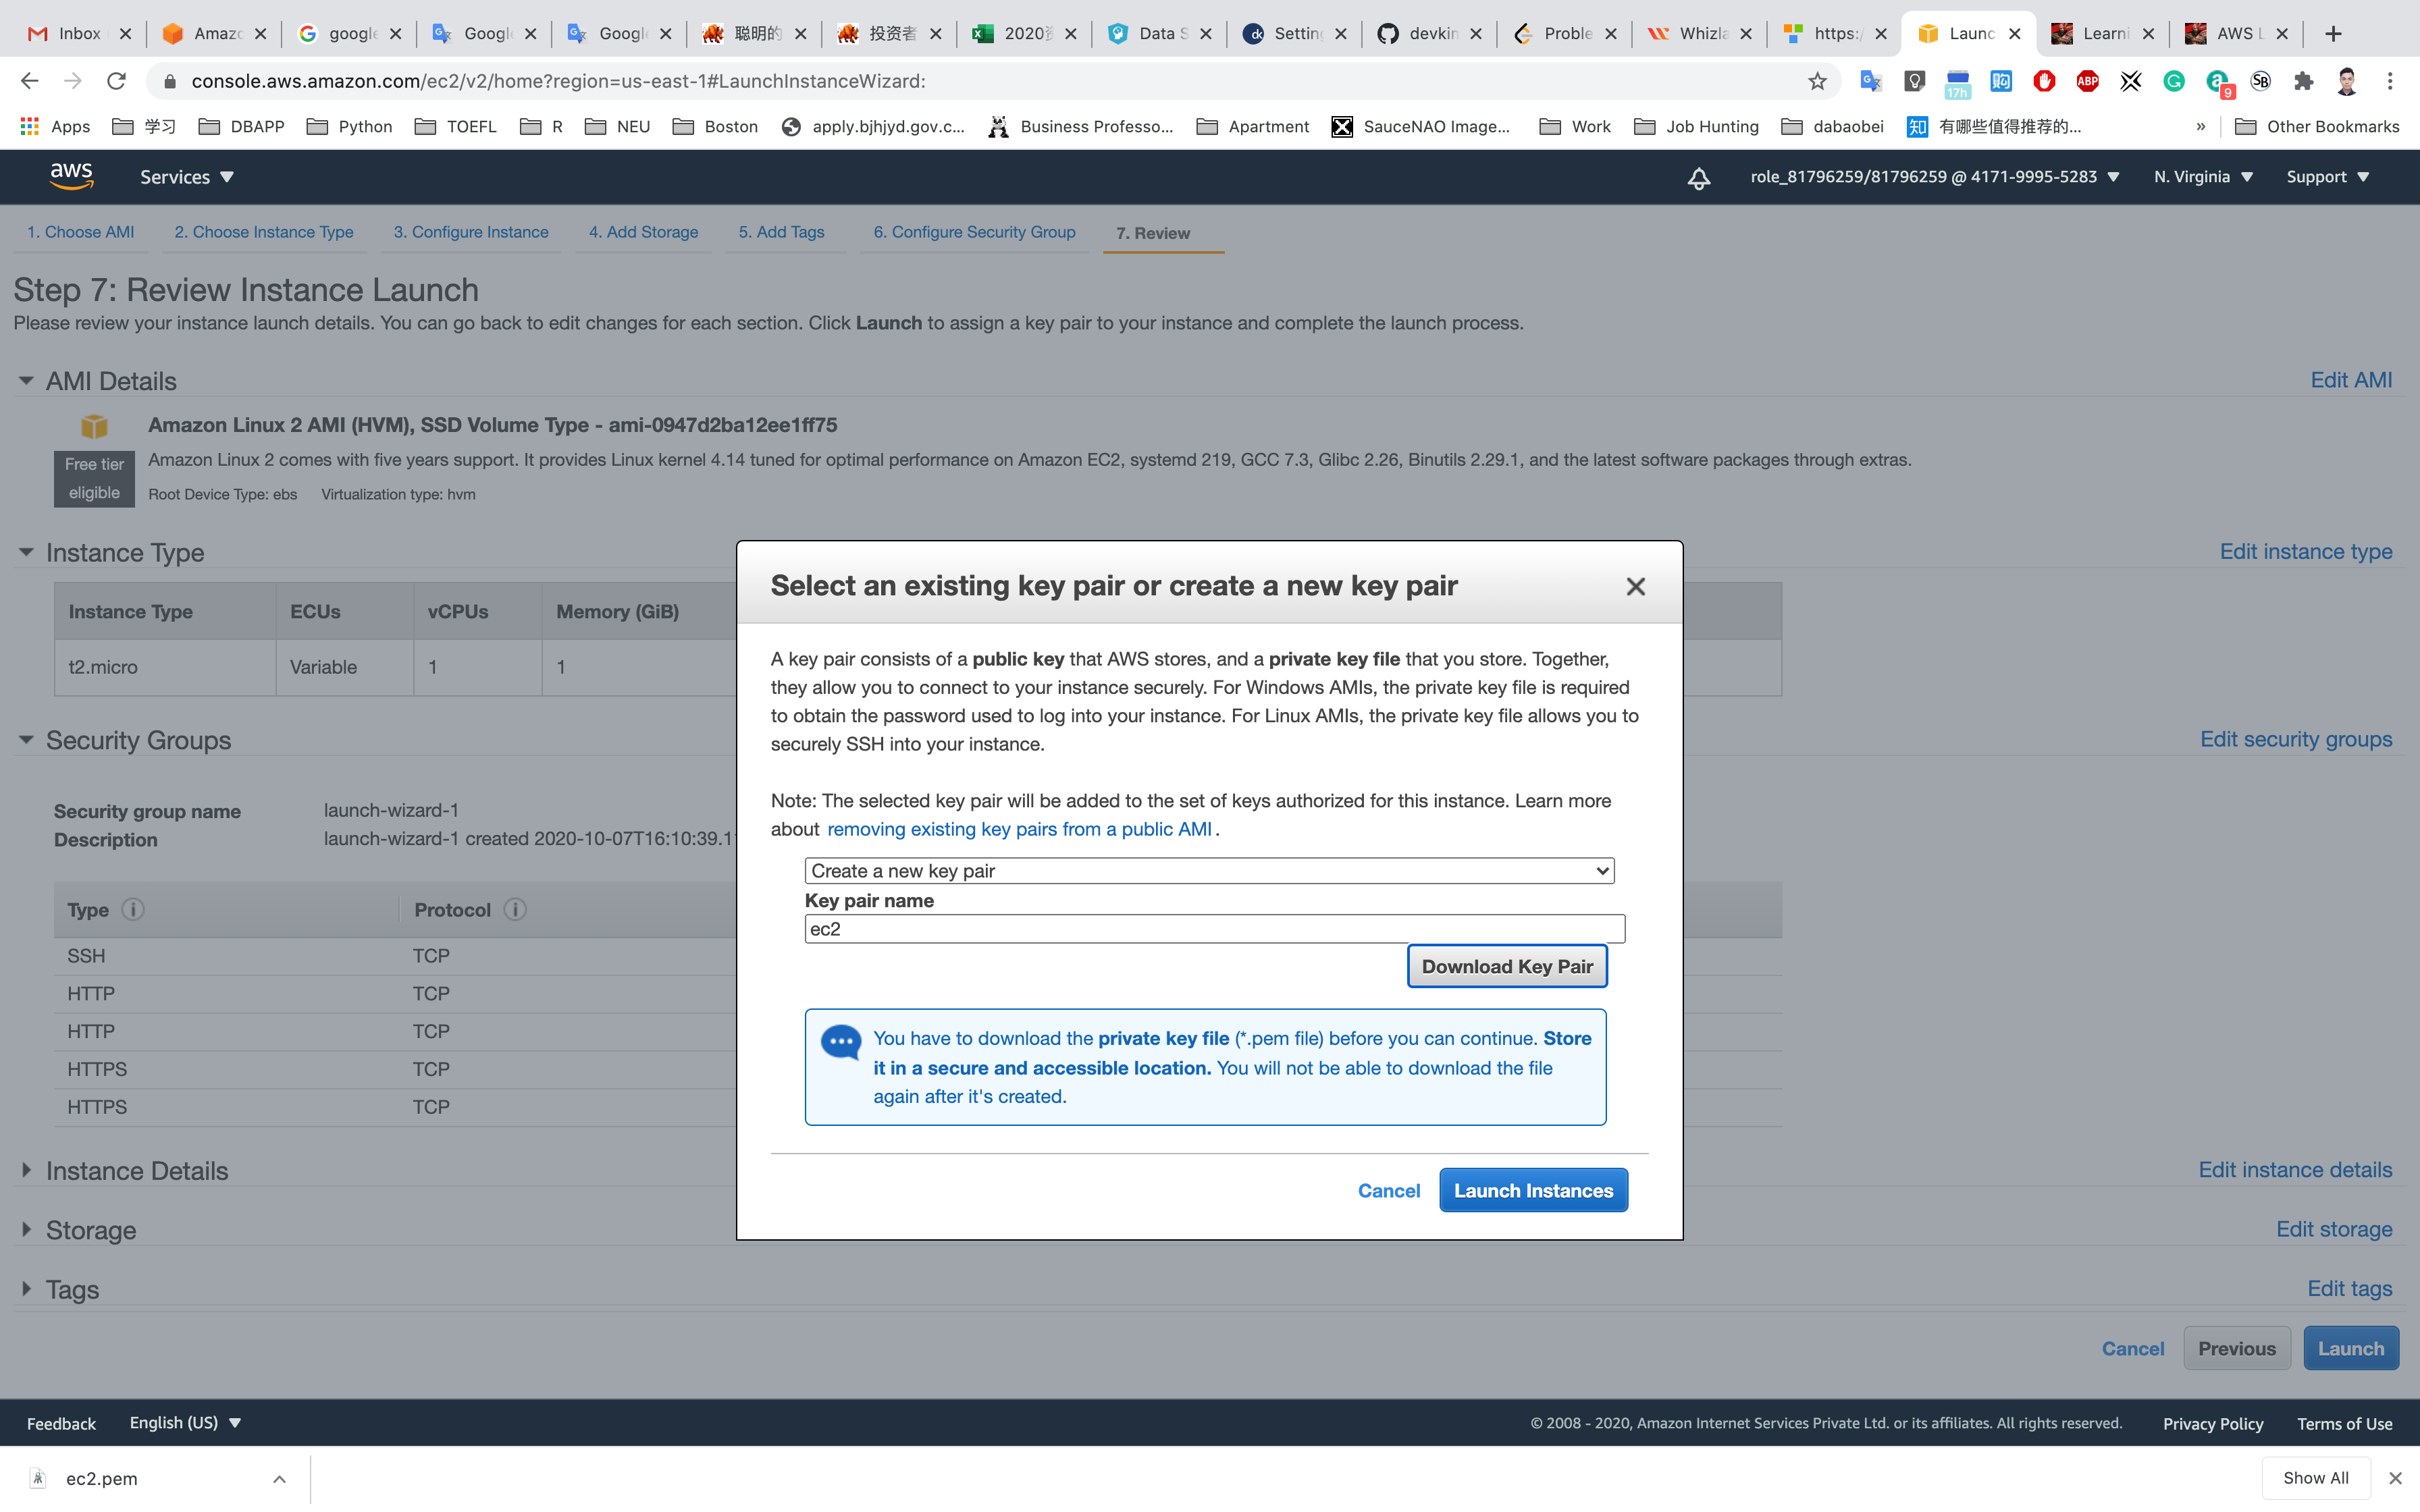
Click on View Instances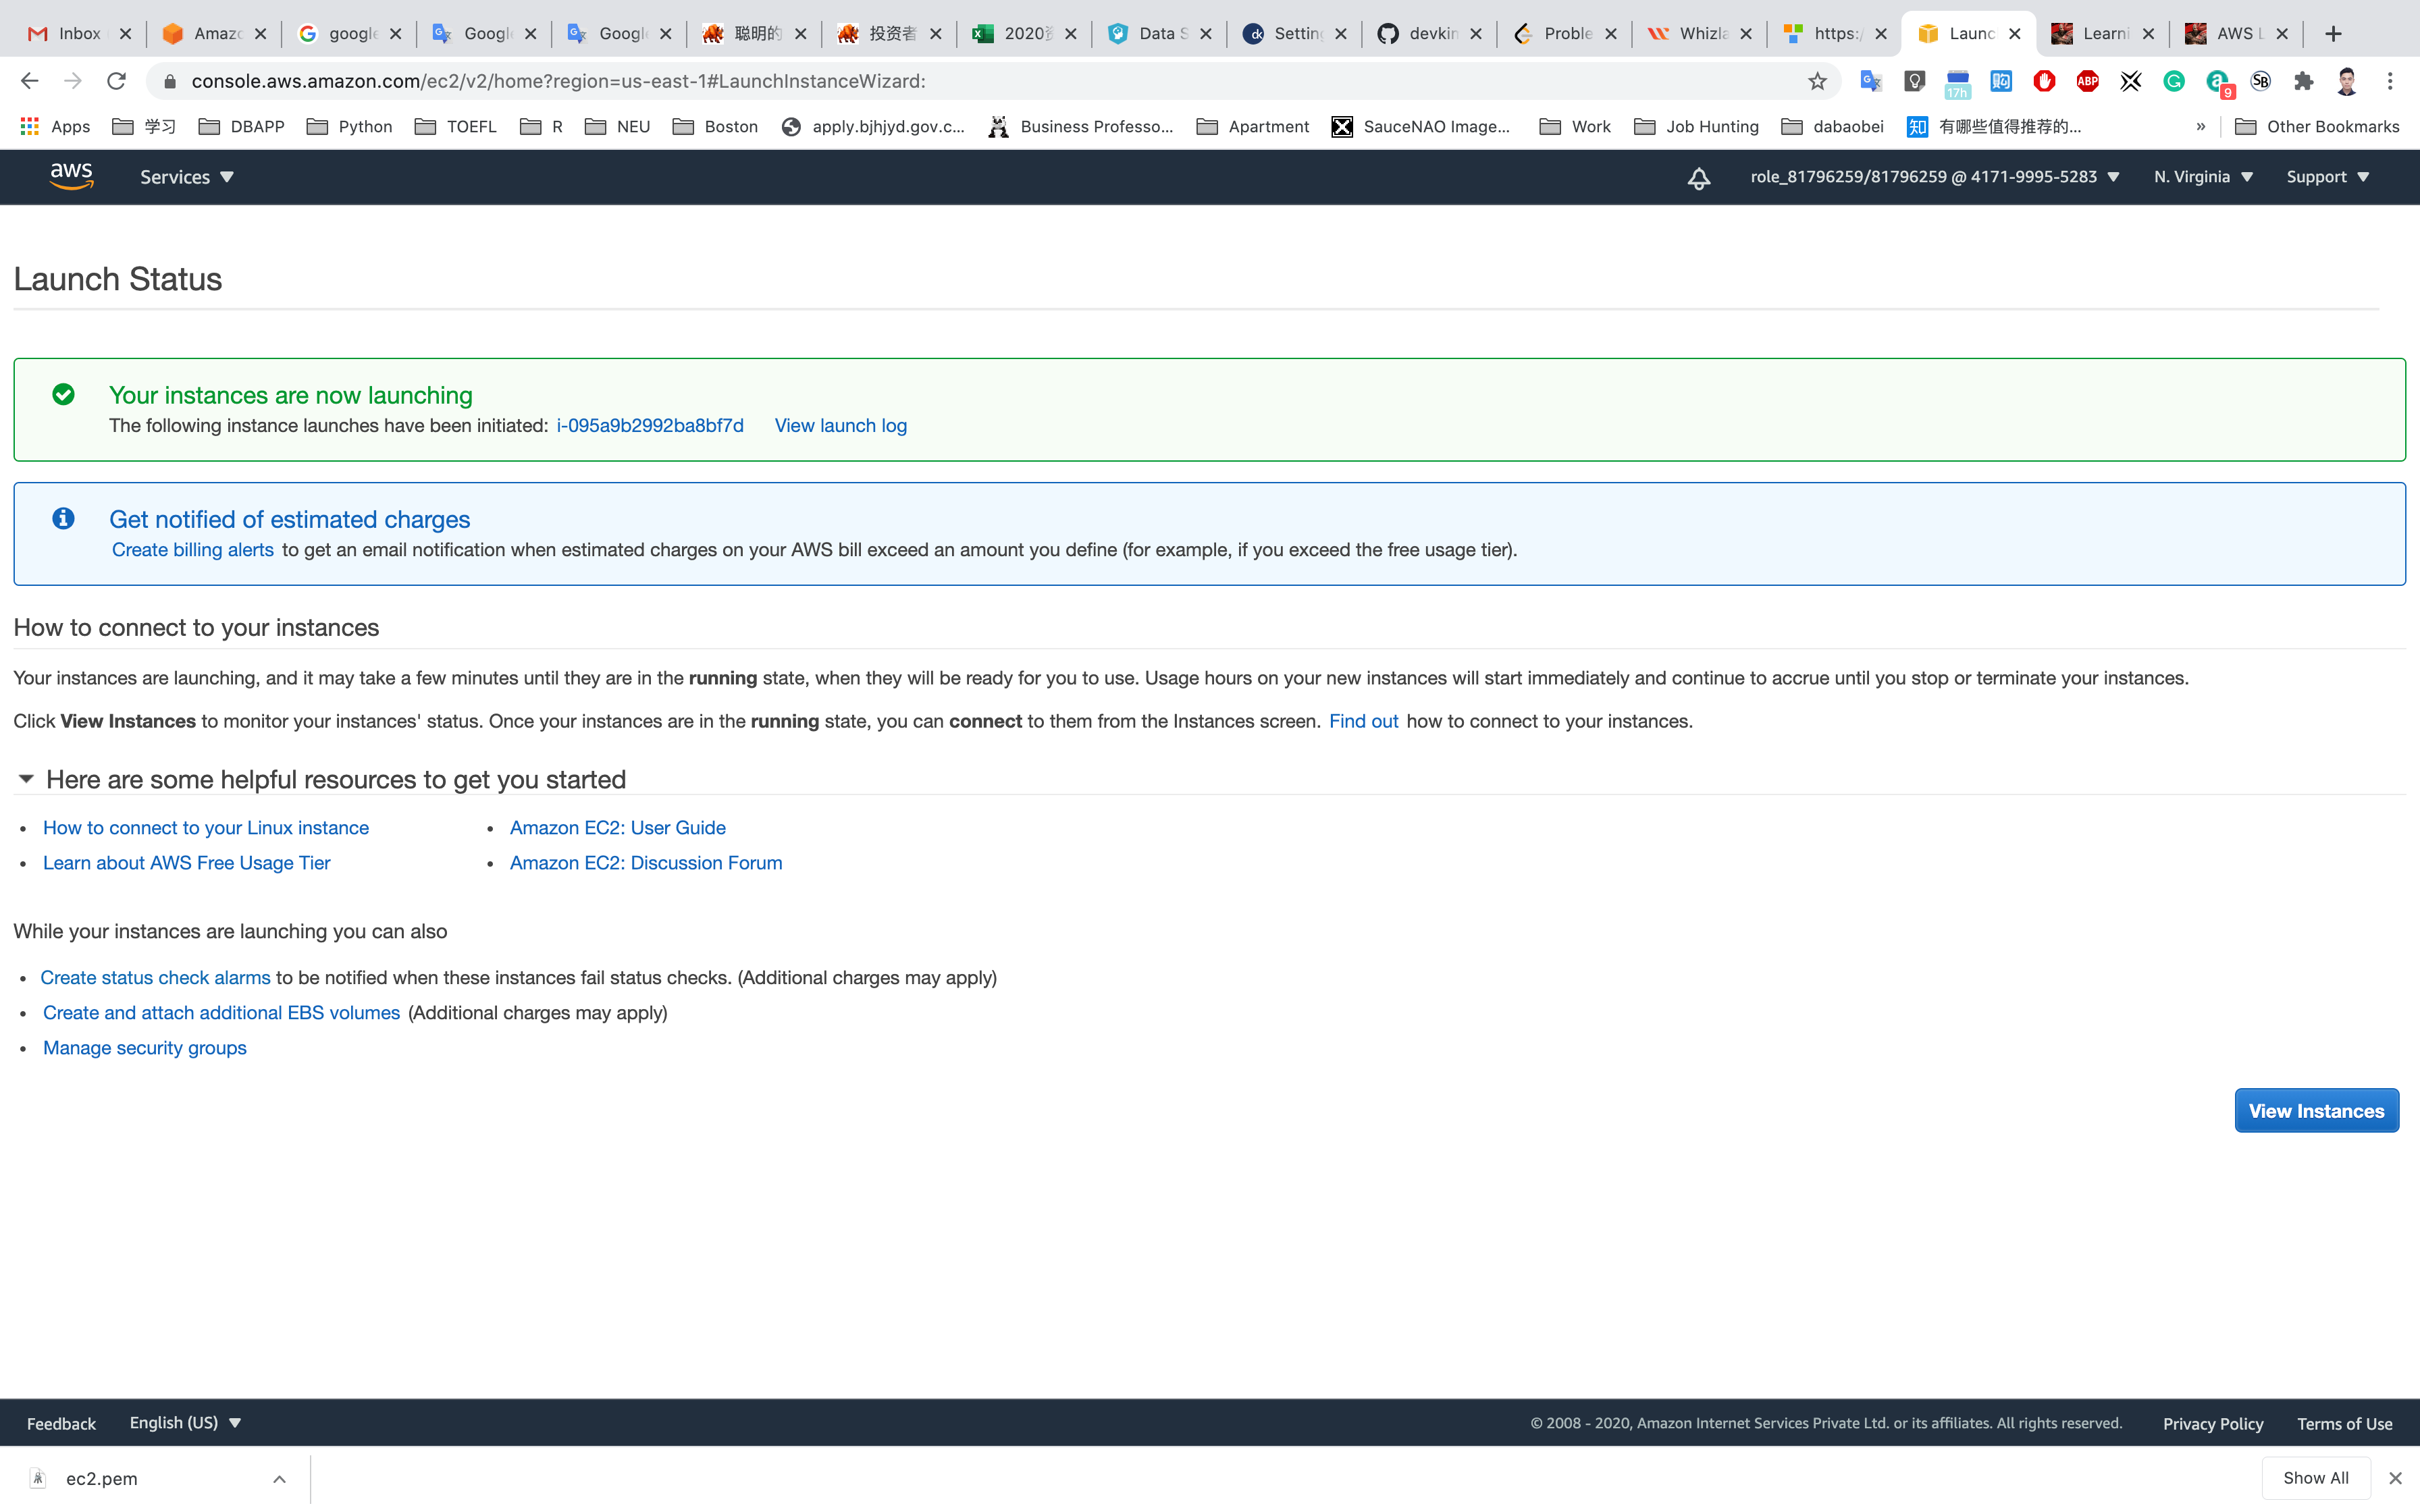
Waiting until the Instance state switch to Running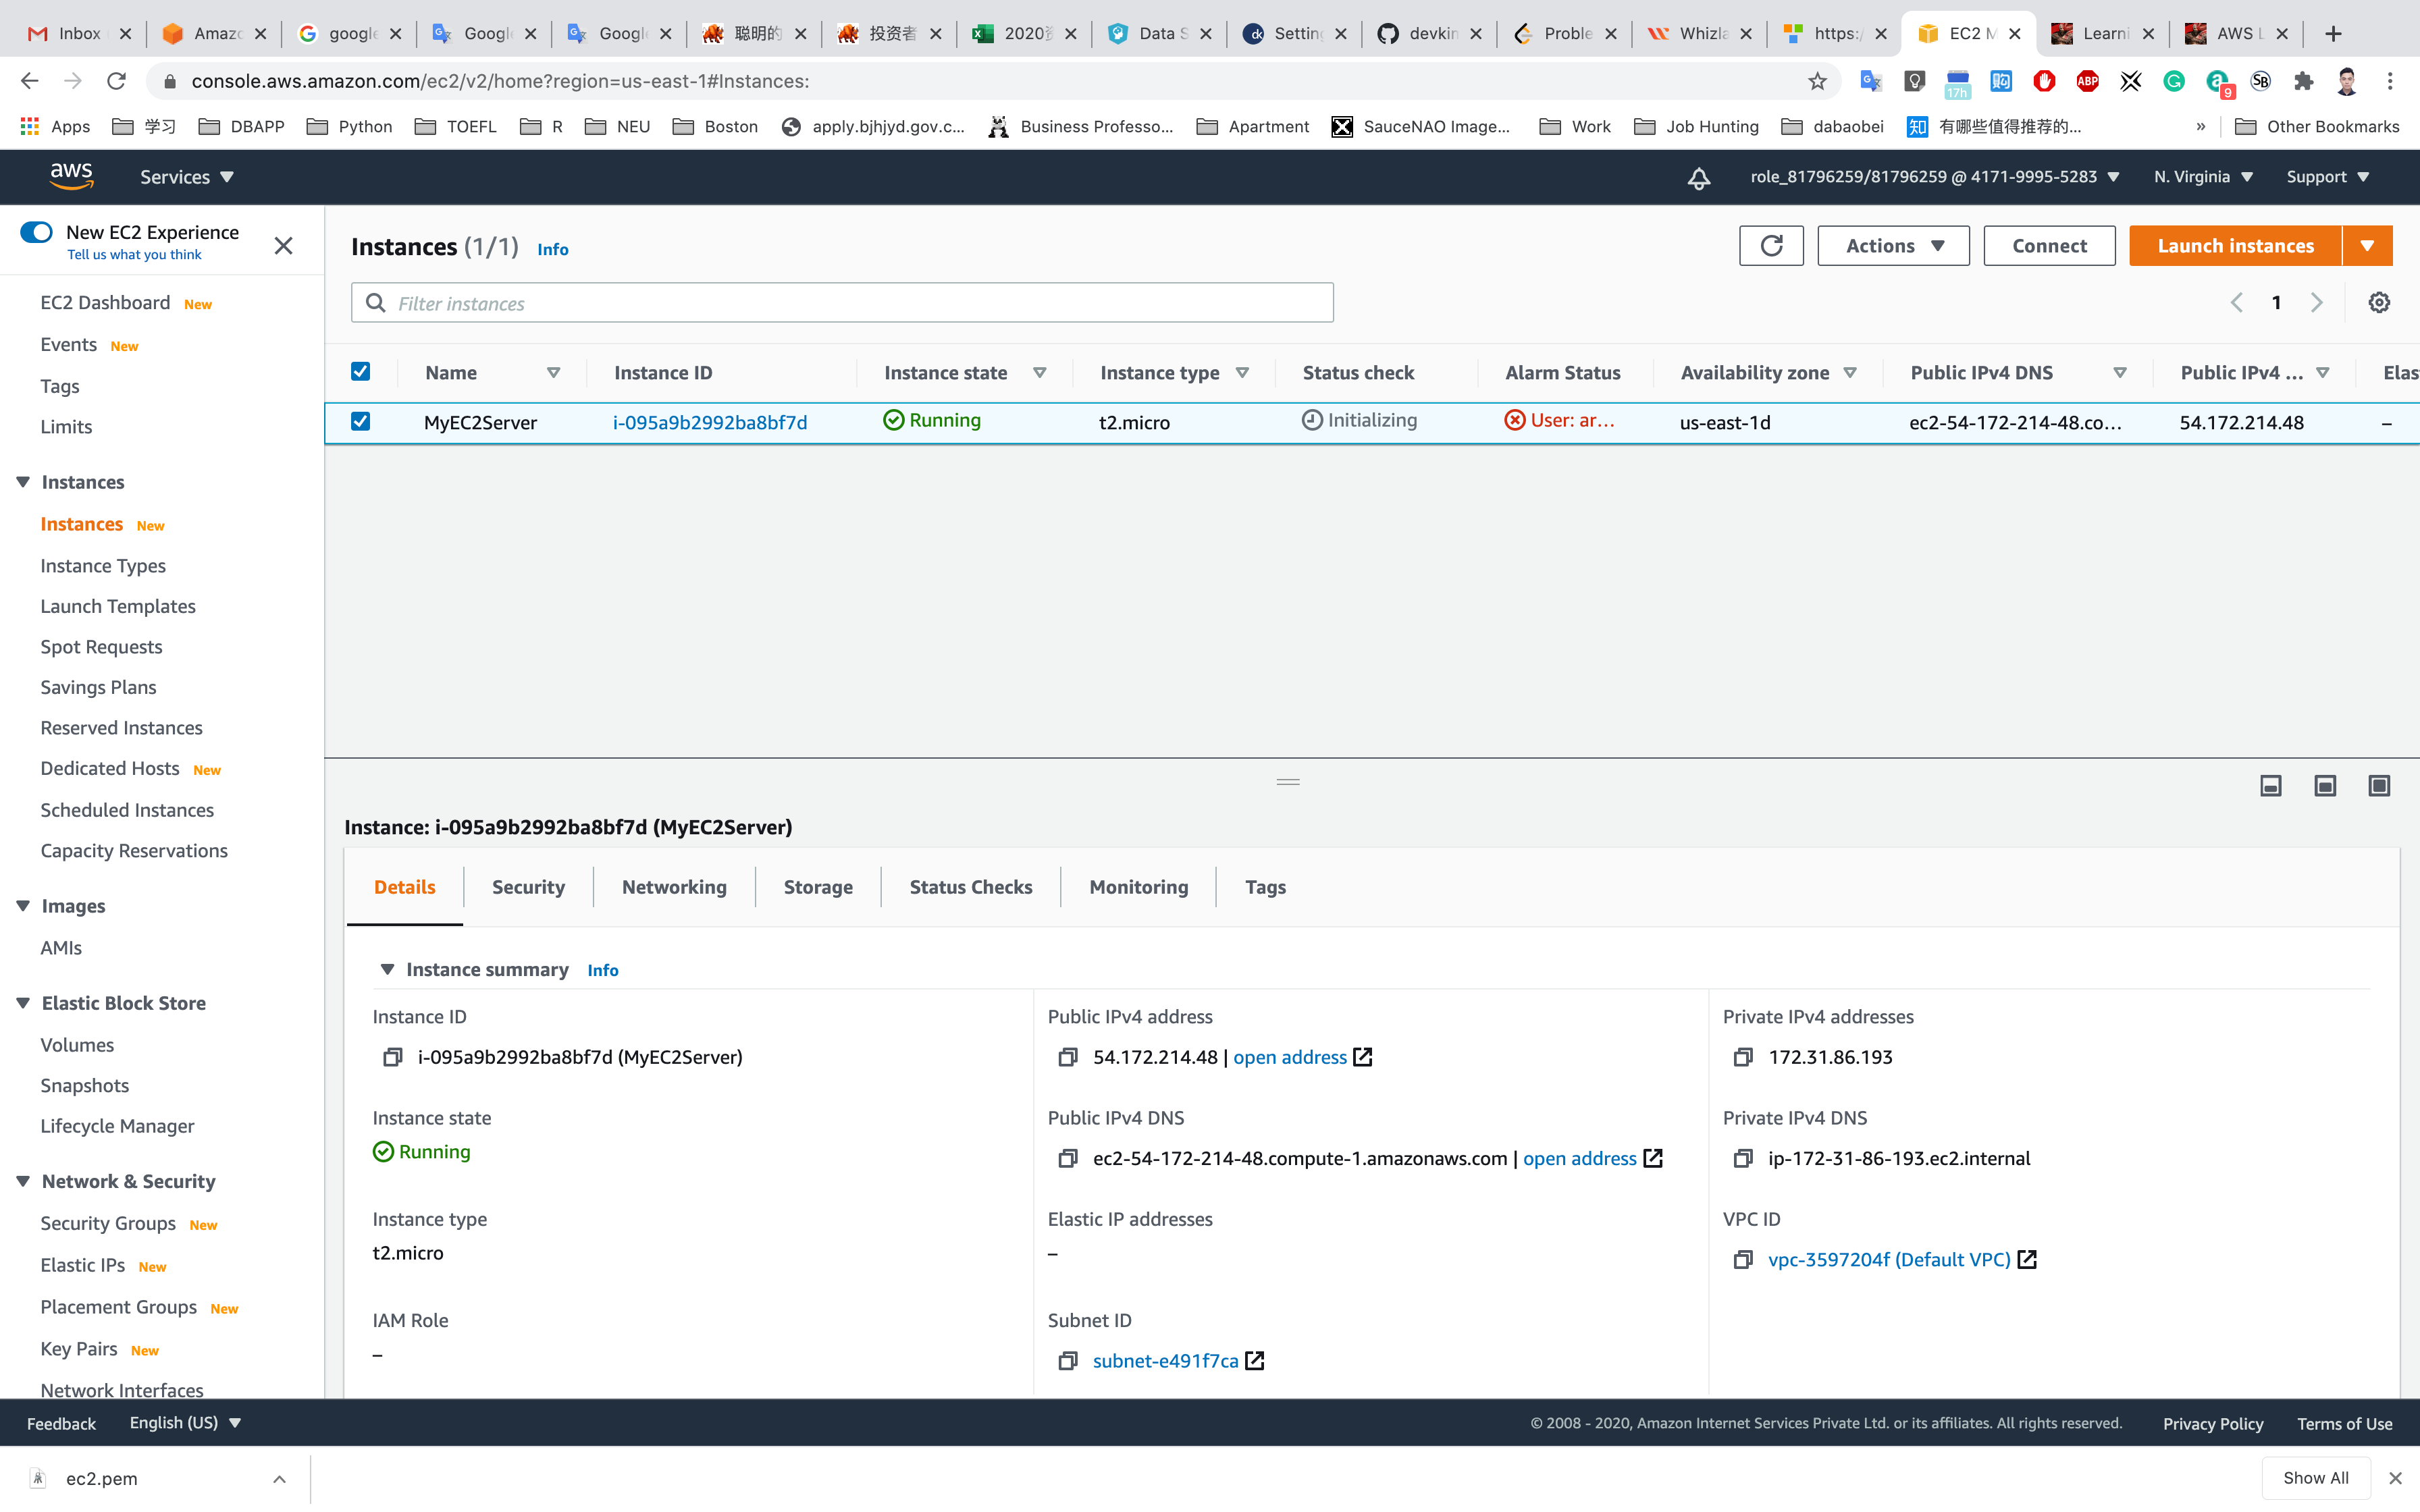
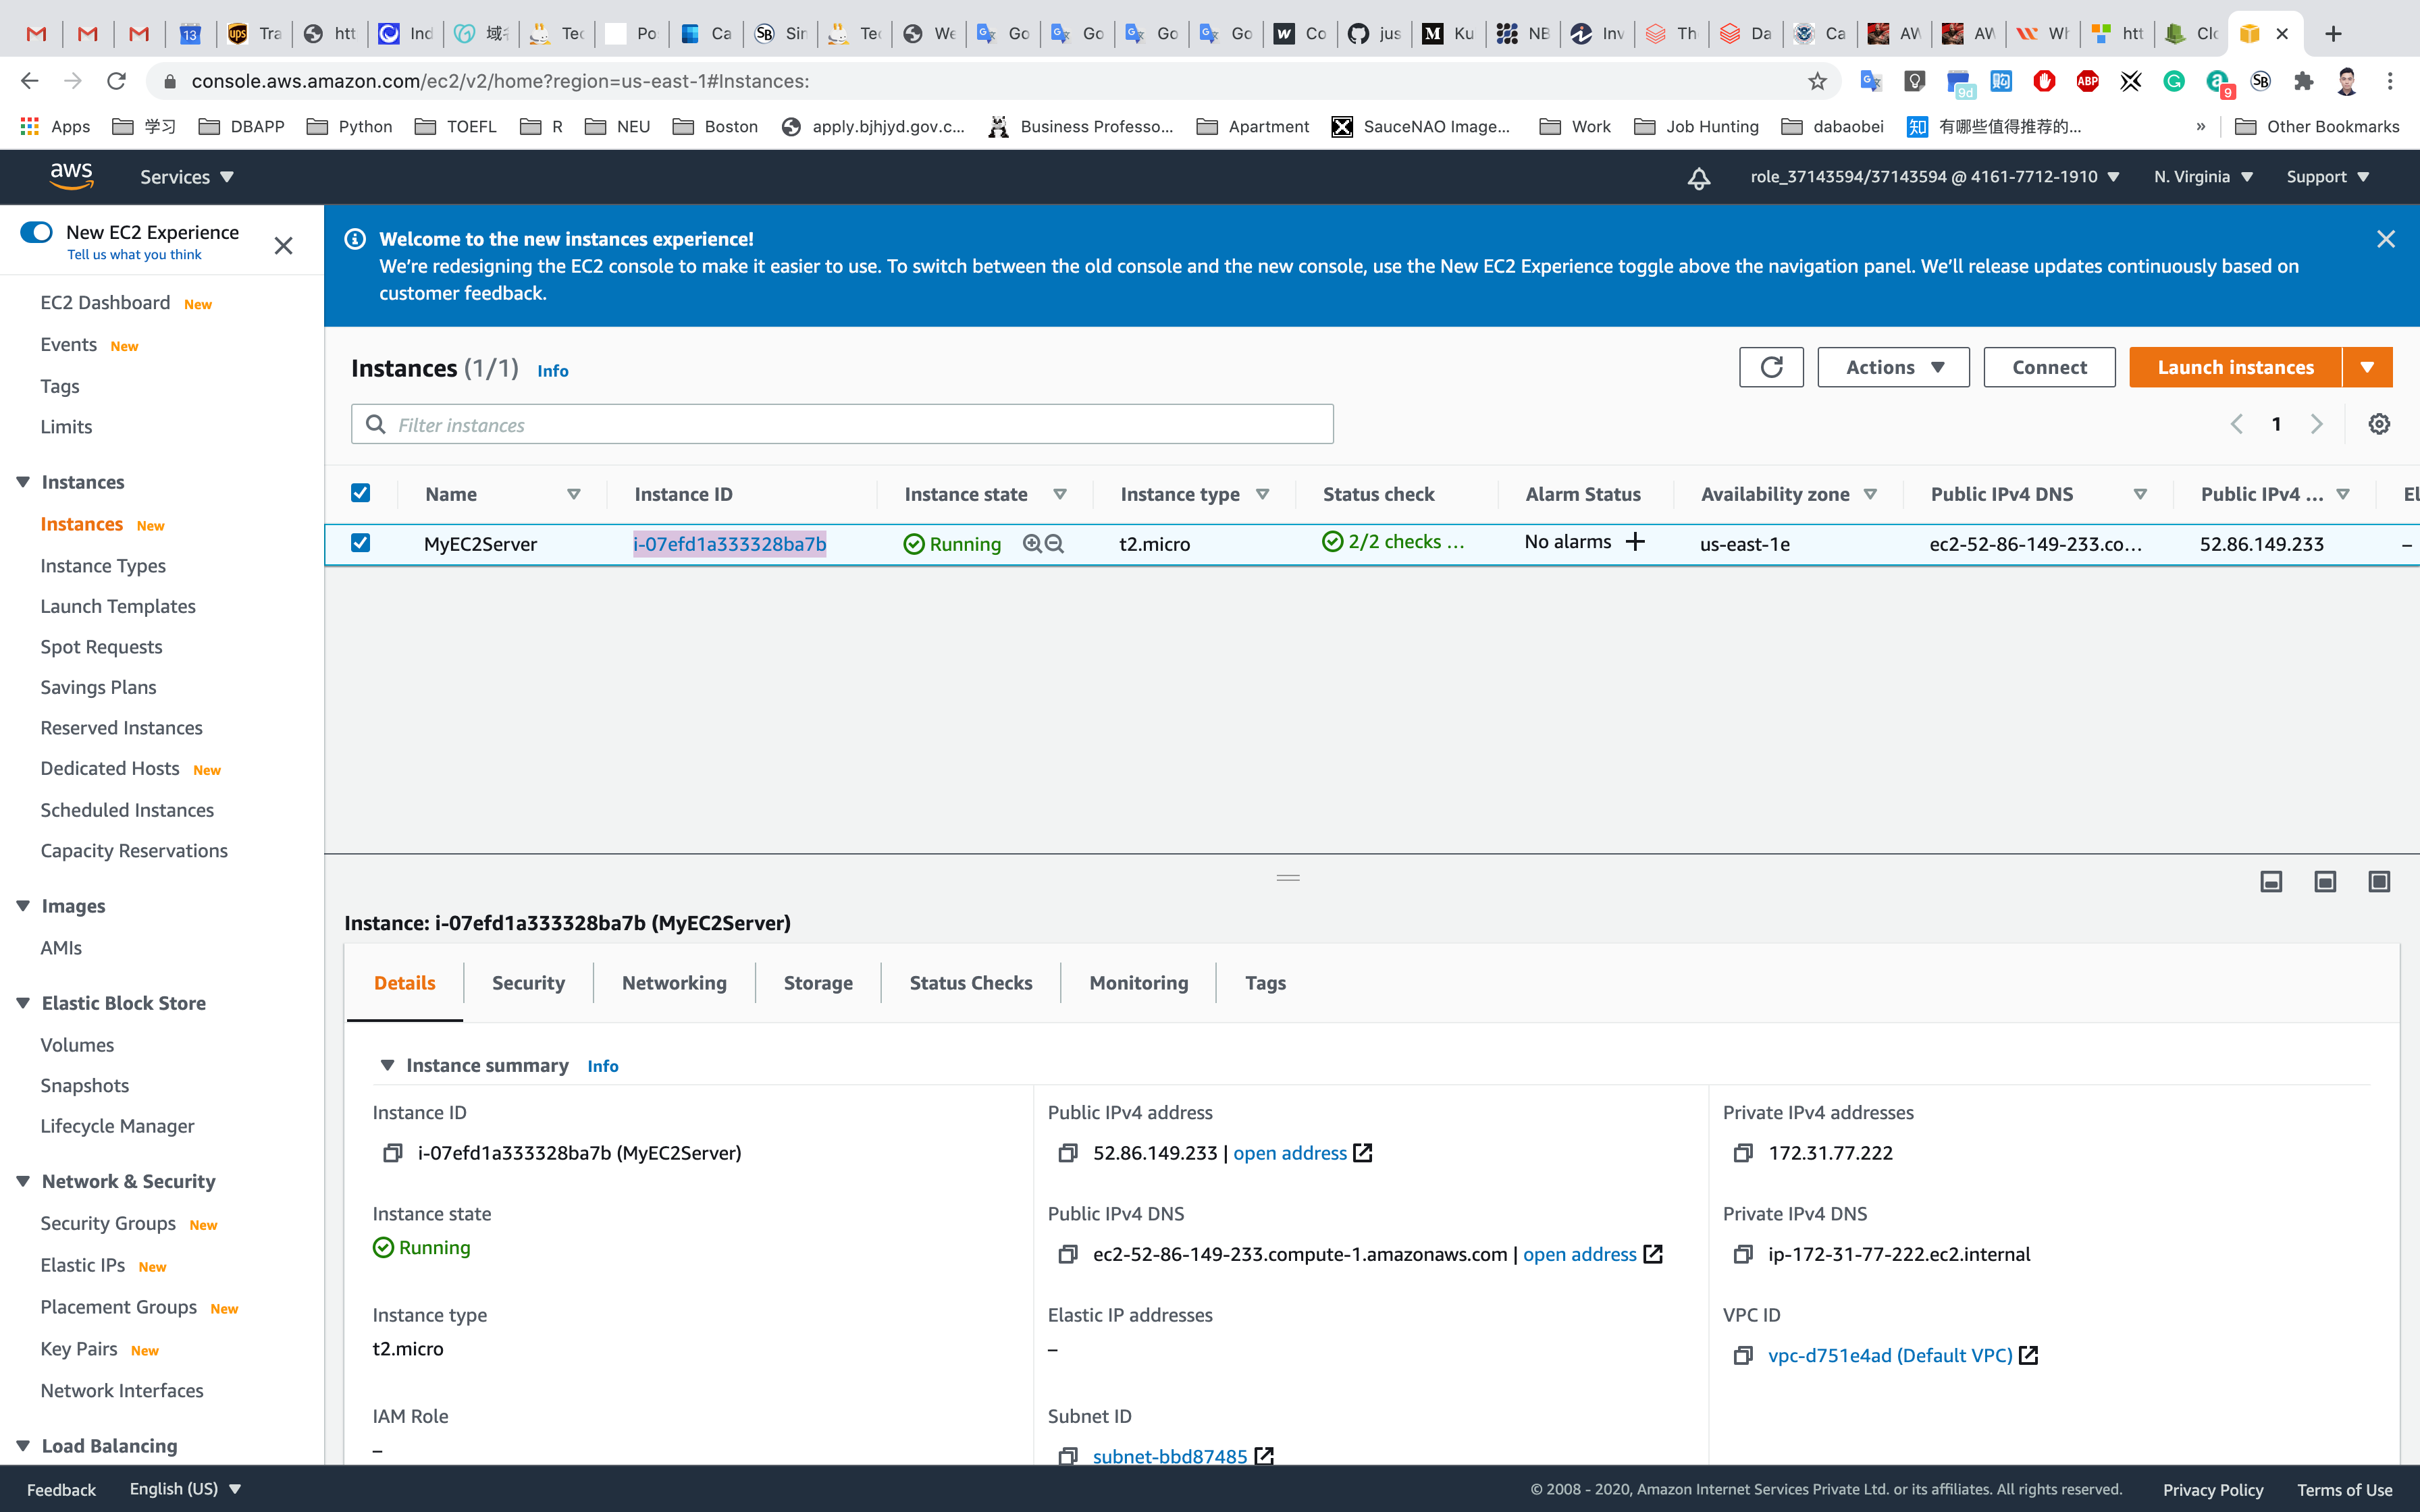
You can Click on Instance ID like i-095a9b2992ba8bf7d to see the instance detail.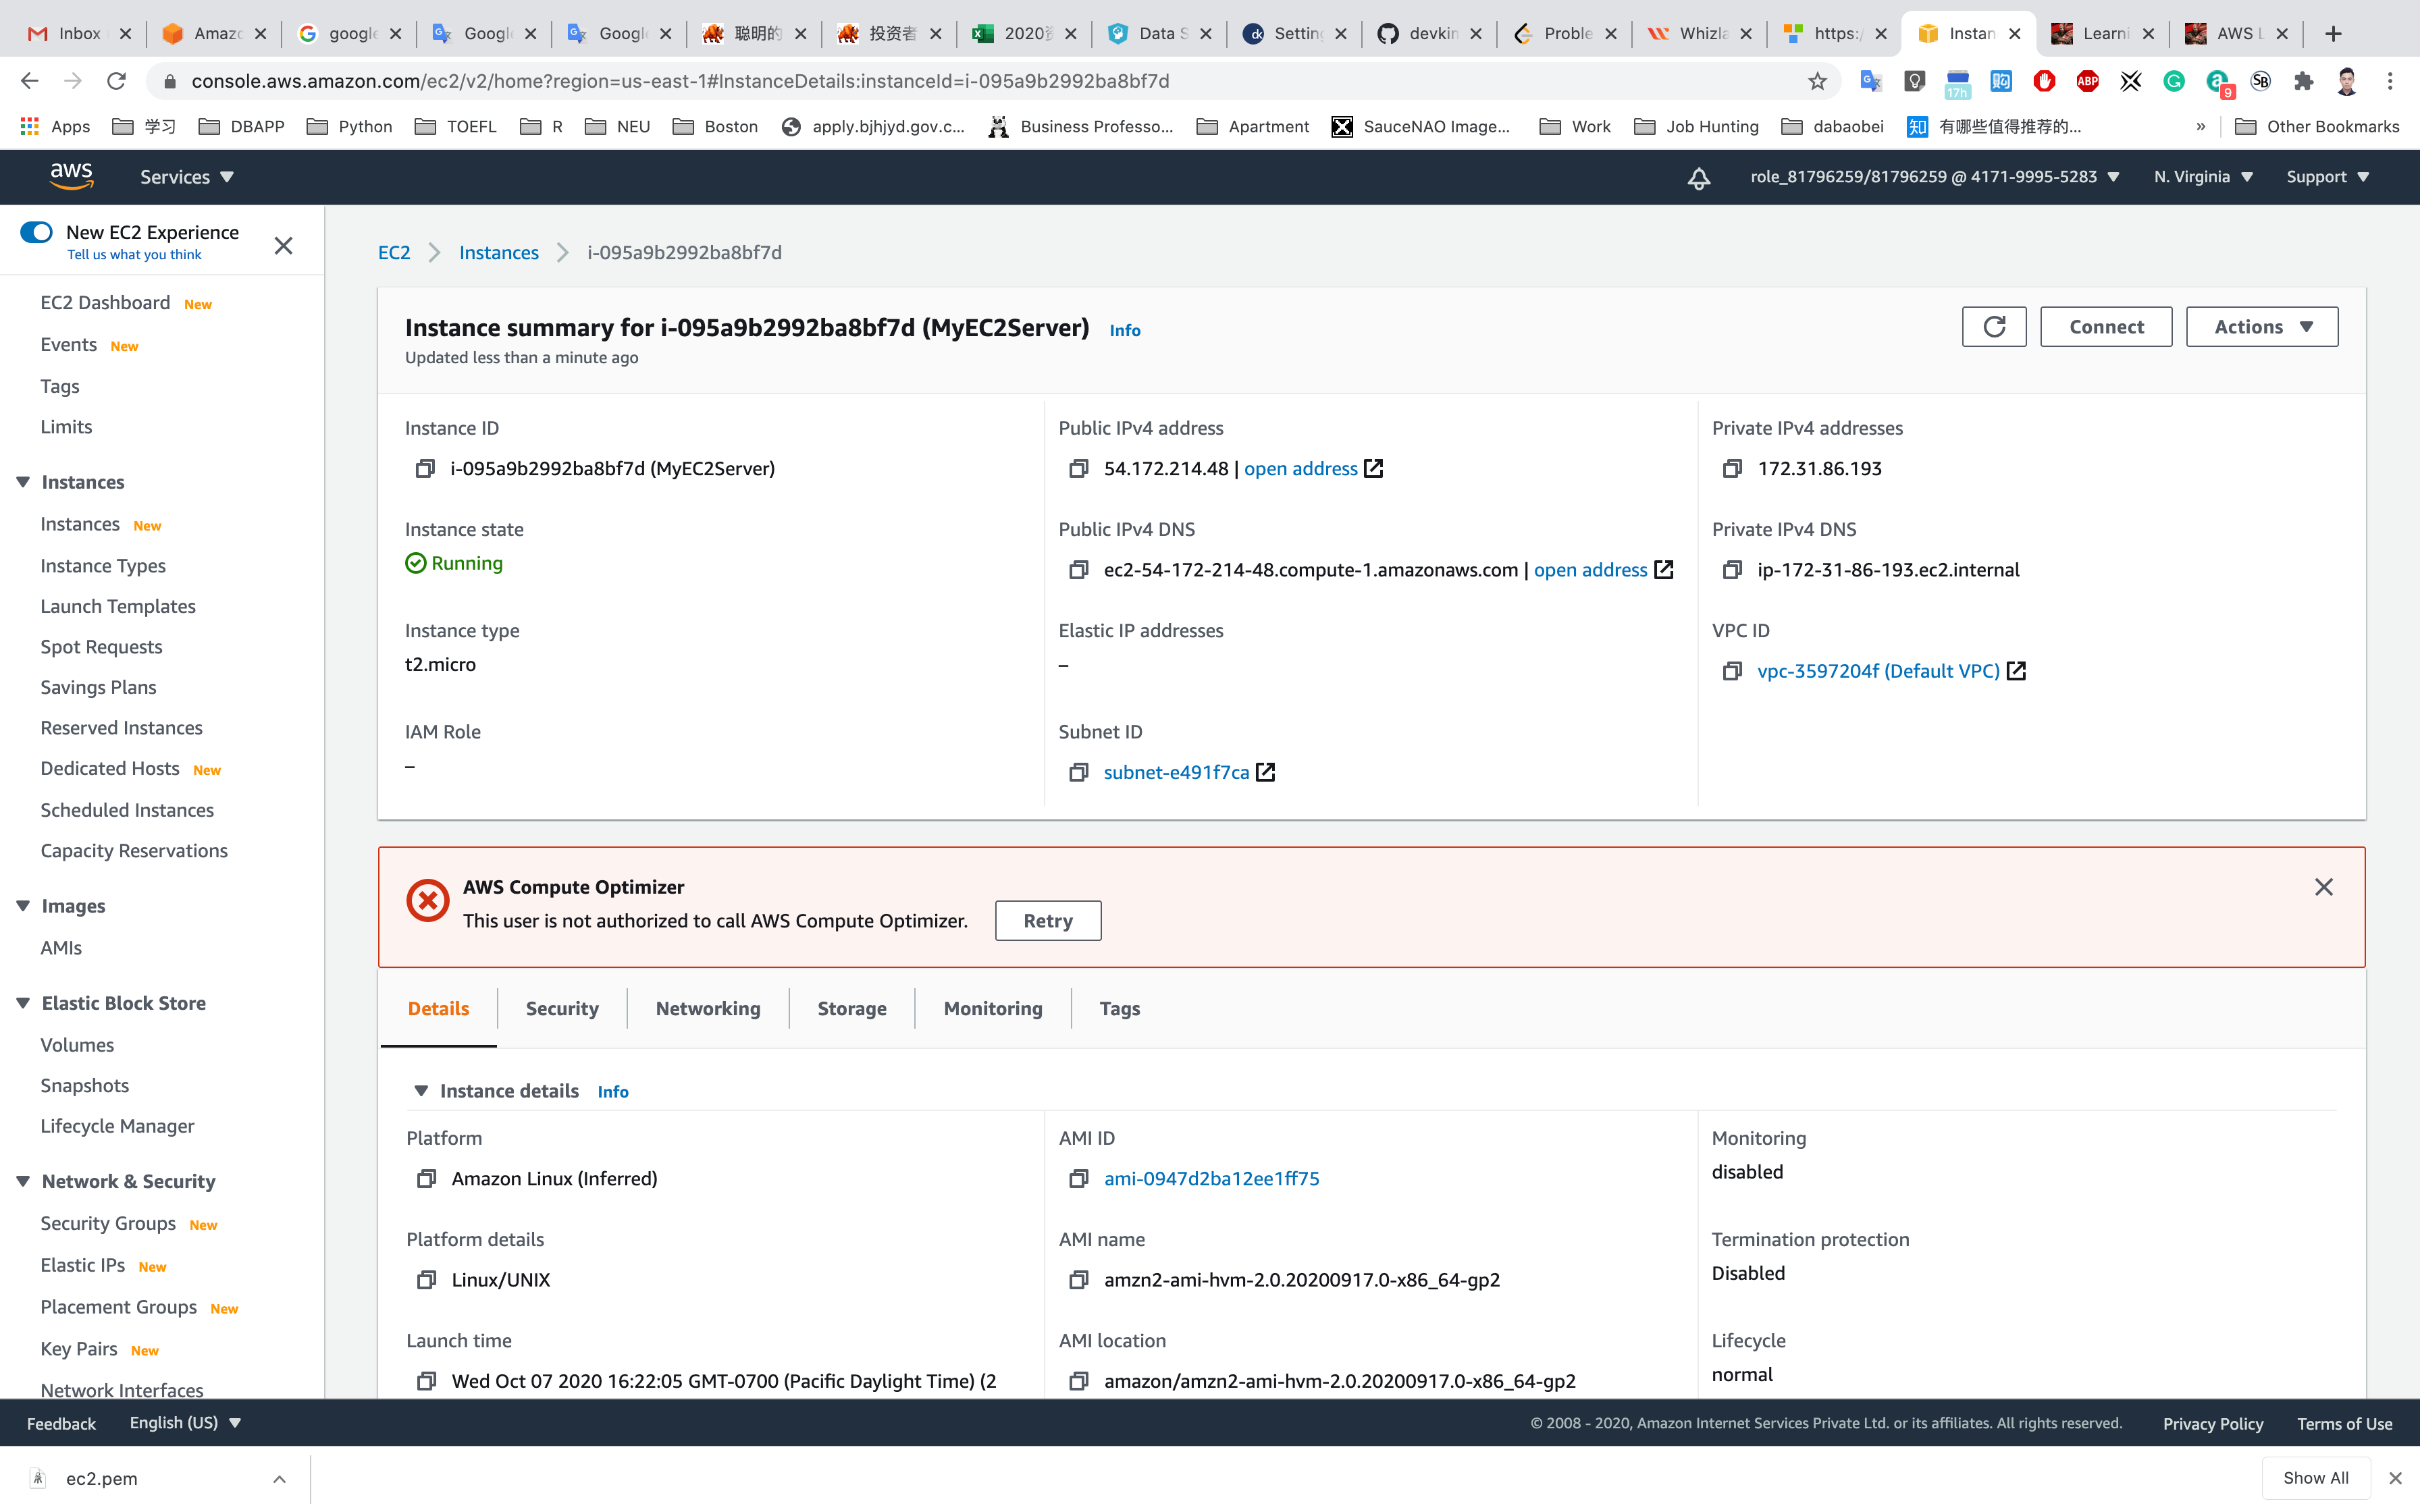
Copy the public IP address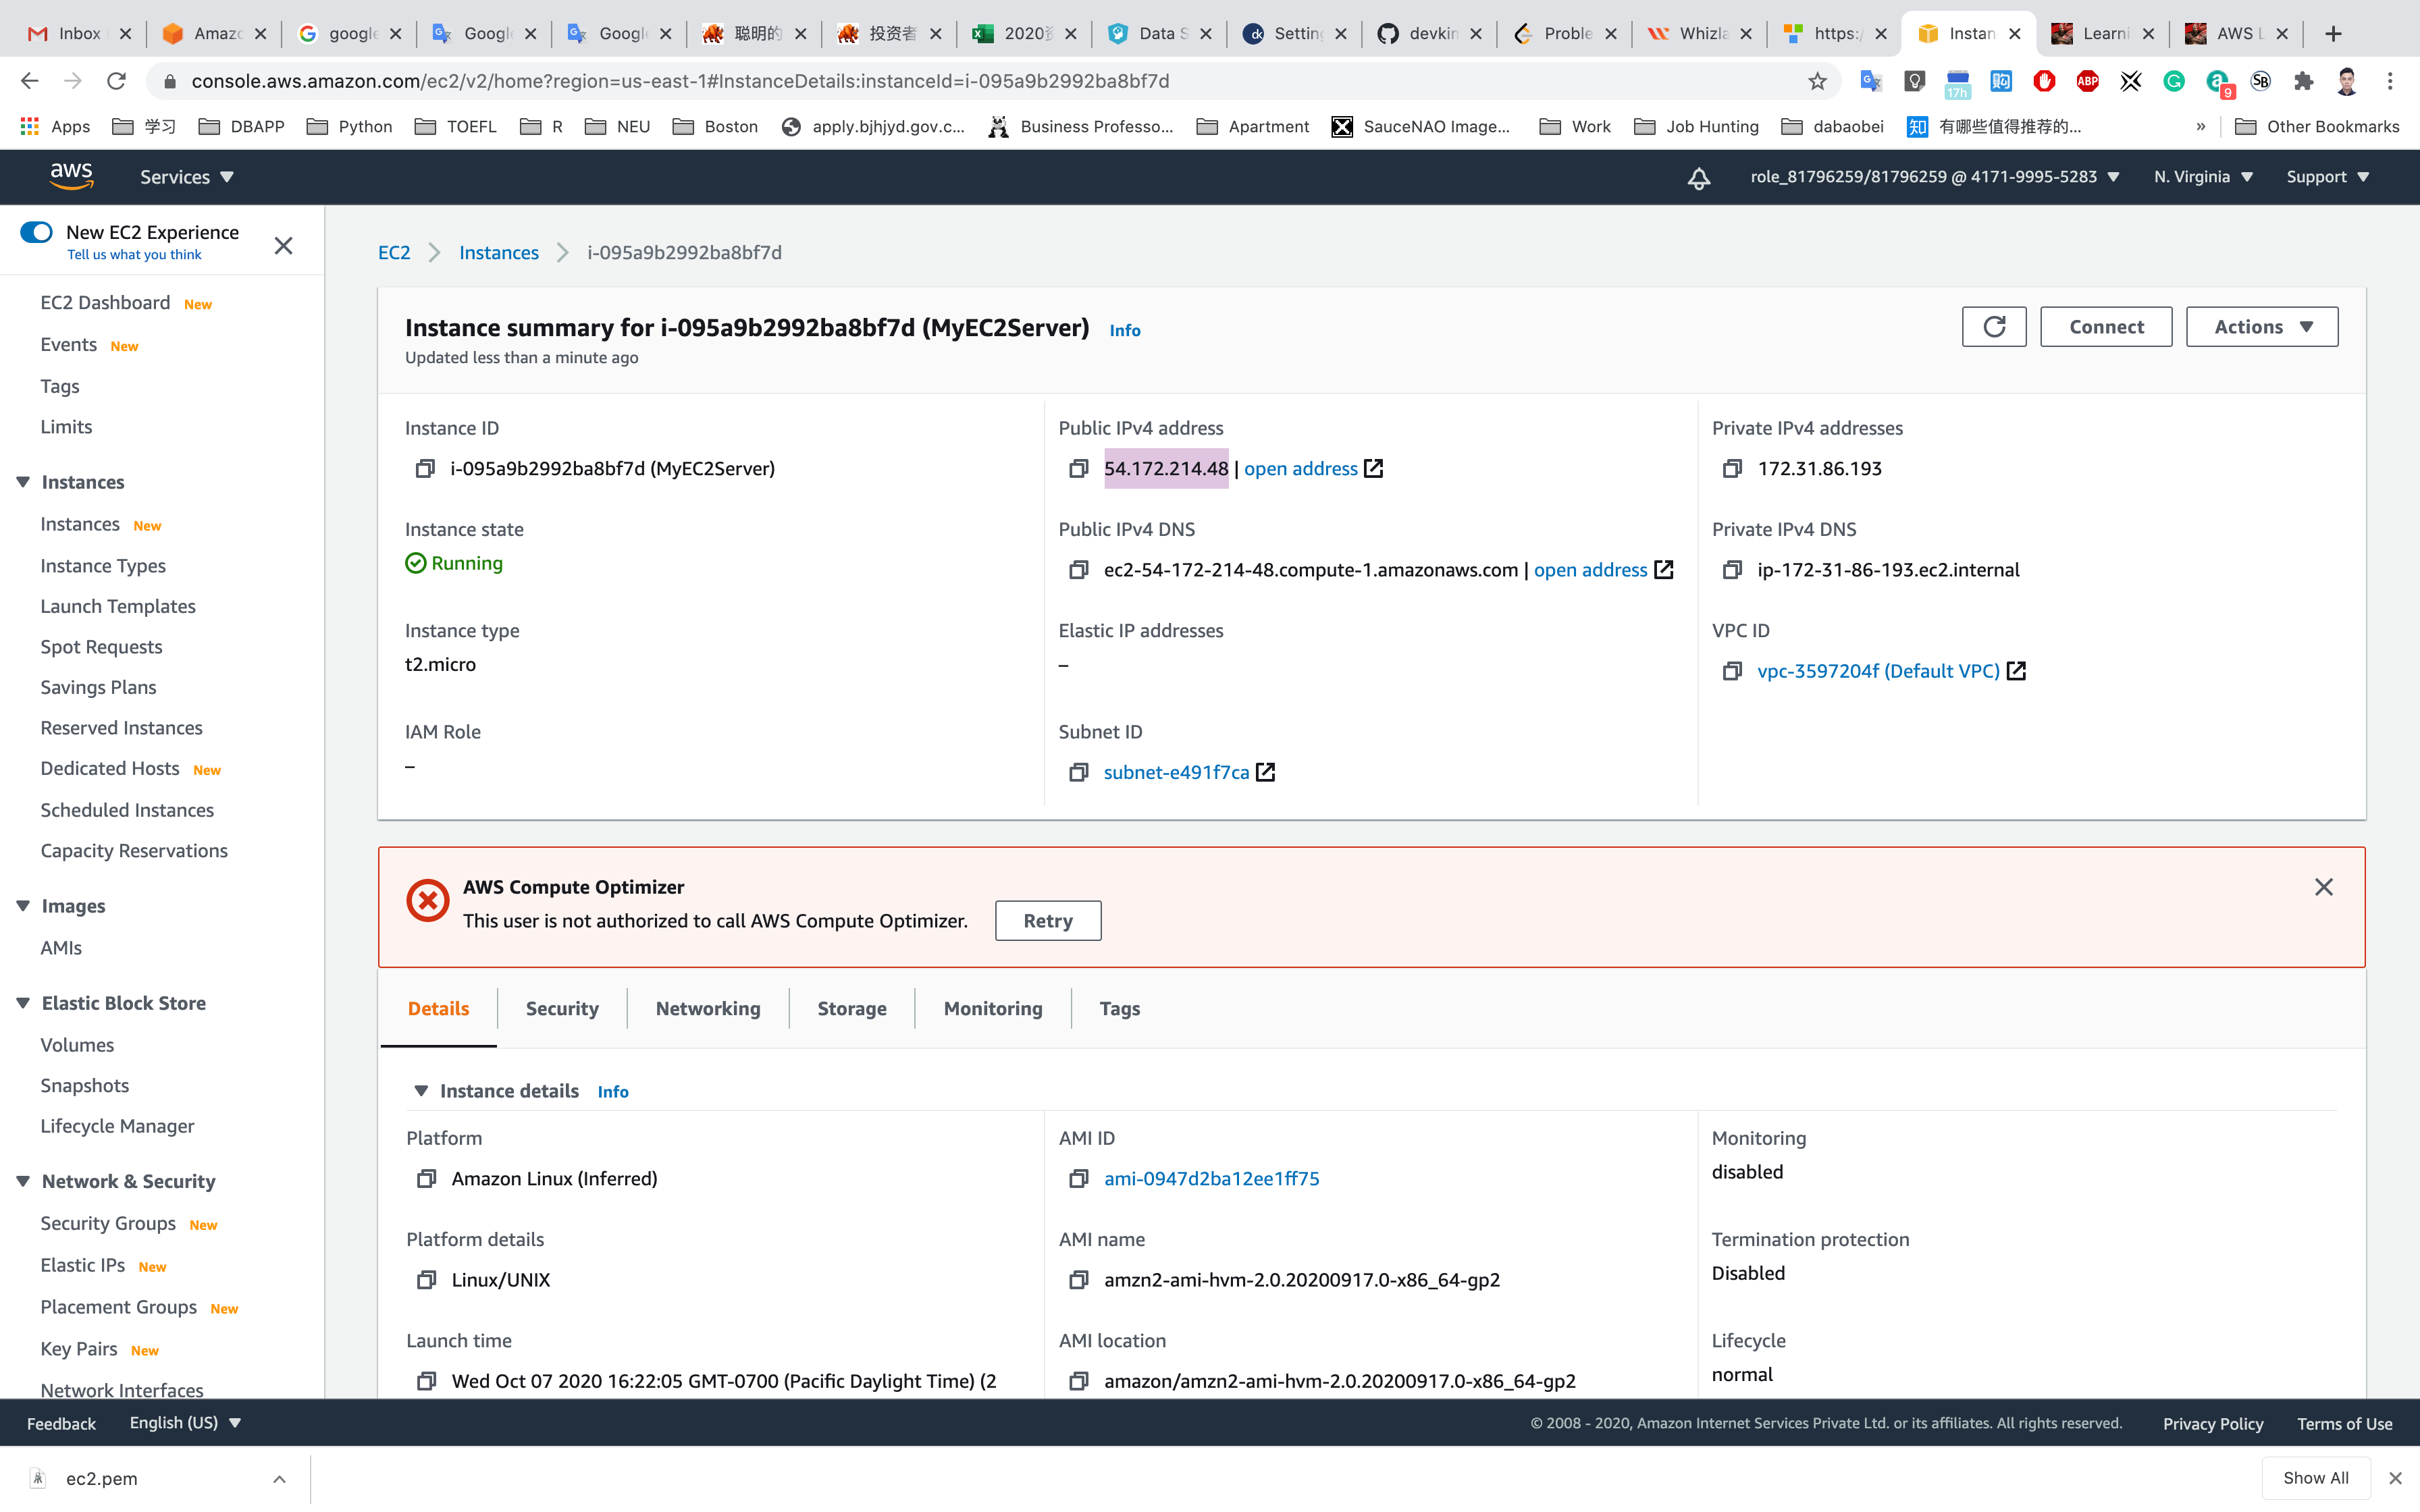
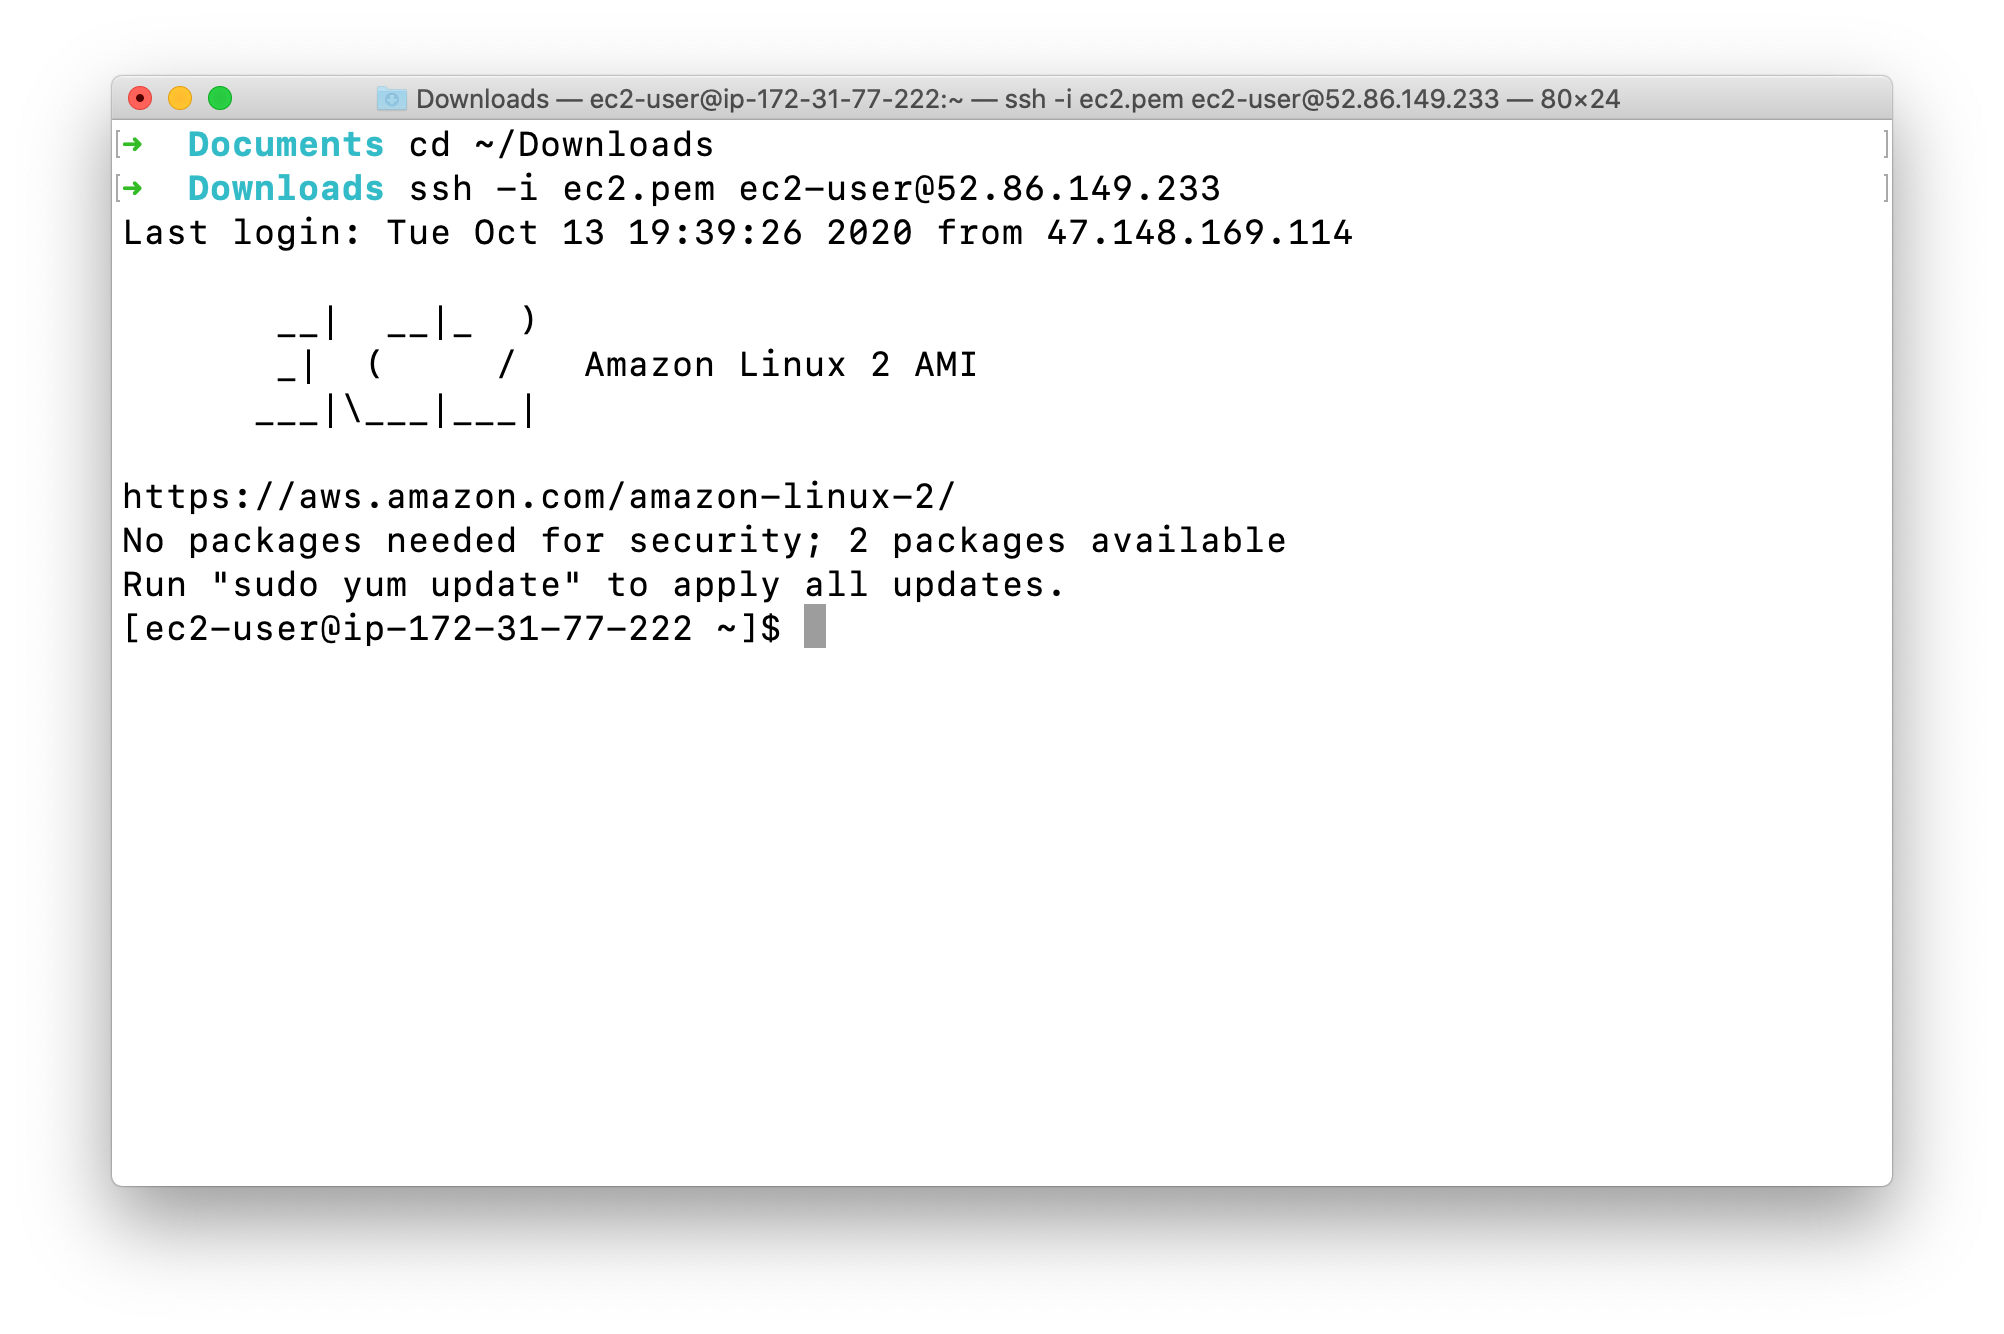
SSH into EC2 Instance and install necessary Softwares
Follow the instructions provided in https://play.whizlabs.com/site/task_support/ssh-into-ec-instance to SSH into the EC2 instance you created.
1 | cd ~/Downloads |
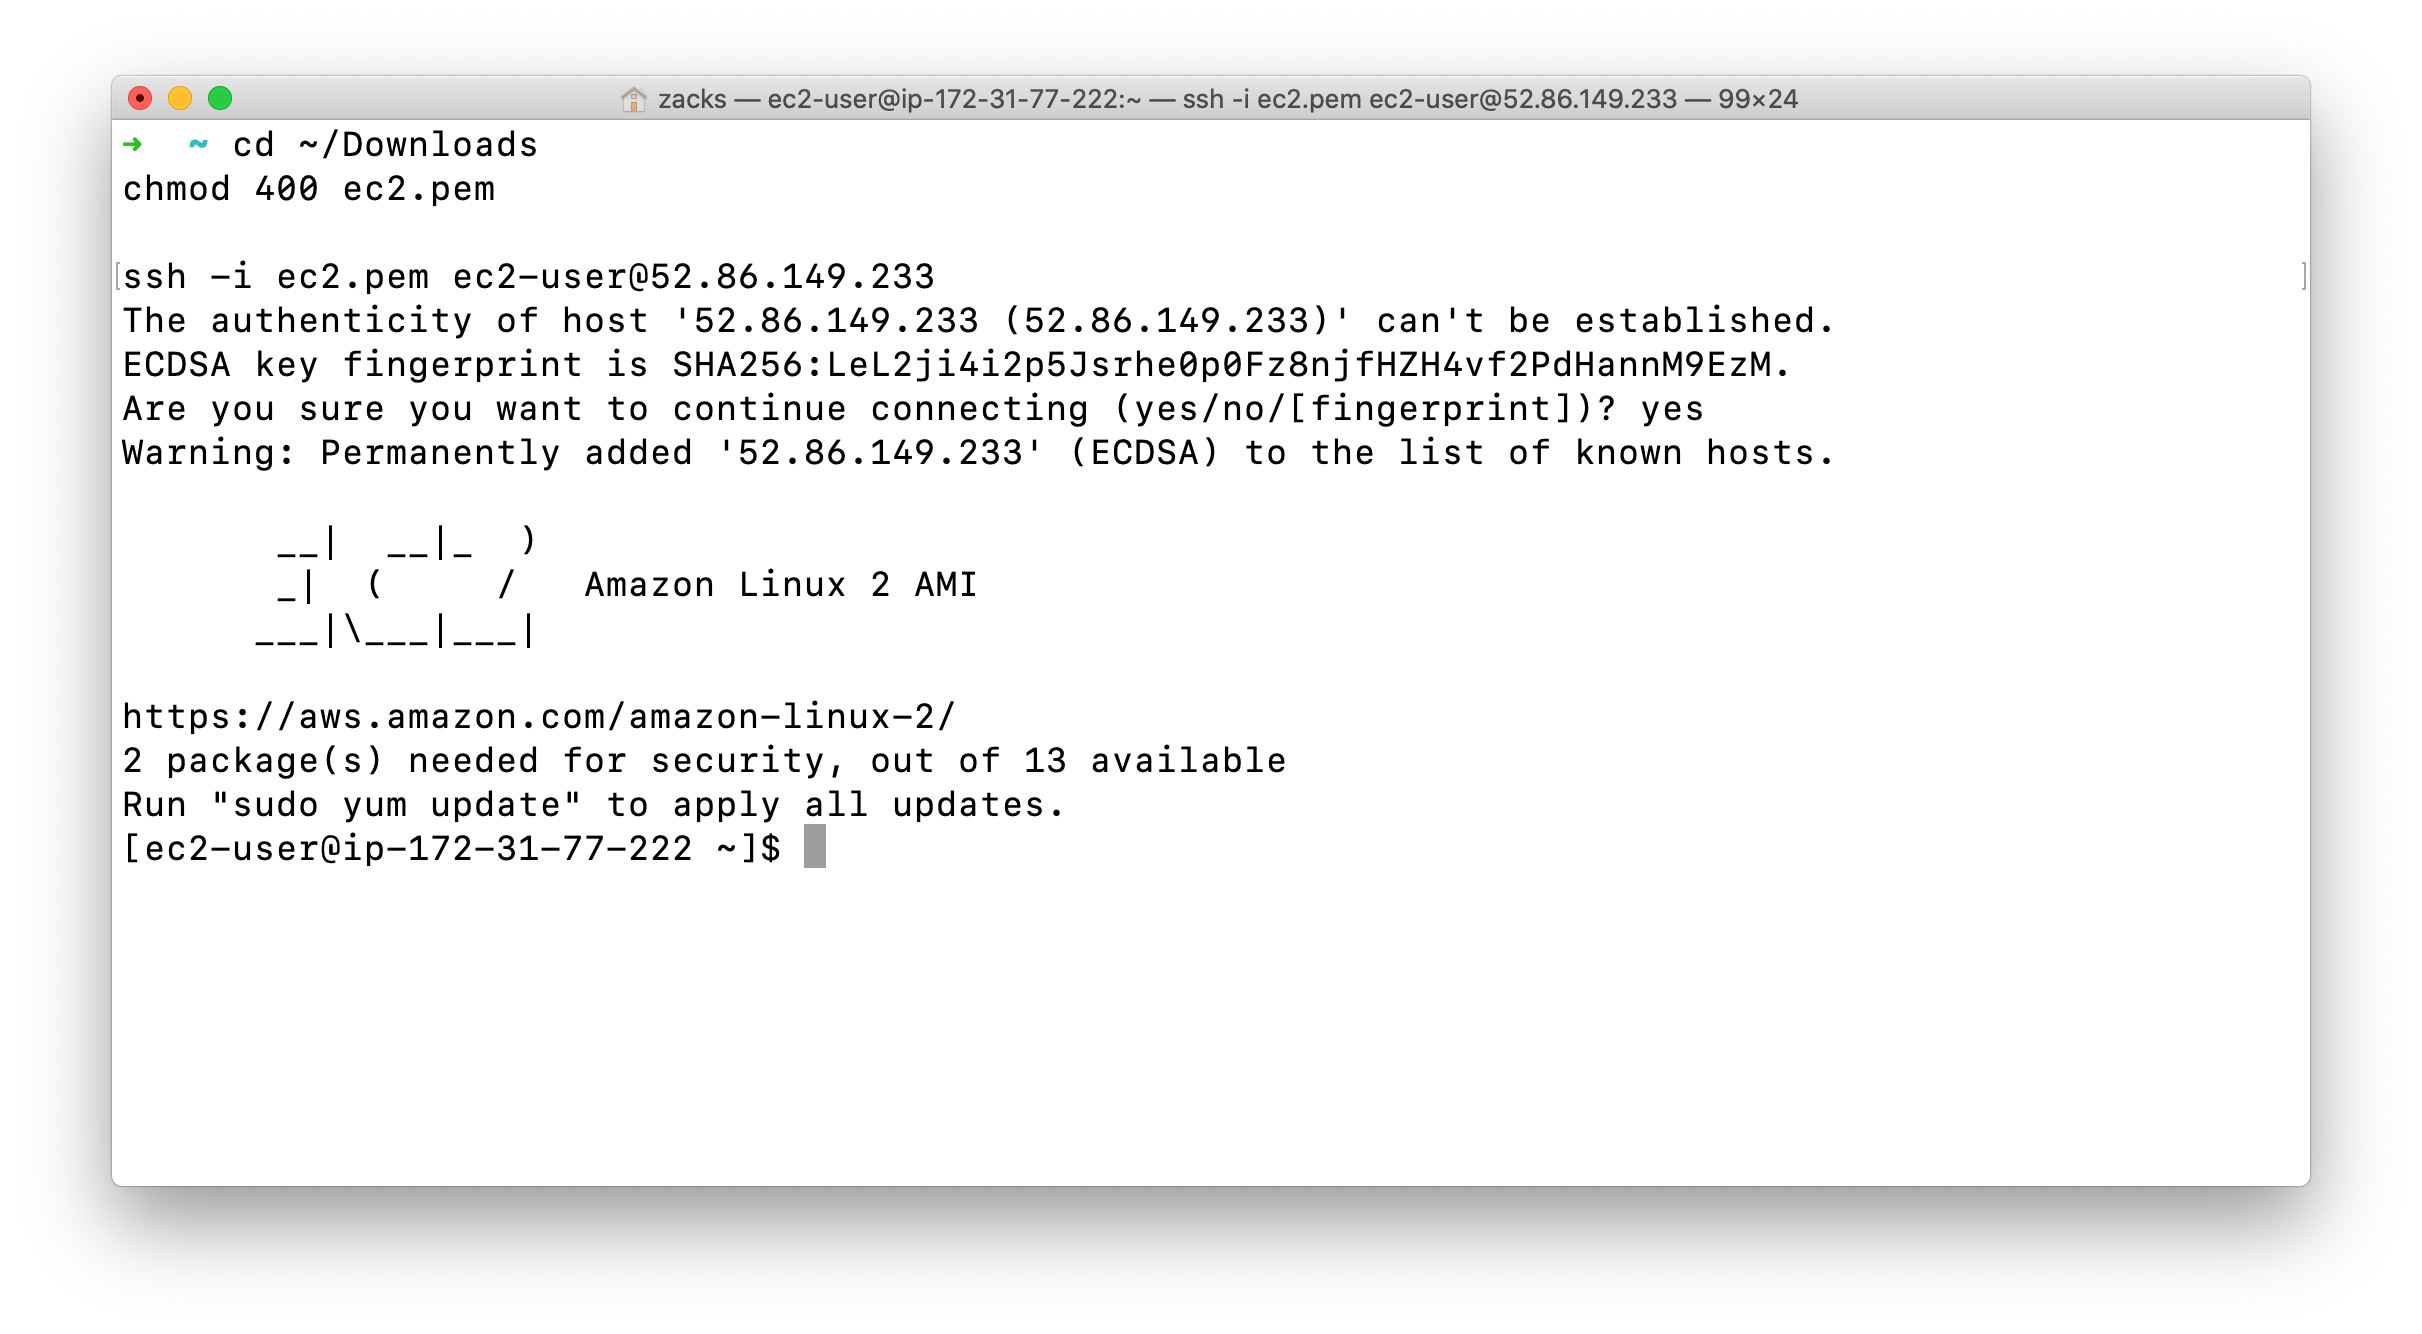
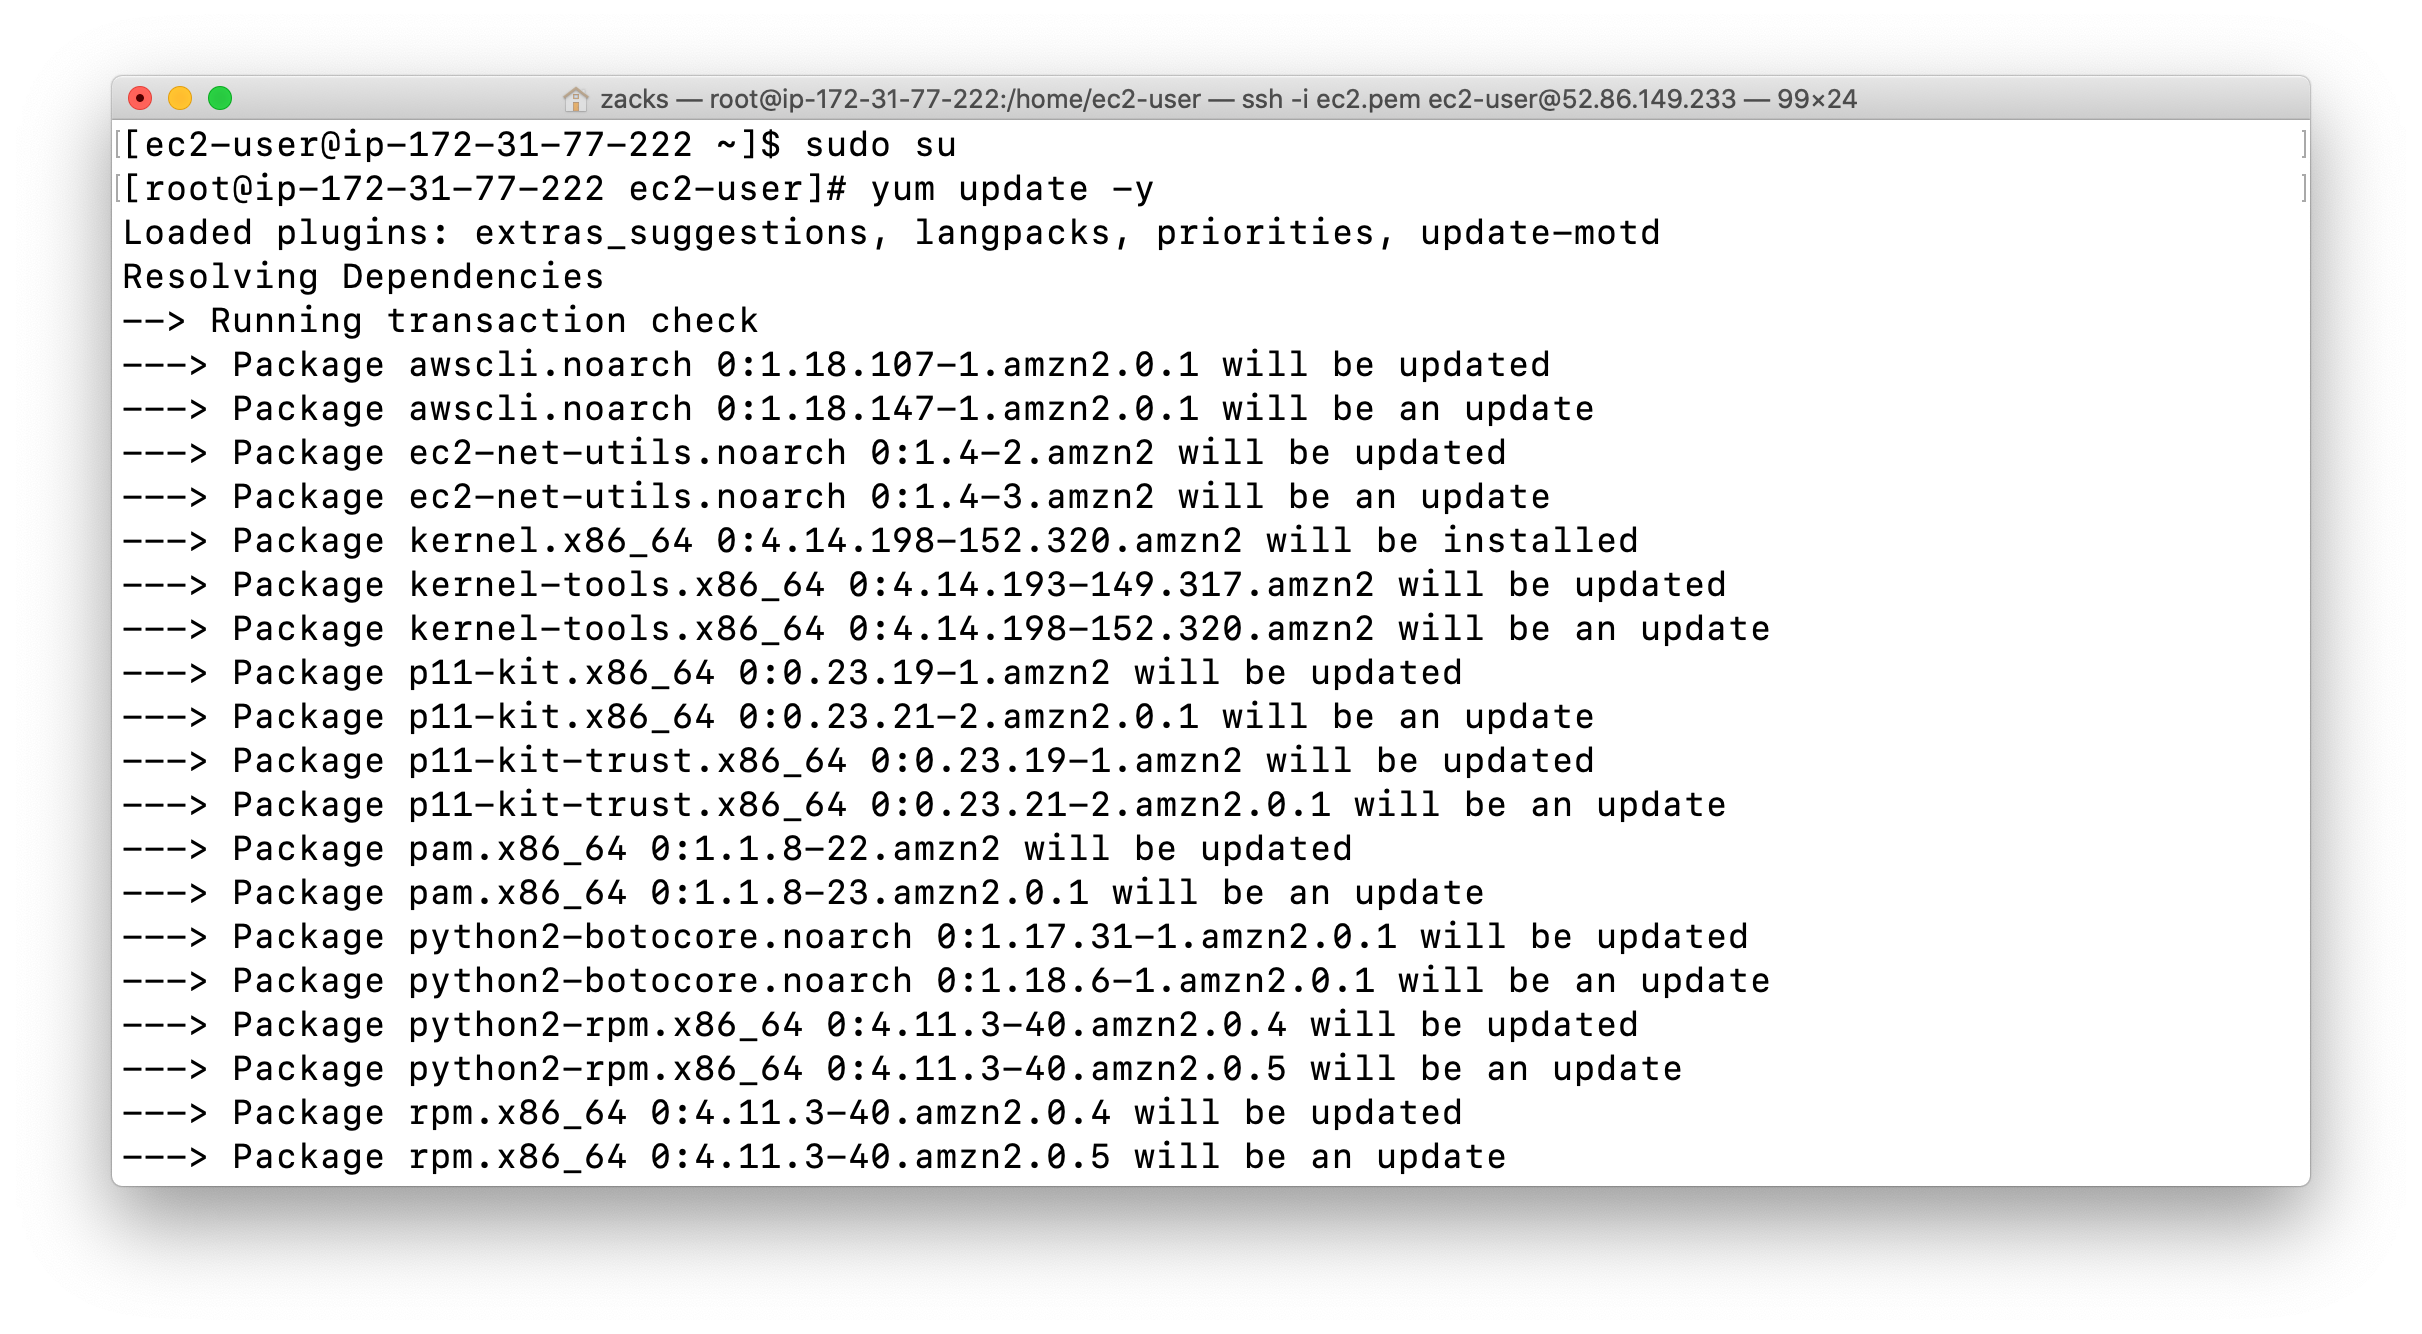
Once you are logged into the EC2 instance, switch to root user.
1 | sudo su |
Update :
1 | yum update -y |
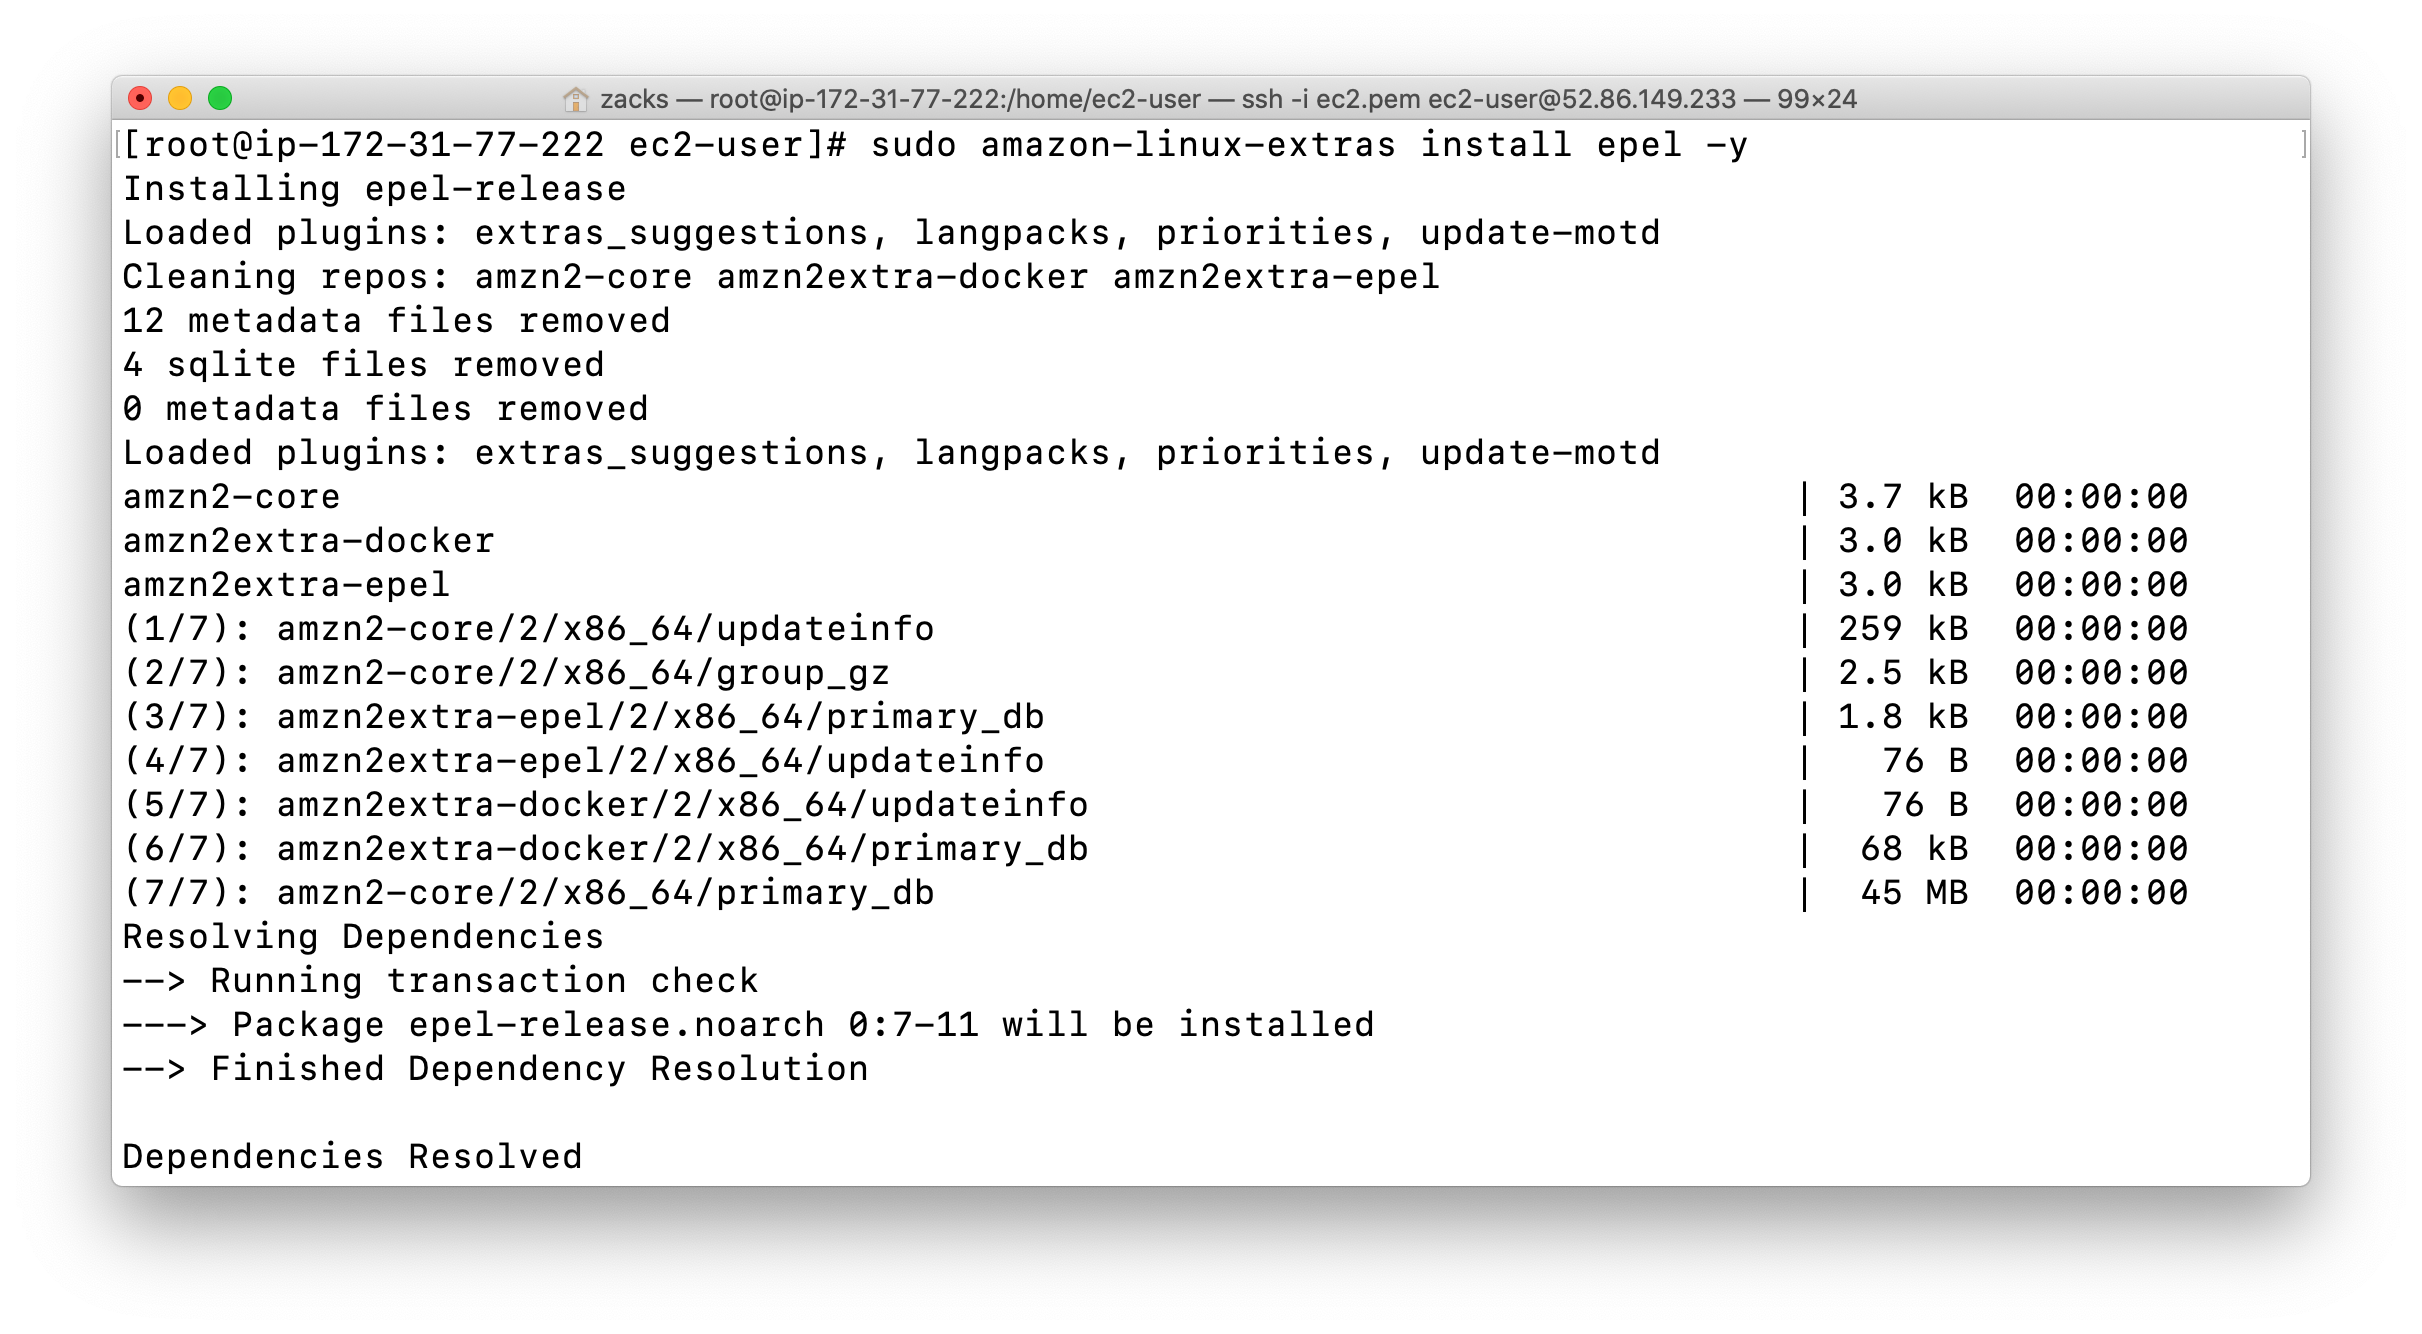
Stress Tool : Amazon Linux 2 AMI does not have the stress tool installed by default, we will need to install some packages
1 | sudo amazon-linux-extras install epel -y |
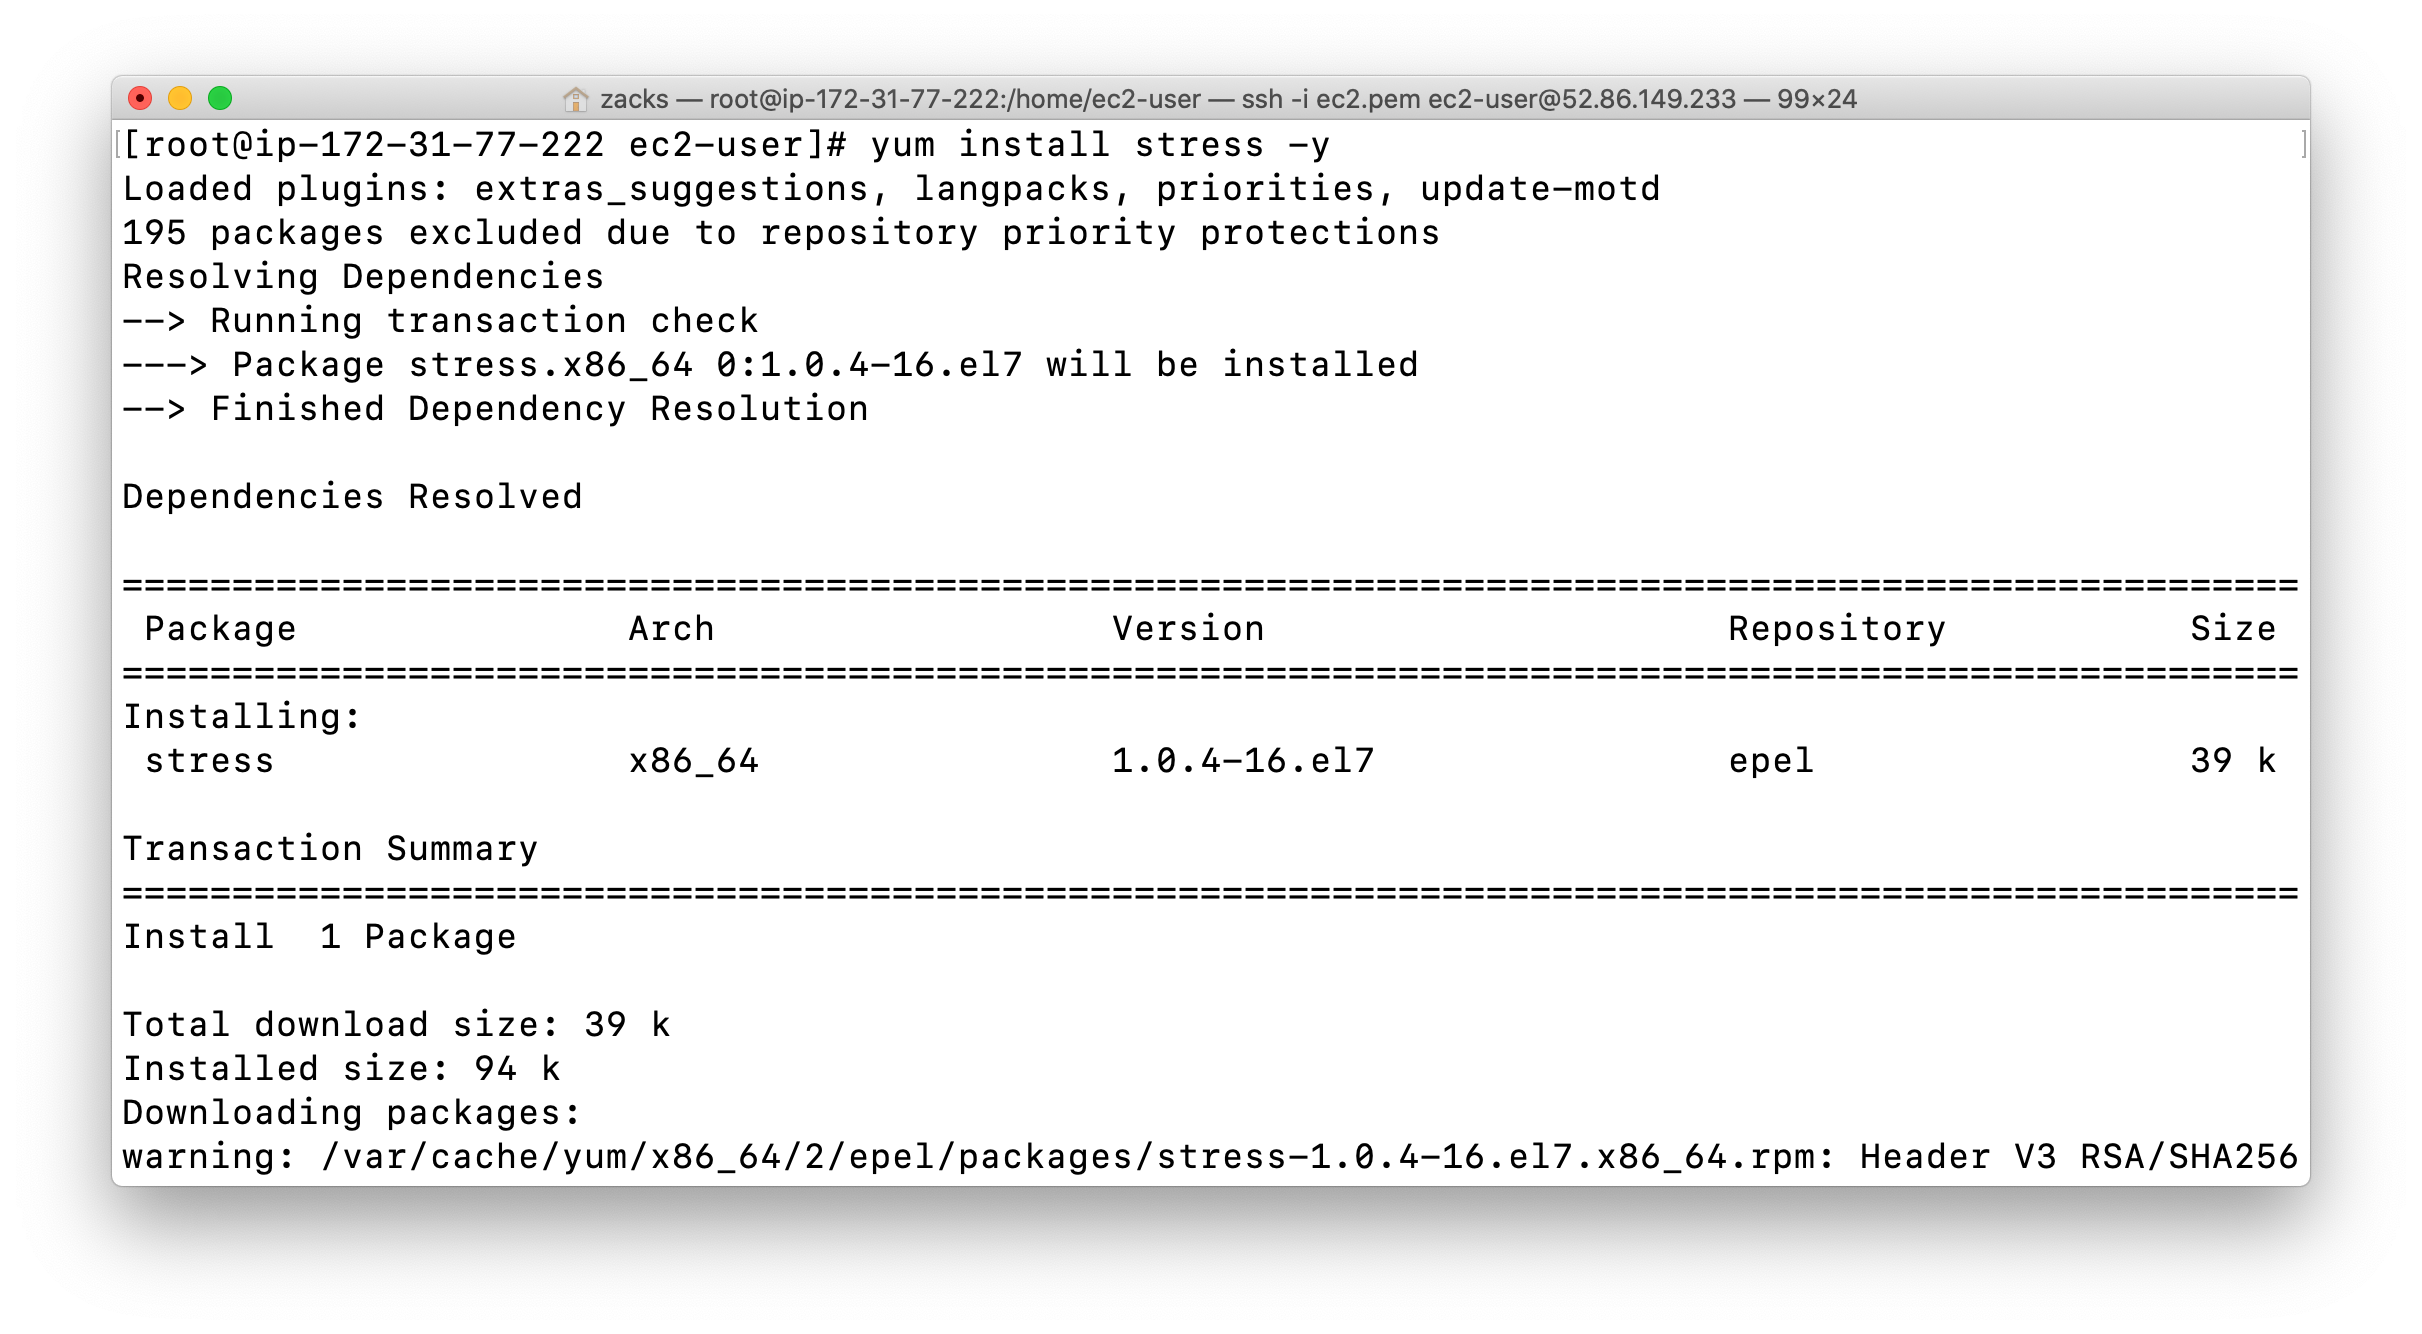
Stress tool will be used for simulating EC2 metrics. Once we create the CloudWatch Alarm, we shall come back to SSH and trigger CPUUtilization using it.
SNS Configuration
Service -> SNS
Region: US East (N. Virginia) us-east-1
Create SNS Topic
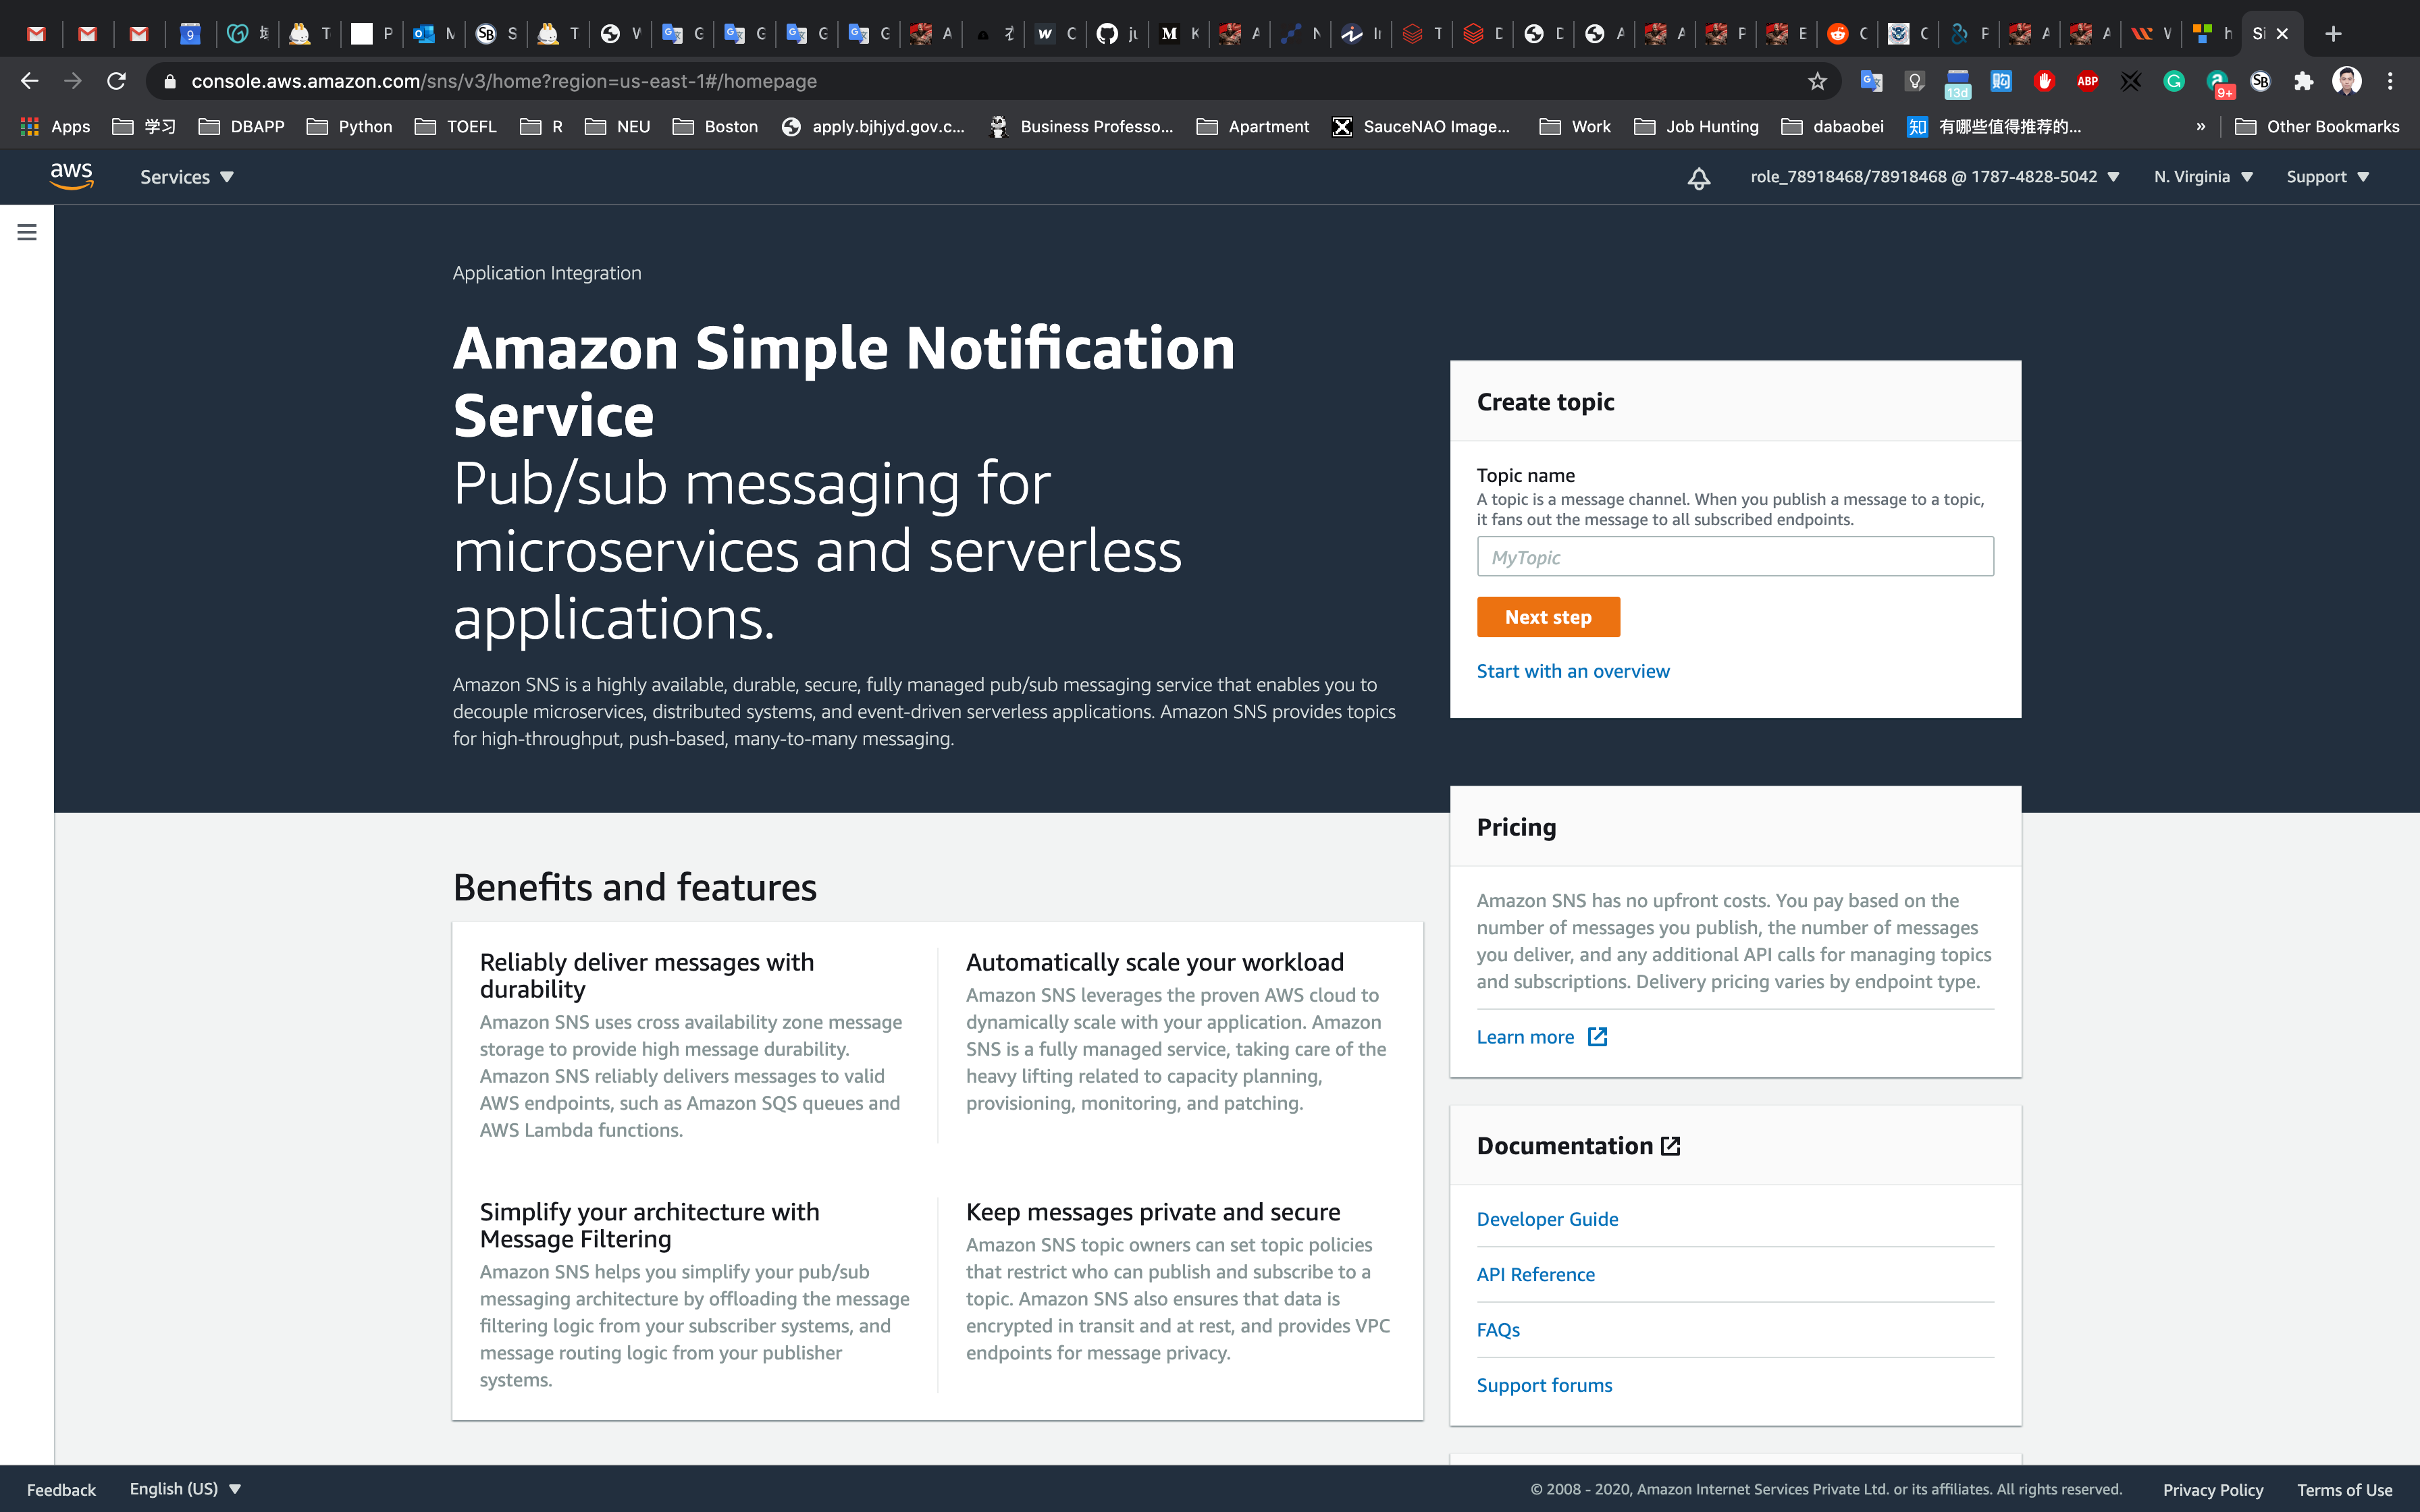
Under Topic name, input MyServerMonitor and Click on Next Step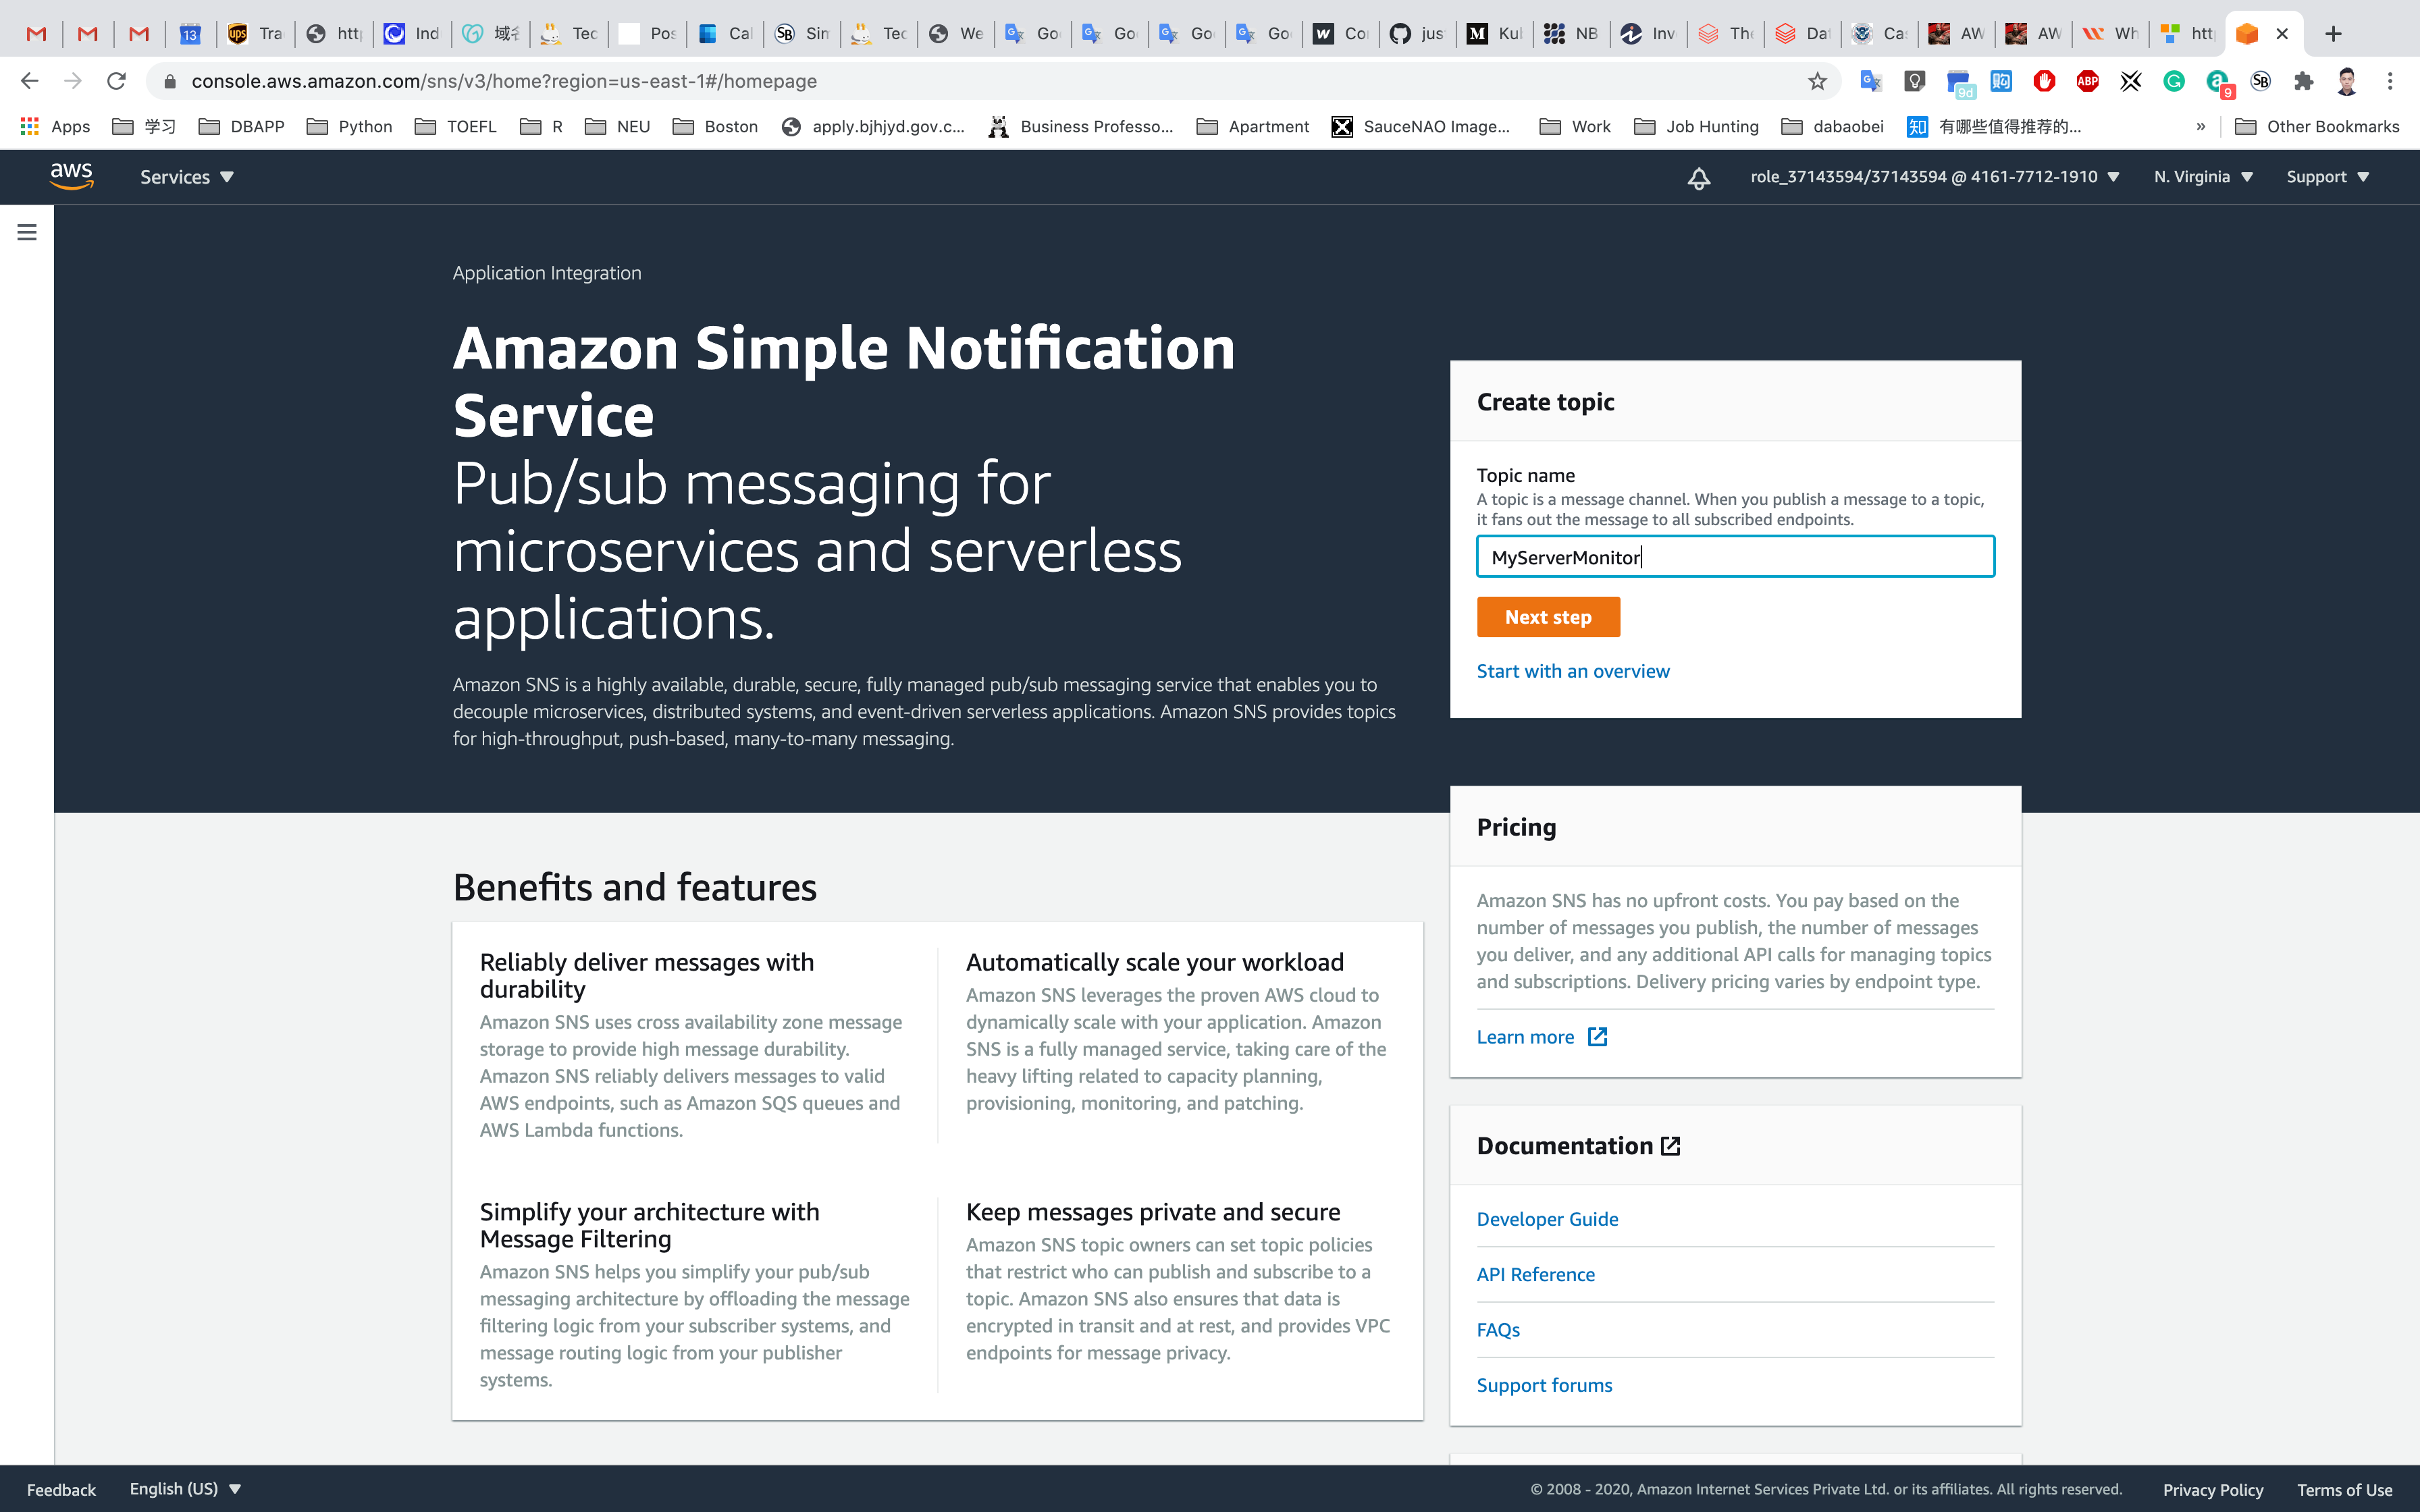
Under Displayed name, input MyServerMonitor
Leave other options as default and click on Create topic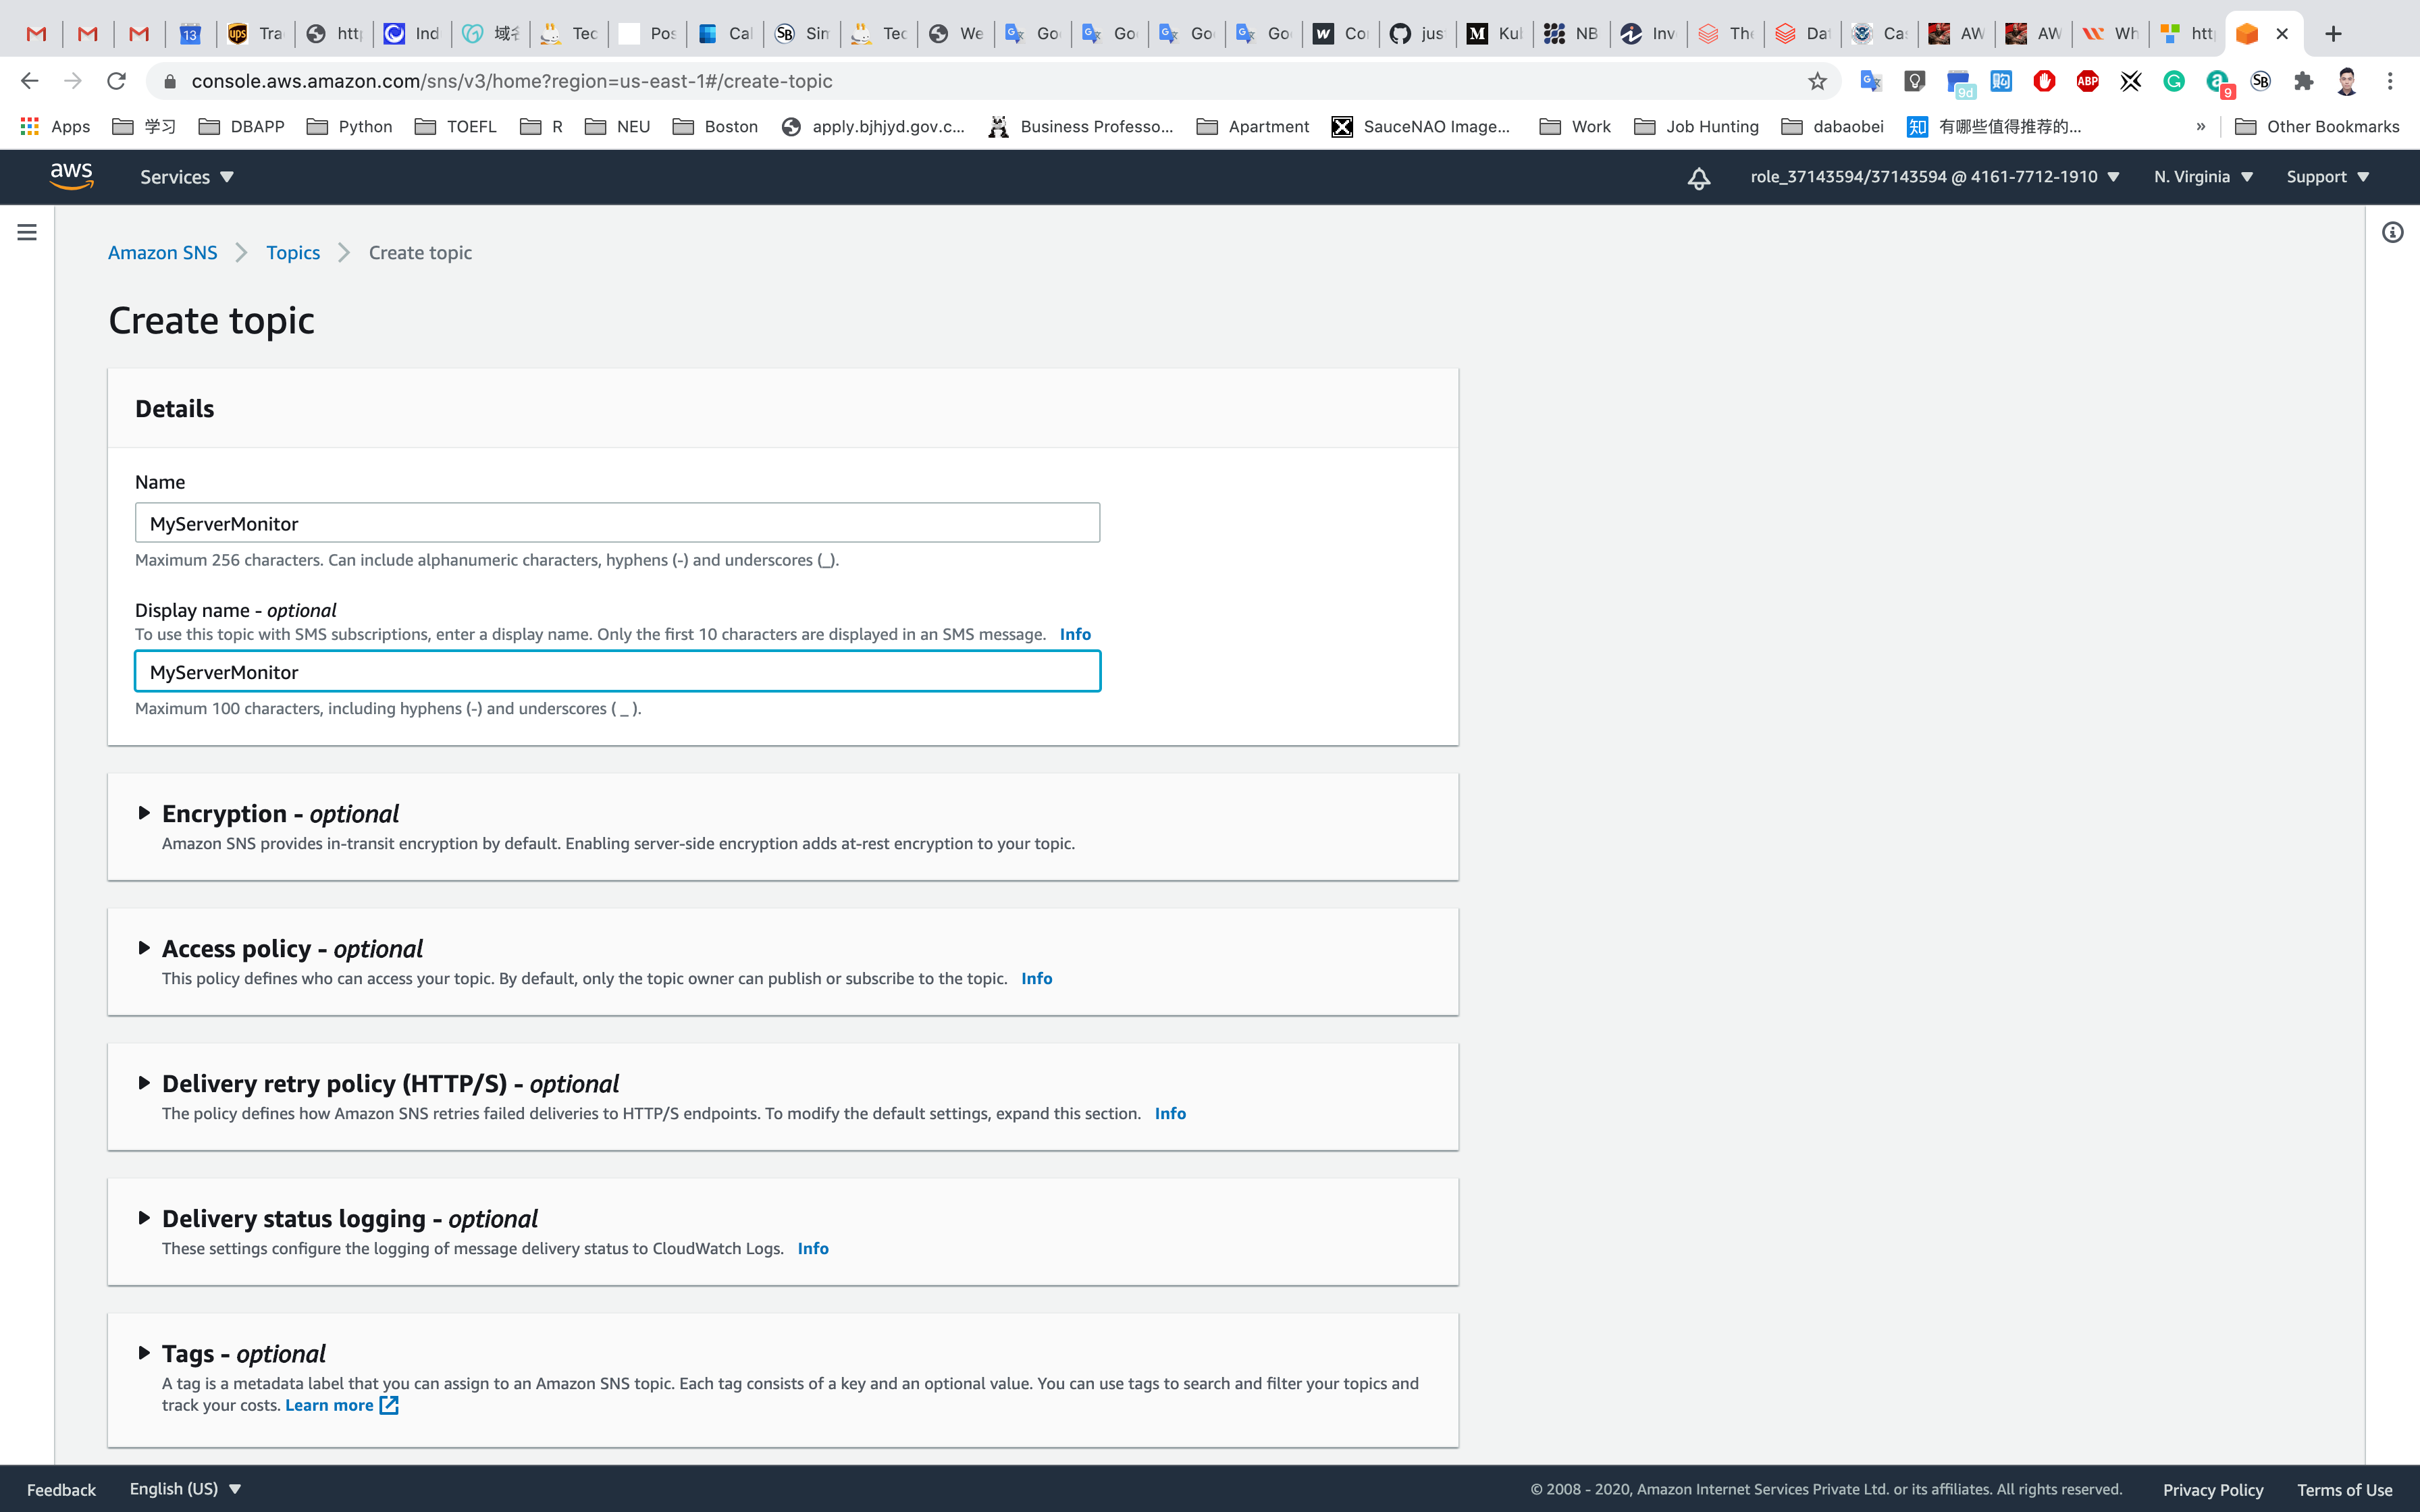
Your new SNS topic has been created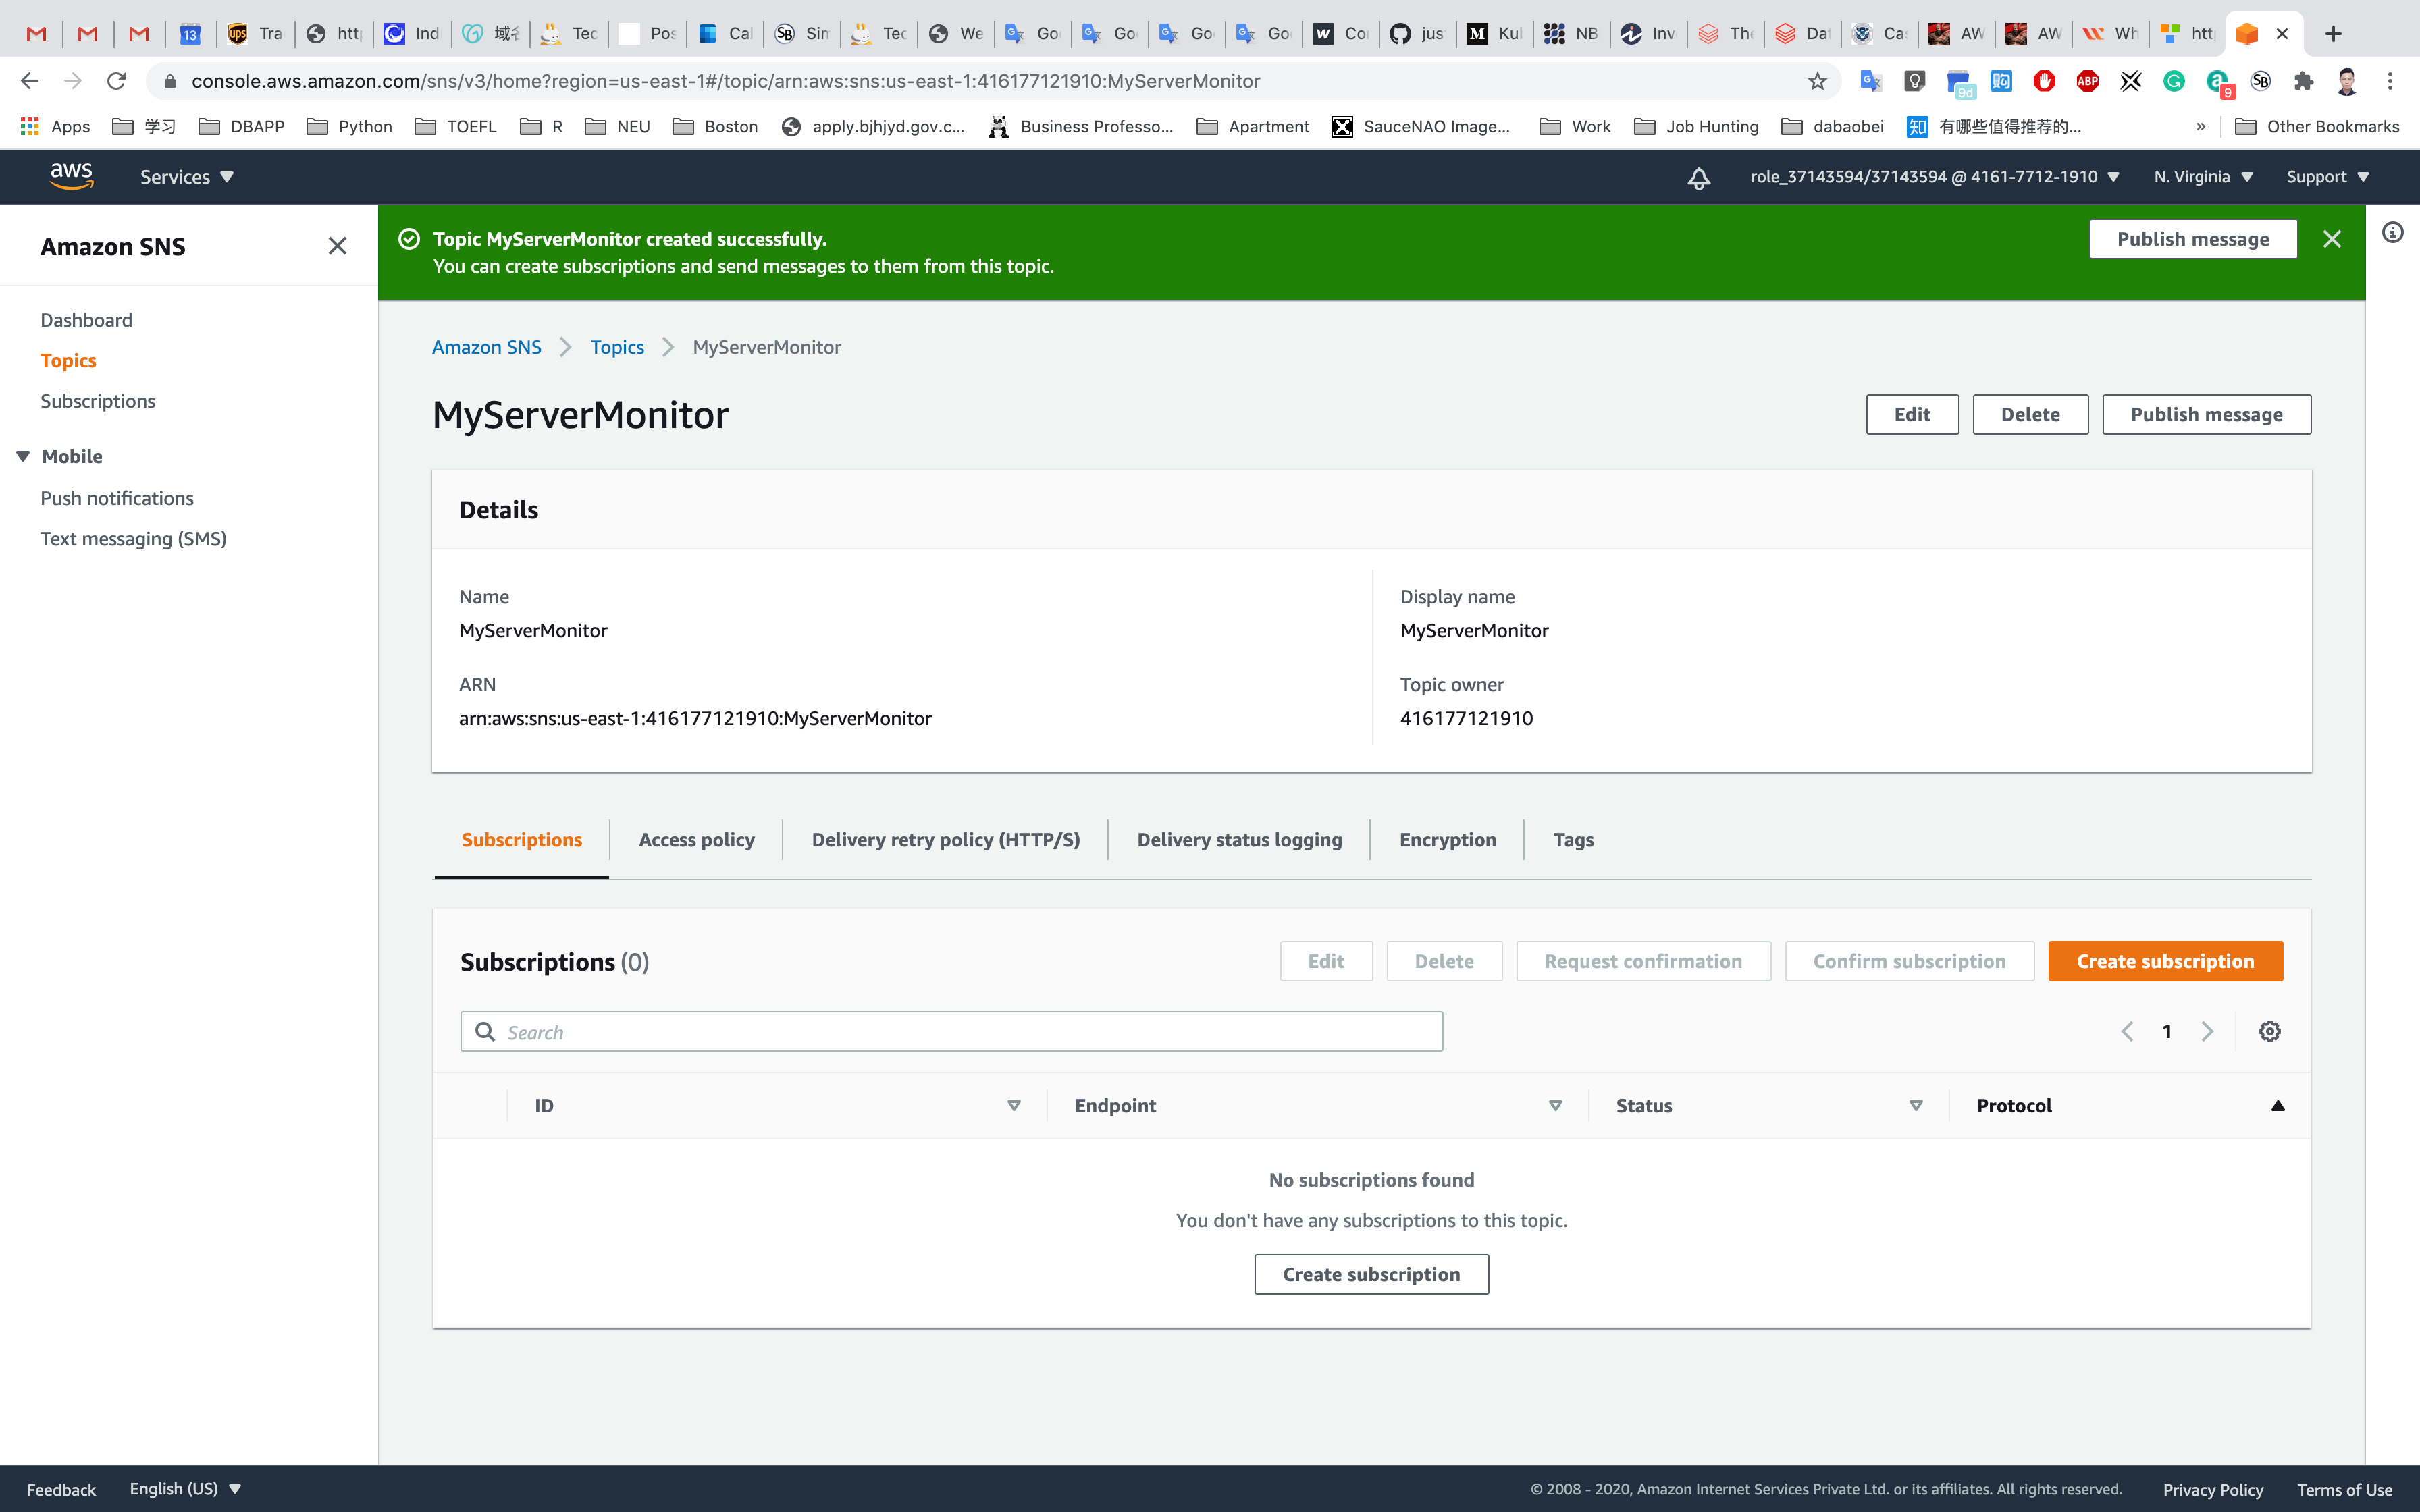
Subscribe to SNS Topic
Once the SNS topic is created, click on the SNS topic MyServerMonitor.
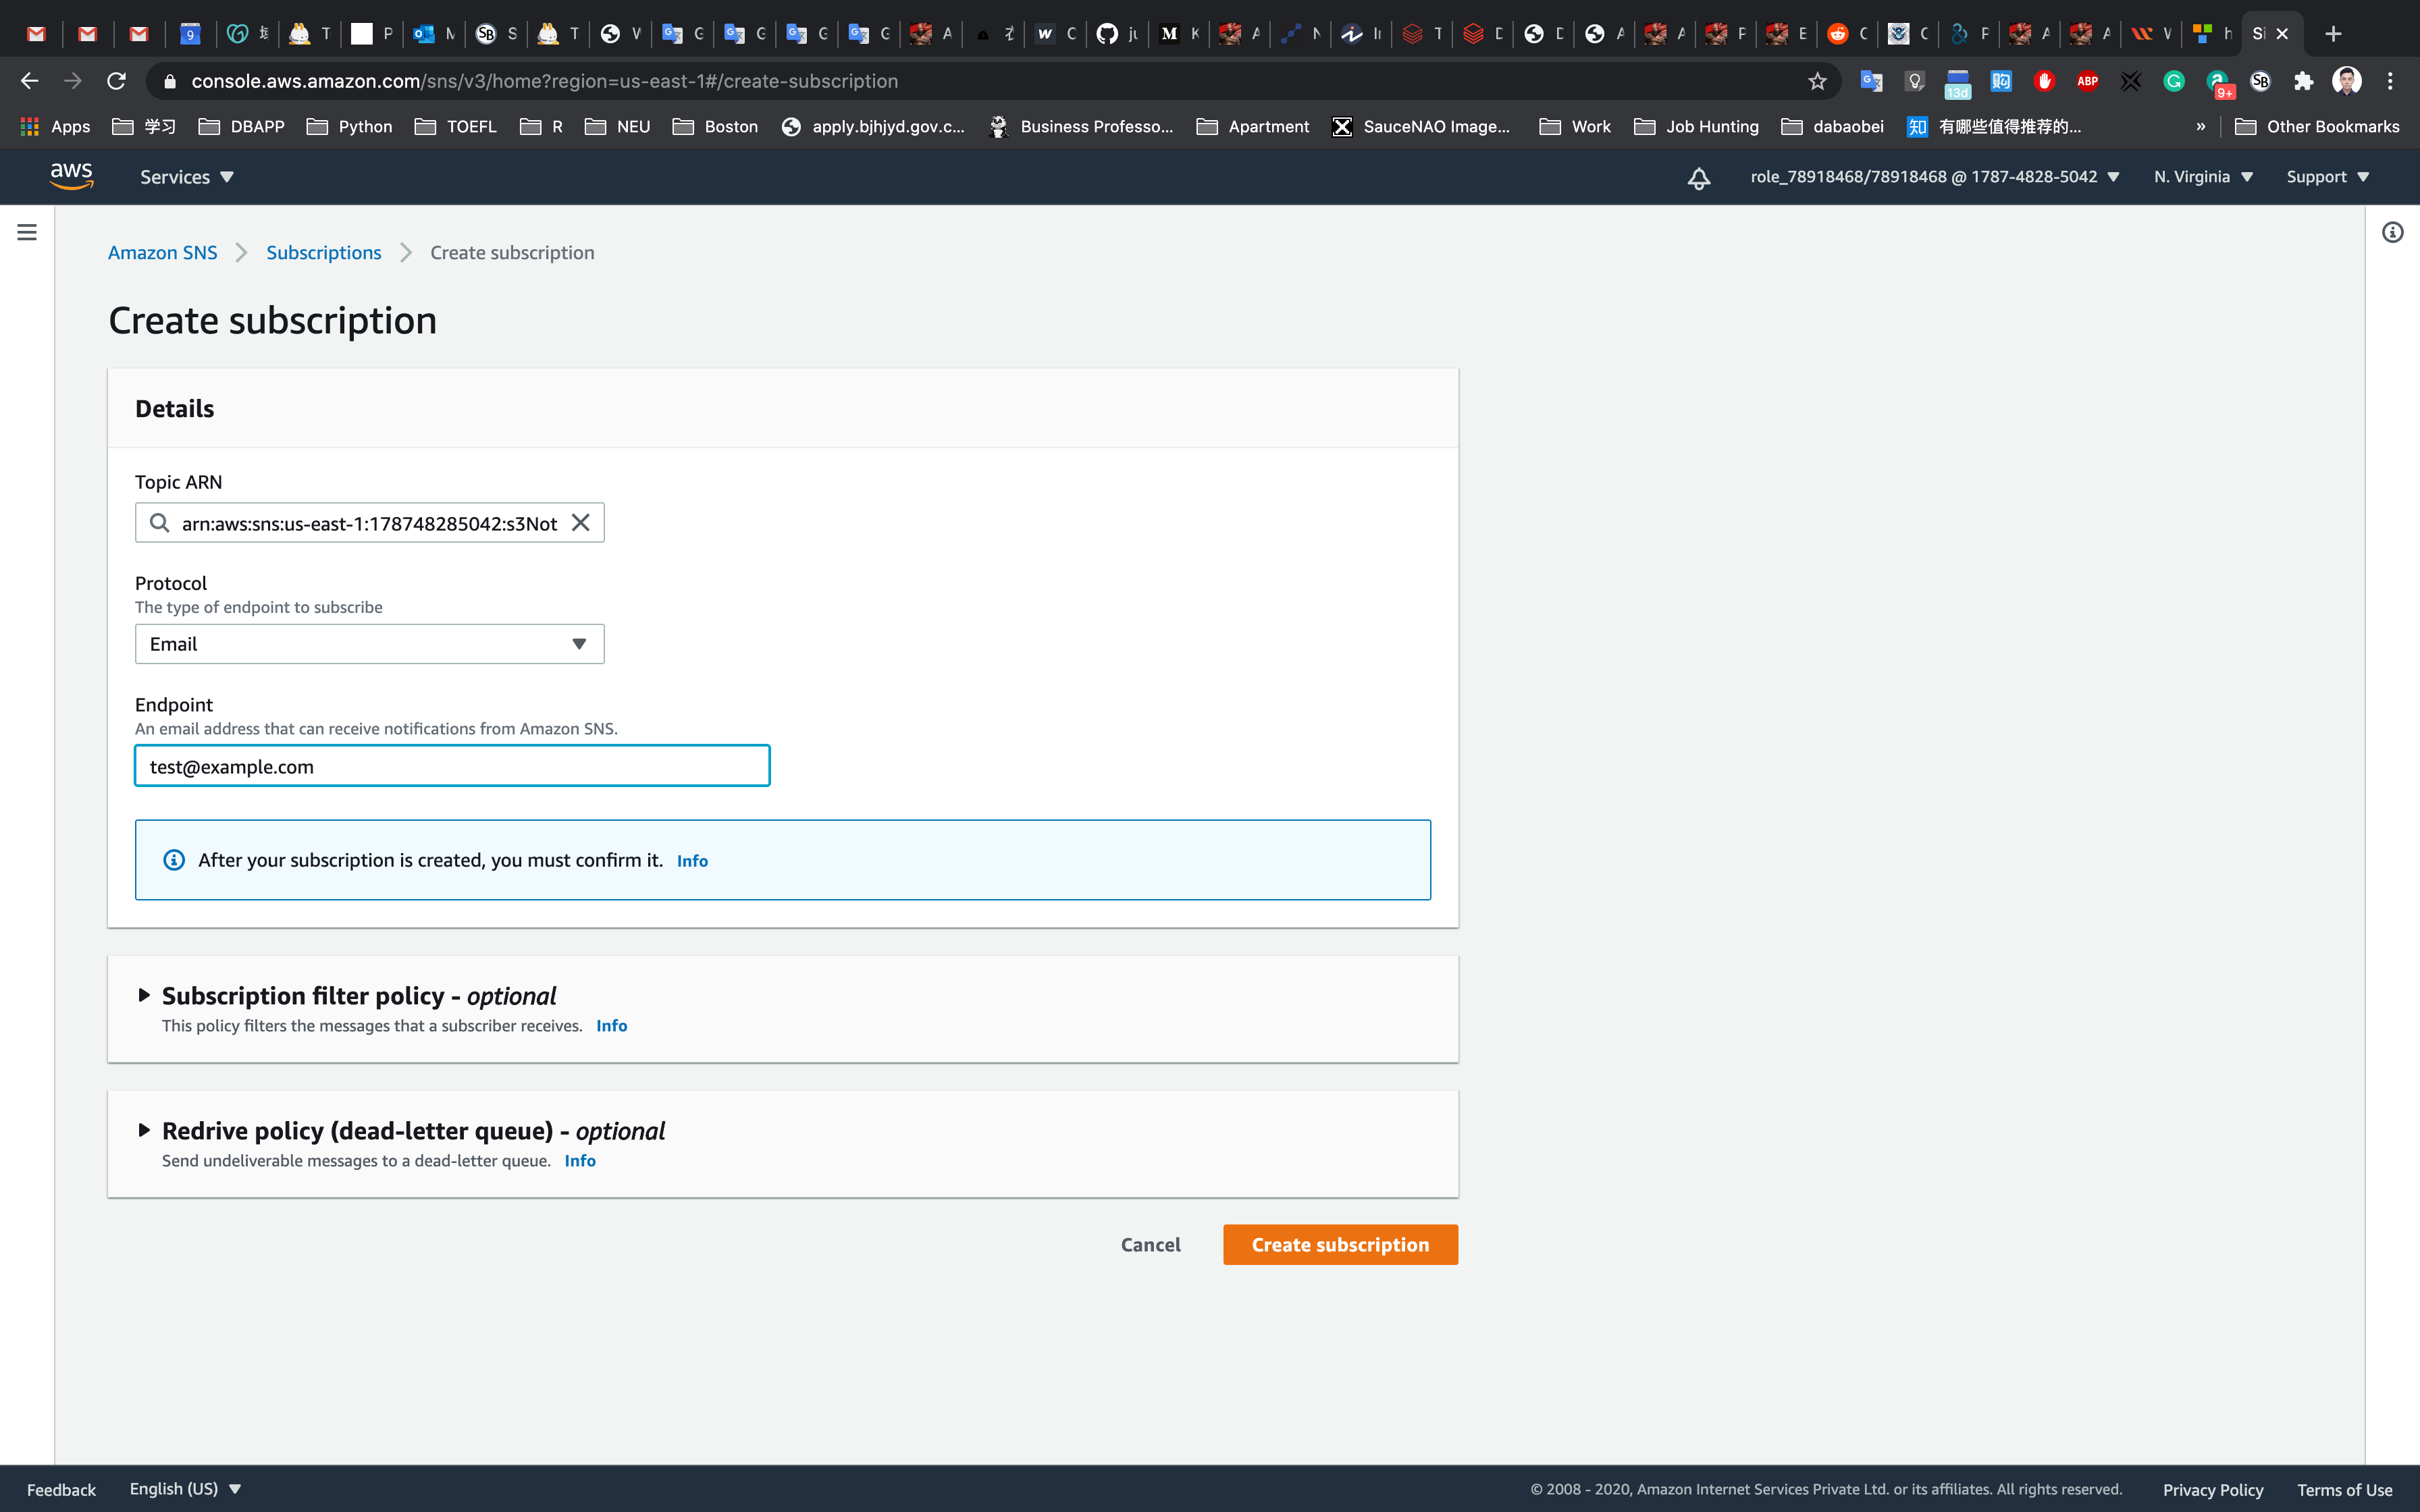
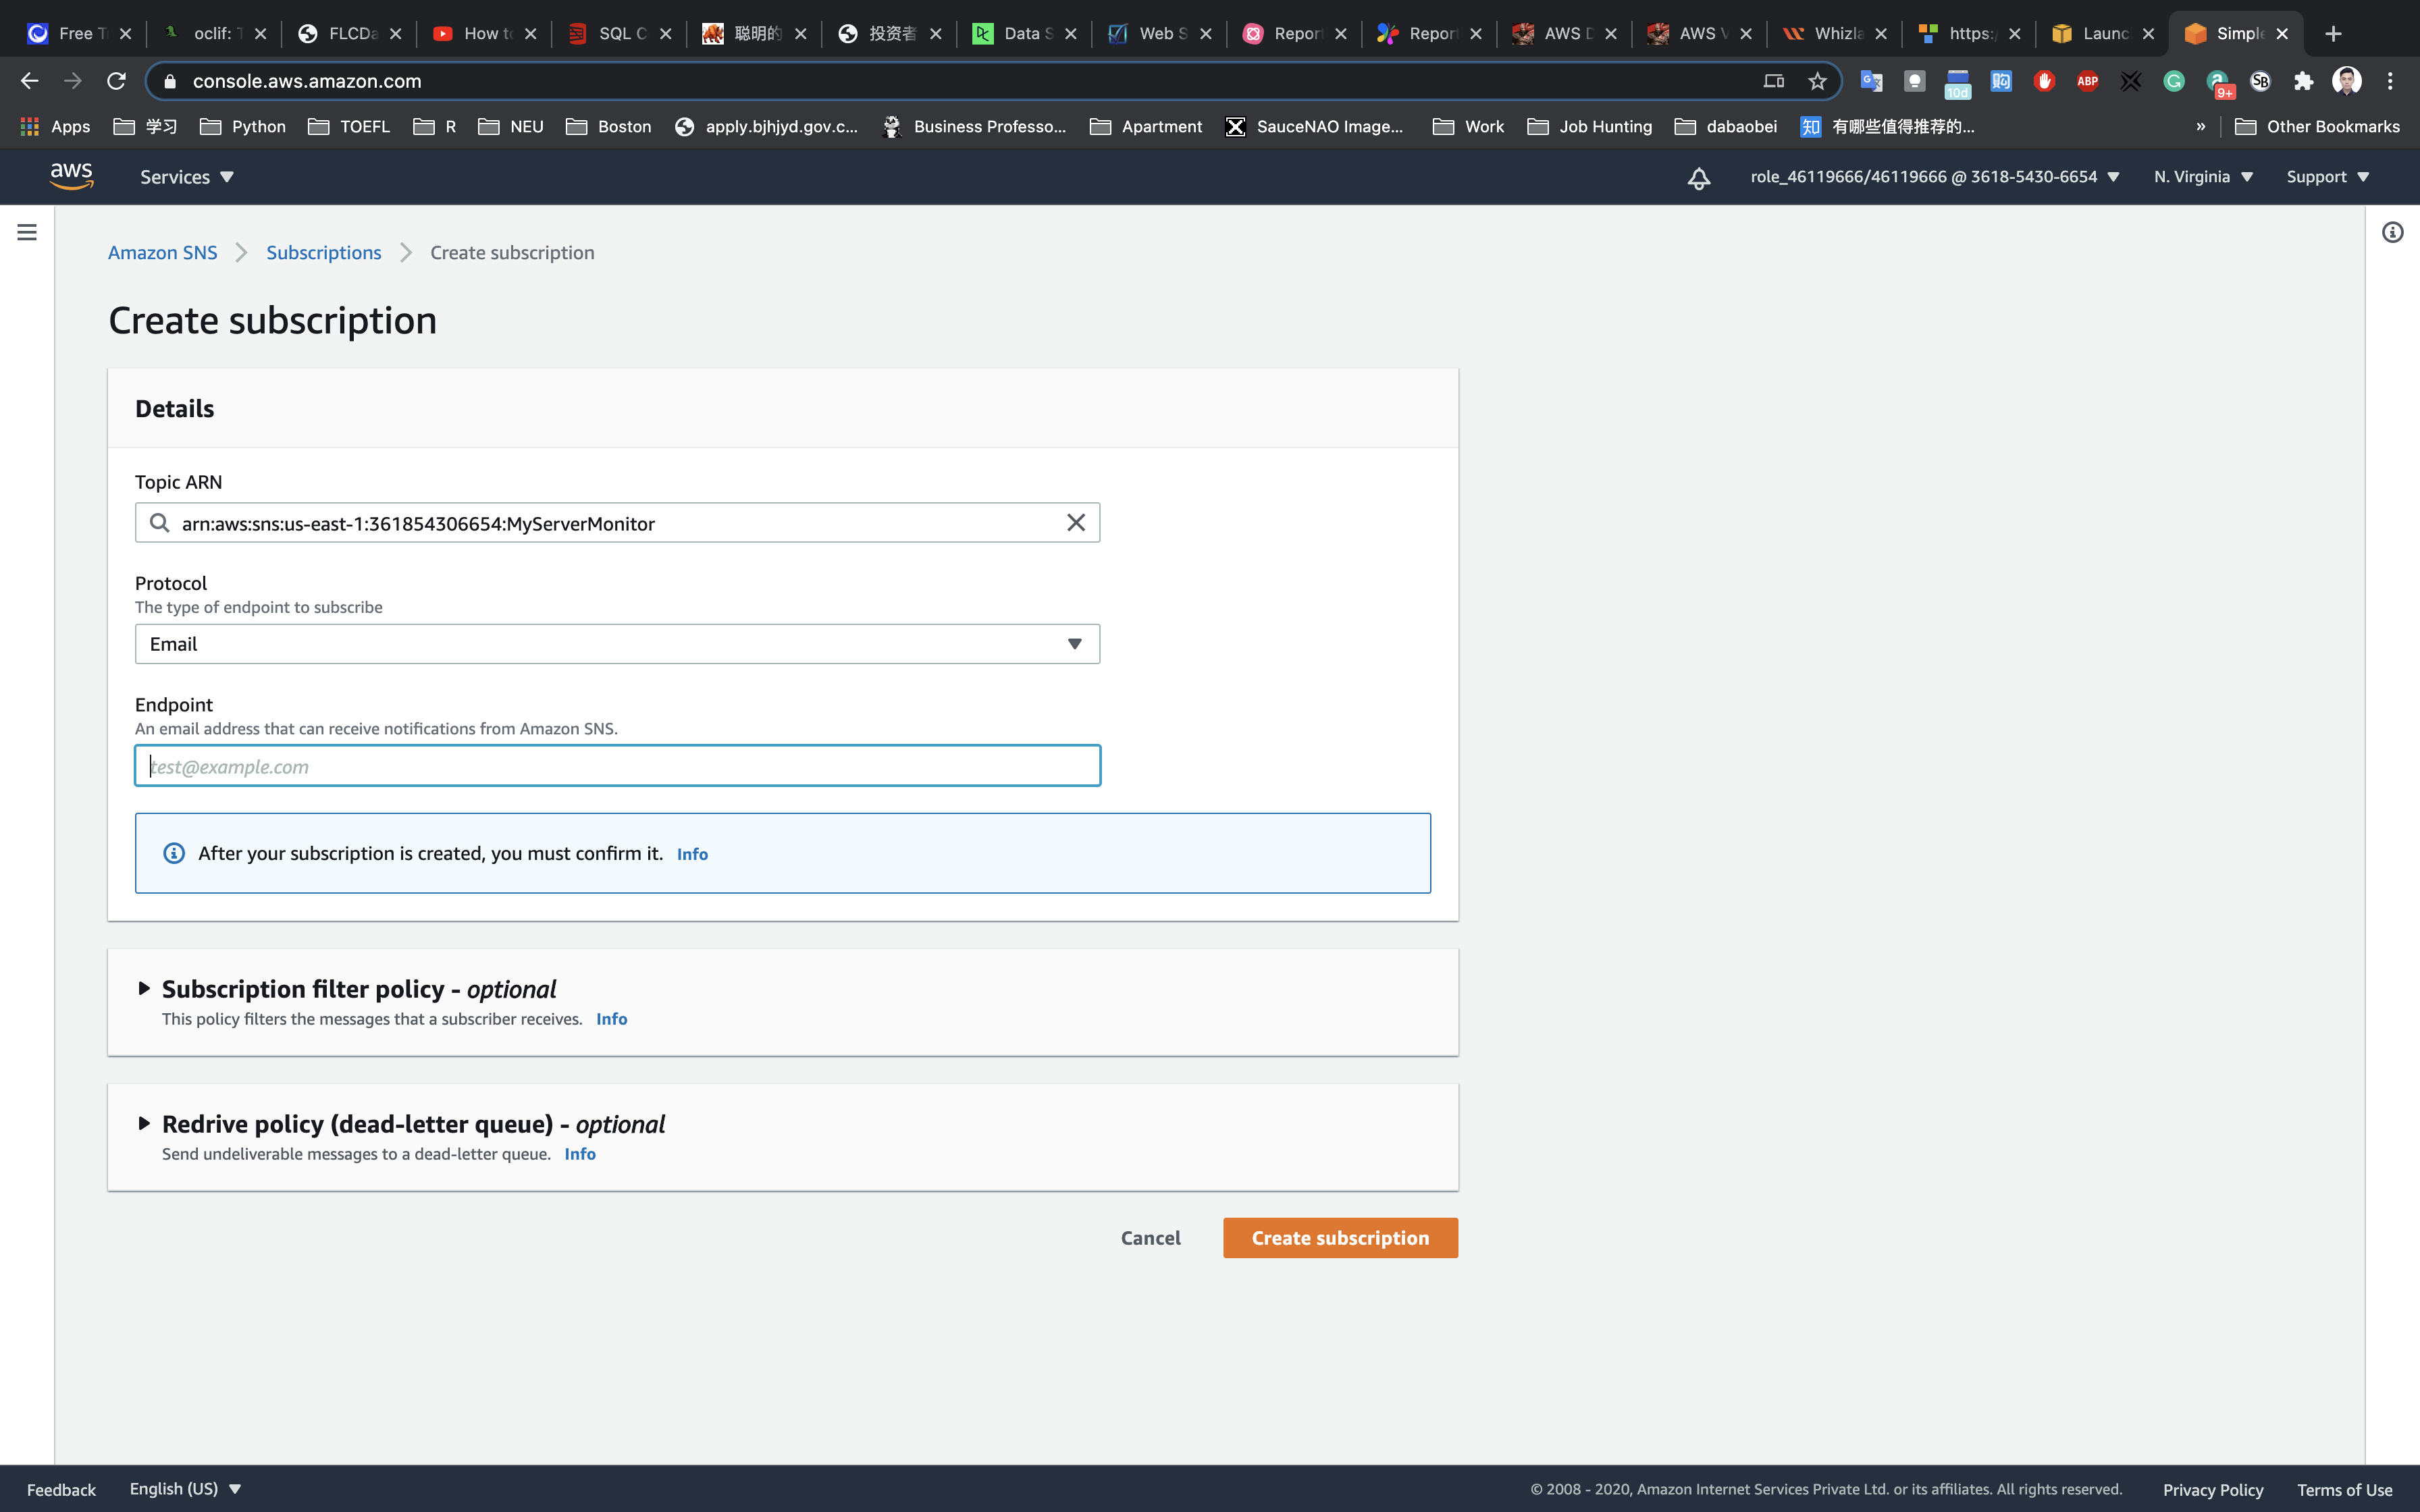
Click on Create subscription.
Under Details:
- Protocol : Select
Email - Endpoint : Enter your <
Mail address> - Note: Make sure you give a valid email address as you will receive a SNS notification to this email address.
Notice the status is Pending confirmation. Now check your email inbox.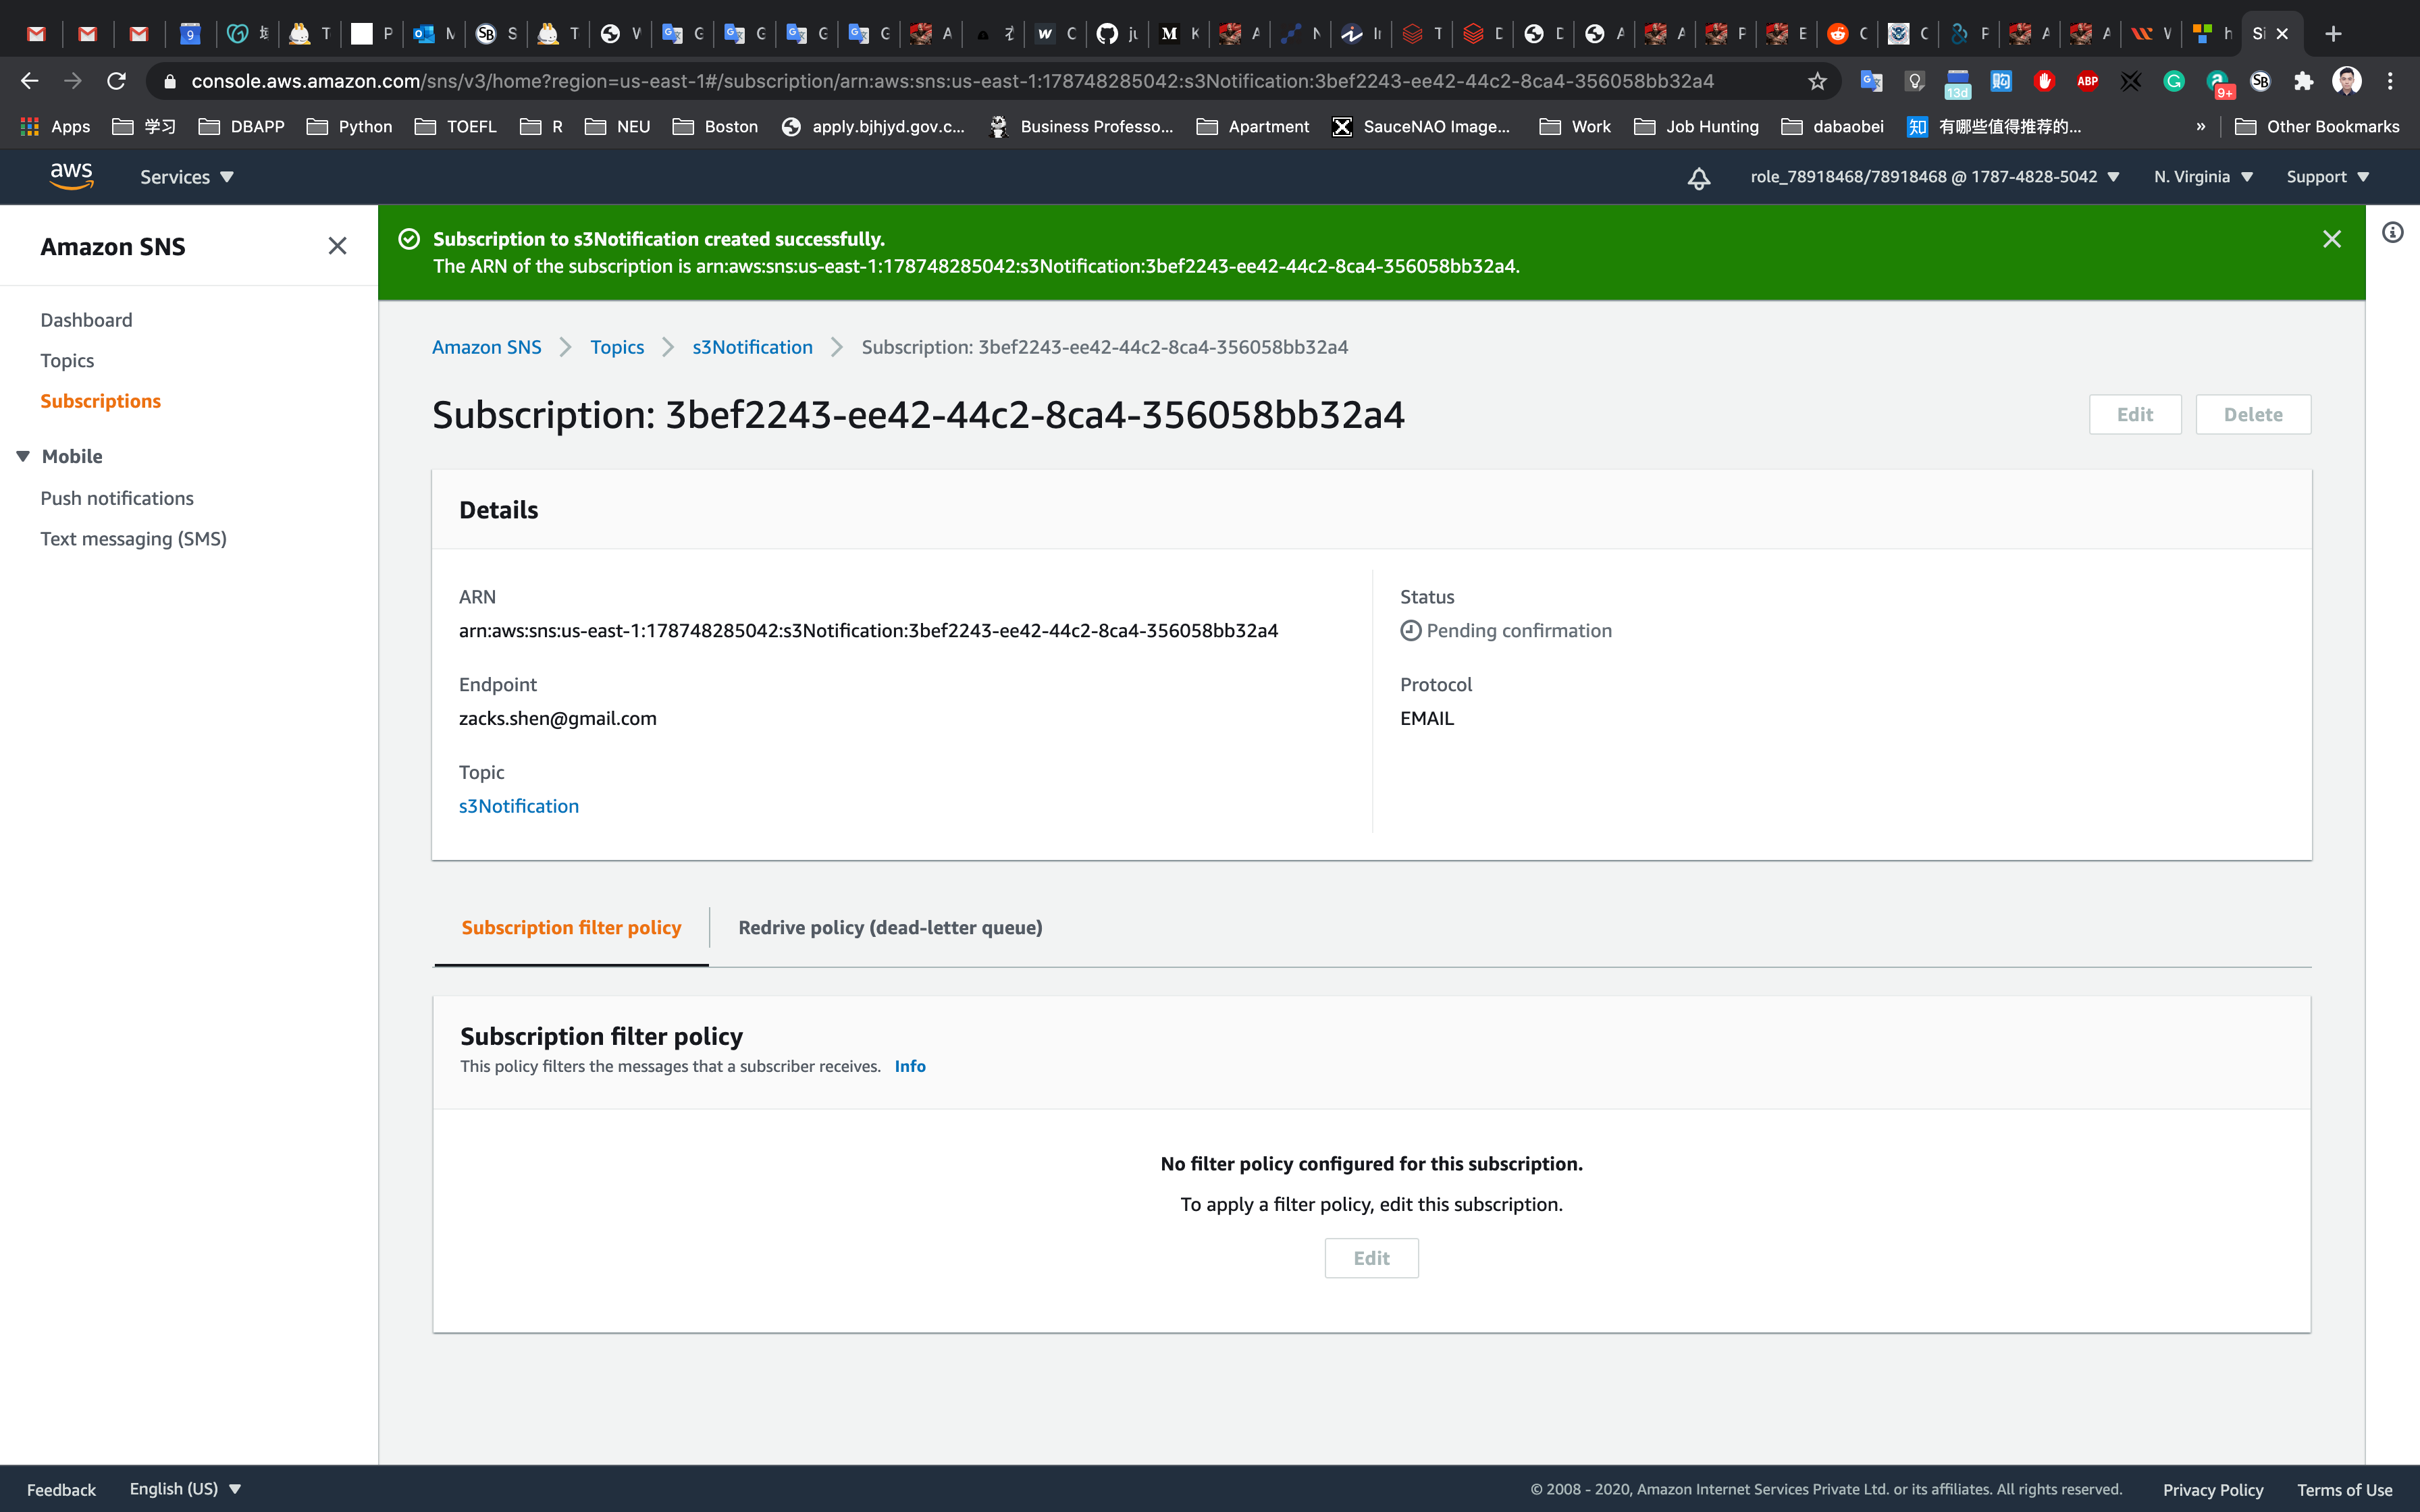
You will receive an email confirming your subscription to your email.
Click on Confirm subscription.
If you don’t receive the email, please check your Spam inbox.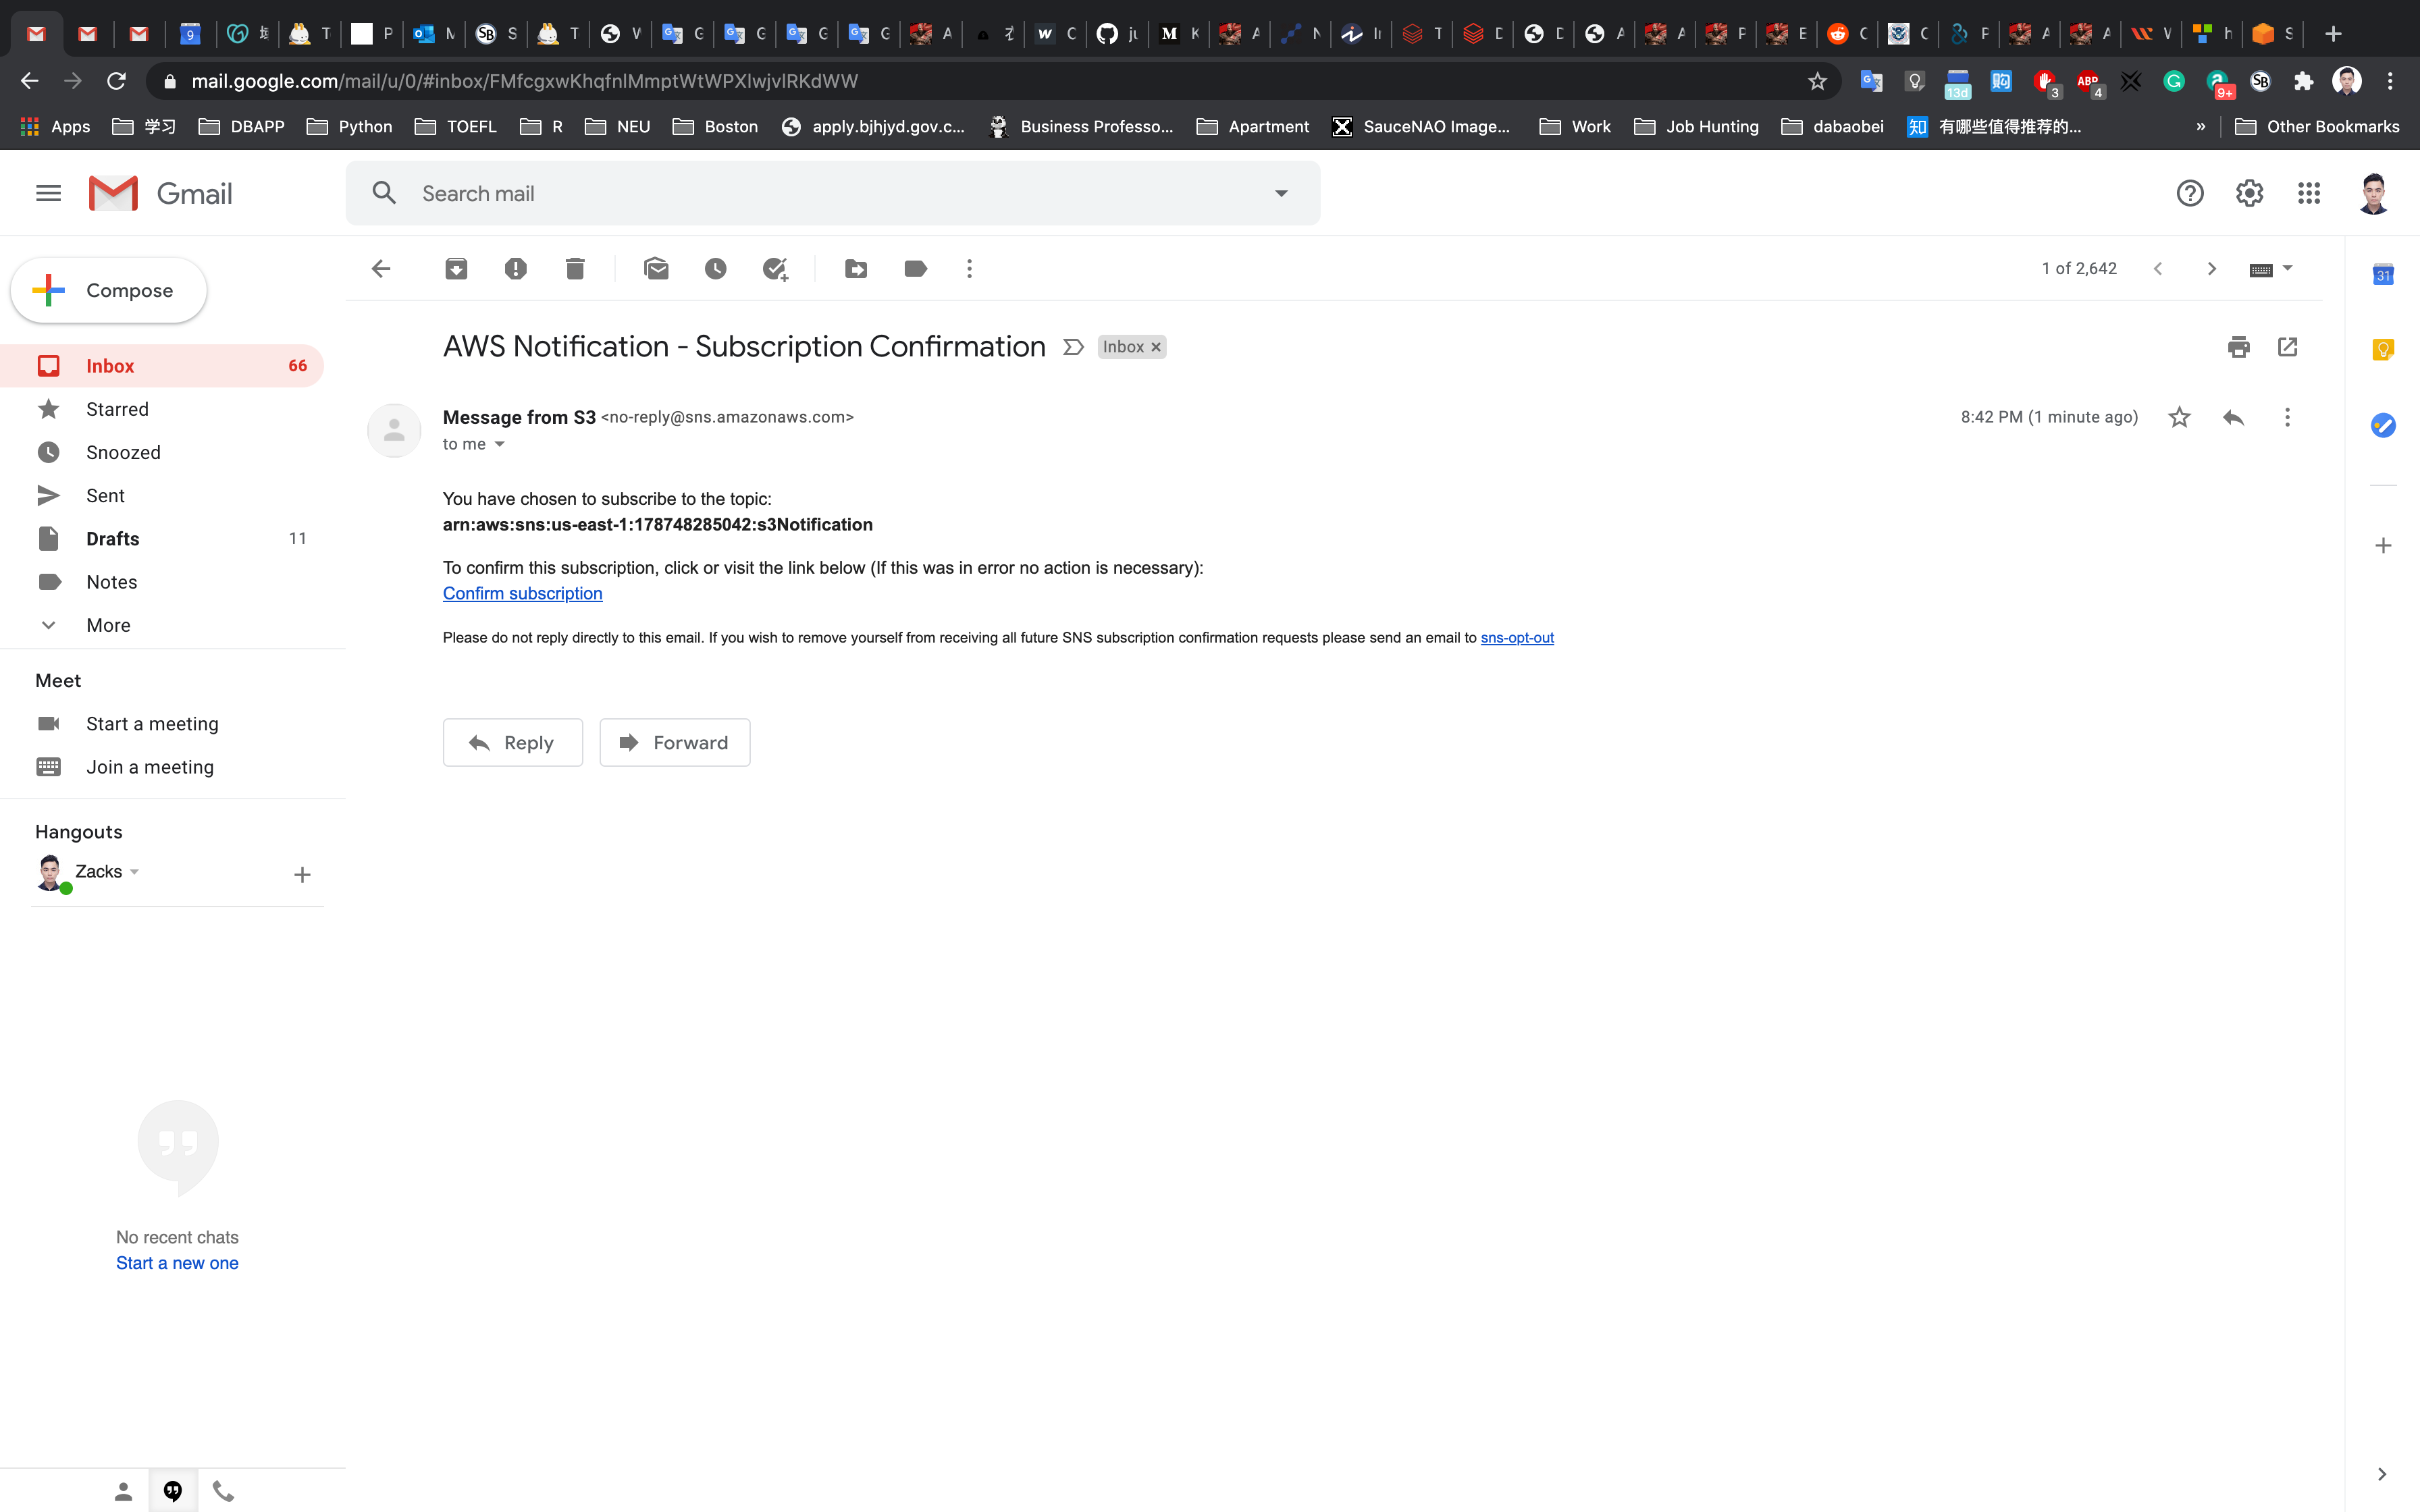
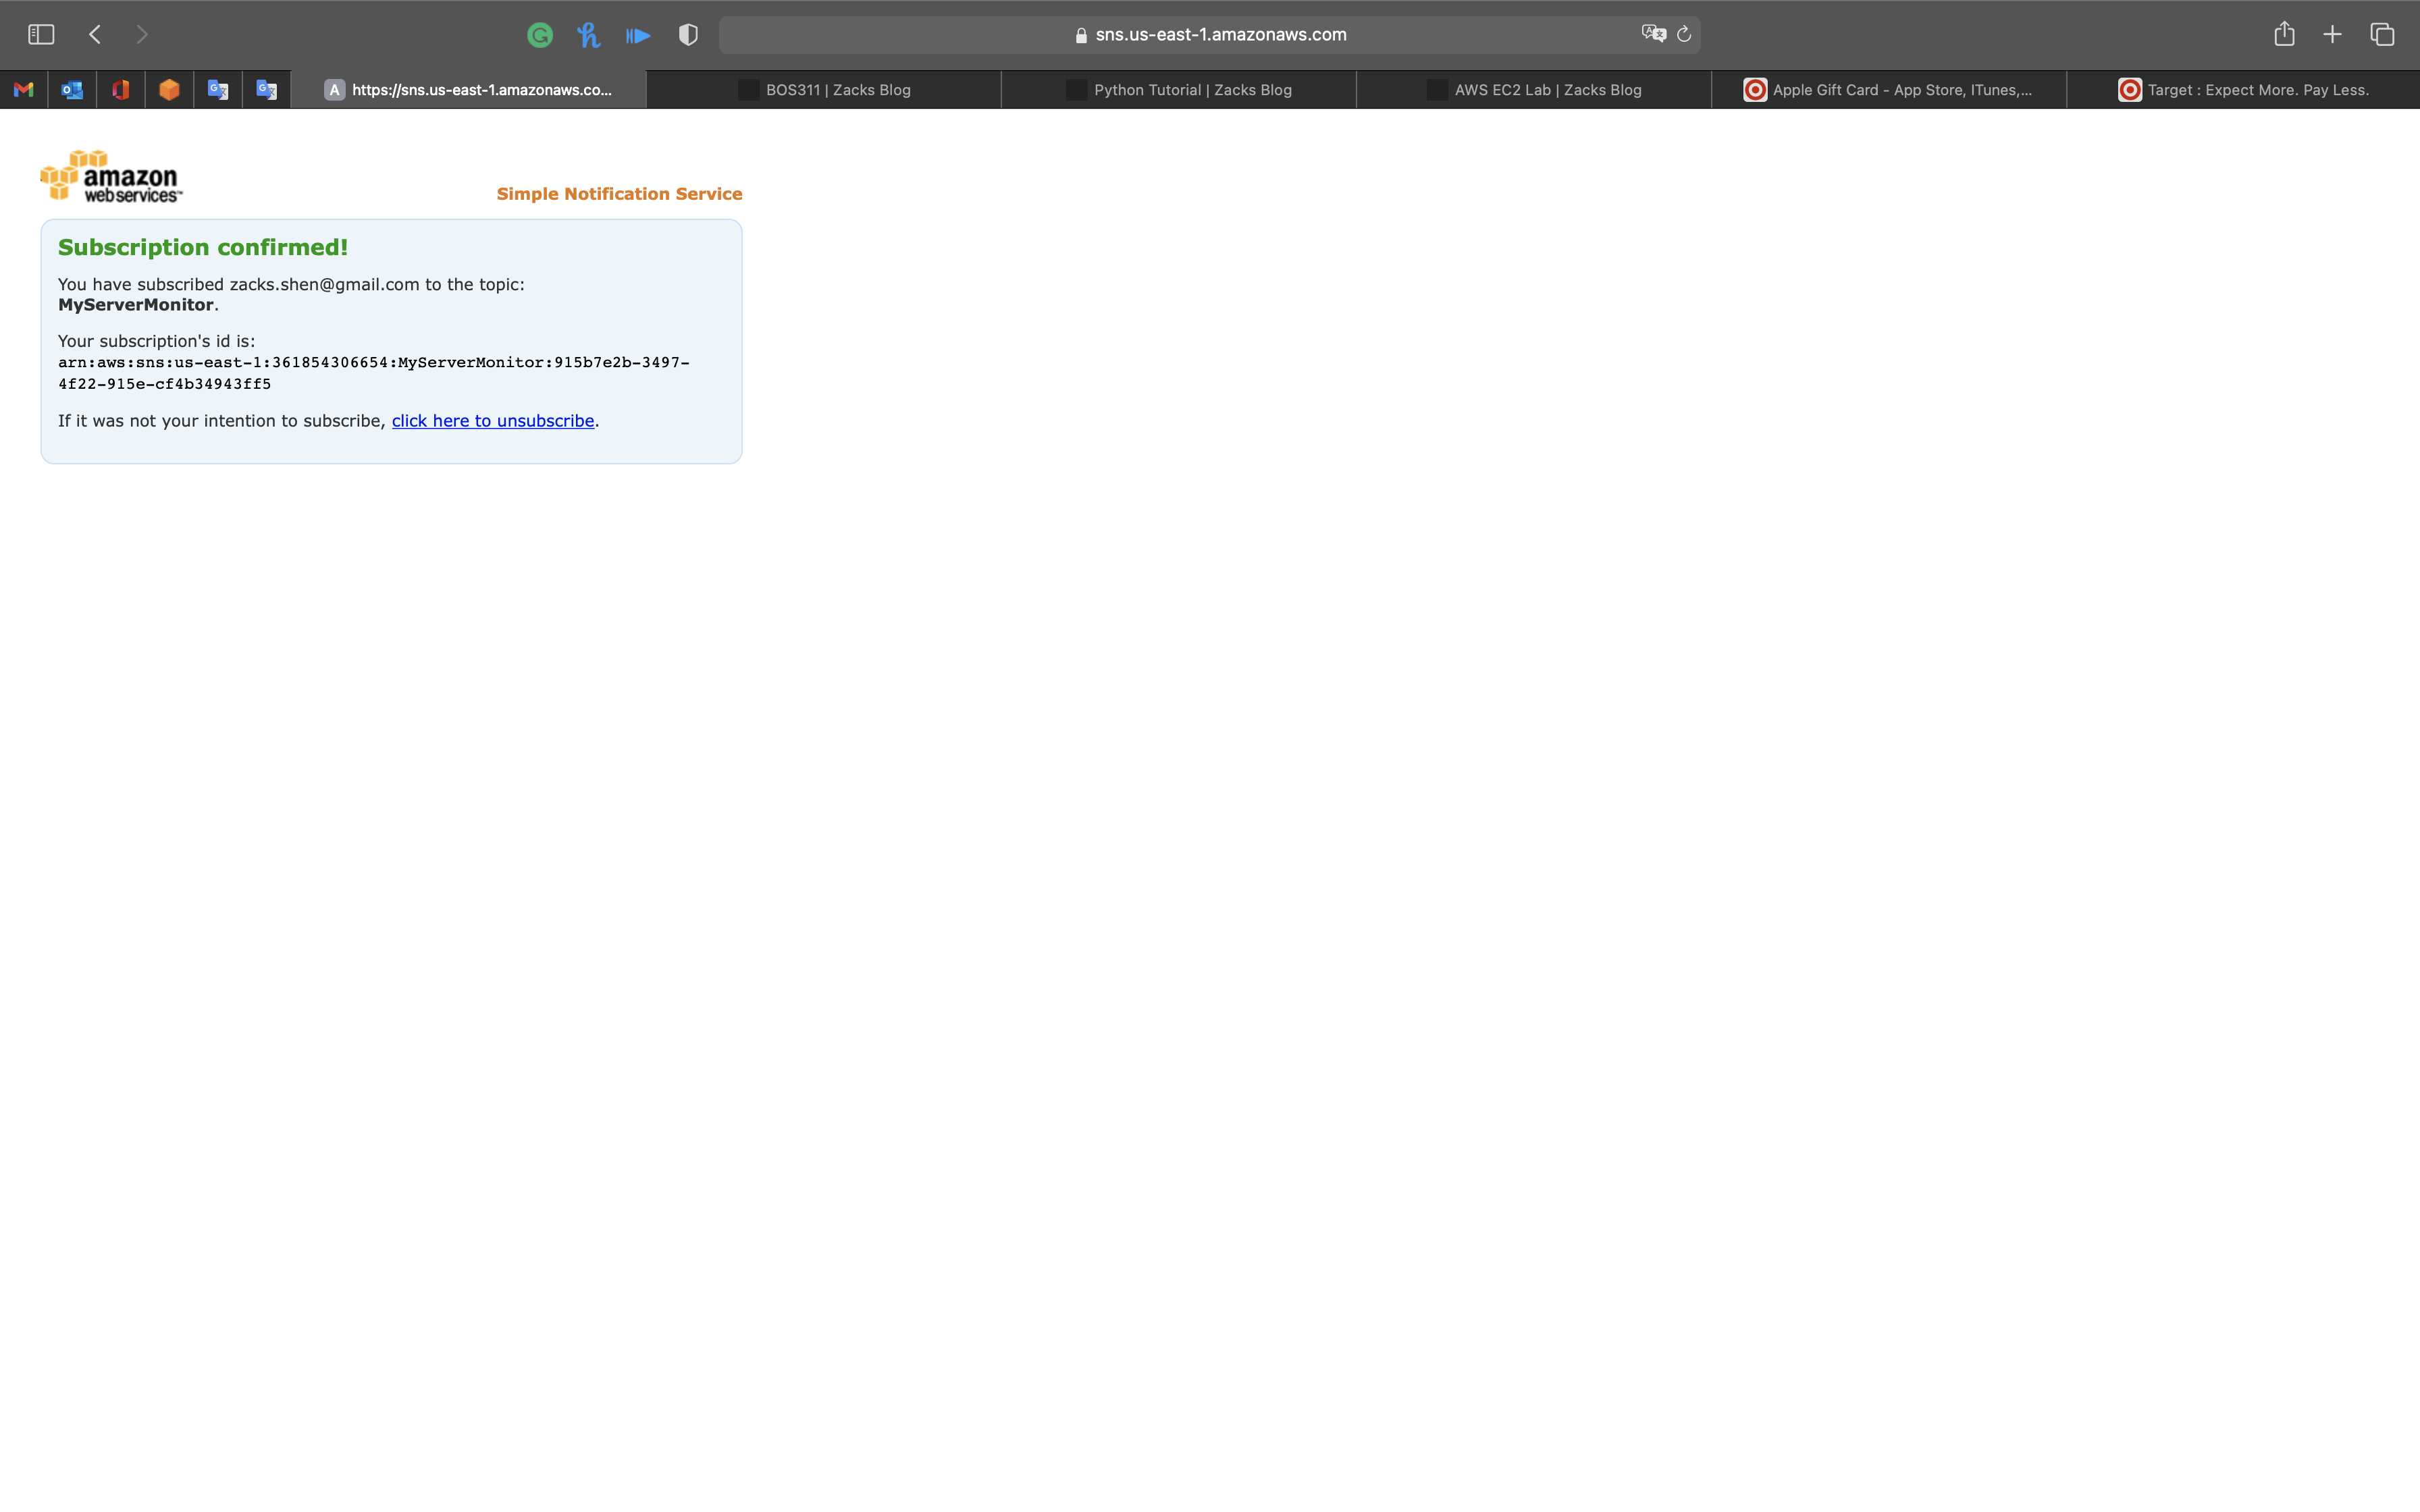
Your email address is now subscribed to the SNS Topic MyServerMonitor.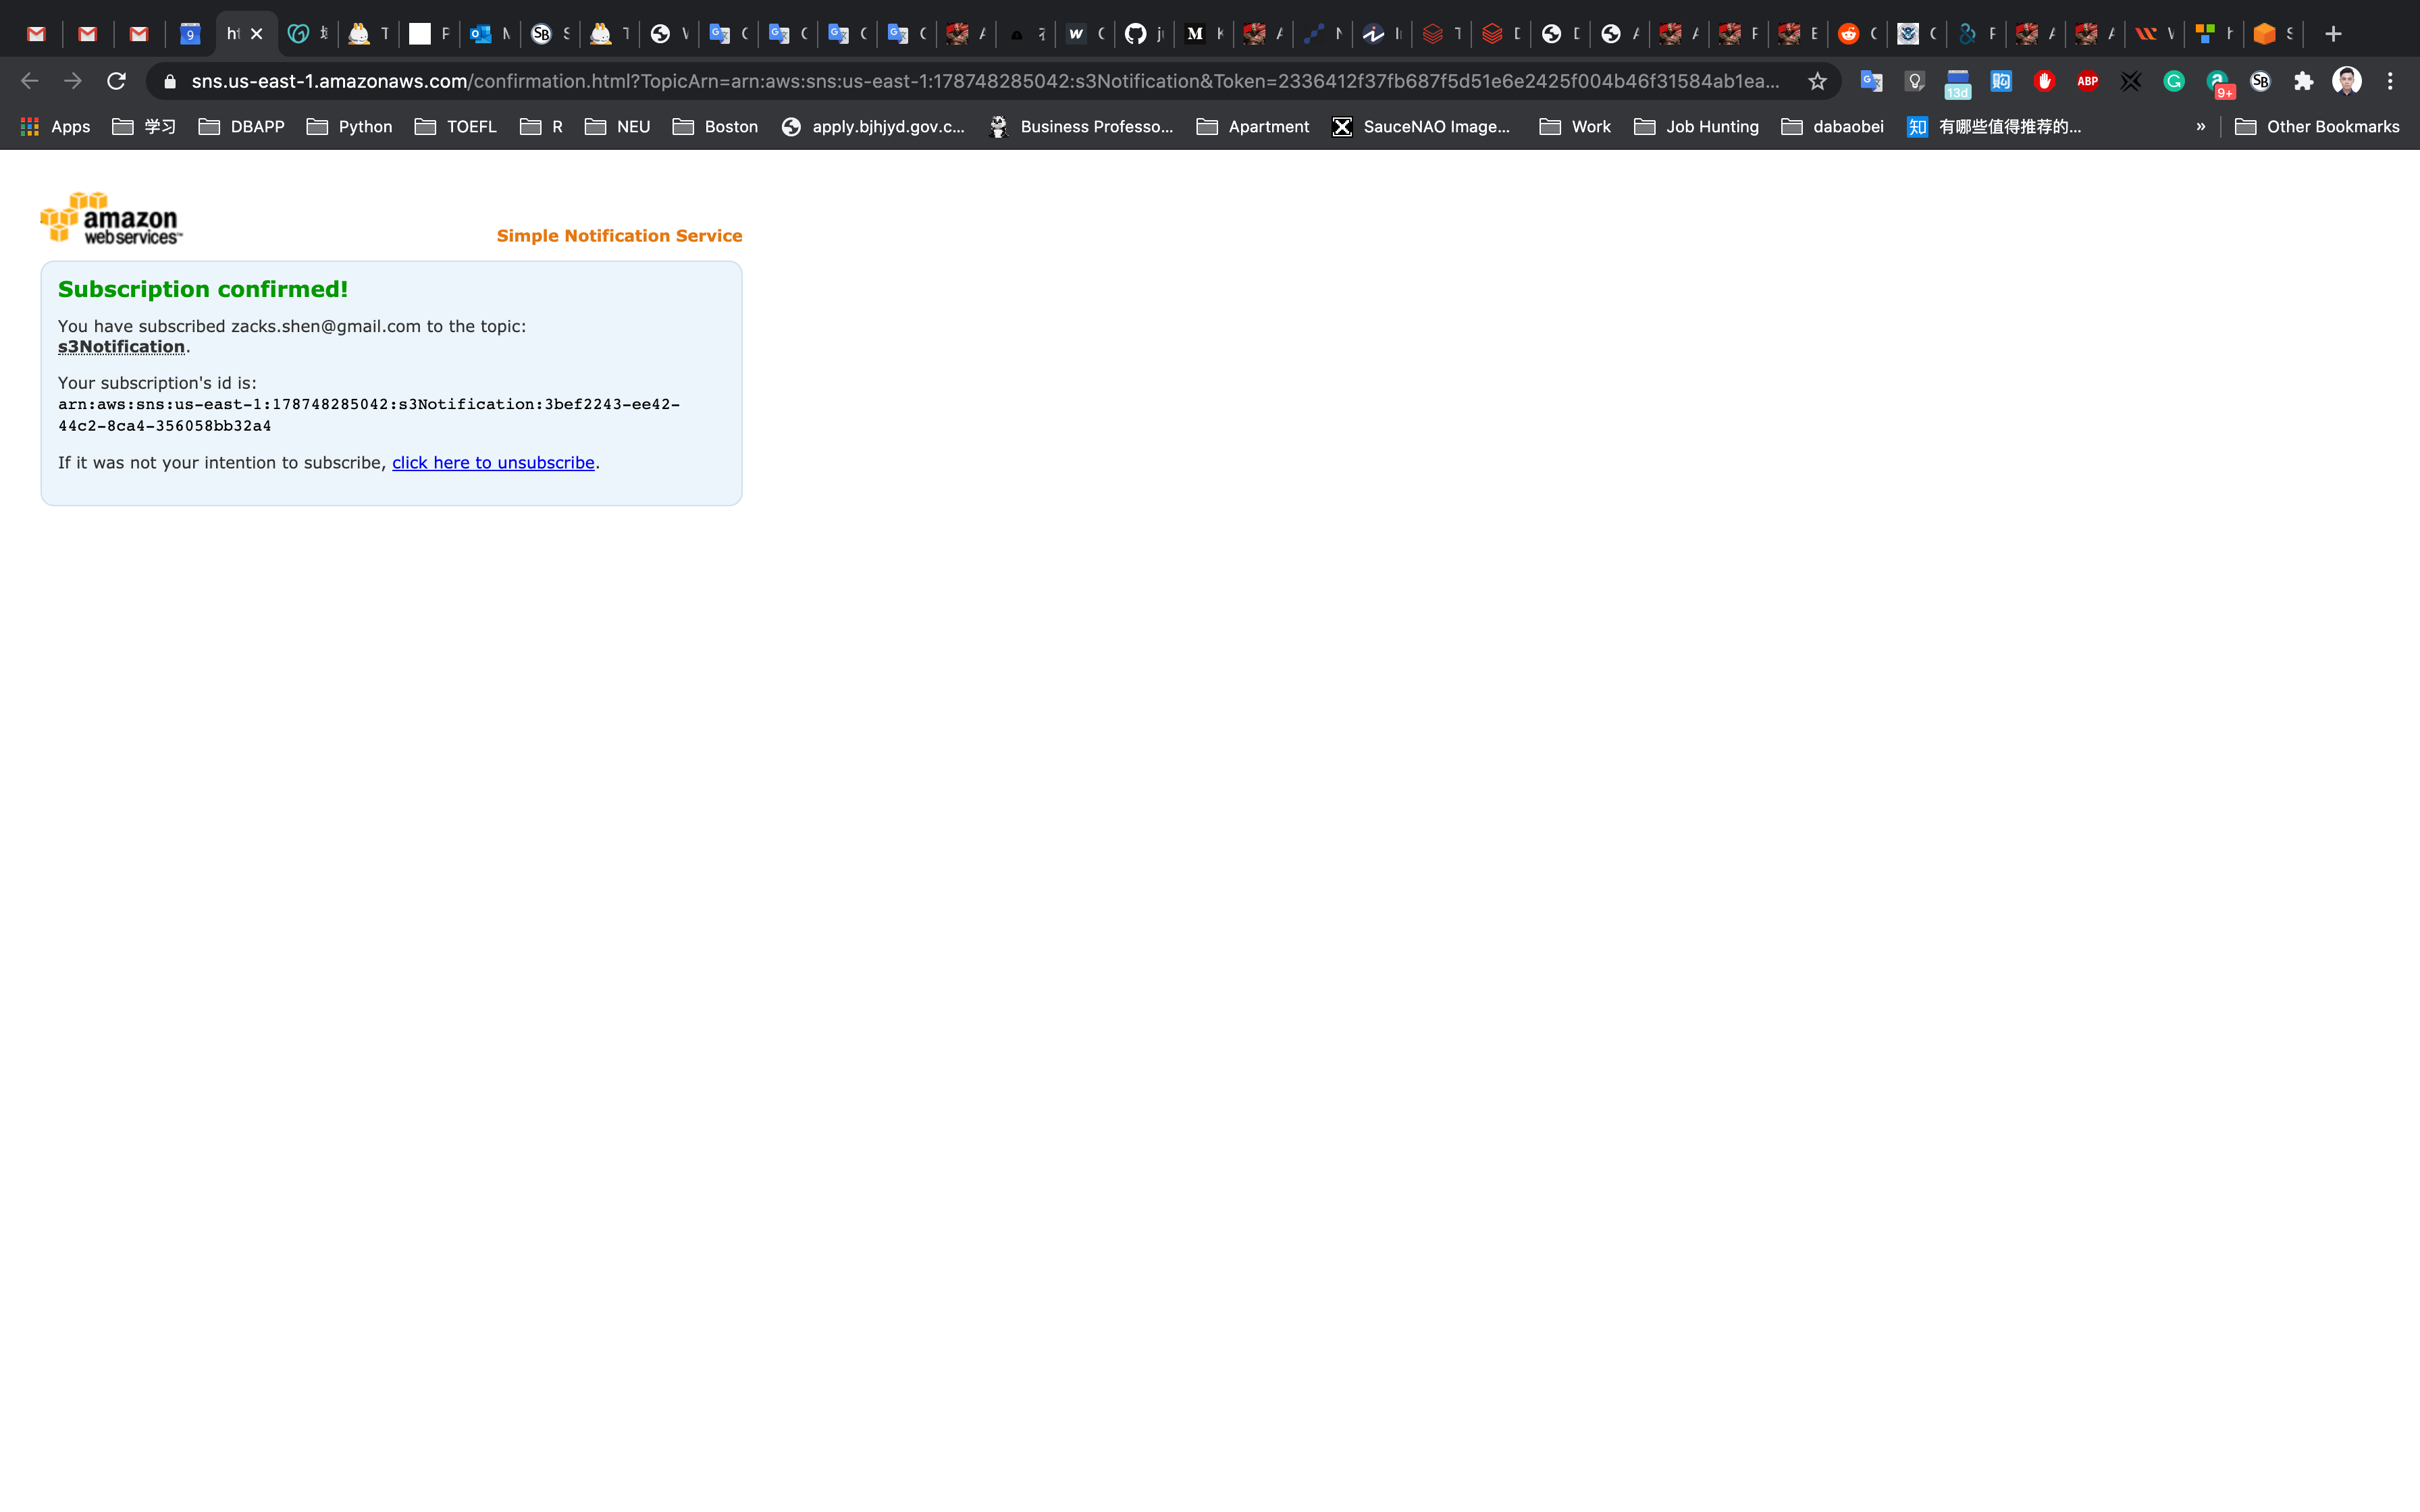
CloudWatch Configuration
Services -> CloudWatch
Using CloudWatch
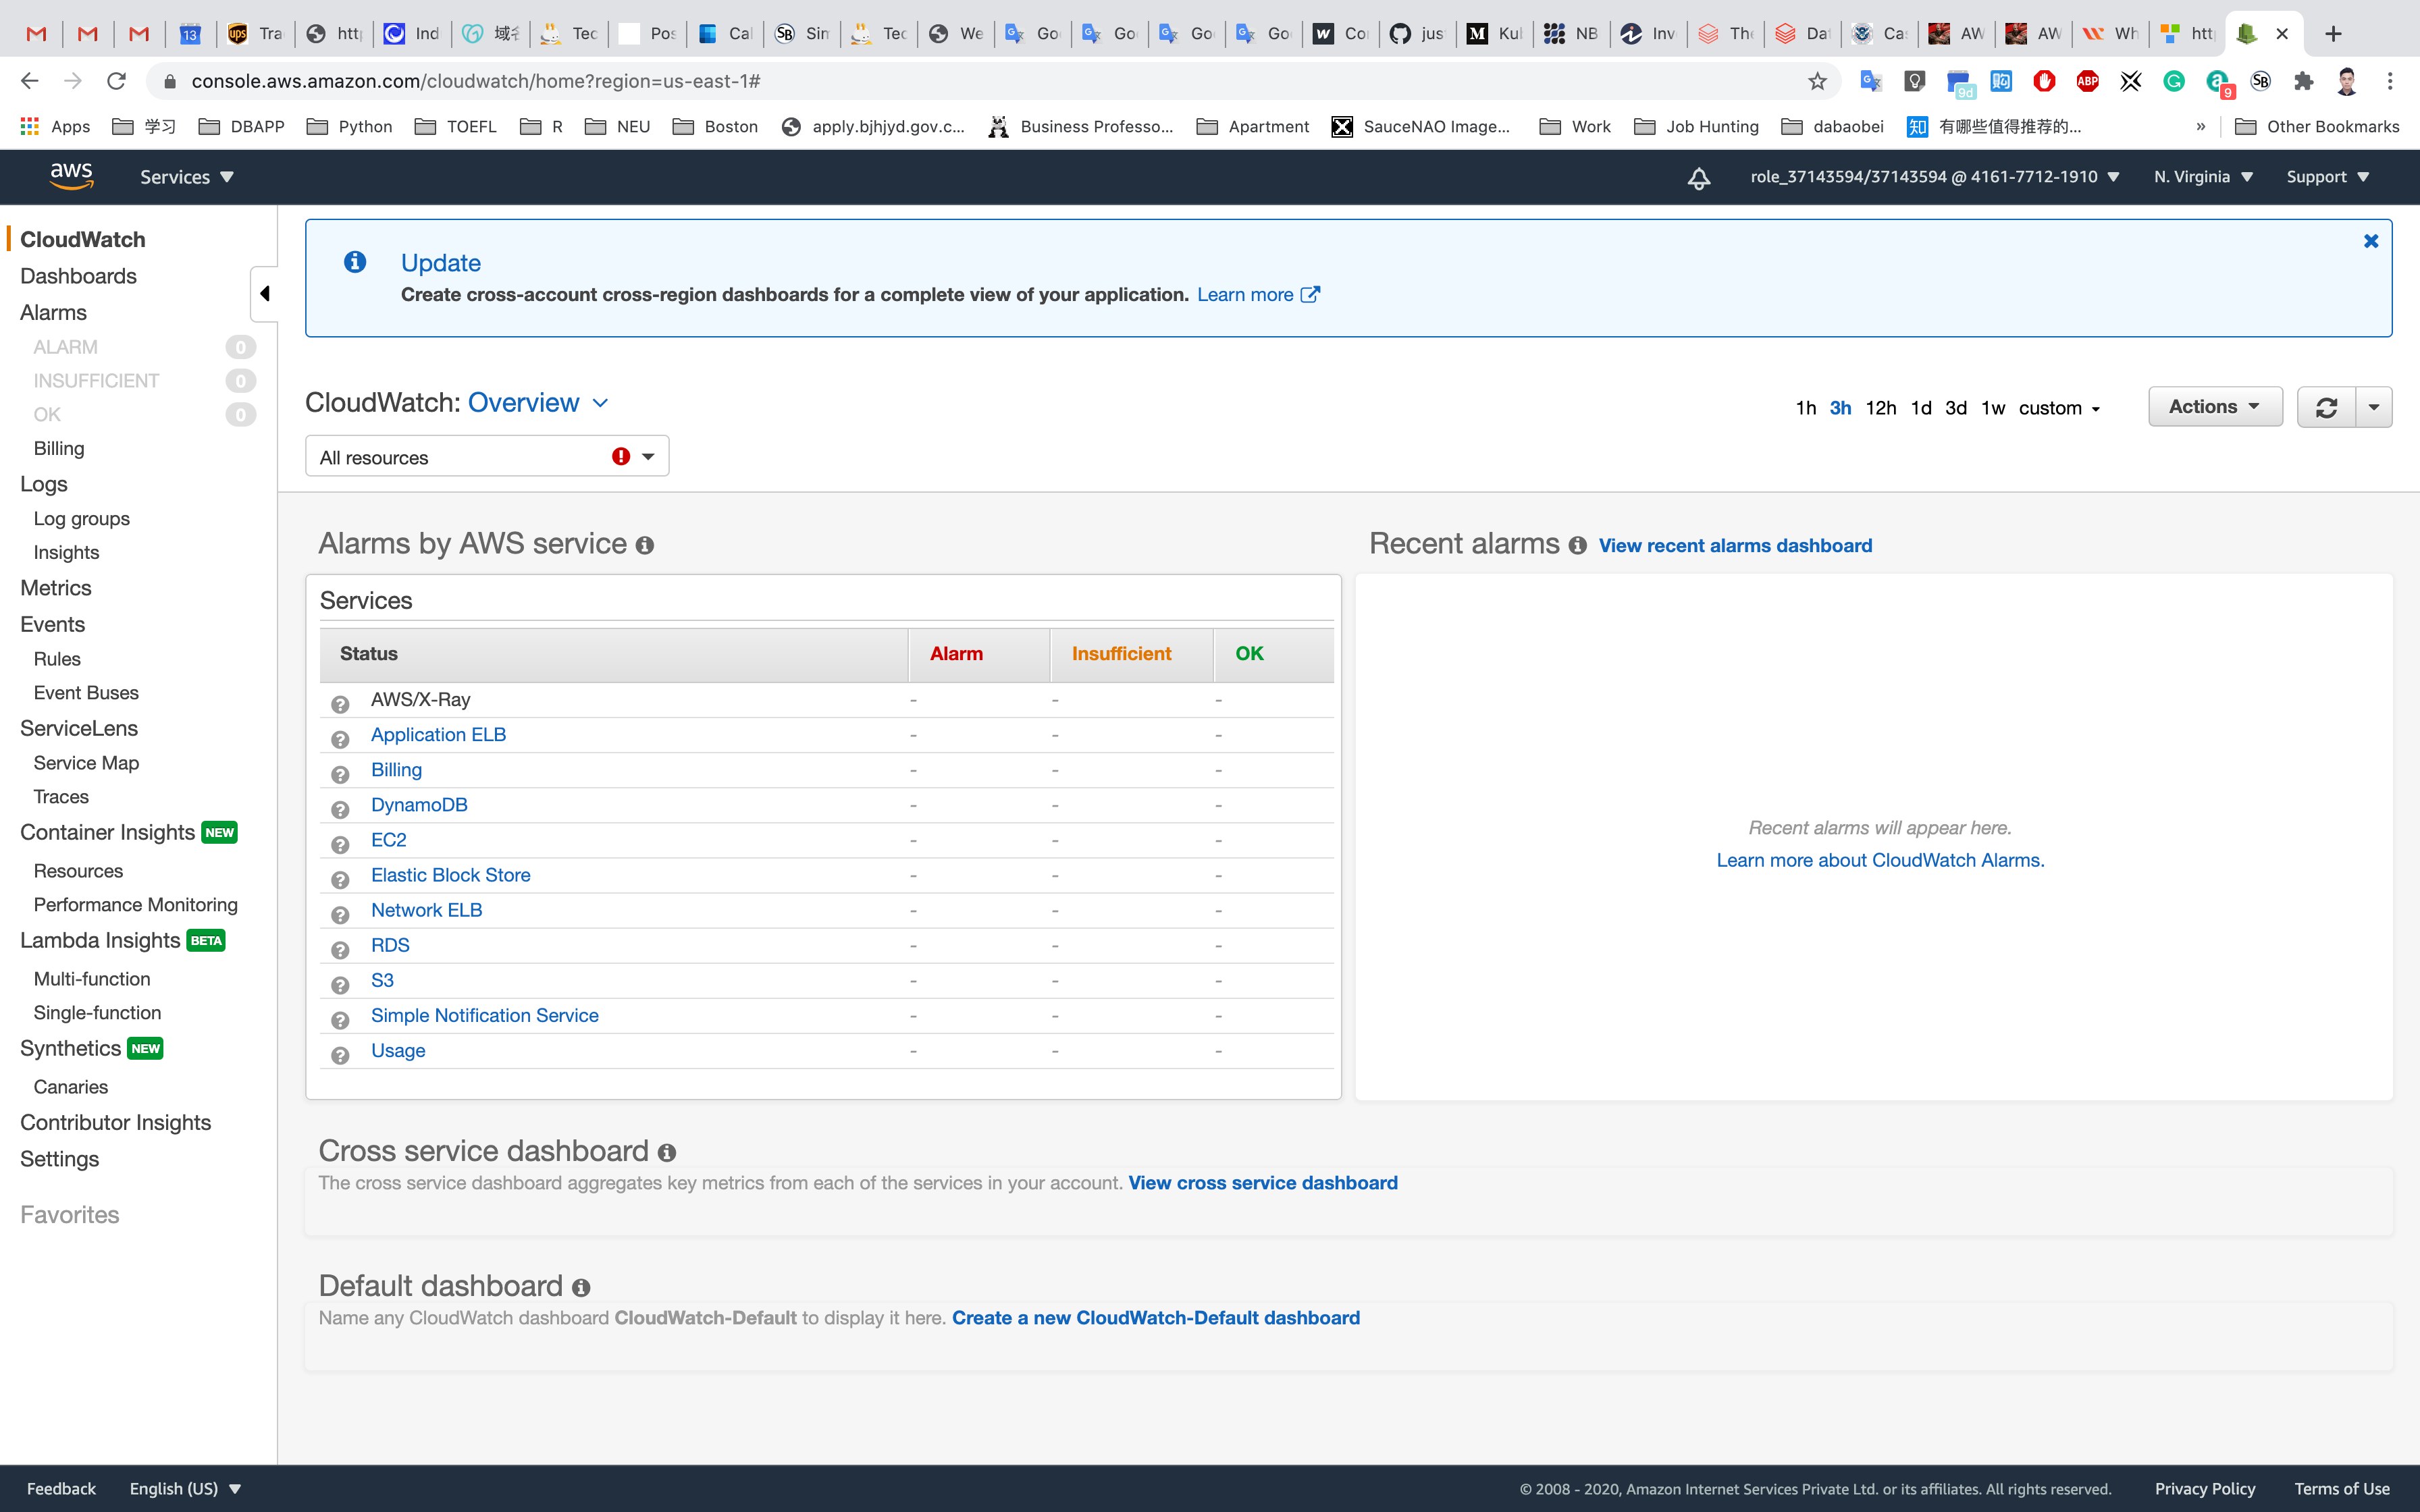
Check CPU Utilization Metrics
Click on Metrics in the Left Panel.
You should be able to see EC2 under All Metrics. If EC2 is not visible, please wait for 5-10 minutes, CloudWatch usually takes around 5-10 minutes after the creation of EC2 to start fetching metric details.
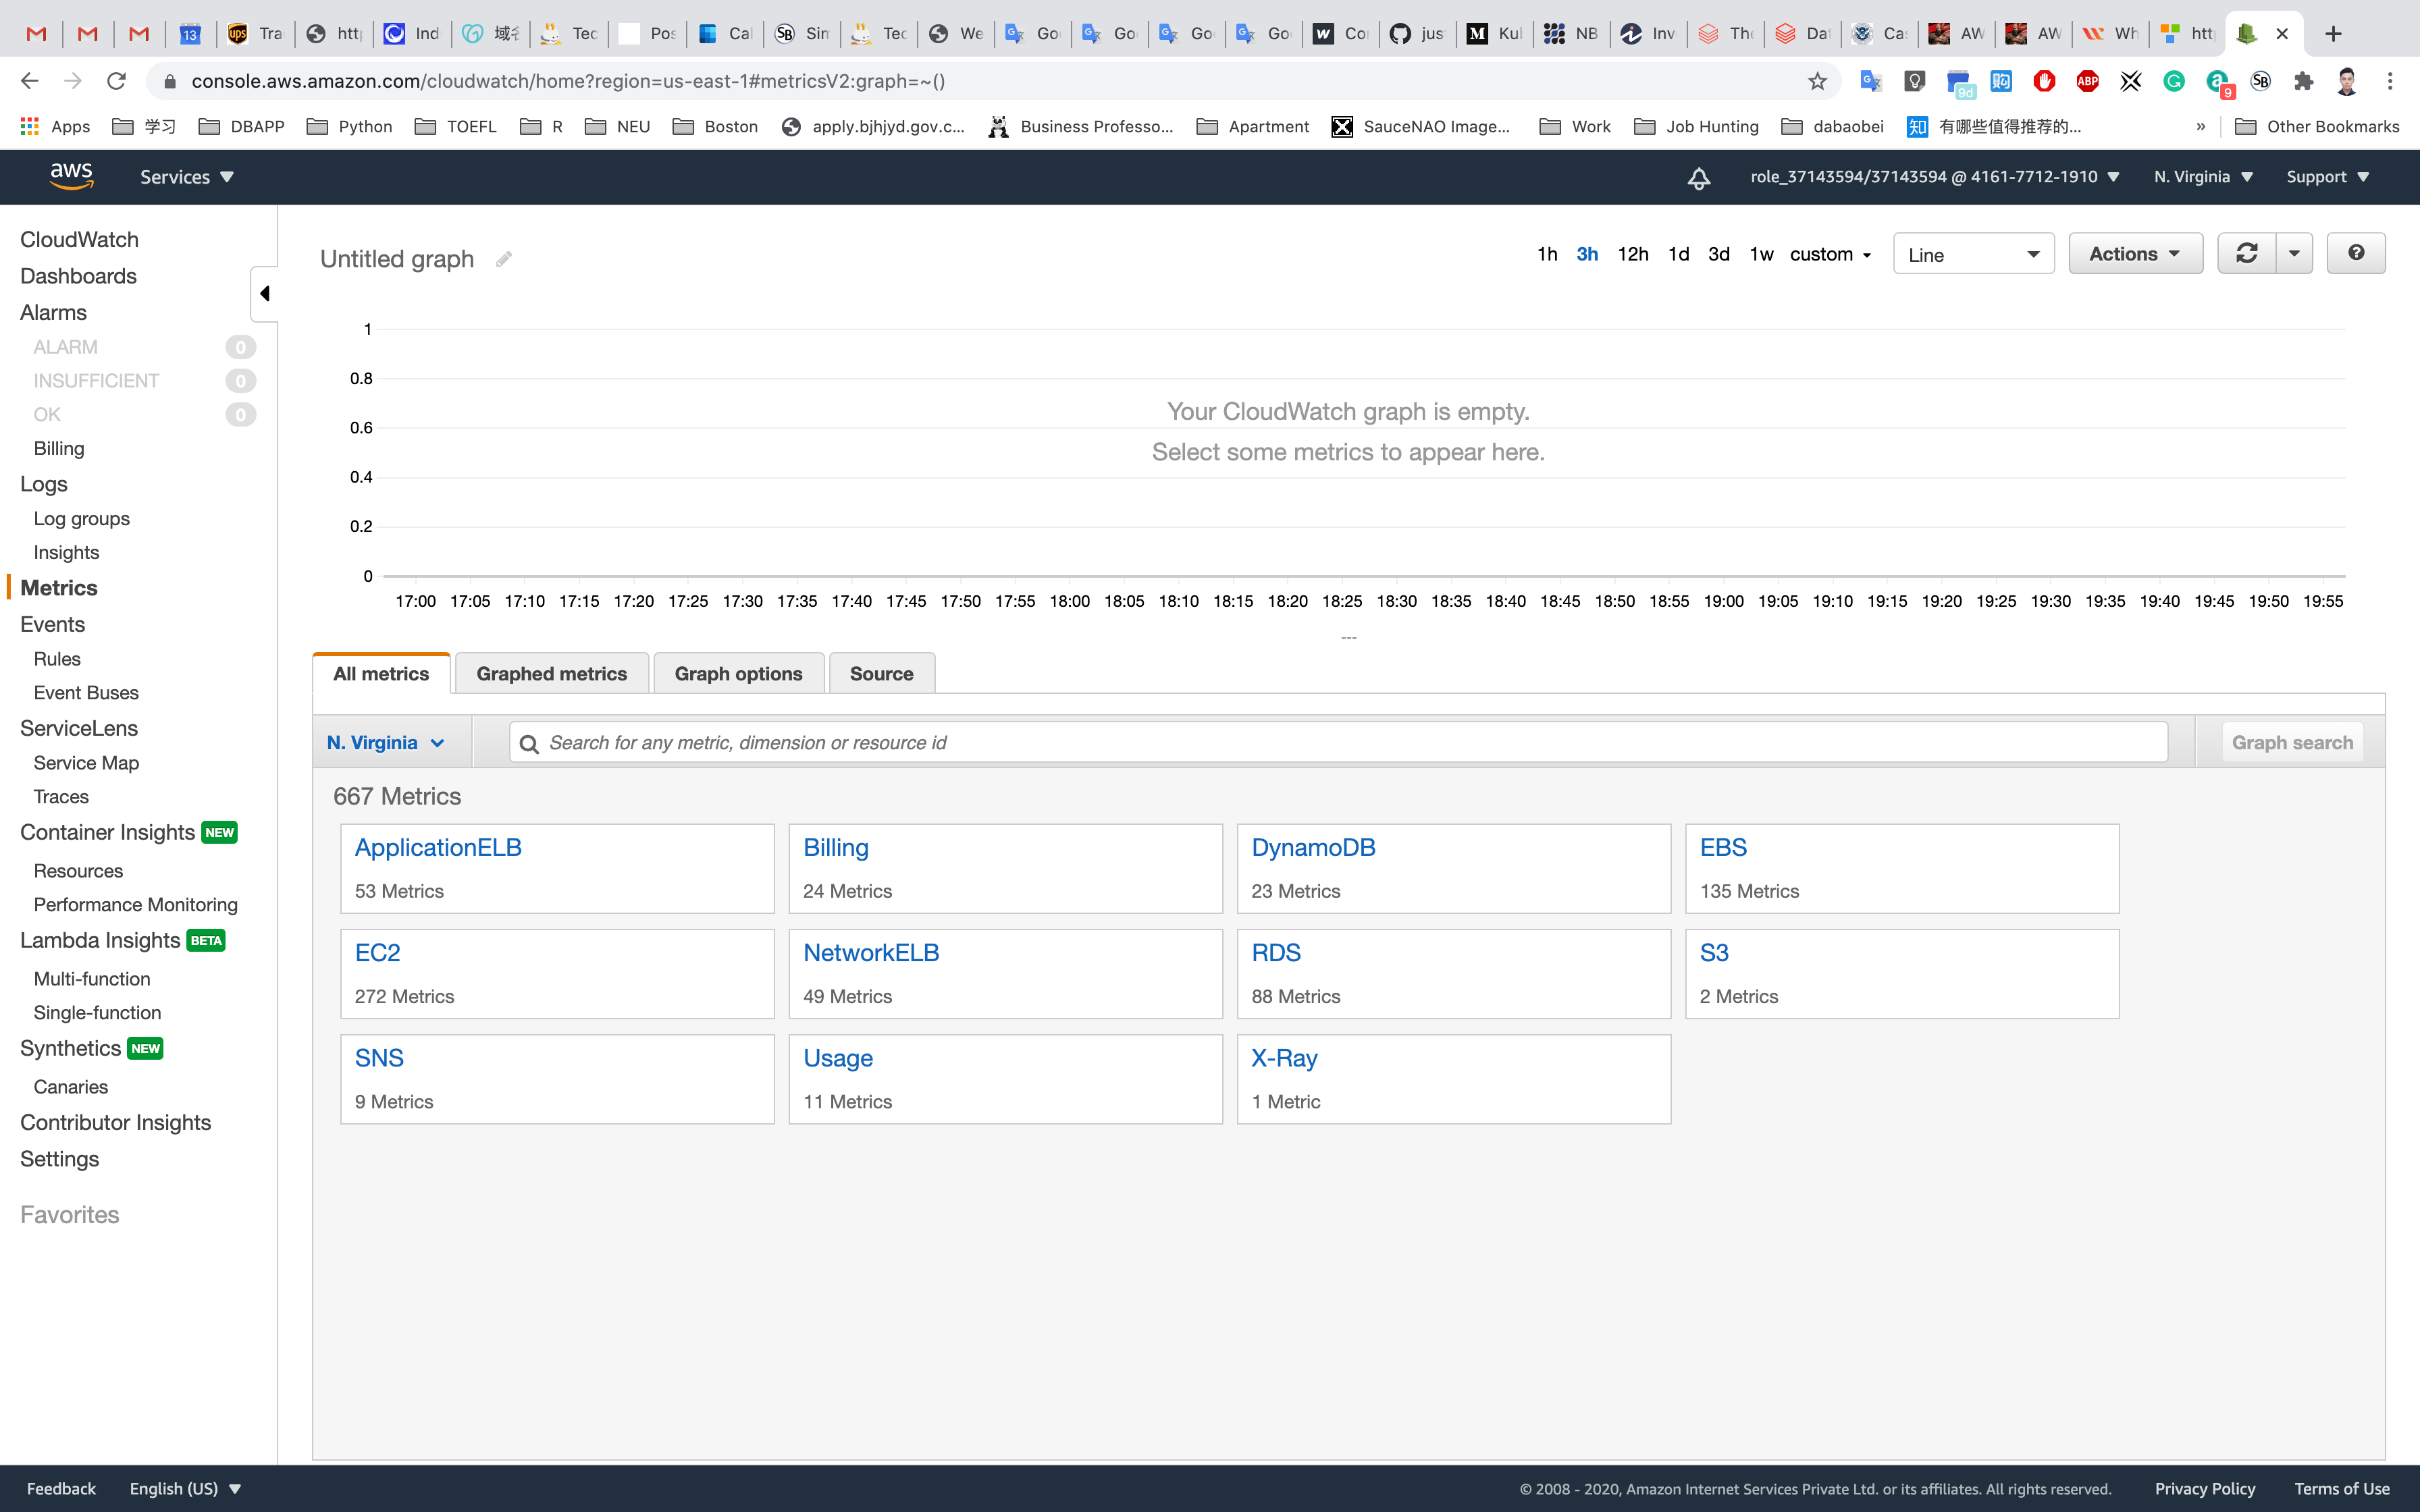
Click on EC2. Select Per-Instance Metrics.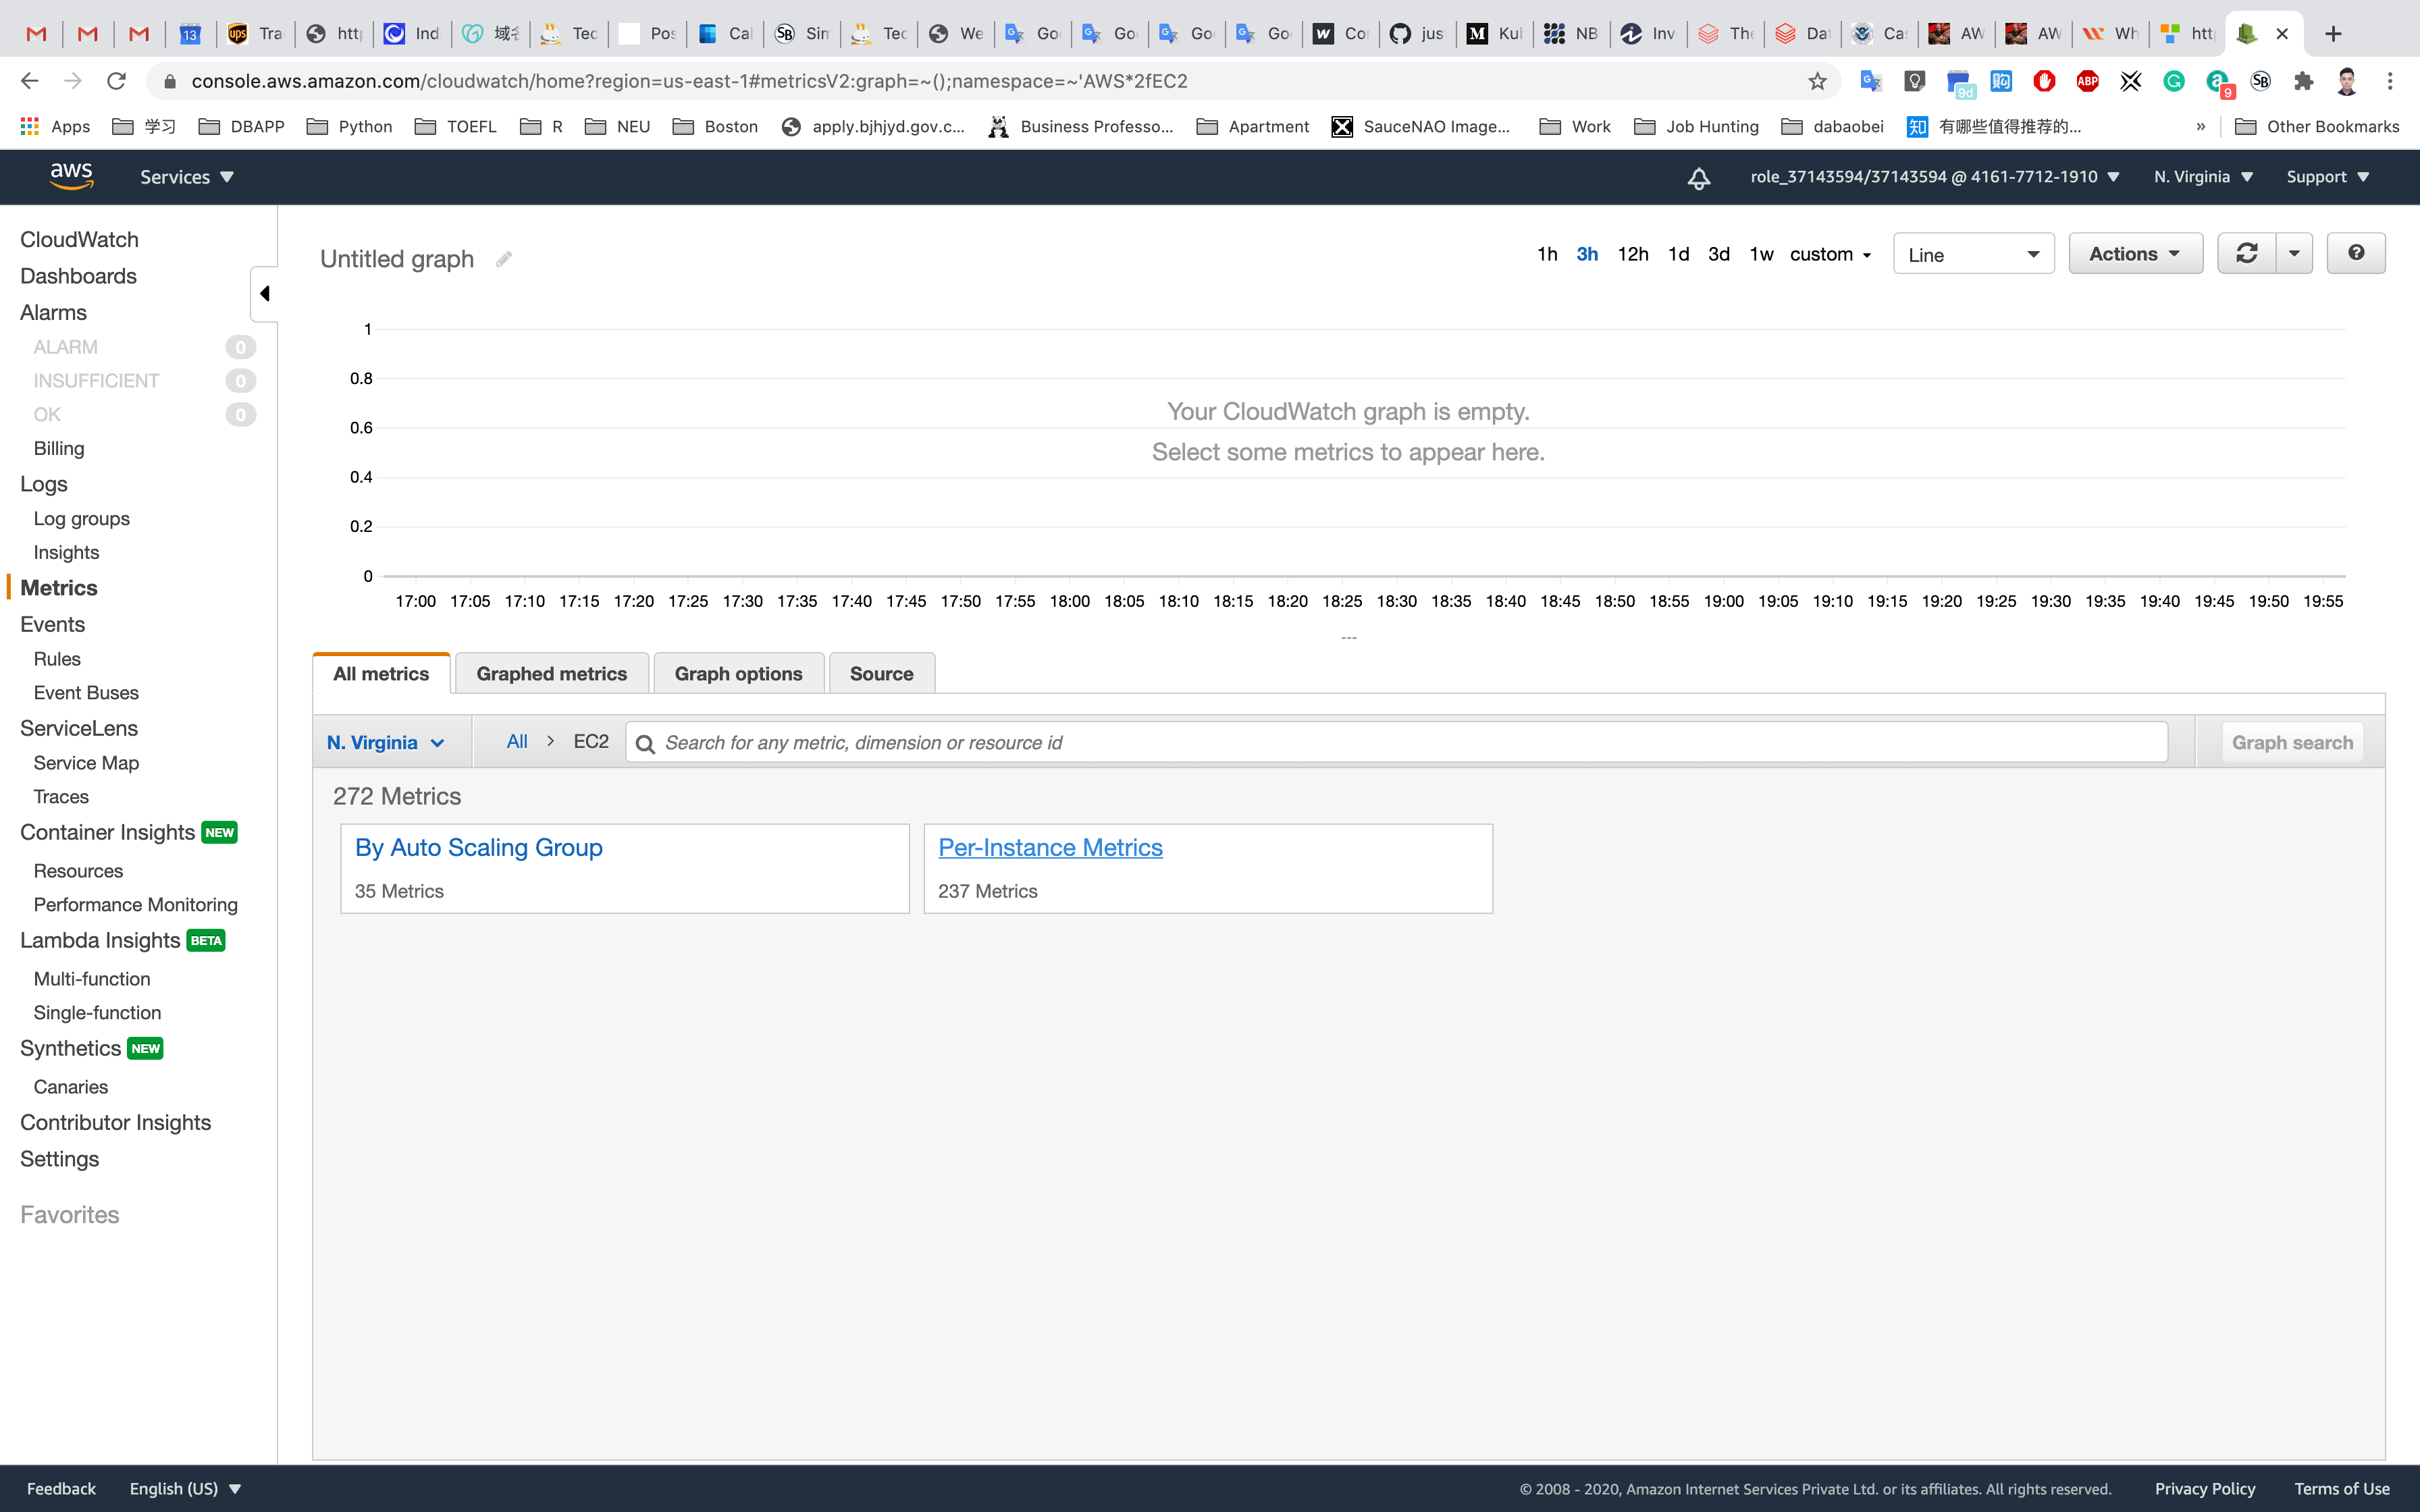
Here you can see various metrics. Select the CPUUtilization metric to see the graph.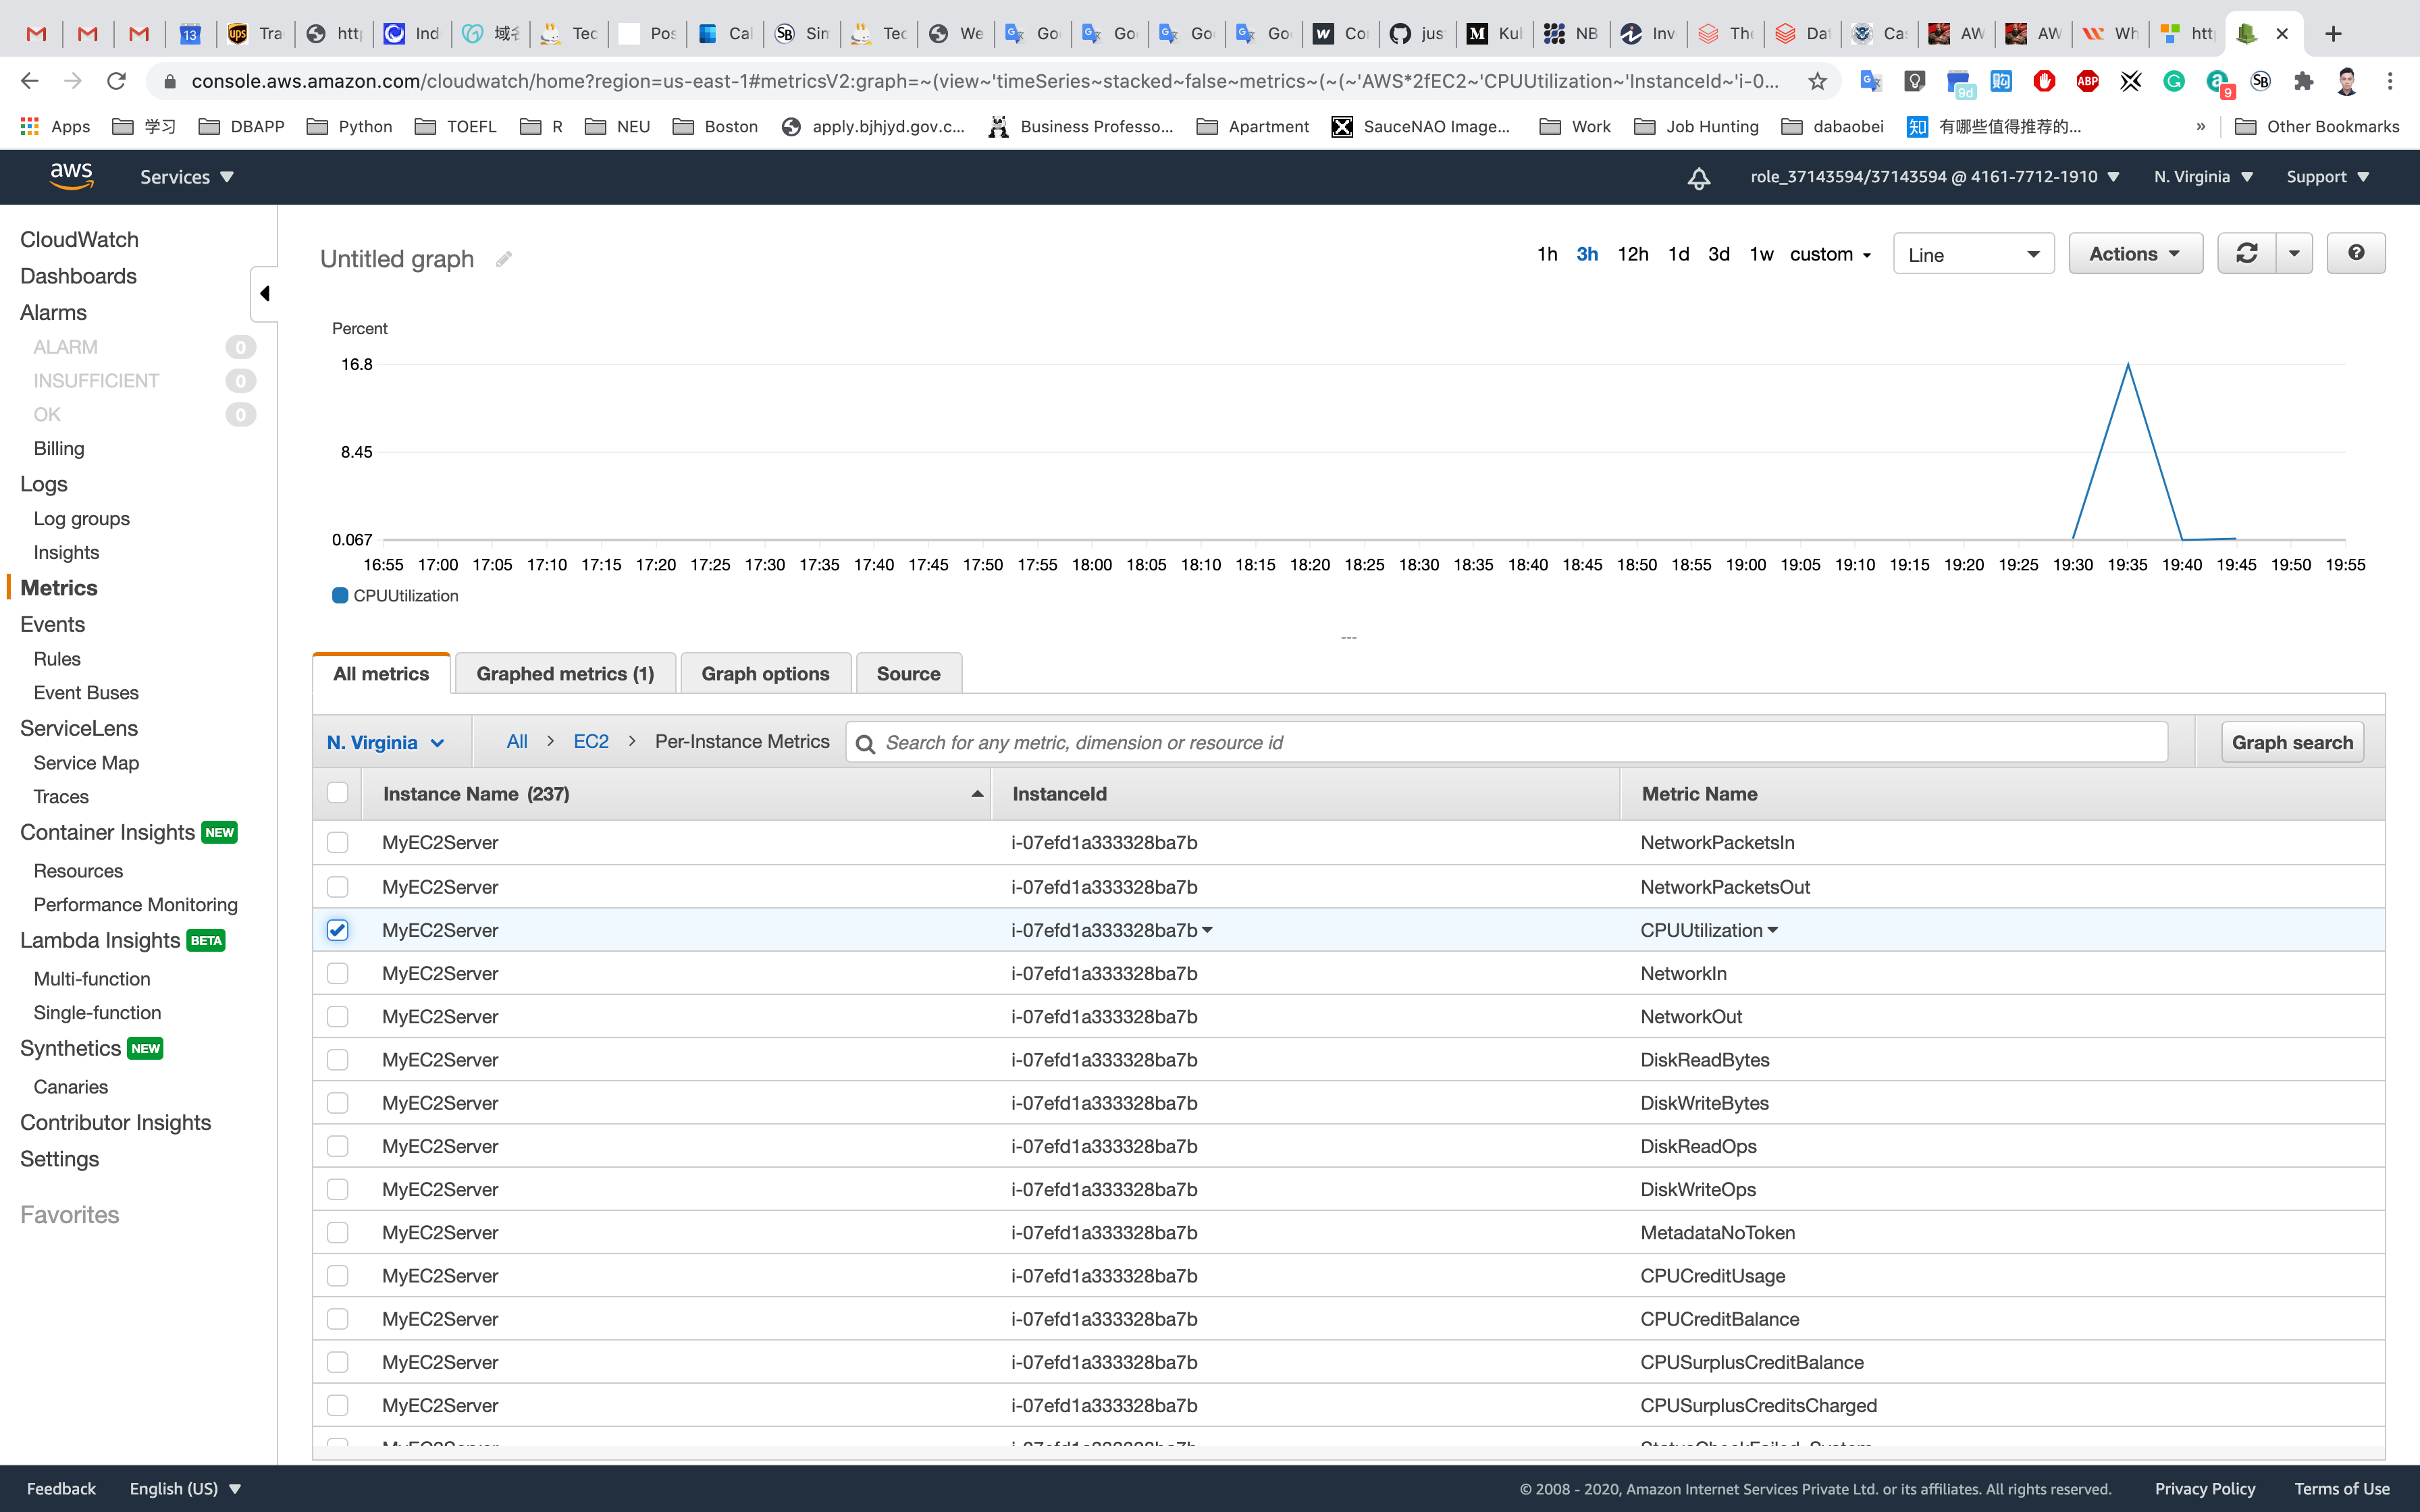
Now at the top of the screen, you can see the CPU Utilization graph (which is at zero since we have not stressed the CPU yet).
Create CloudWatch Alarm
CloudWatch alarms are used to watch a single CloudWatch metric or the result of a math expression based on CloudWatch metrics.
Click on Alarms in the left panel of the CloudWatch dashboard.
To create a new Alarm, click on Create alarm.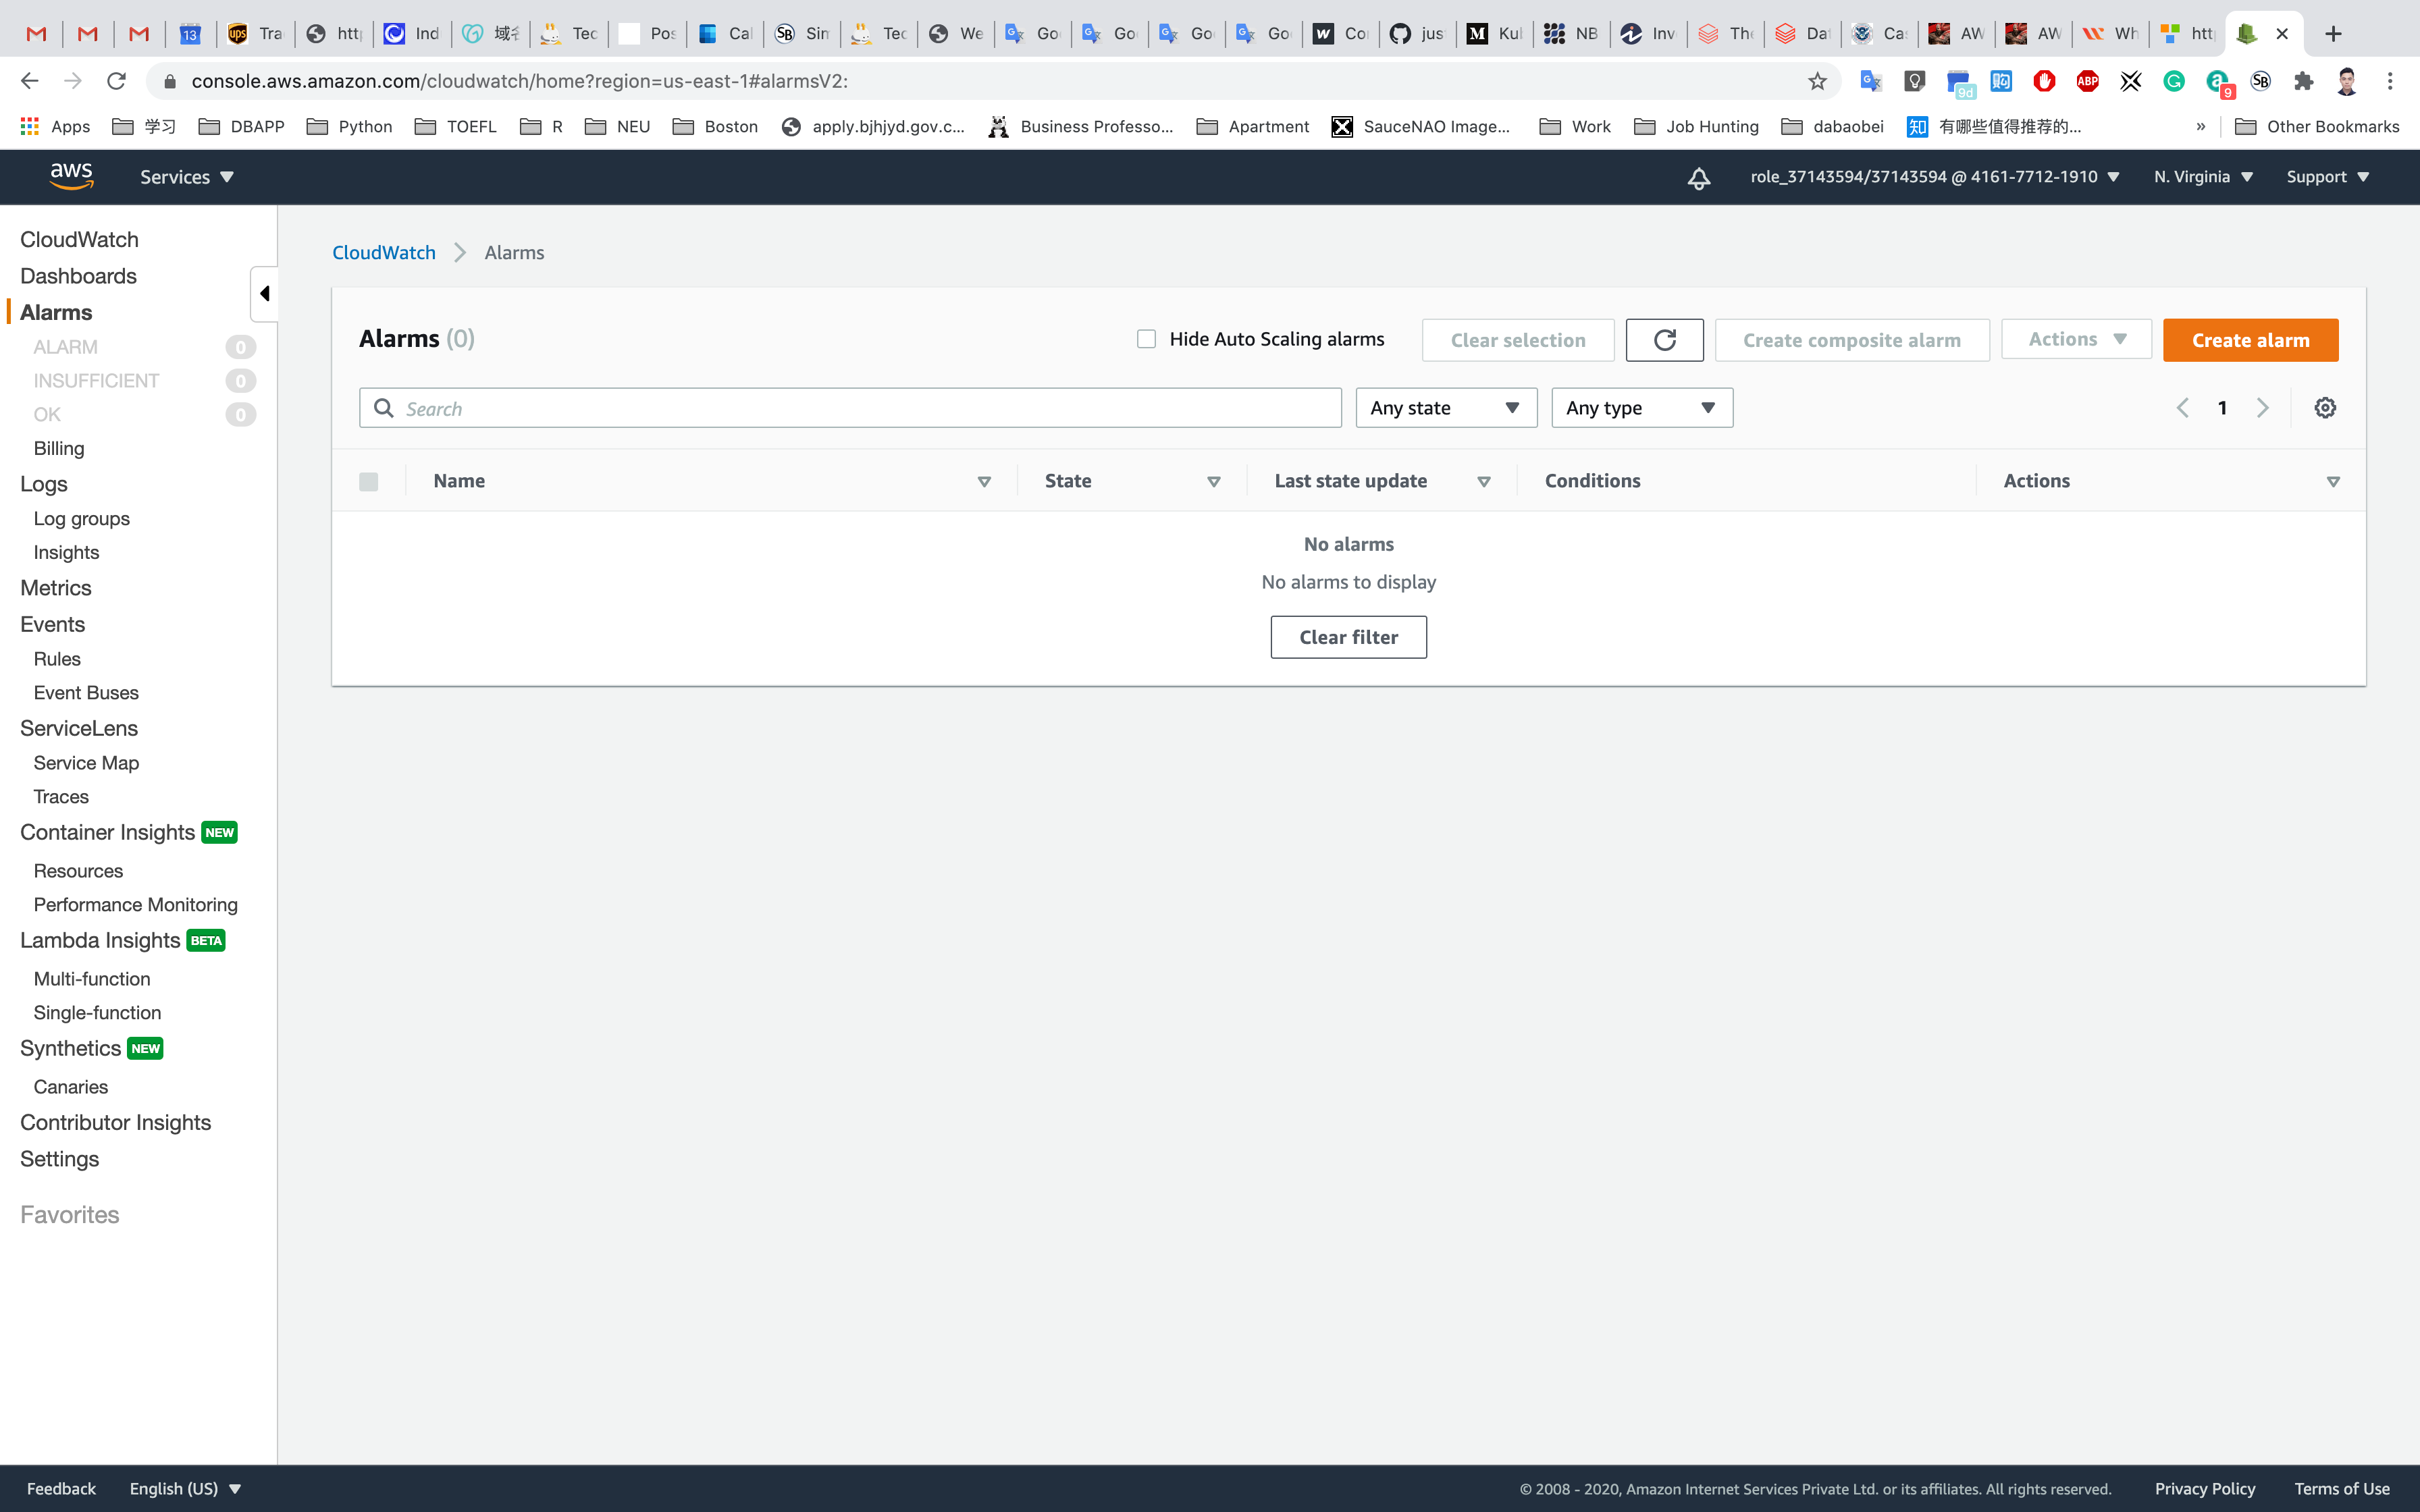
In the Specify metric and conditions page:
- Click on
select Metric. It will open the All Metrics page. - Choose
EC2. - Select
Per-Instance Metrics - Enter your EC2 Instance-ID in the search bar to get metrics for MyEC2Server, copy it from Services -> EC2 -> Instances
- Select the
CPUUtilizationmetric.
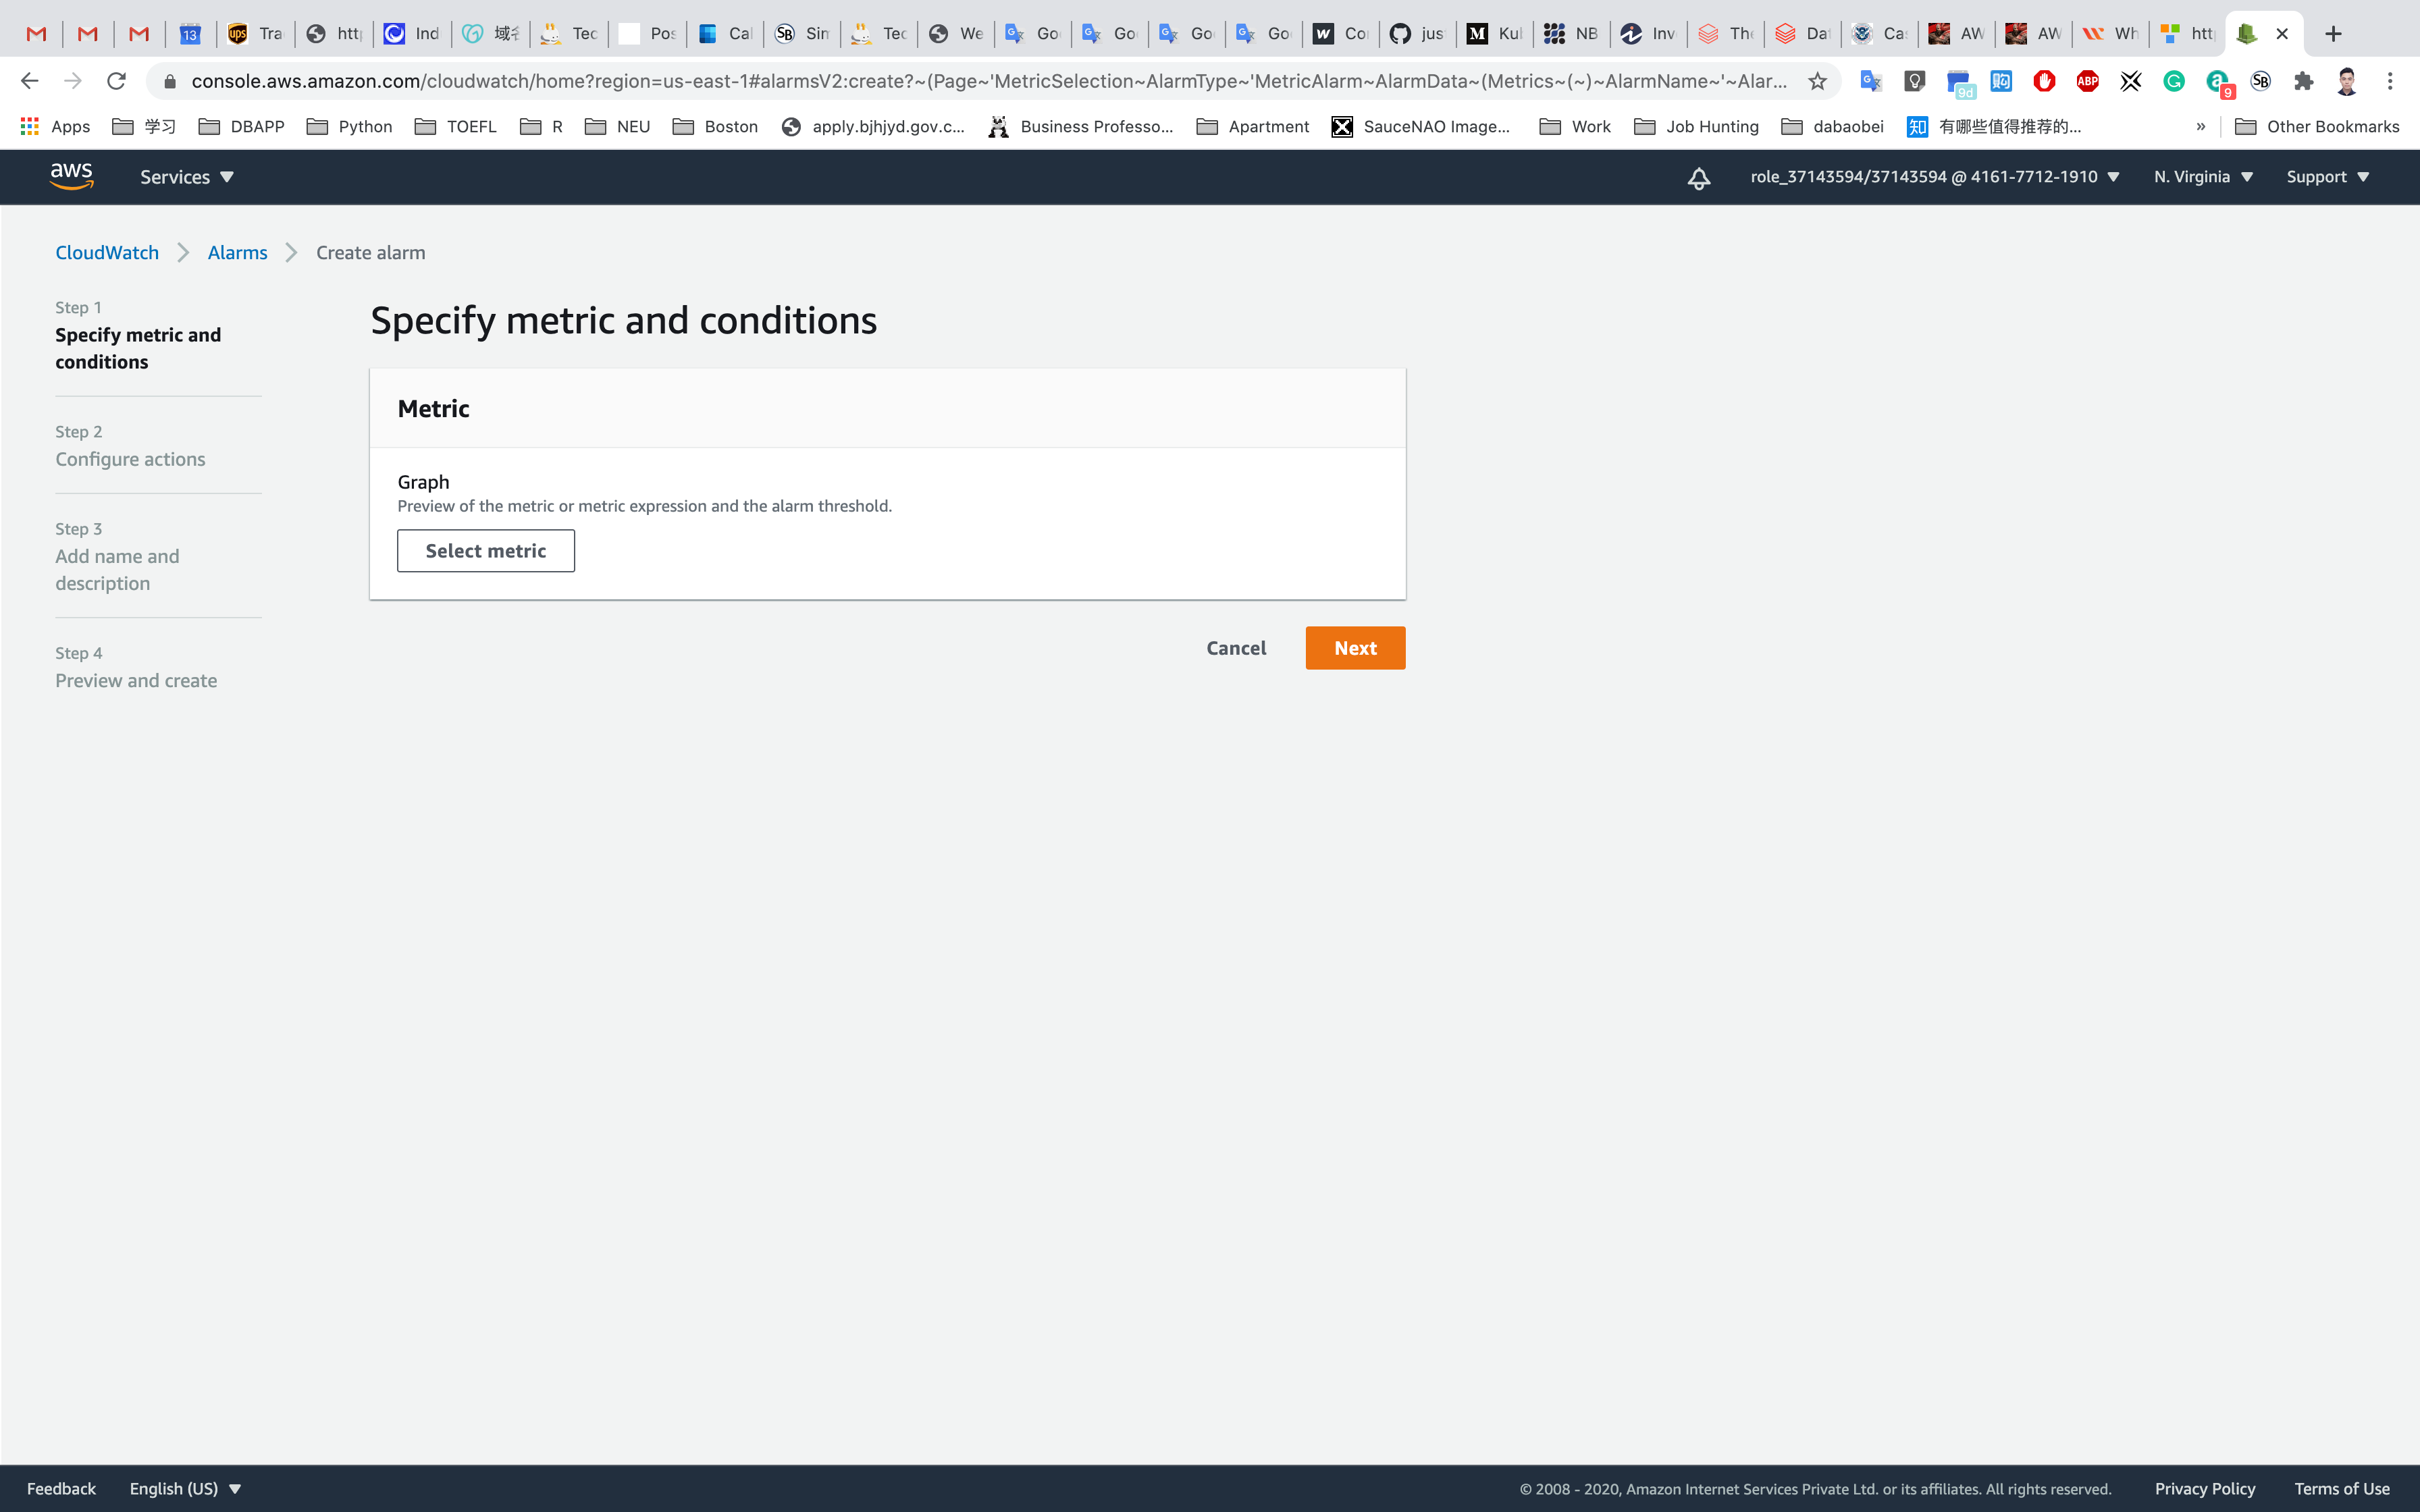
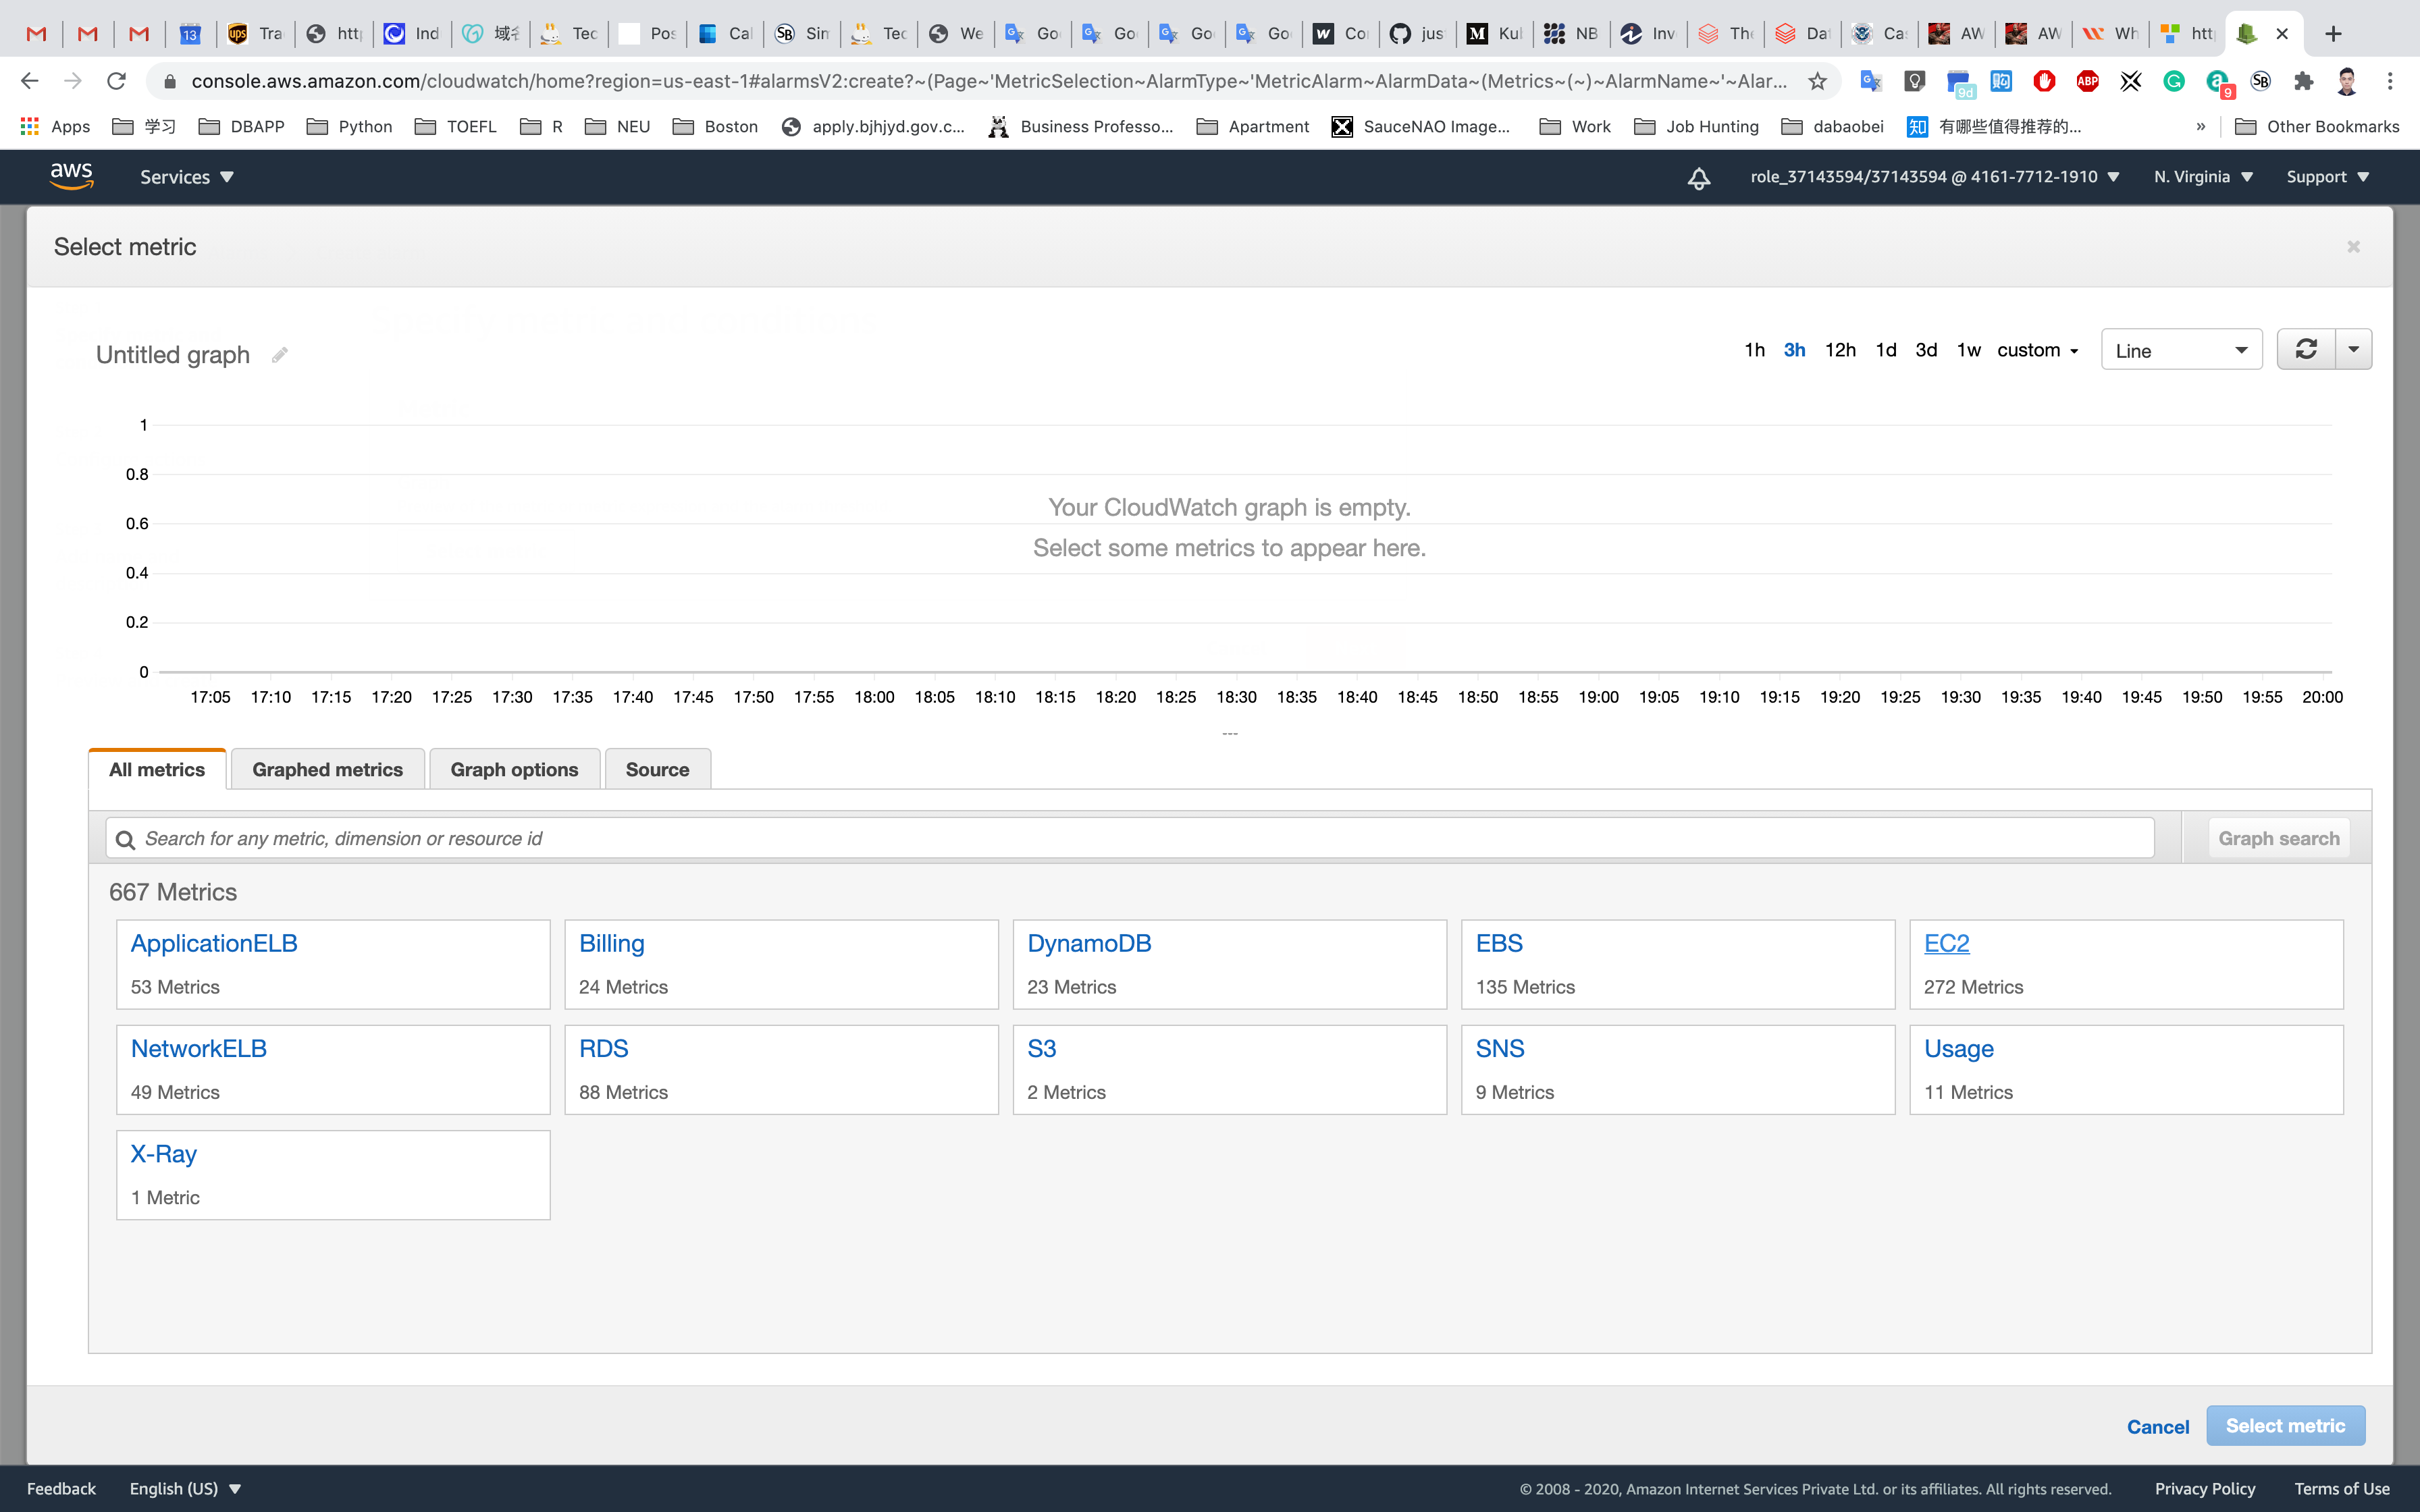
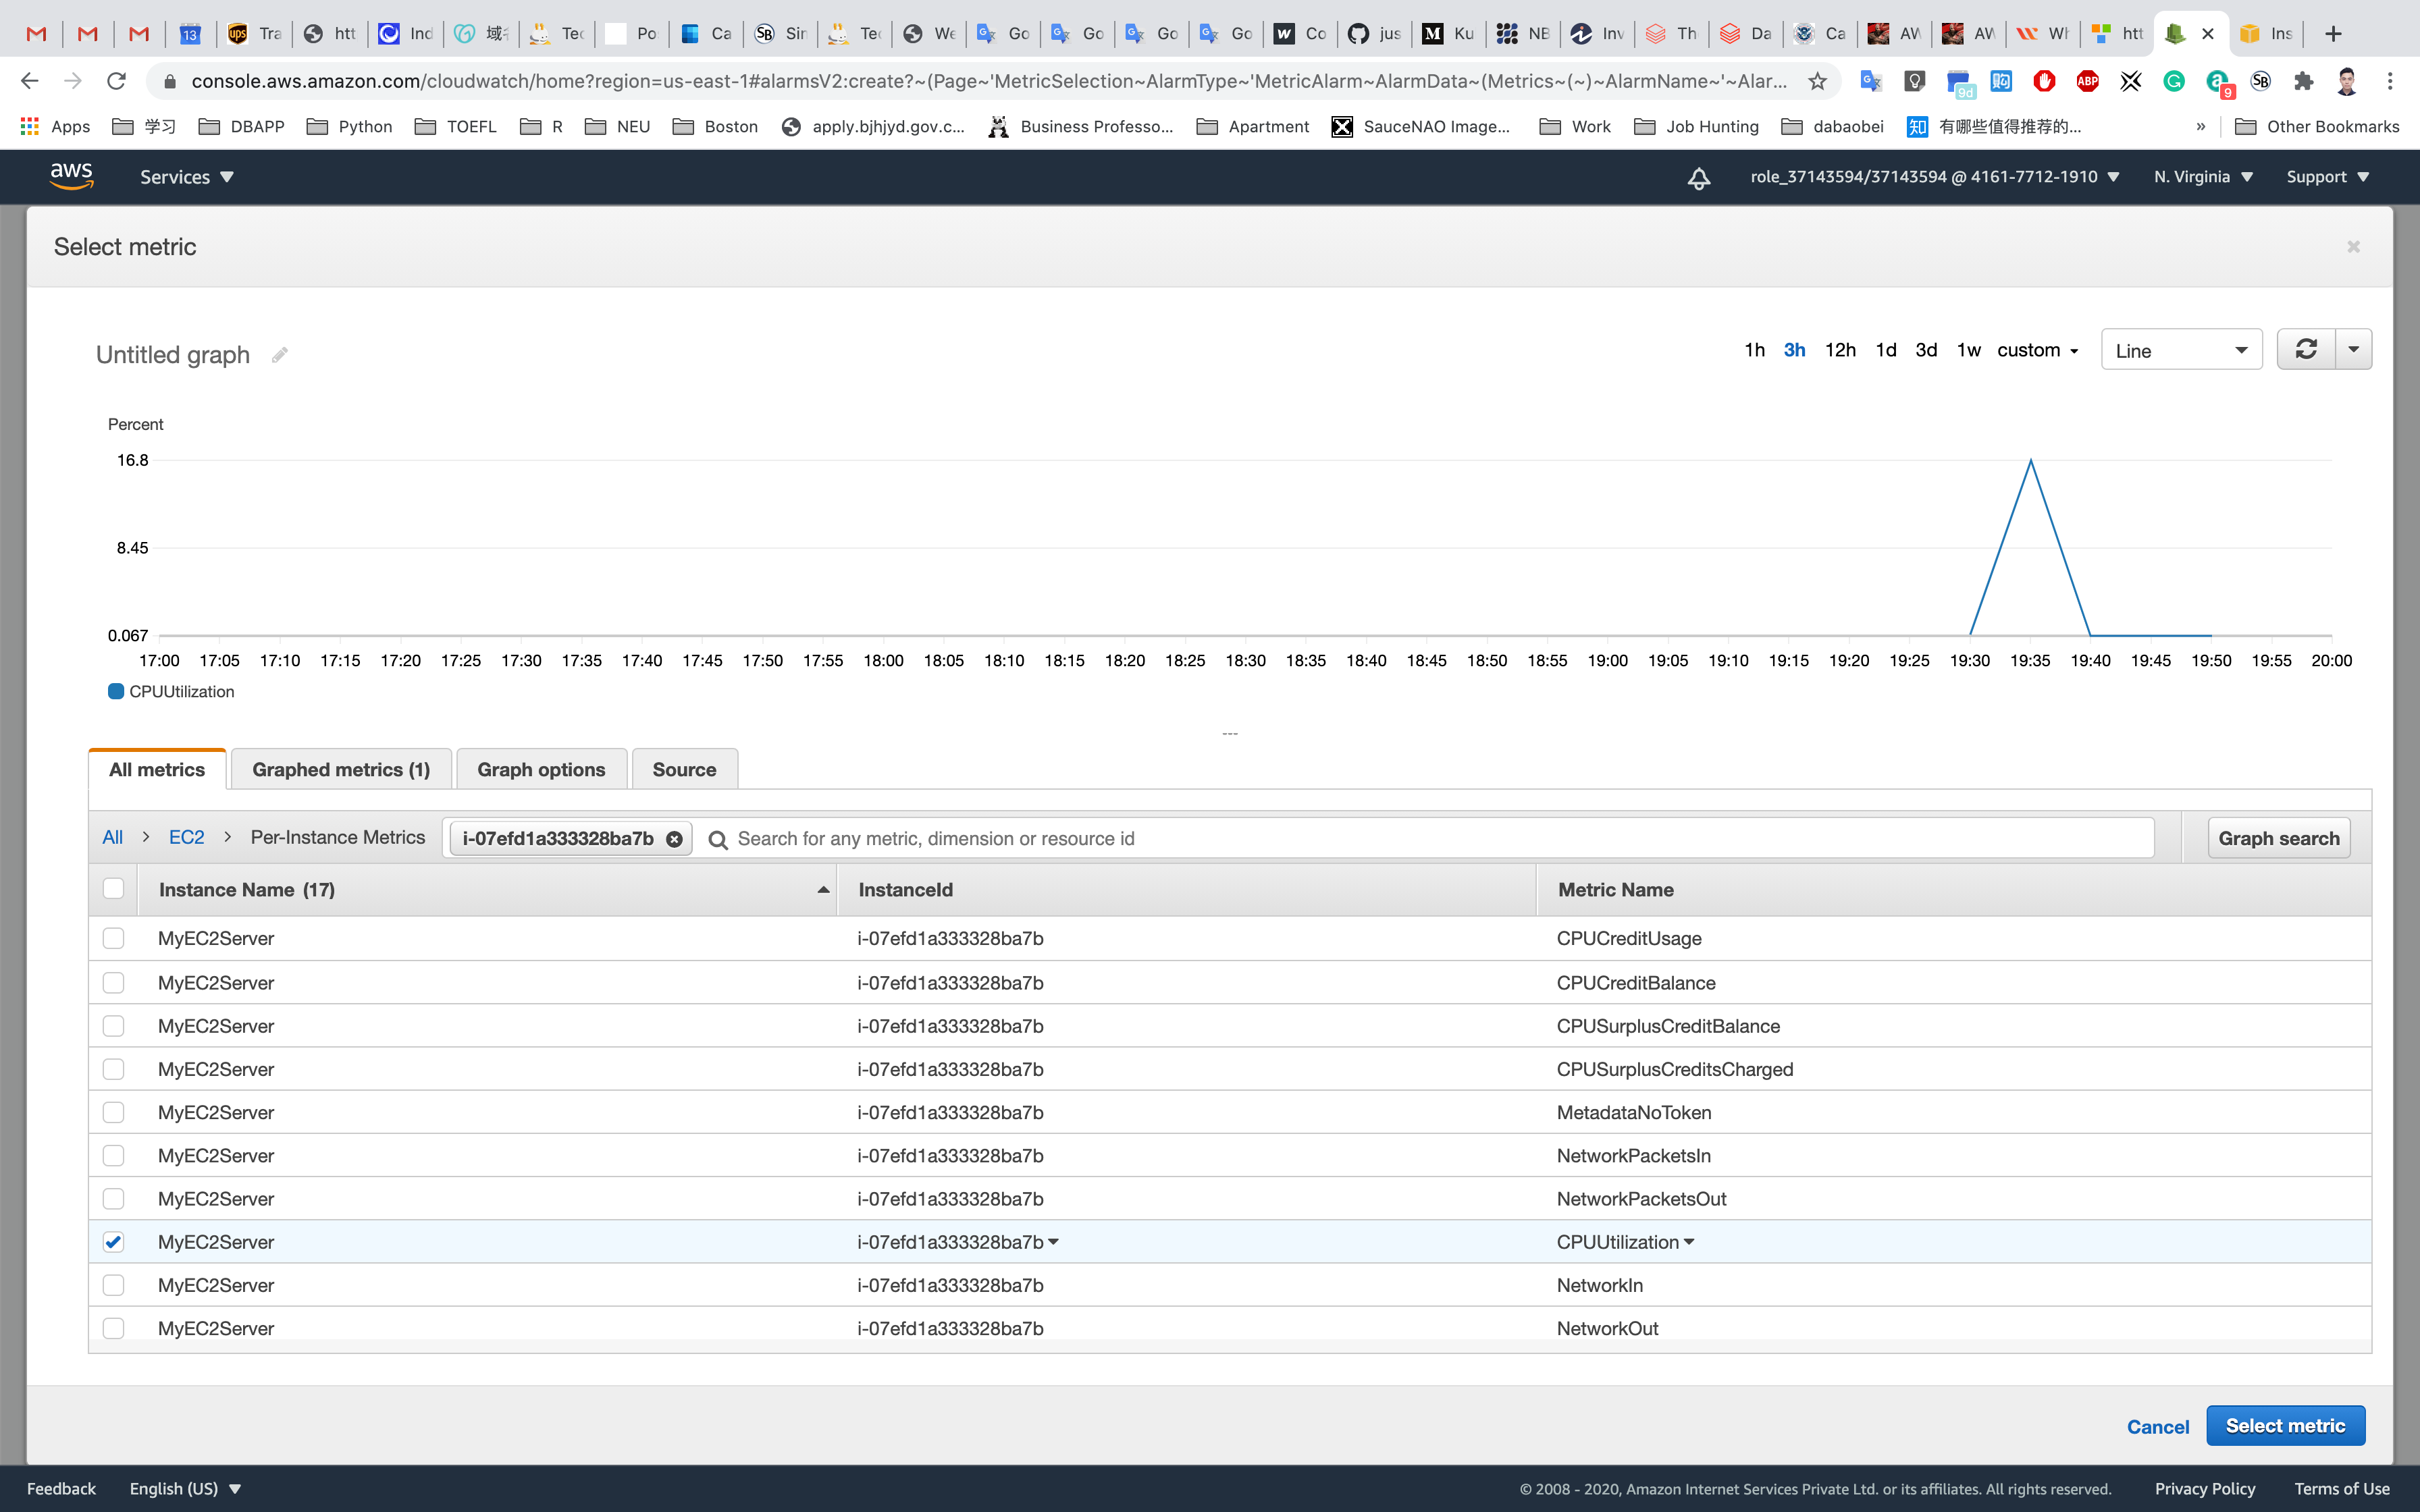
Click on Select metric.
Step 1: Specify metric and conditions
- Under Metrics
- Period: 1 Minute
- Under Conditions
- Threshold type : Choose Static
Whenever CPUUtilization is… : Choose Greater
than :30
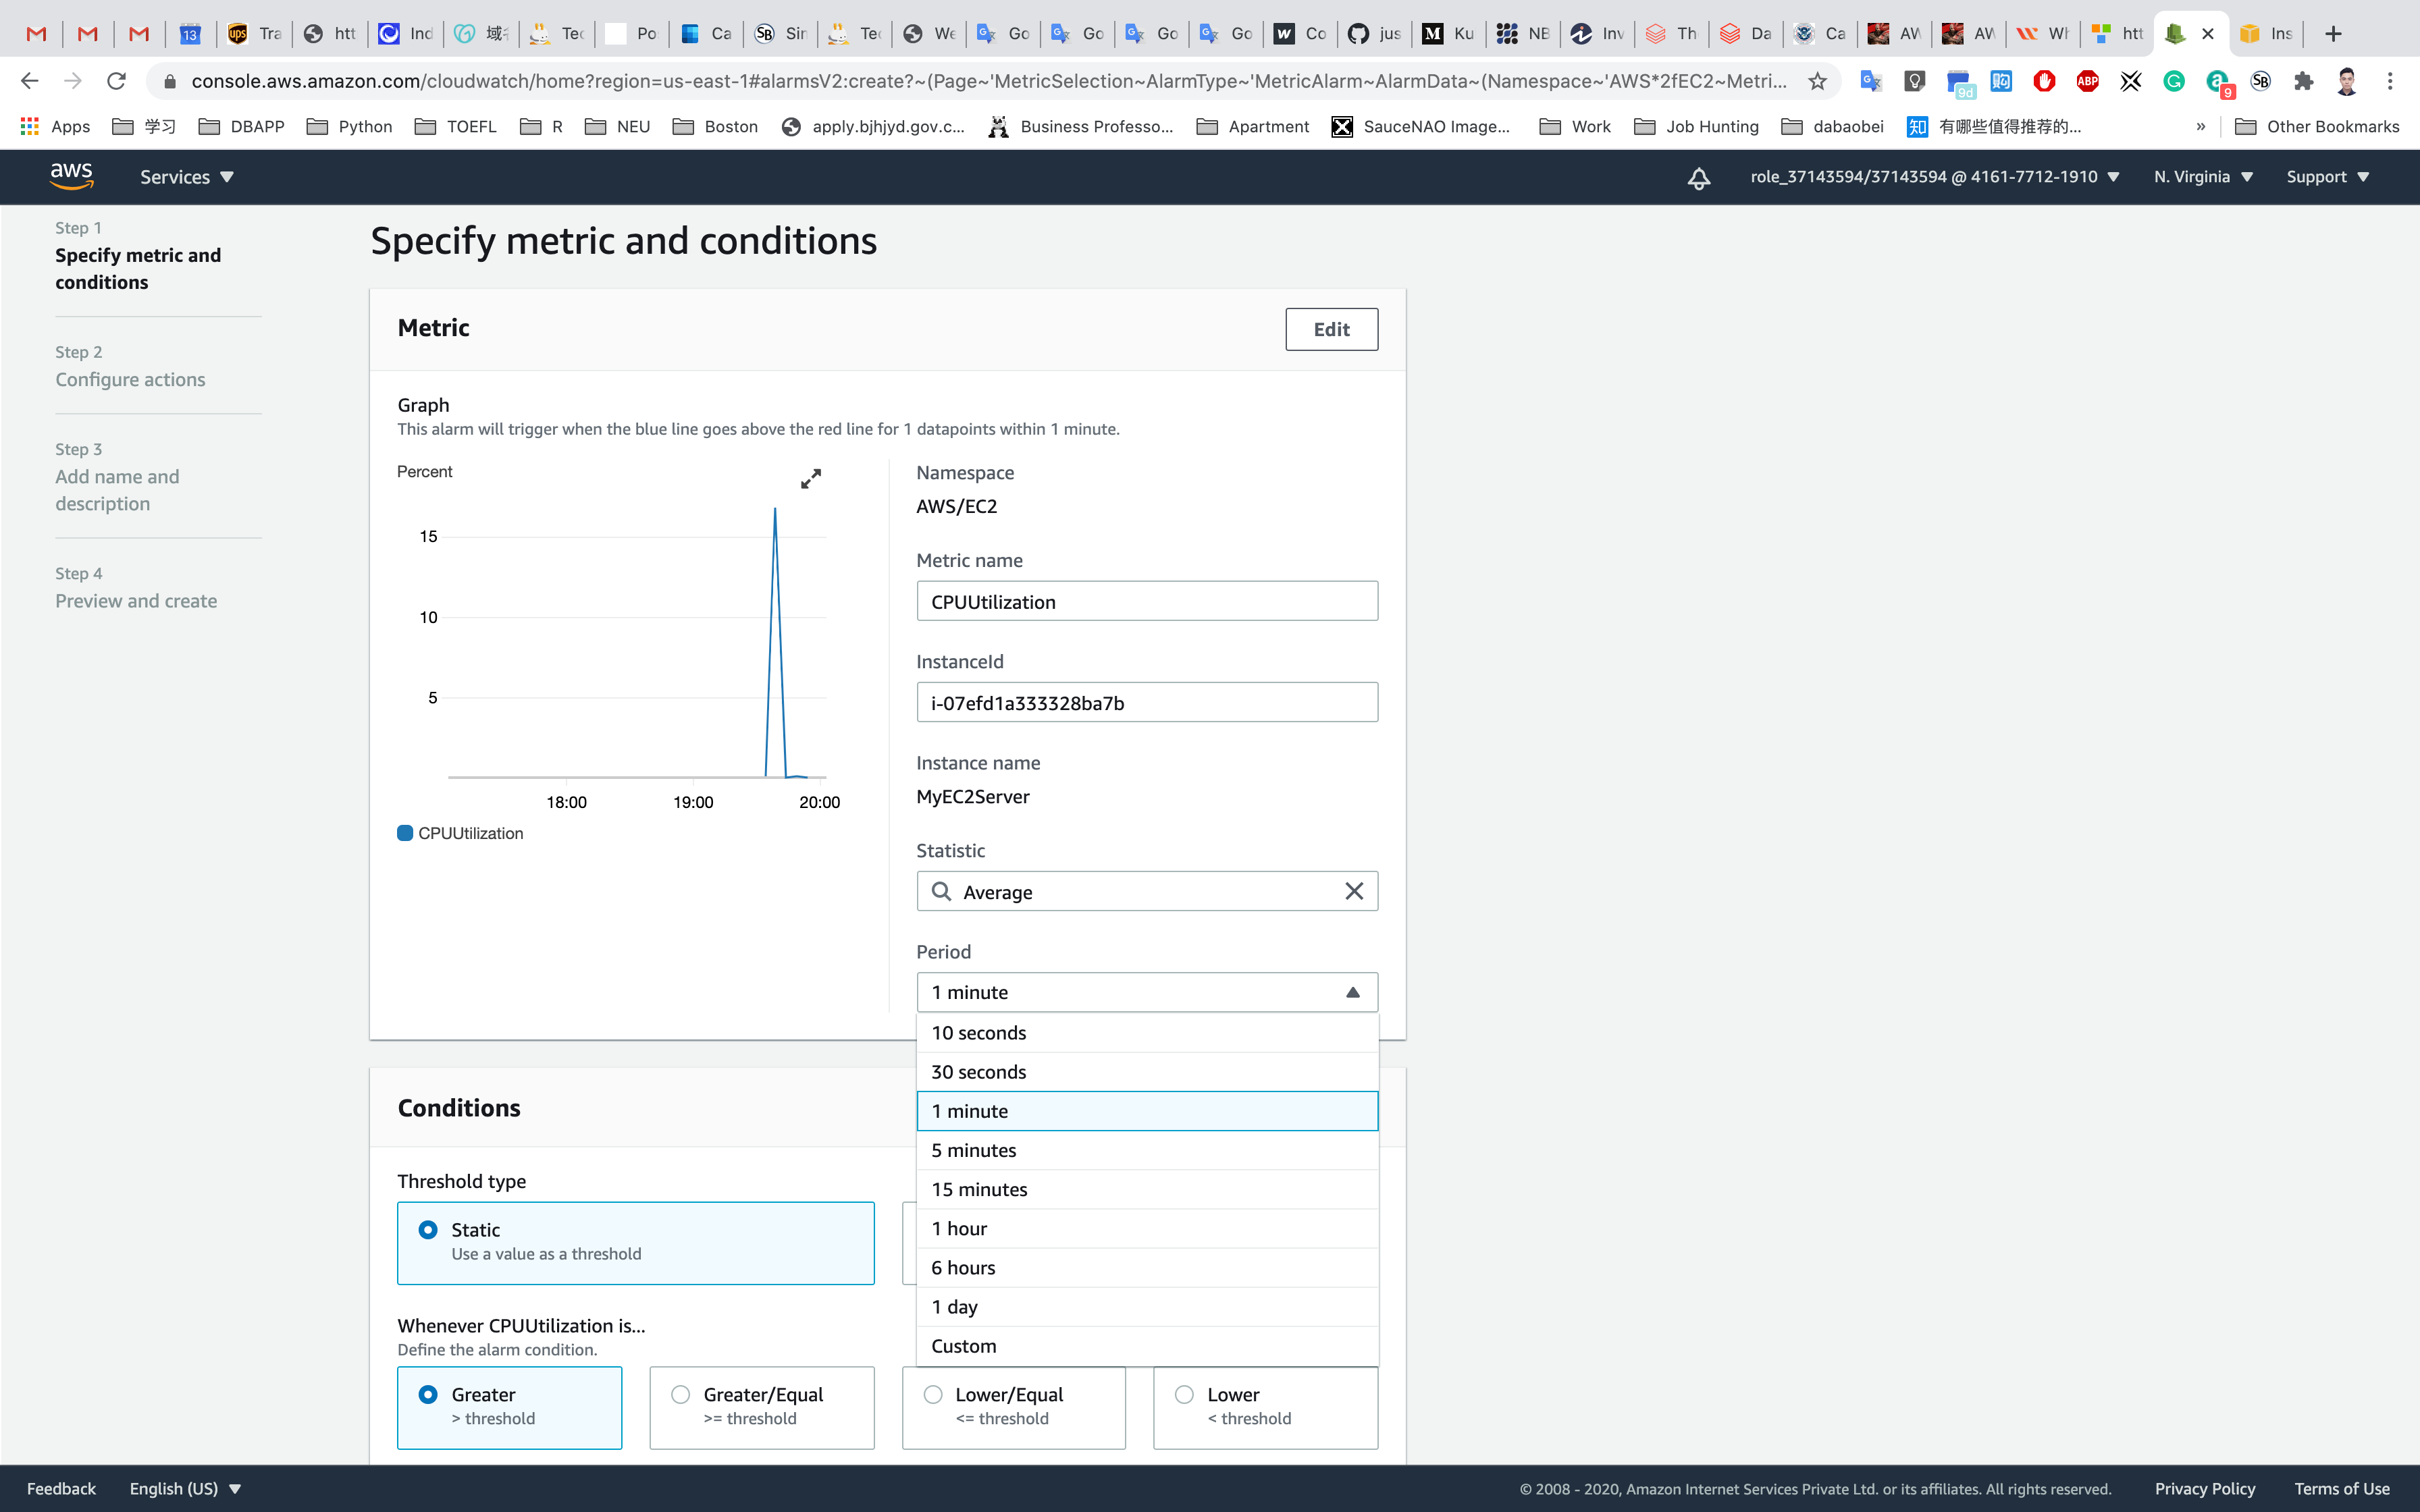
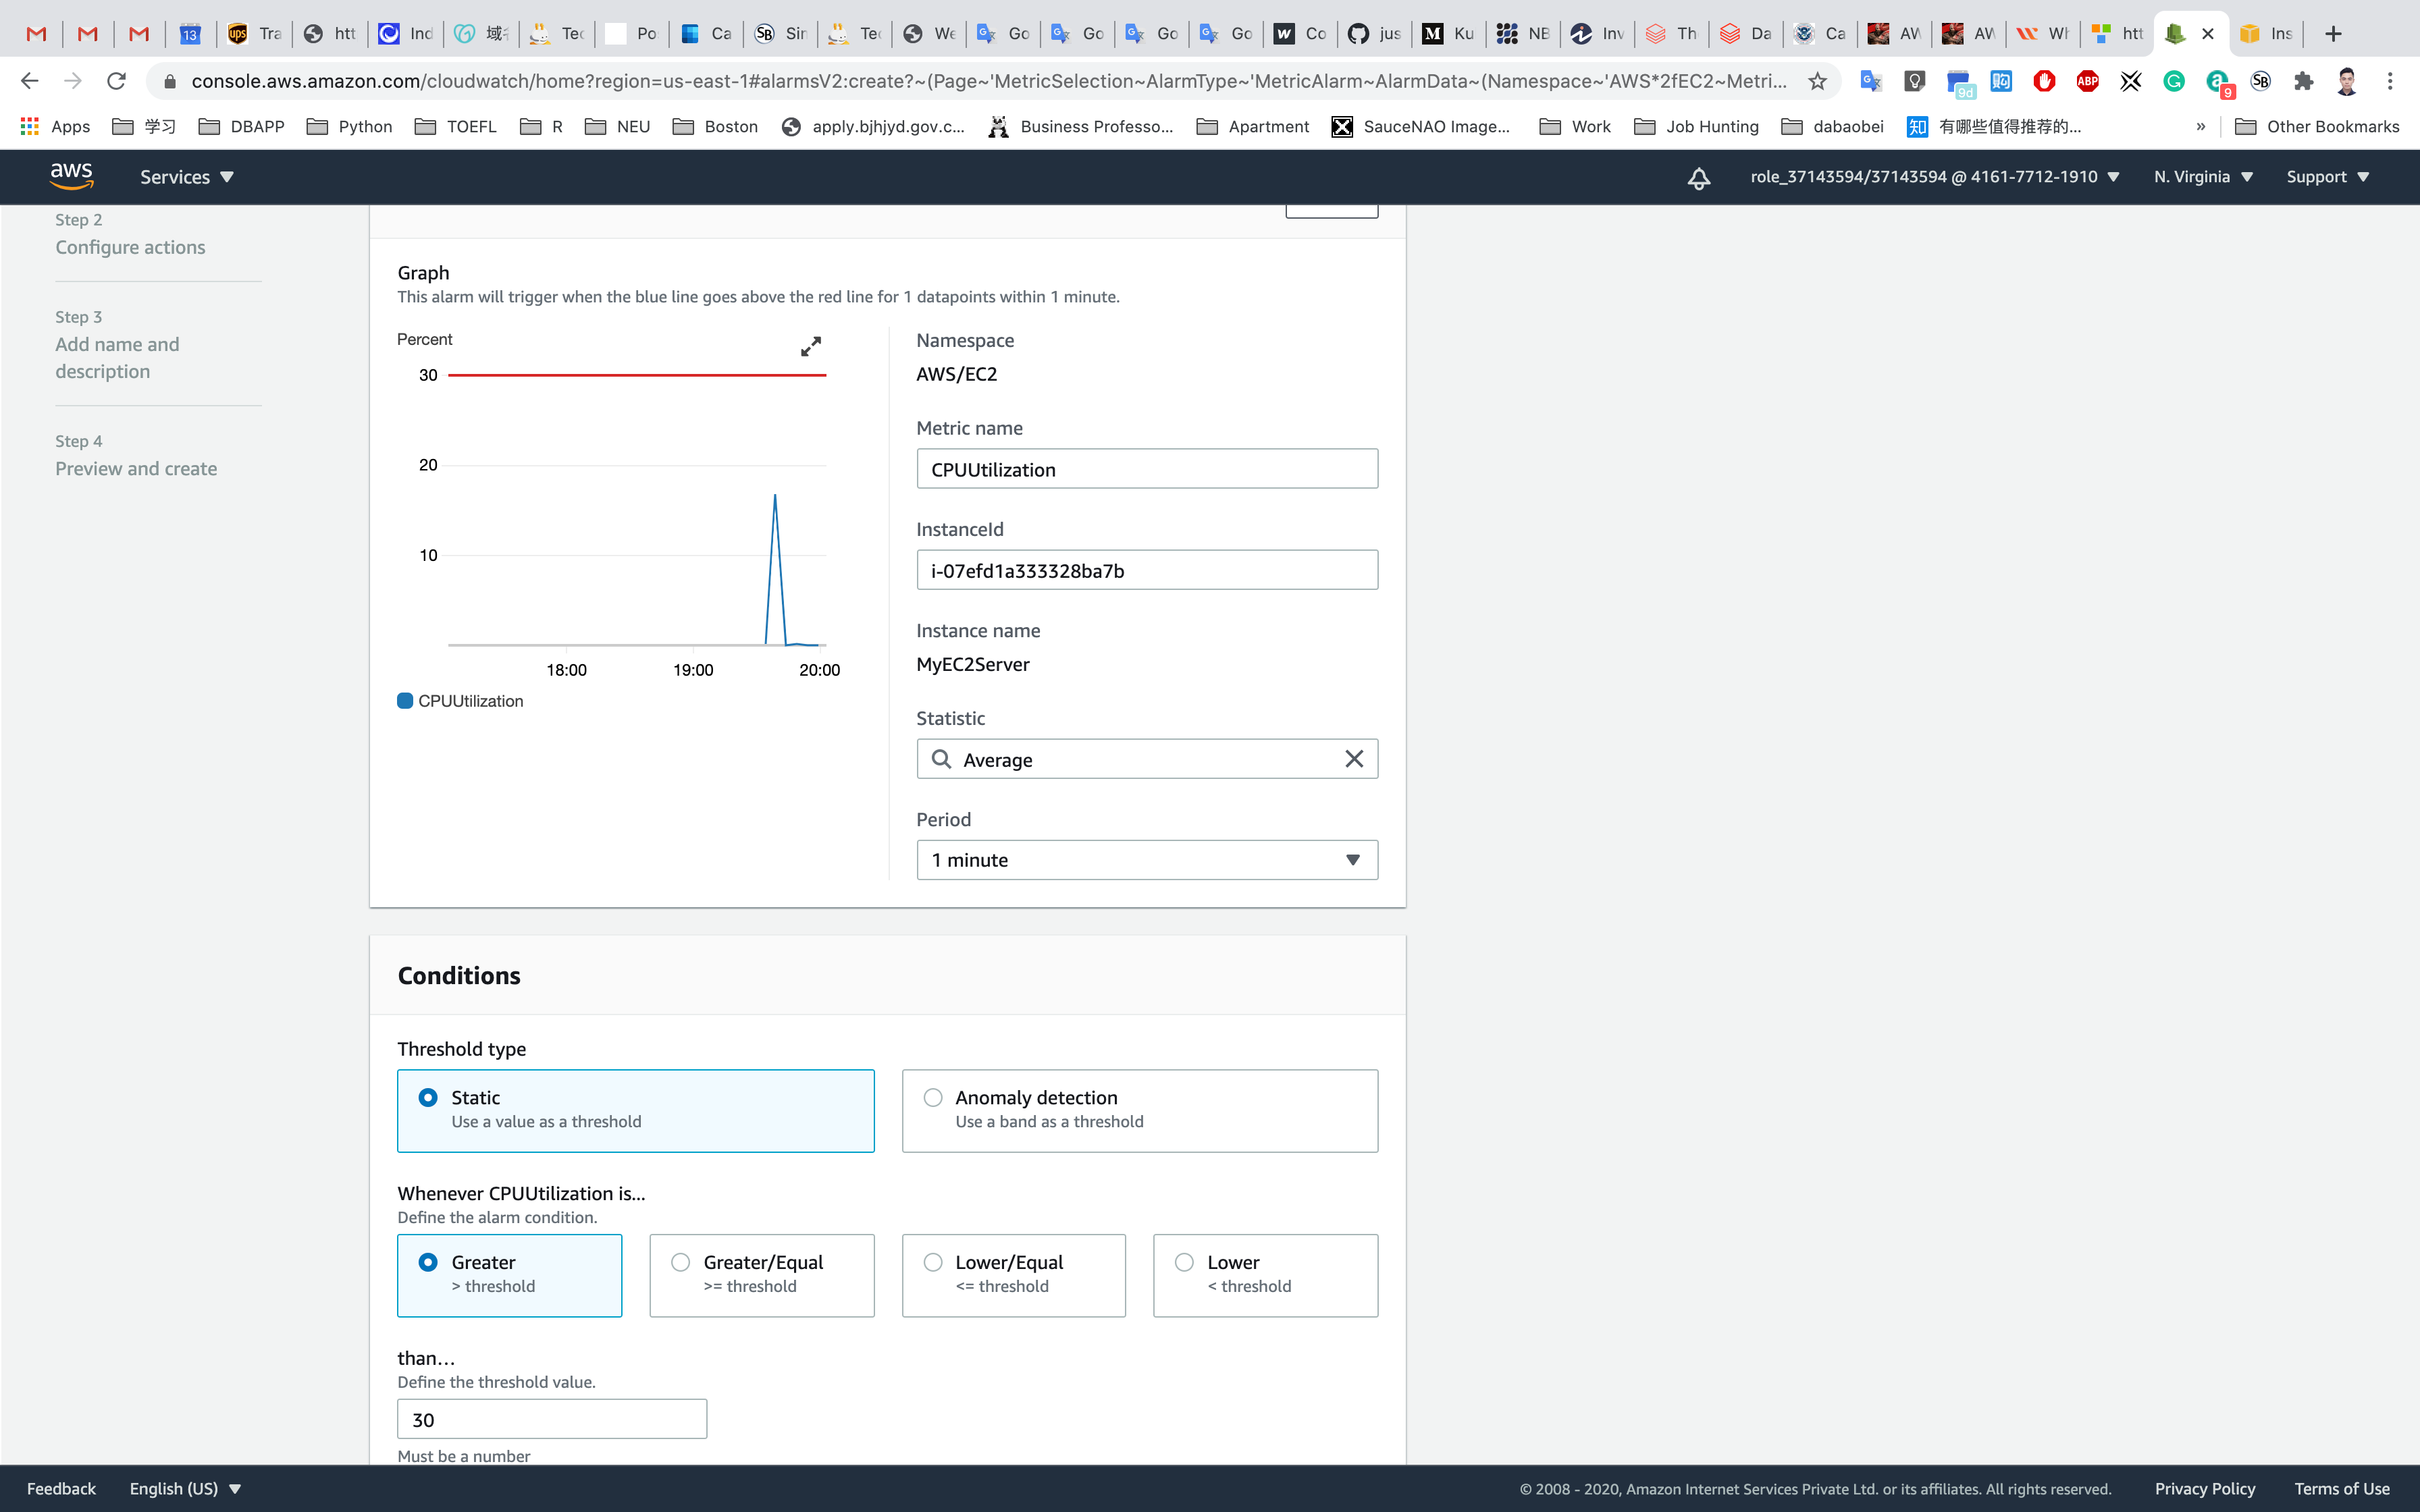
Leave other values as default and click on Next.
Step 2: Configure actions
In Configure actions page:
Under Notification
Whenever this alarm state is… : Choose In Alarm
Select an SNS topic : Choose Select an existing SNS topic
Send a notification to… : Choose MyServerMonitor SNS topic which was created earlier.
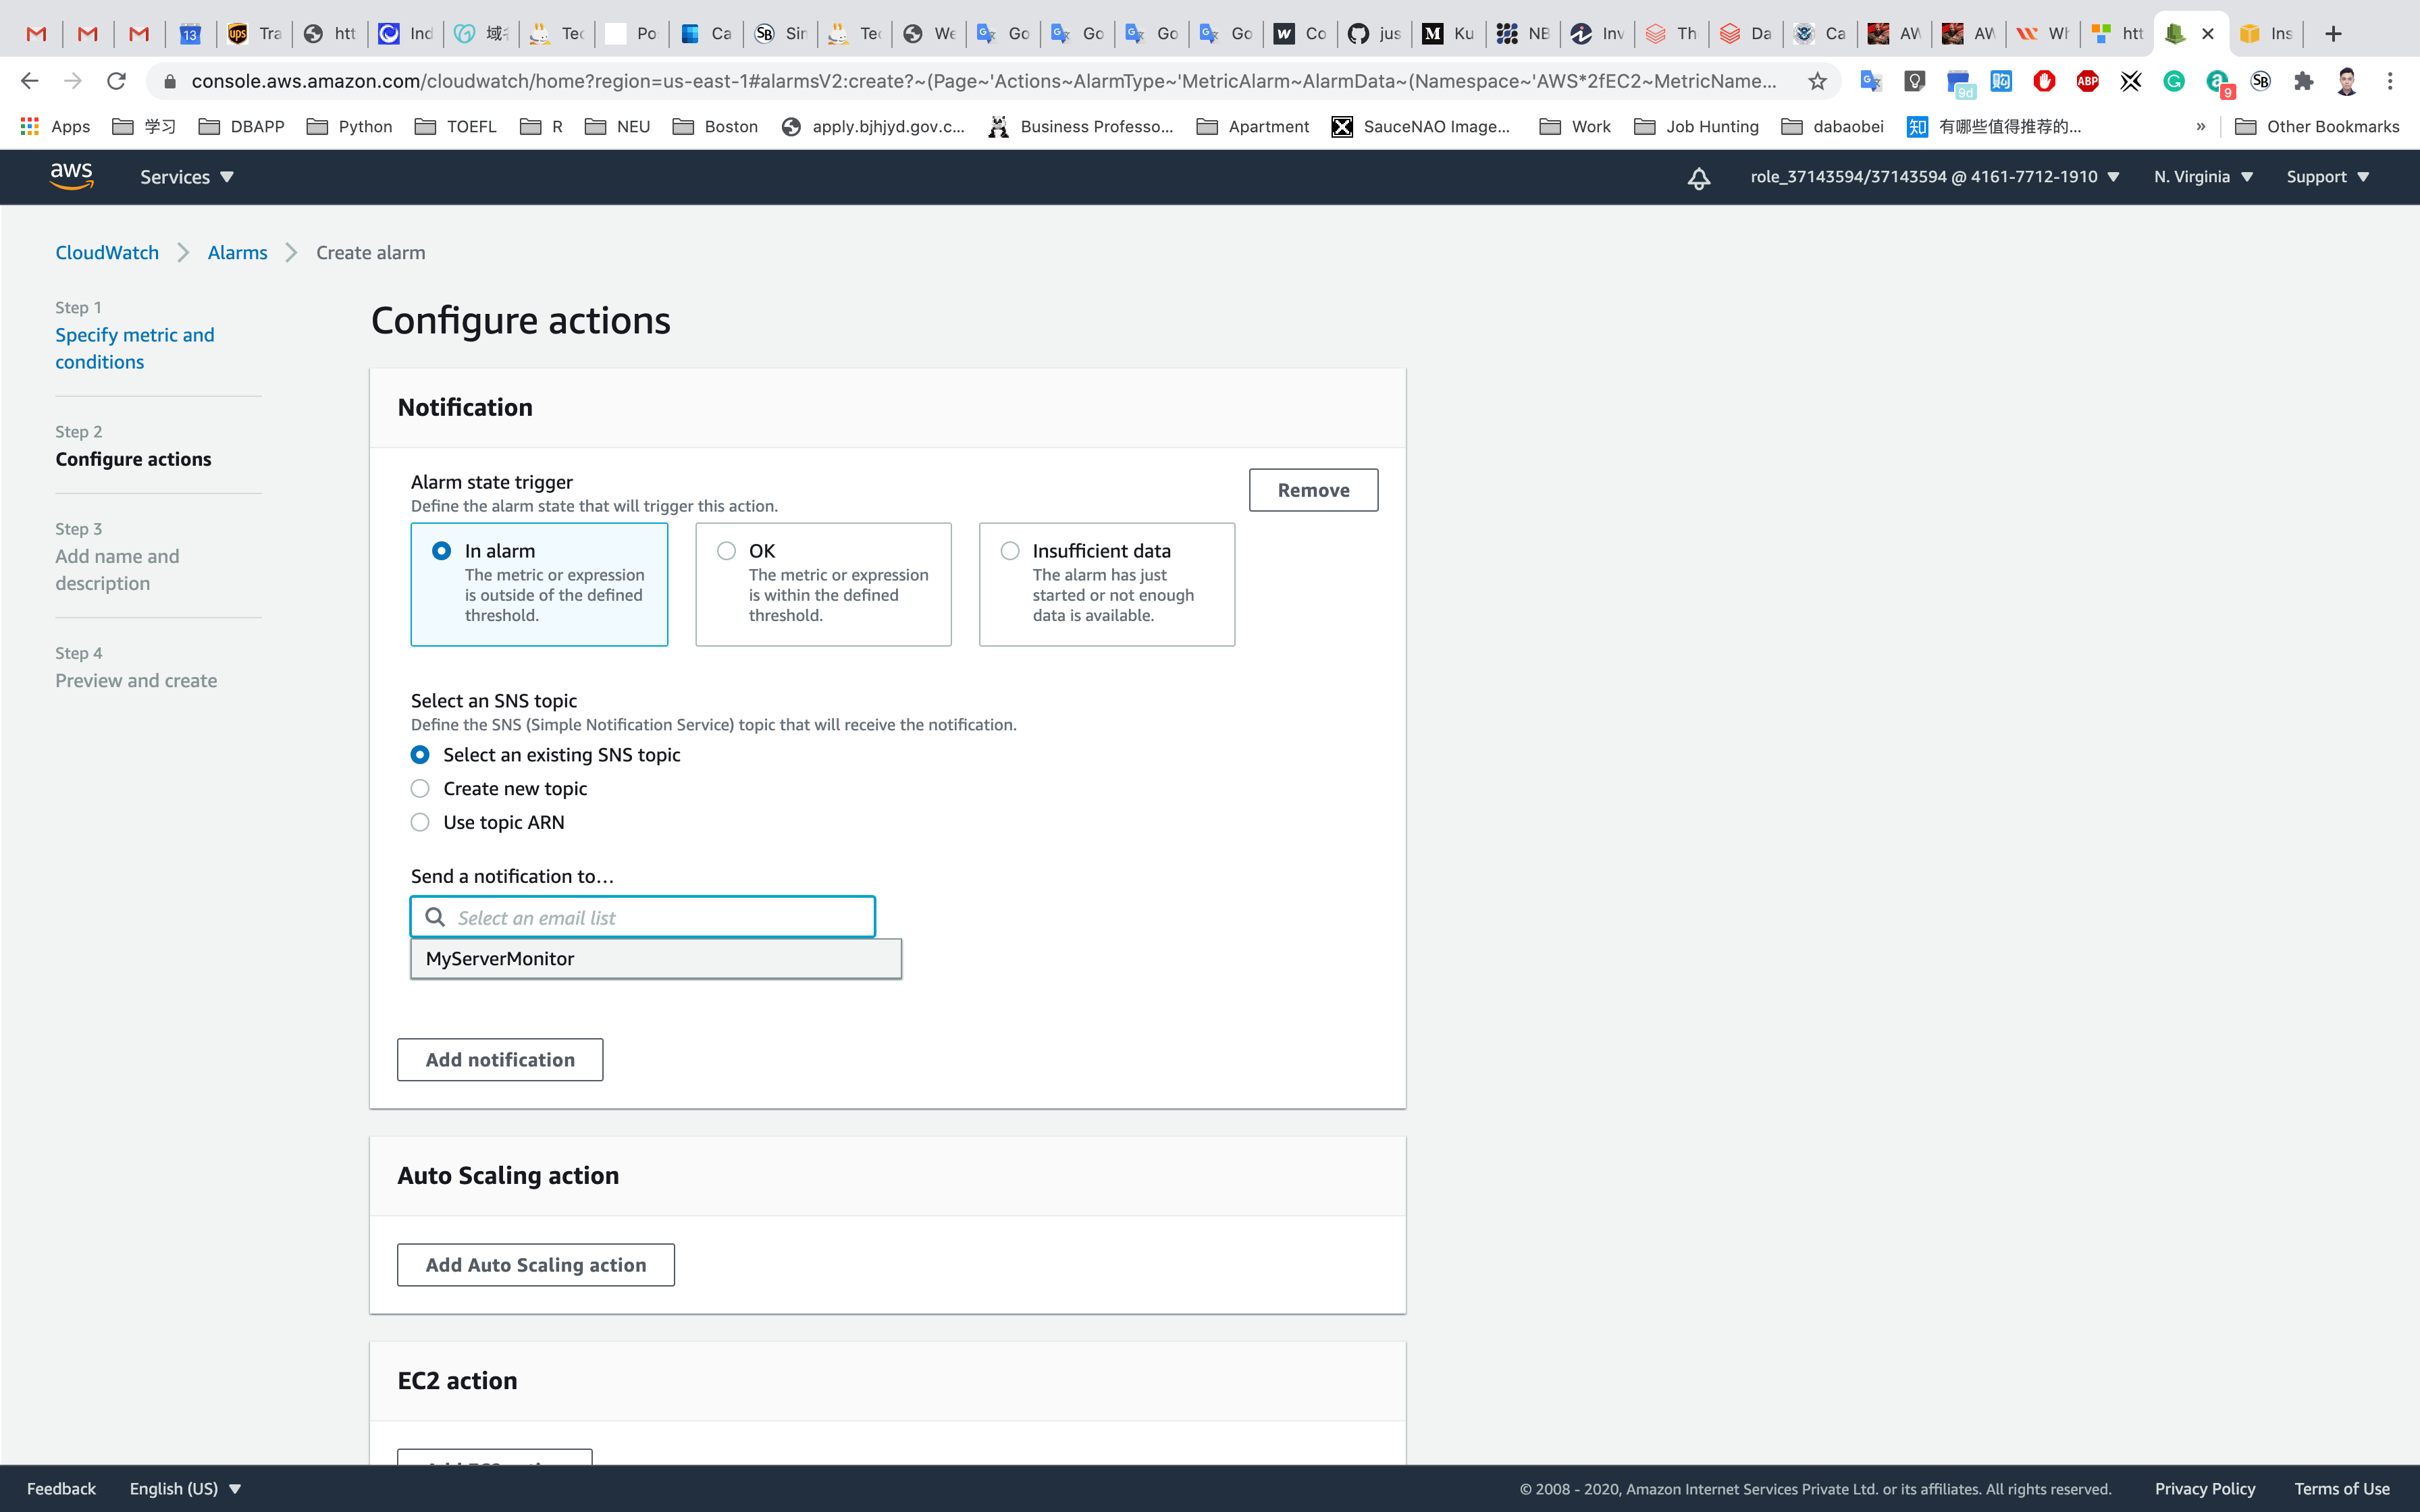
Leave other fields as default. Click on .
Step 3: Add name and description
In the Add a description page, (under Name and Description):
- Define a unique name:
MyServerCPUUtilizationAlarm - Alarm description - optional:
CloudWatch alarm for EC2 instance CPUUtilization
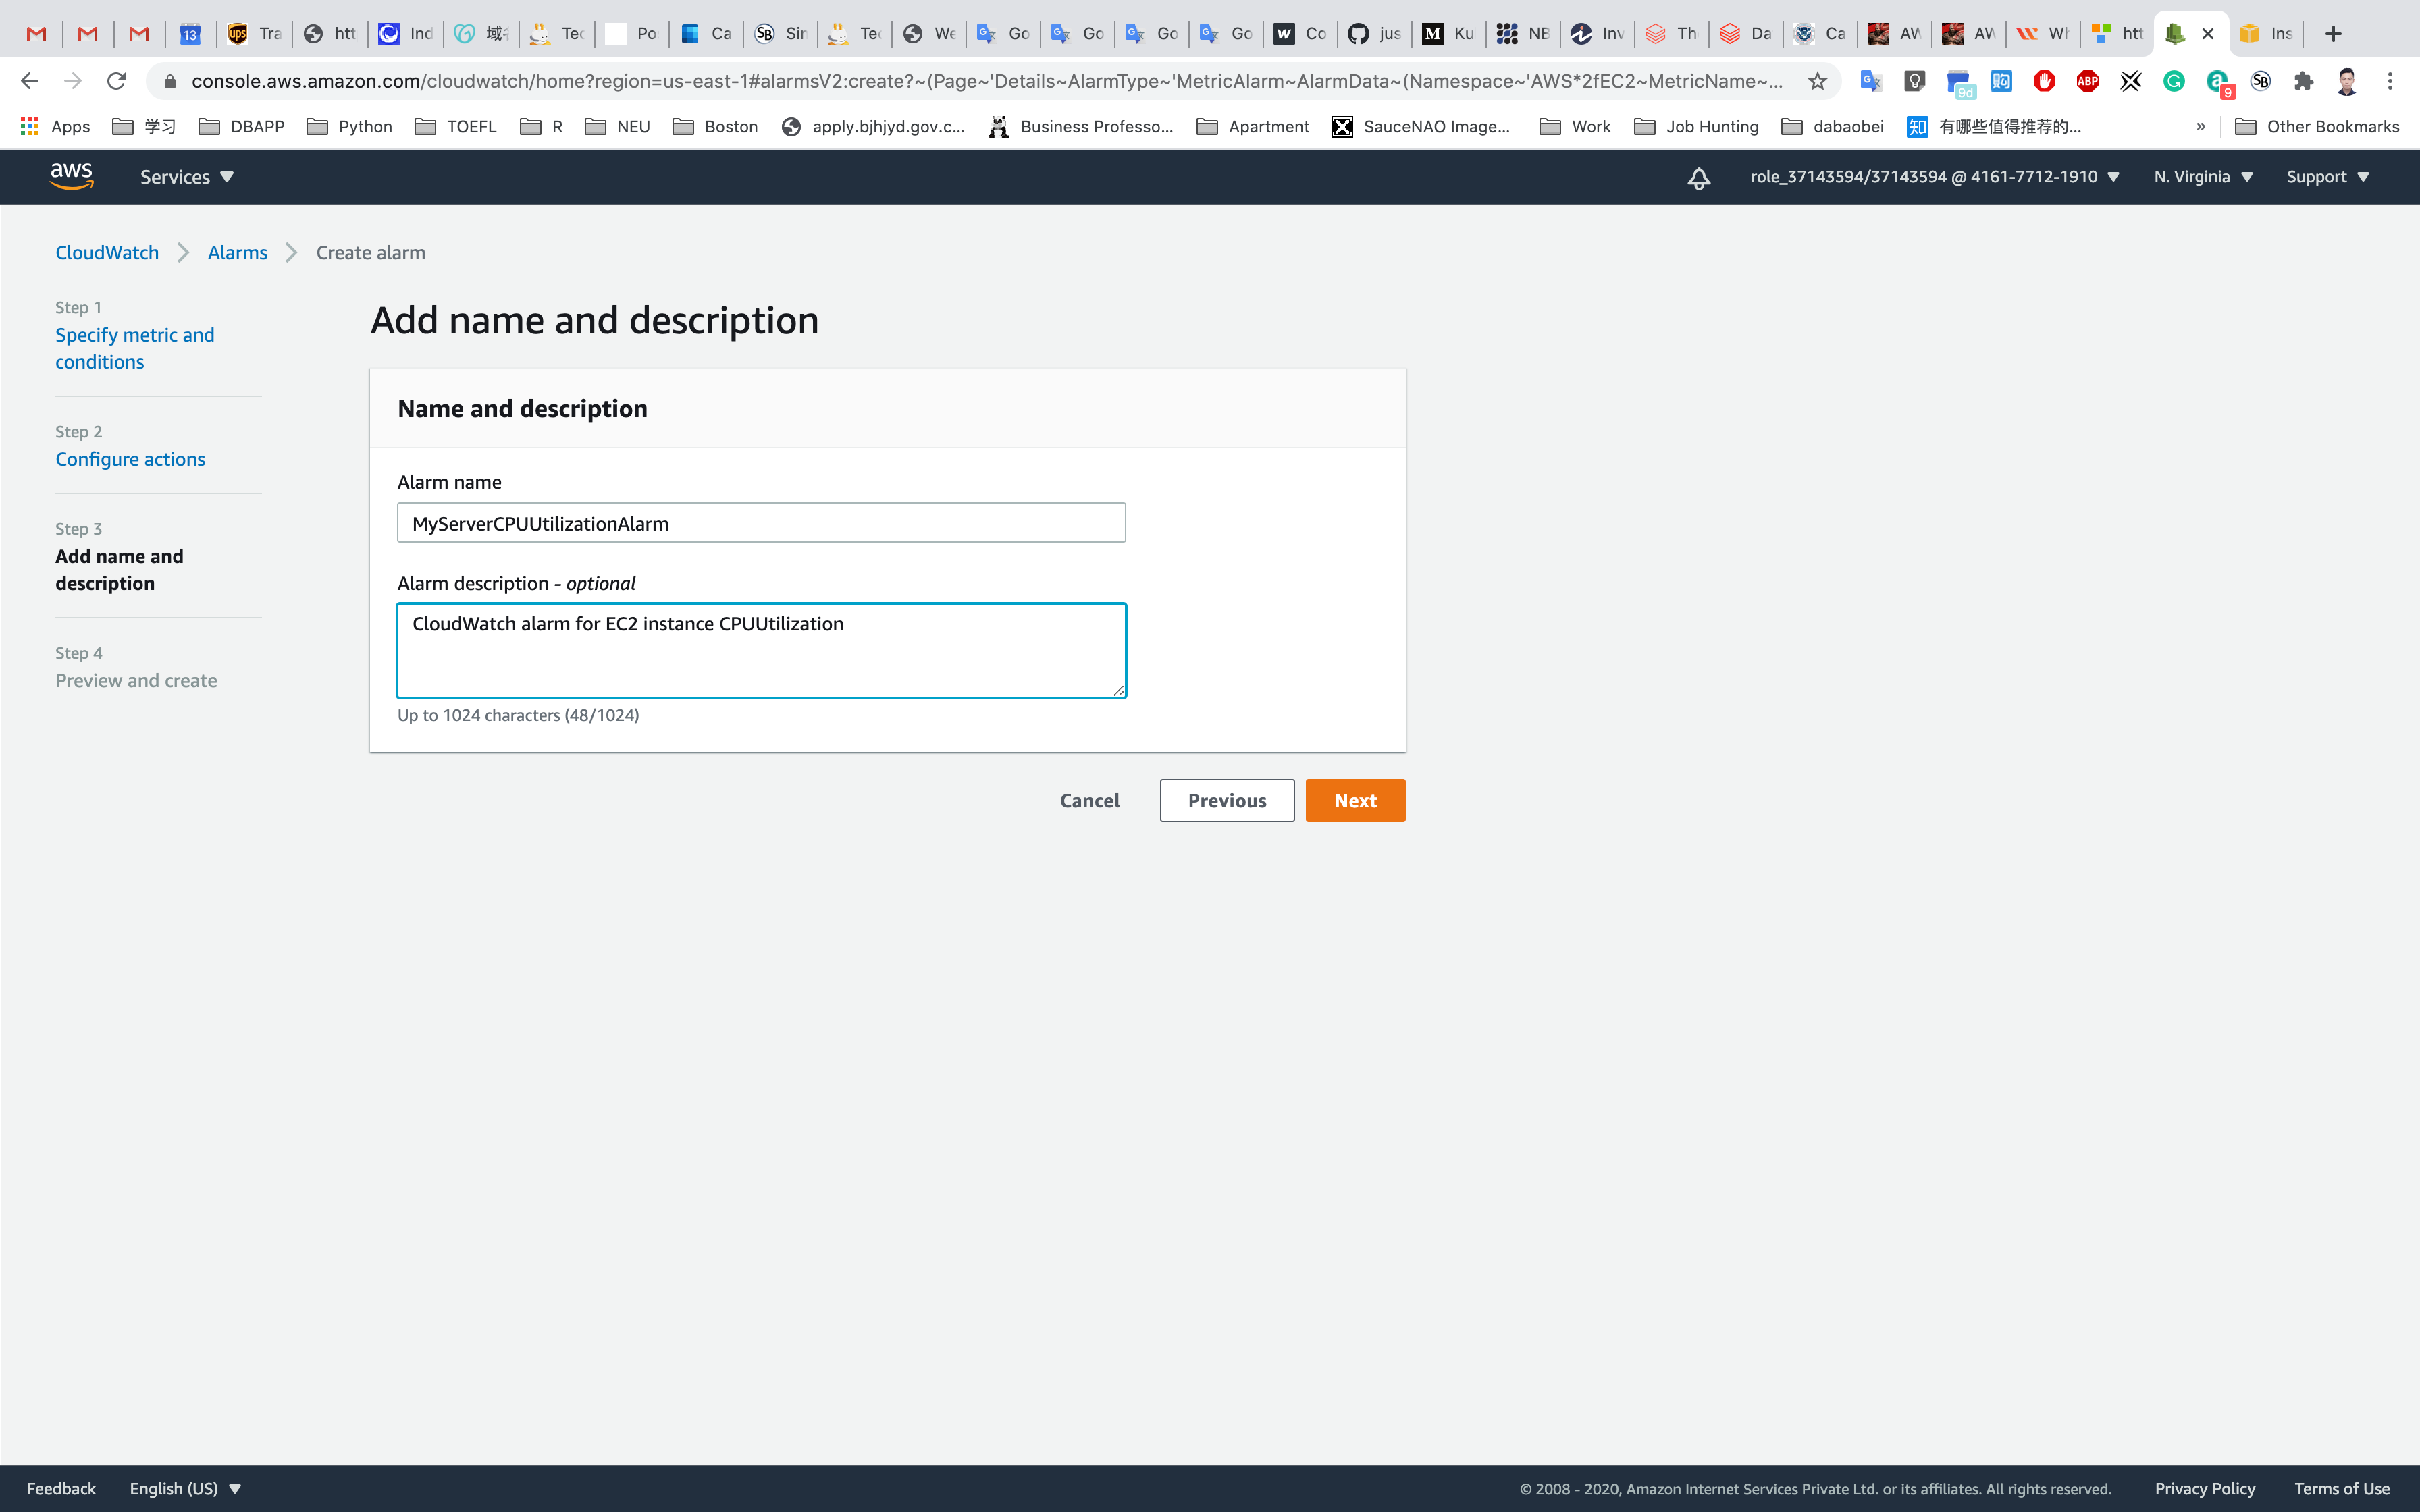
Click on Next.
Step 4: Preview and create
A preview of the Alarm will be shown. Scroll down and click on Create alarm.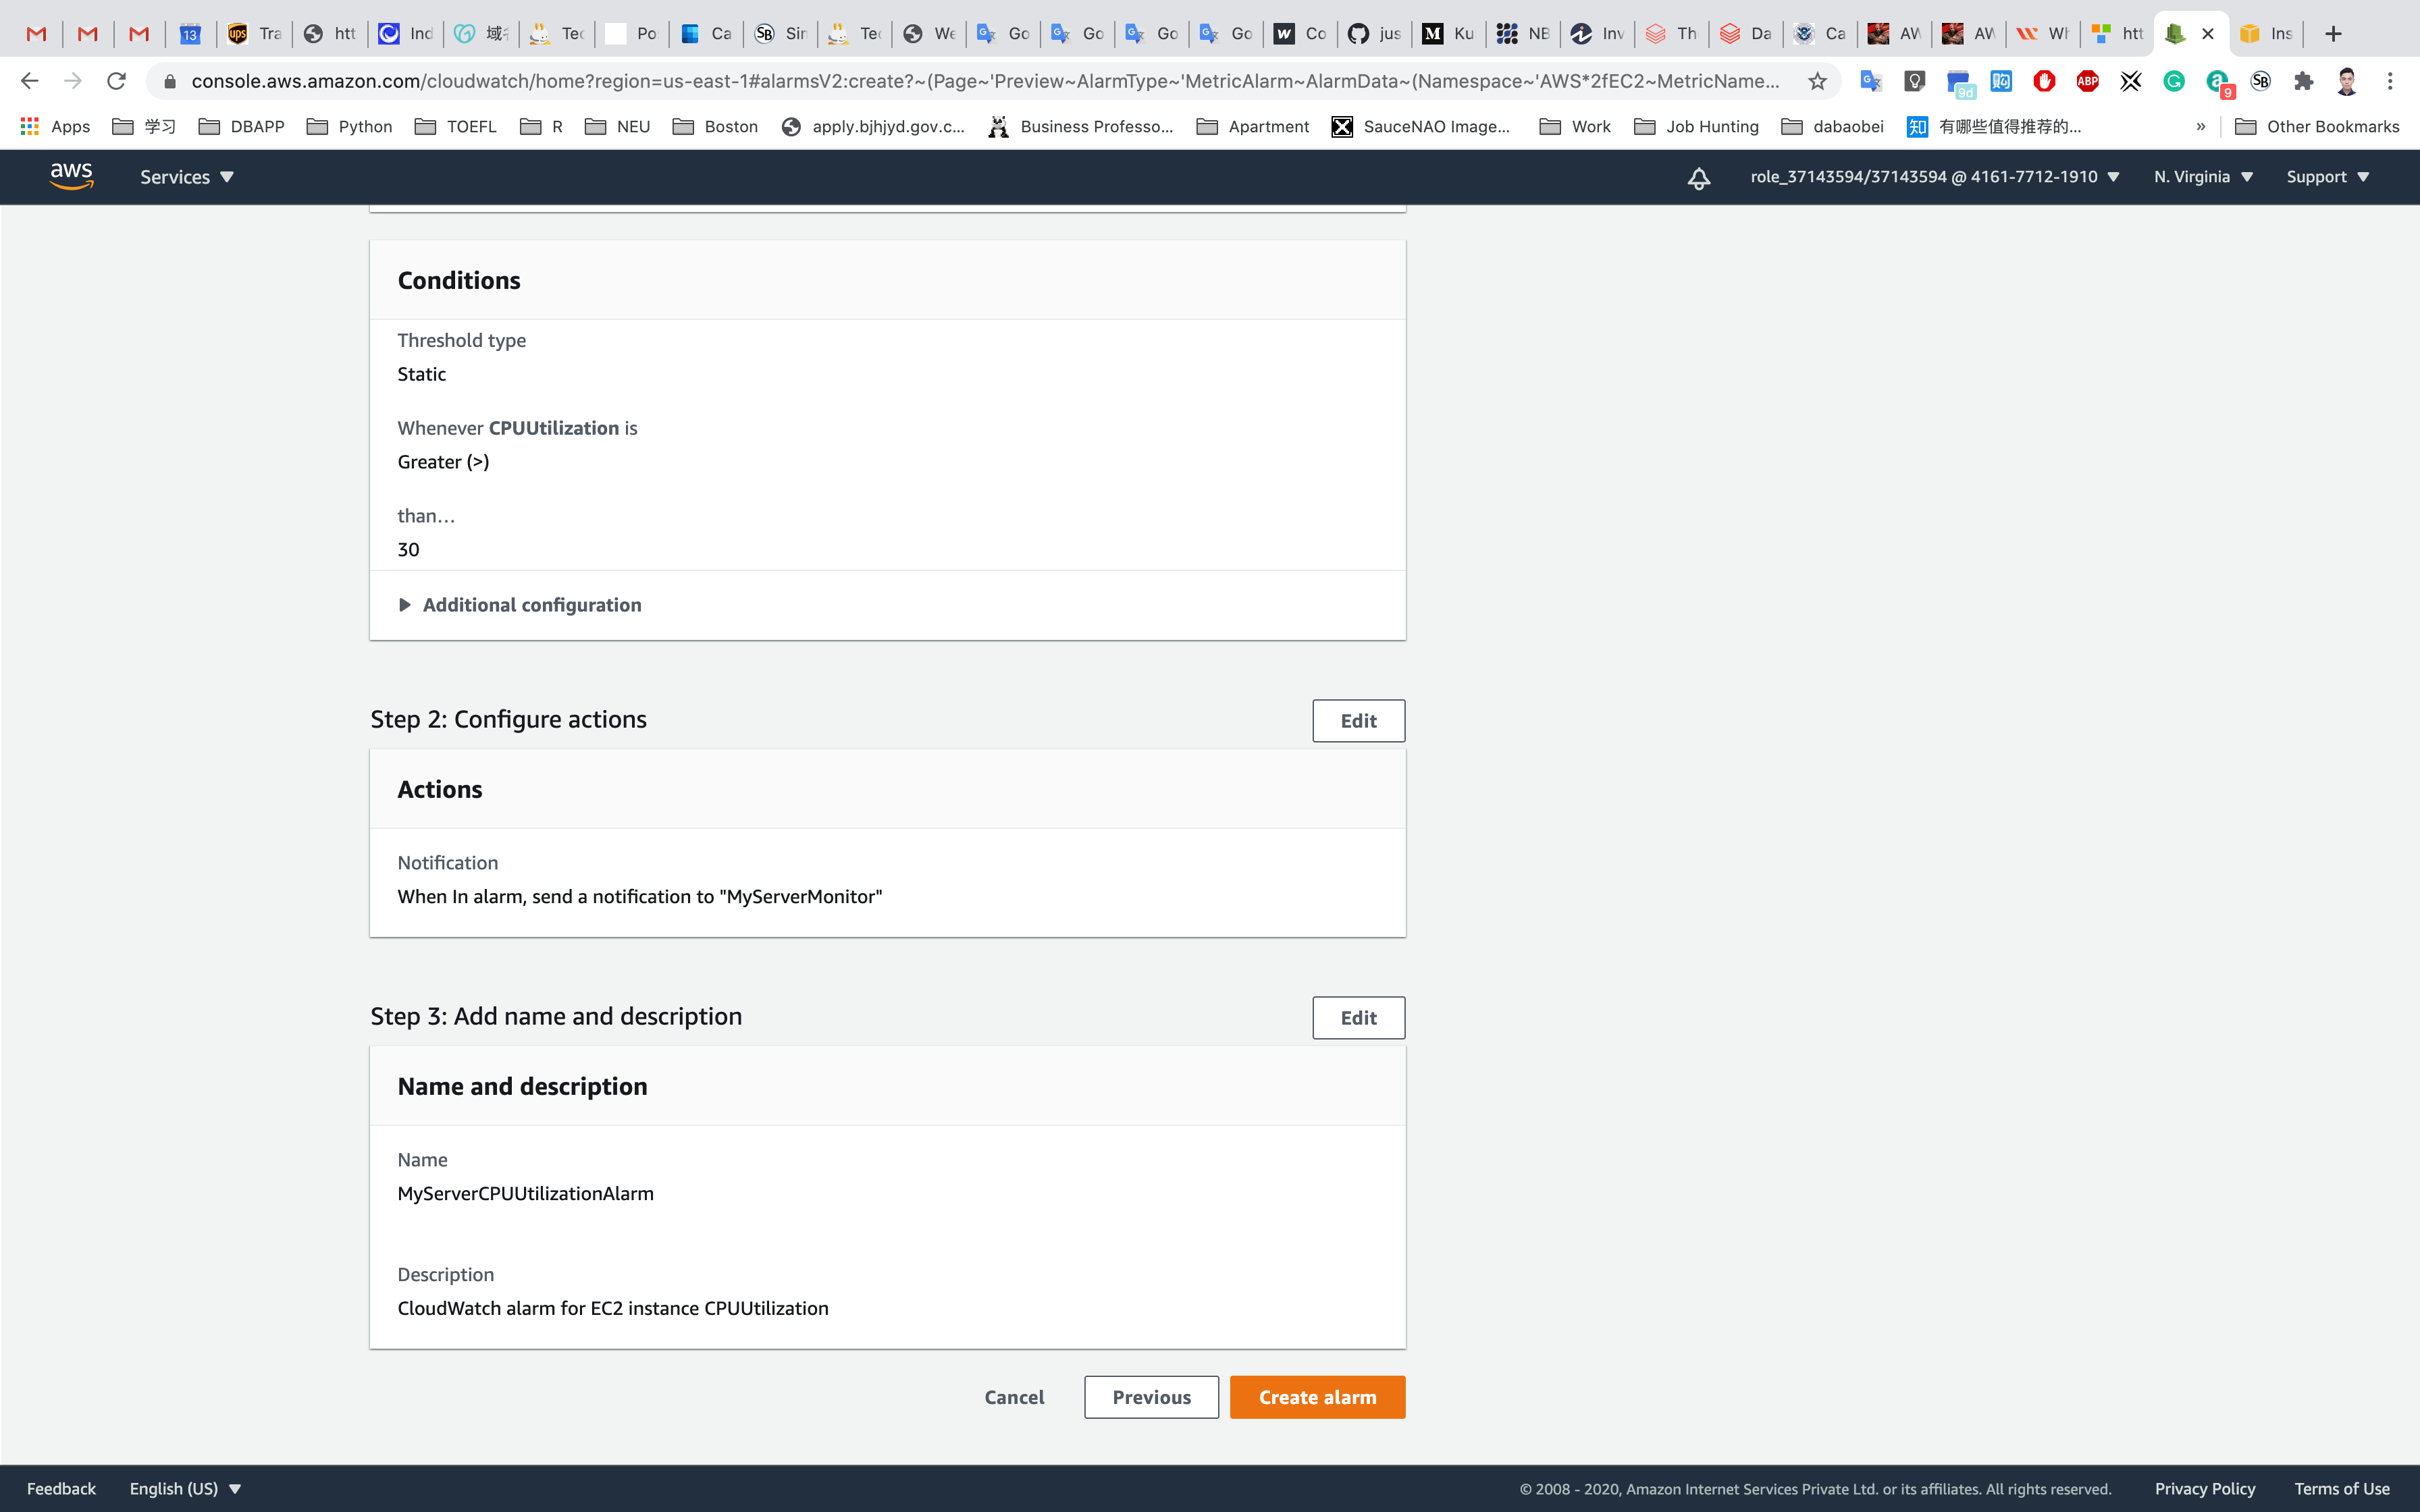
A new CloudWatch Alarm is now created.
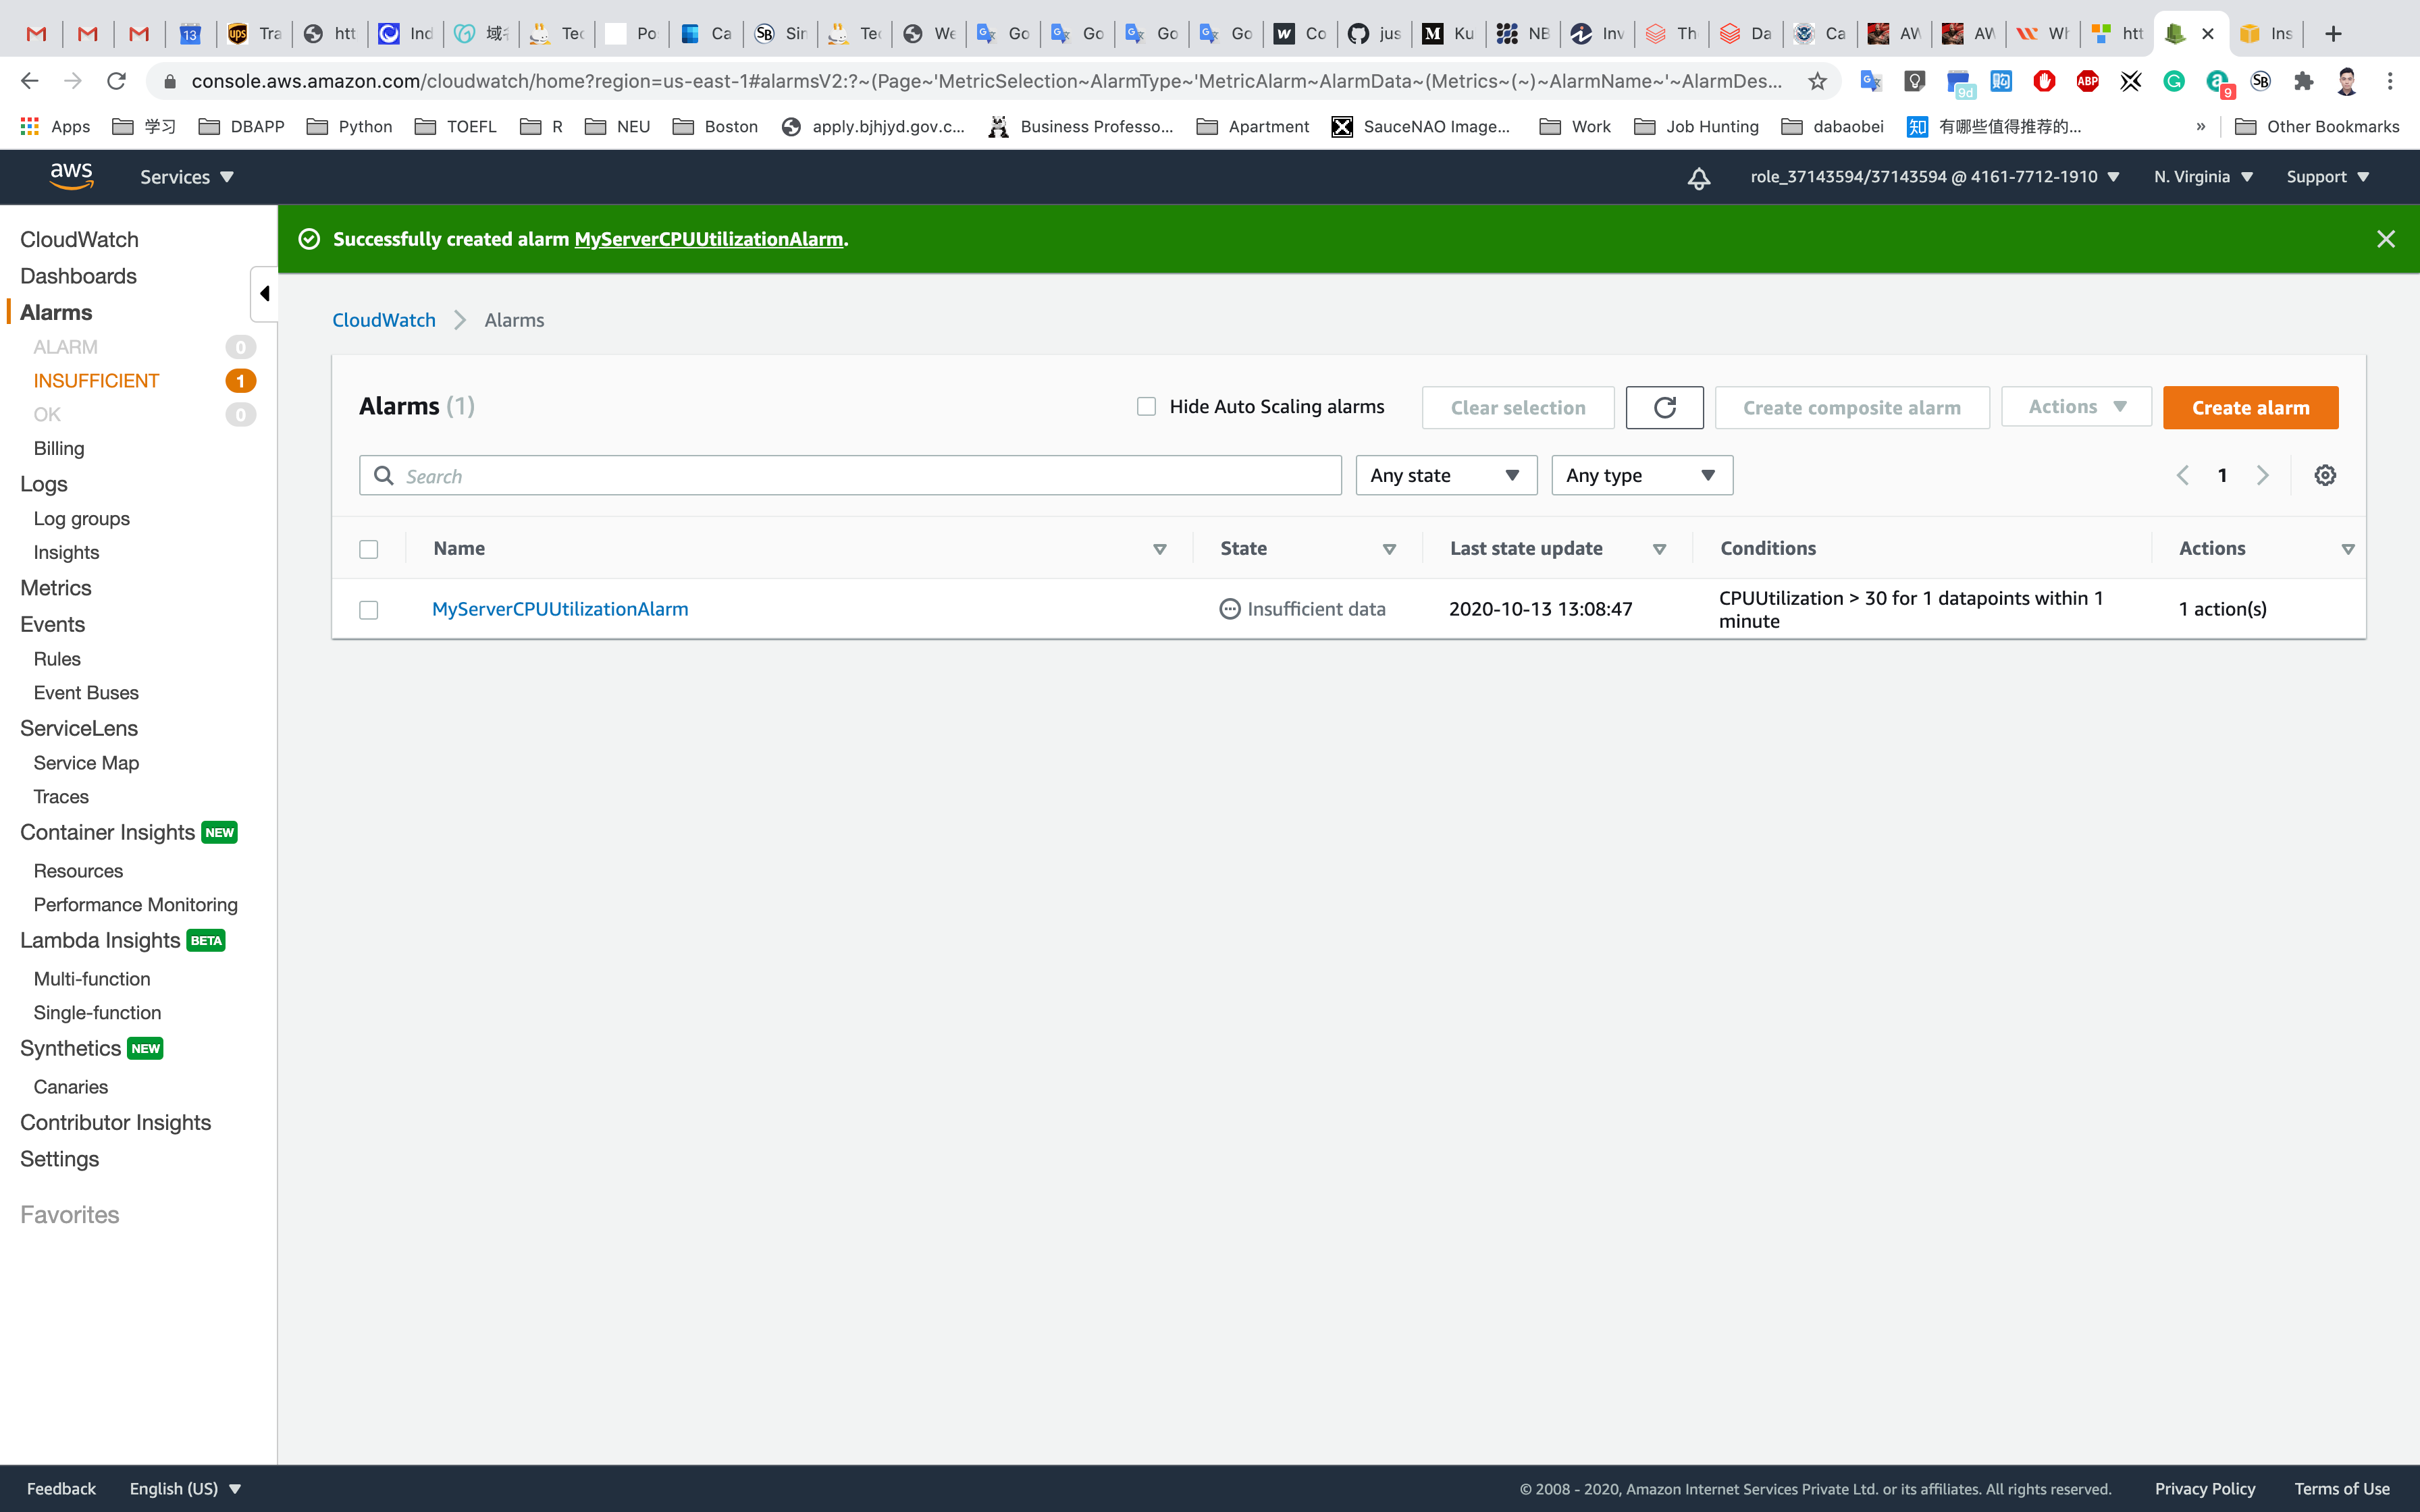
Whenever the CPU Utilization goes above 30 for more than 1 minute, an SNS Notification will be triggered and you will receive an email.
CPU Pressure Test
Testing CloudWatch Alarm by Stressing CPU Utilization
SSH back into the EC2 instance - MyEC2Server.
The stress tool has already been installed. Lets run a command to increase the CPU Utilization manually.
1 | sudo stress --cpu 10 -v --timeout 400s |
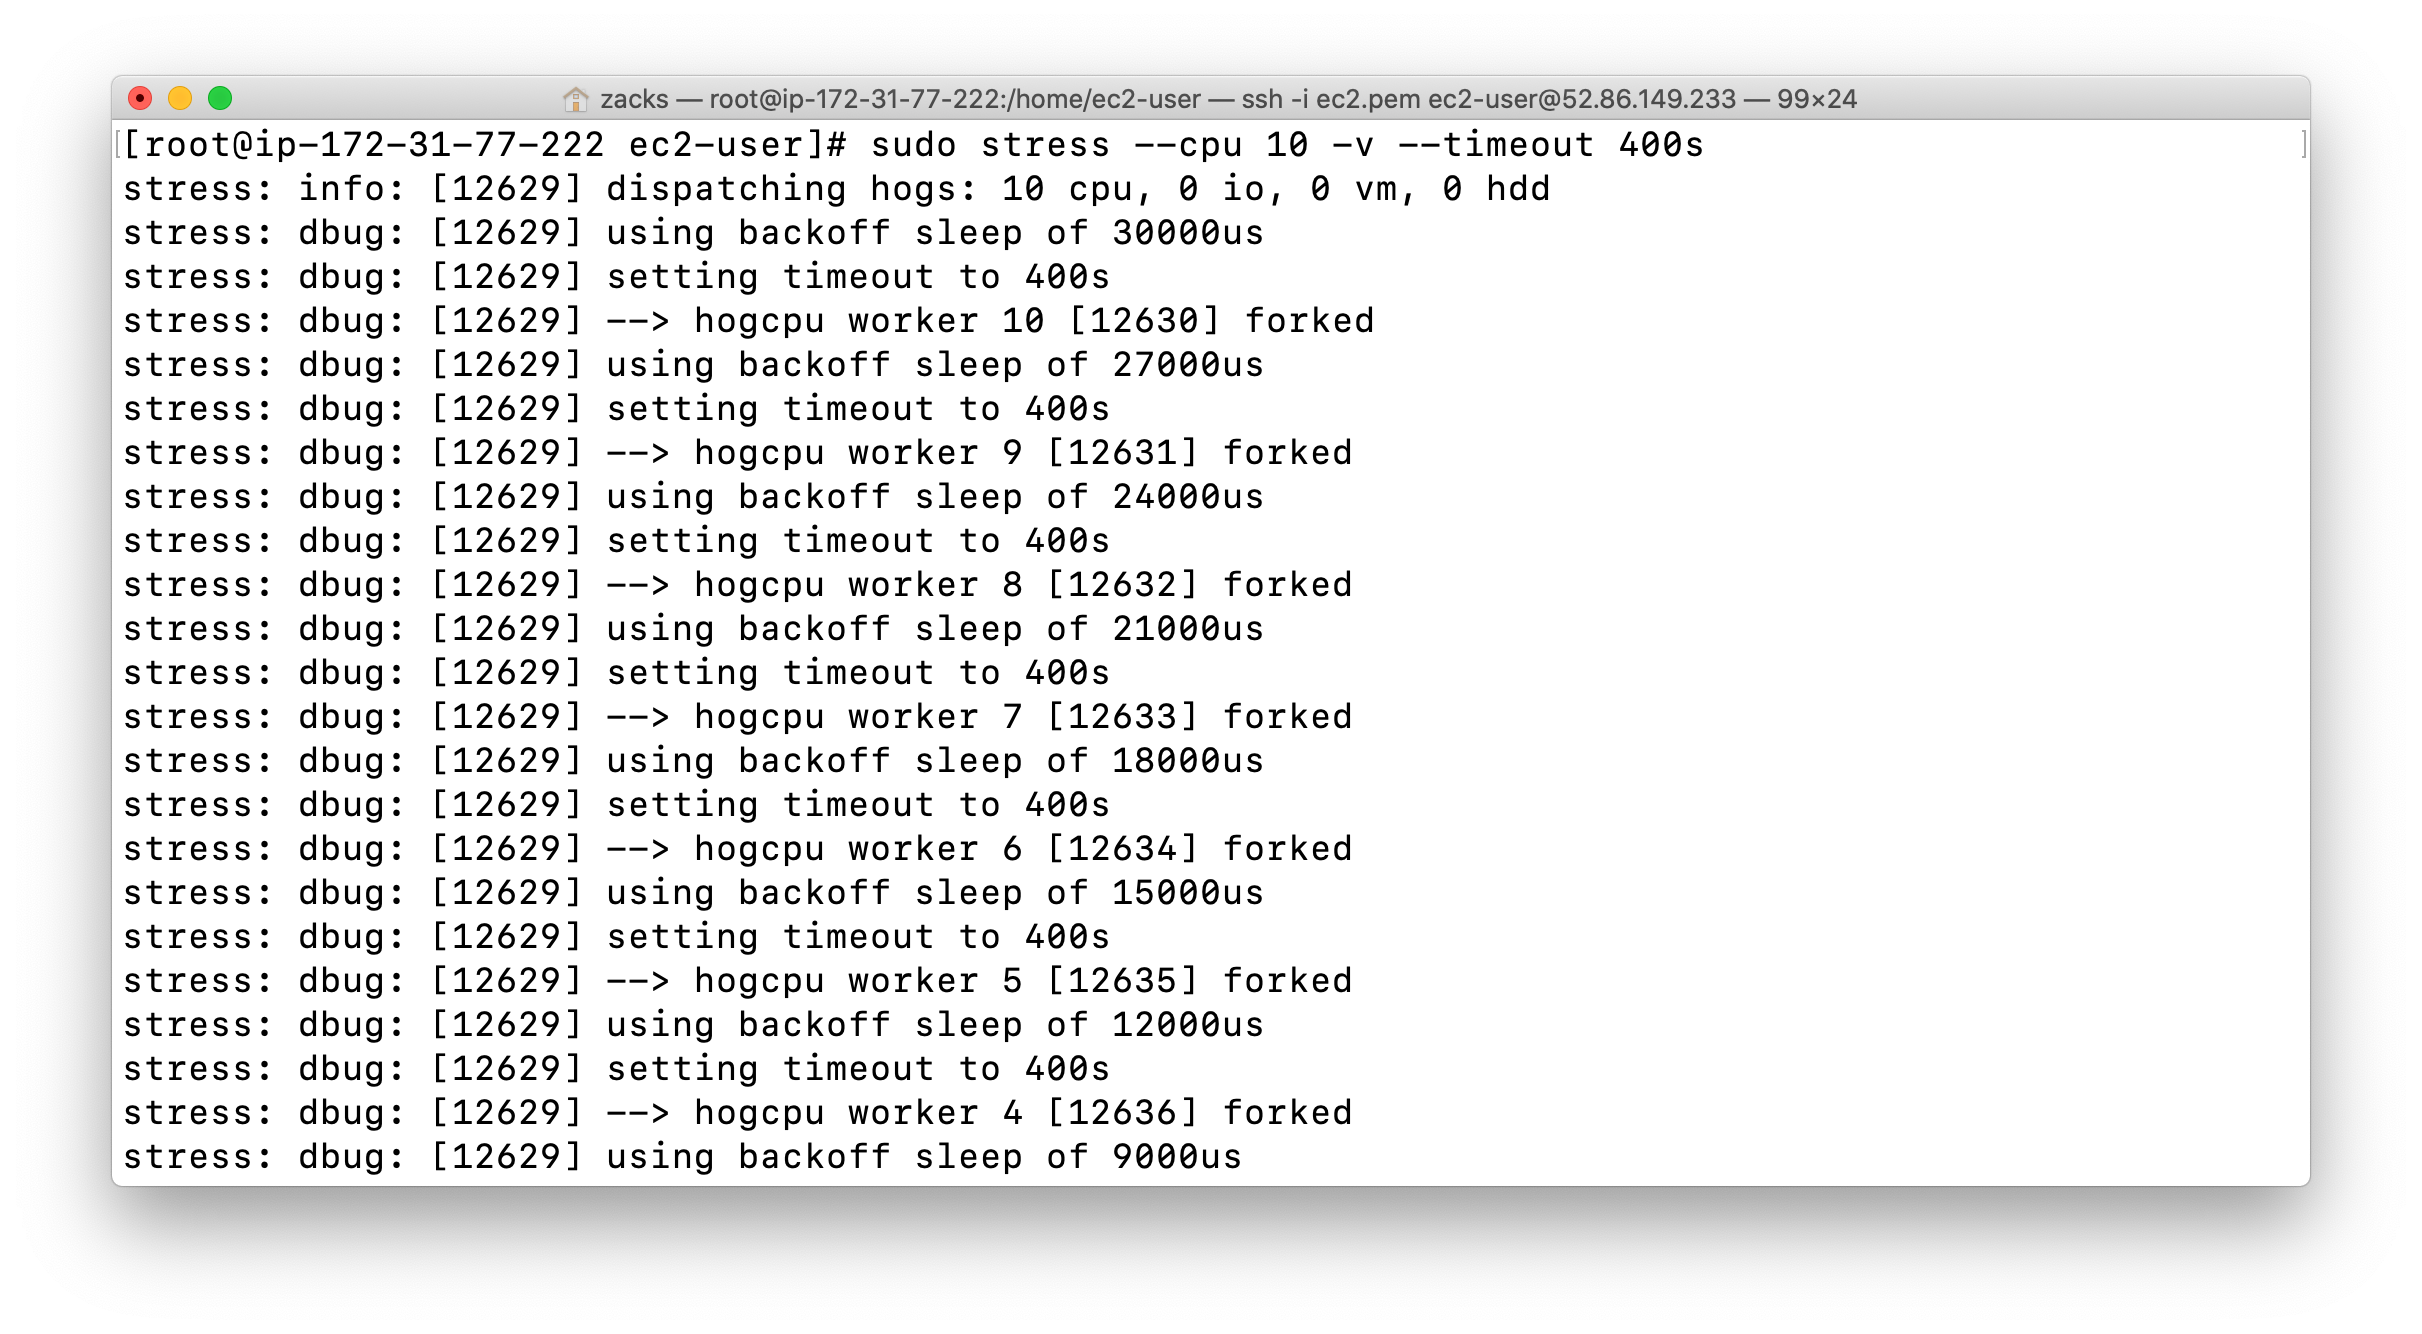
This command shall monitor the process created by the stress tool(which we triggered manually). It will run for 5 minutes and 40 seconds. It will monitor CPU utilization, which should remain very near 100% for that amount of time.
Open another Terminal on your local machine and SSH back in EC2 instance - MyEC2Server.
Run this command to see the CPU utilization:
1 | top |
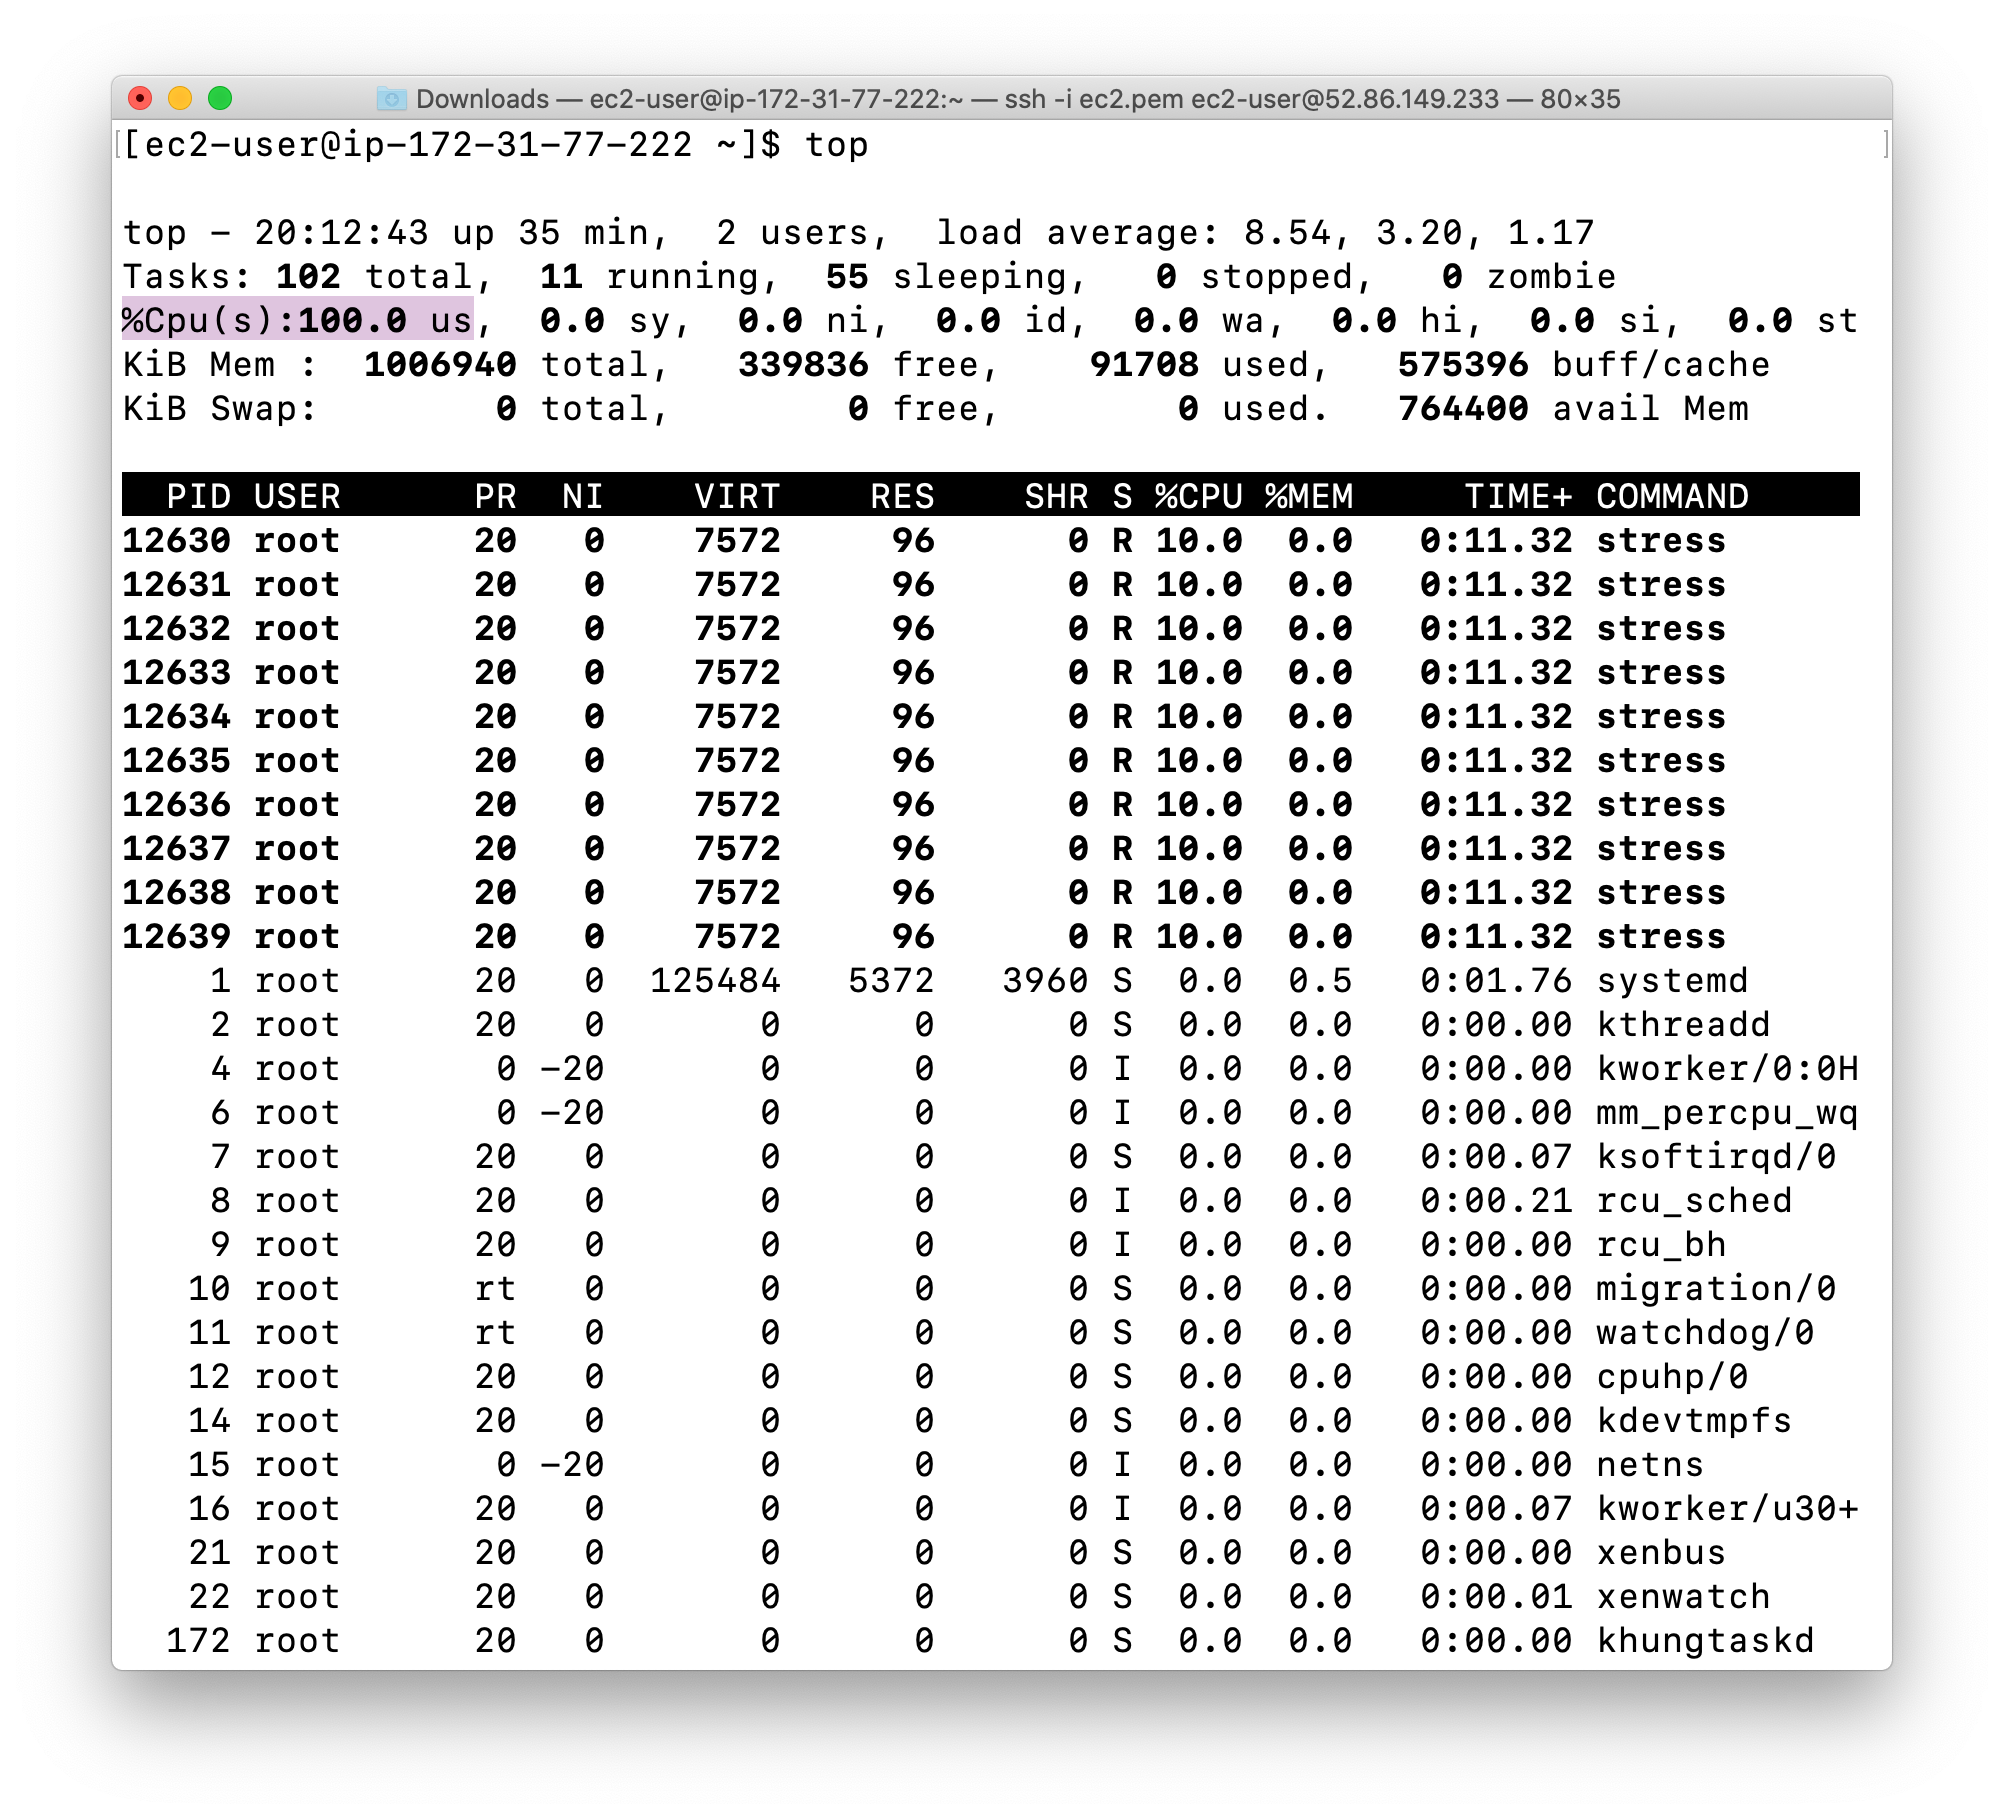
You can now see that %Cpu(s) is 100. By running this stress command, we have manually increased the CPU utilization of the EC2 Instance.
After 400 Seconds, the %Cpu will reduce back to 0.
Checking For an Email from the SNS Topic
Navigate to your mailbox and refresh it. You should see a new email notification for MyServerCPUUtilizationAlarm.
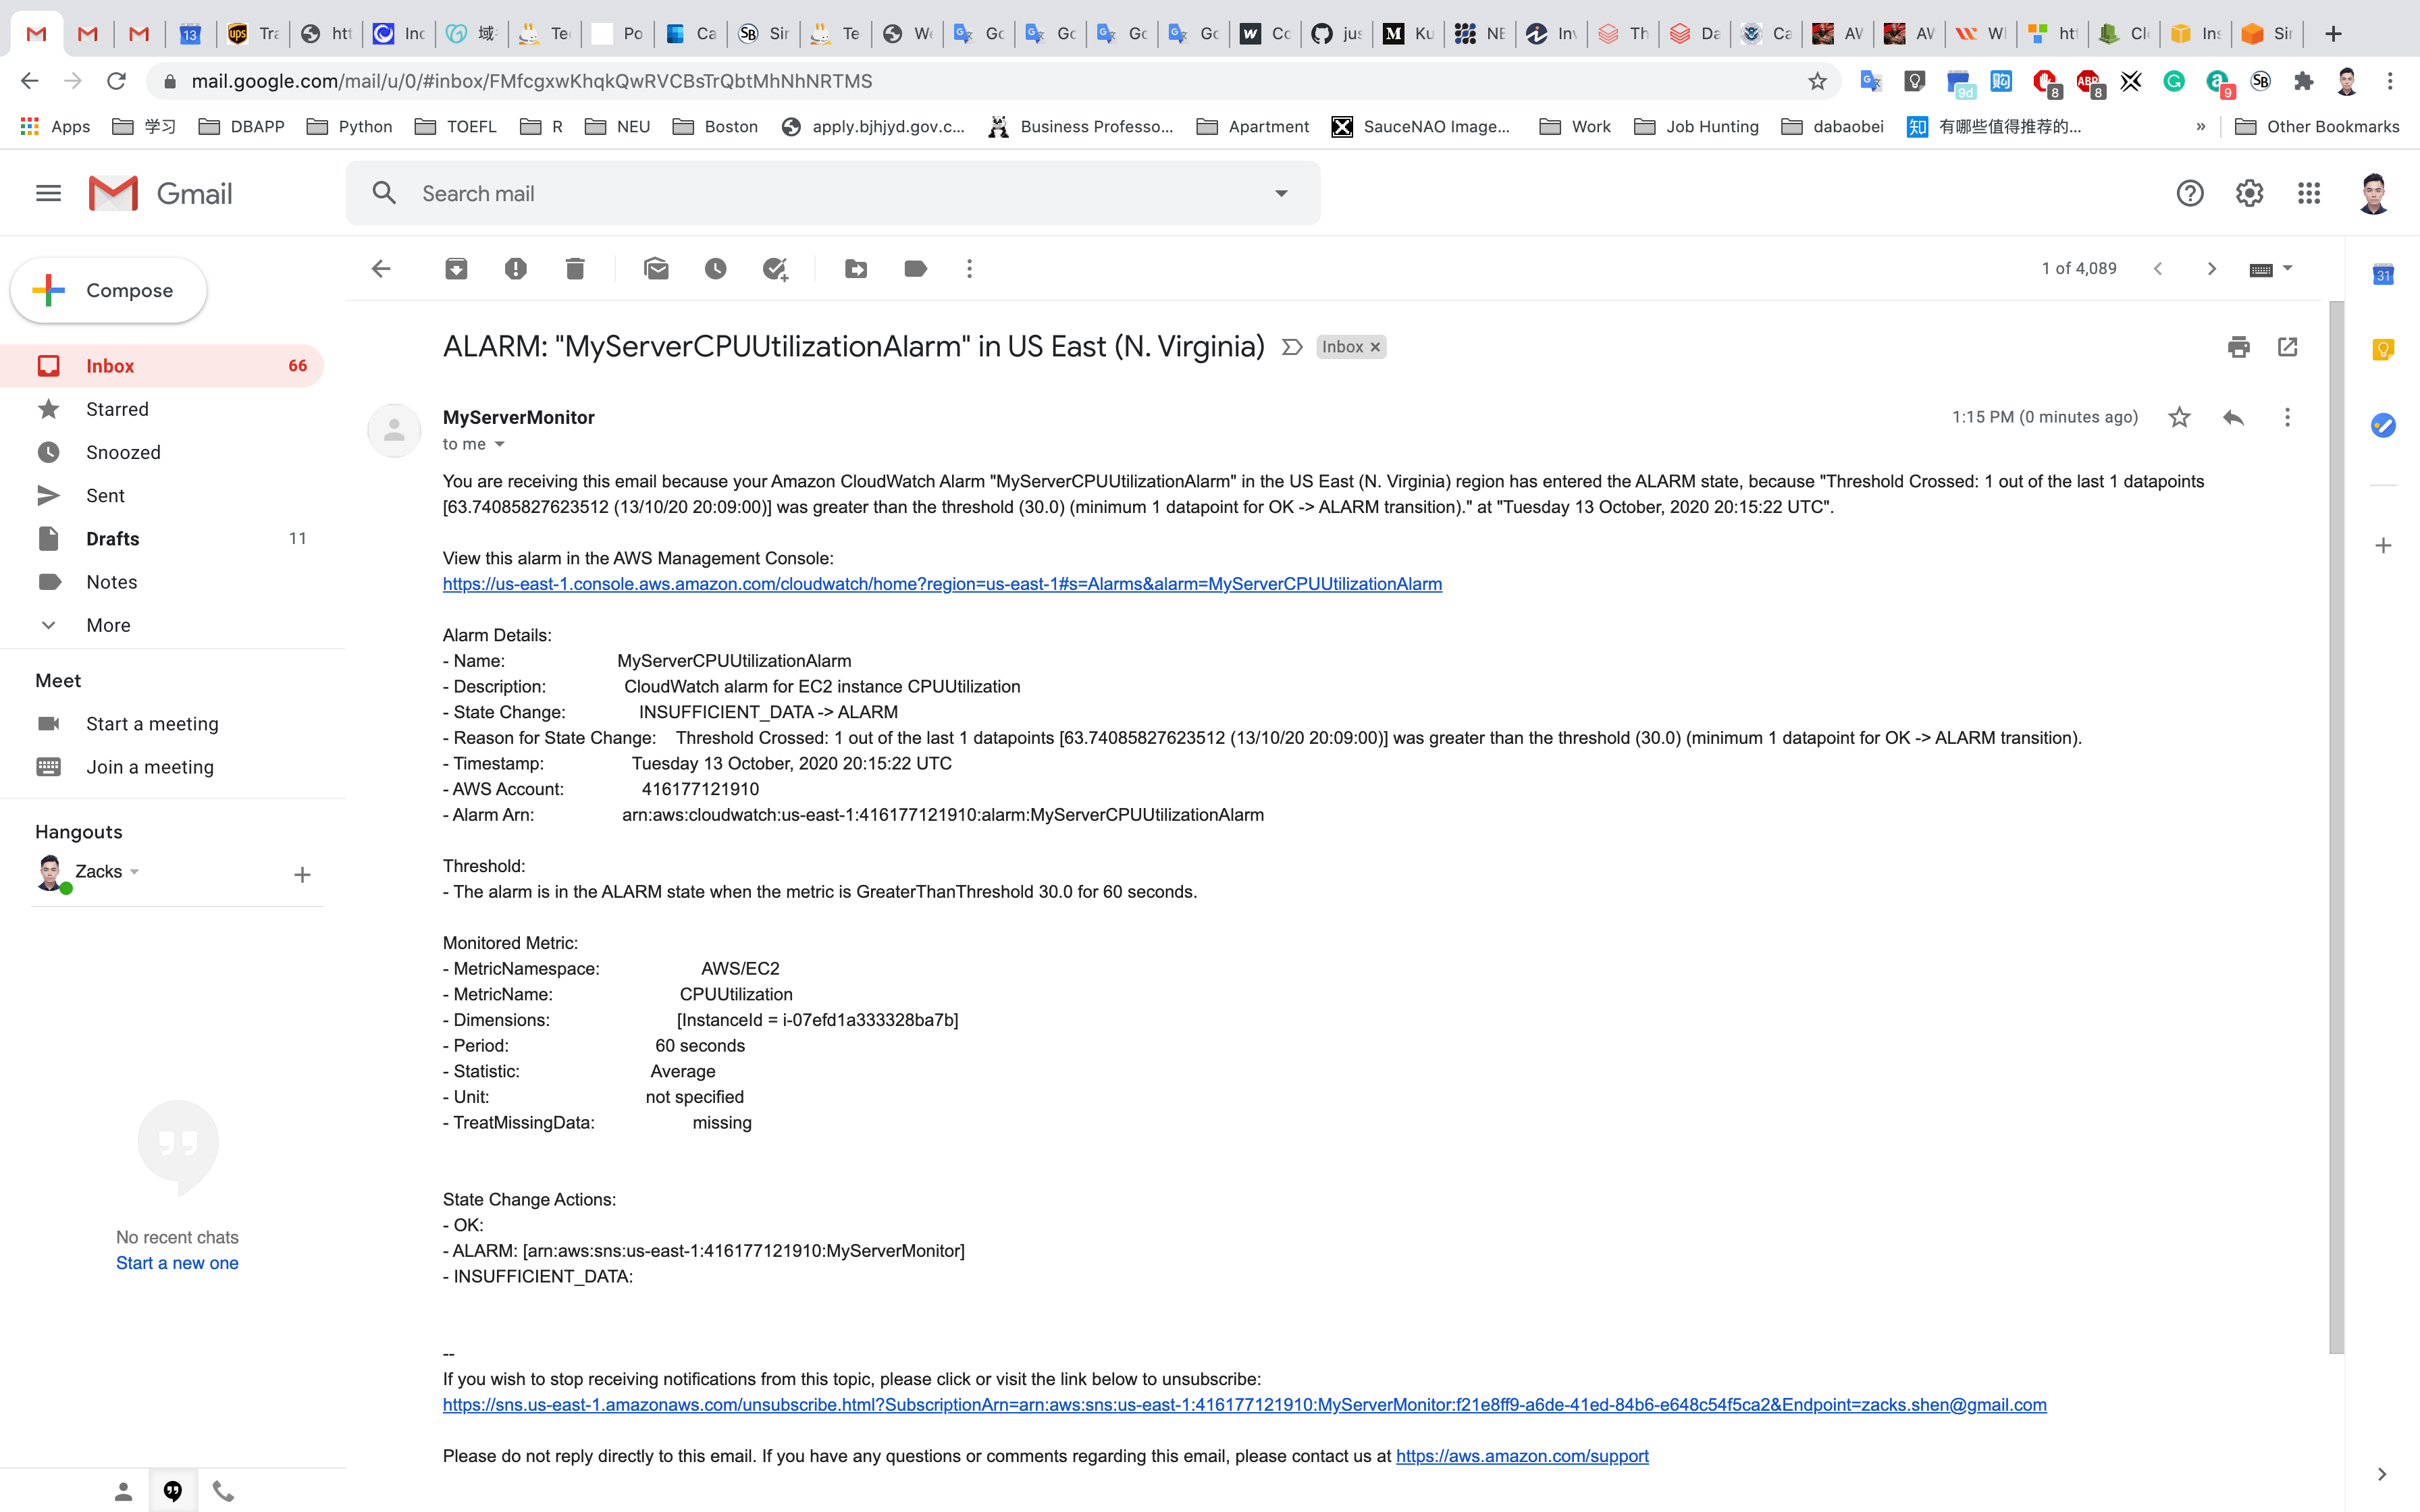
We can see that mail we received contains details about our CloudWatch Alarm,(name of the alarm, when it was triggered, etc.).
Checking the CloudWatch Alarm Graph
Navigate back to CloudWatch page, Click on Alarms.
Click on MyServerCPUUtilizationAlarm.
On the Graph, you can see places where CPUUtilization has gone above the 30% threshold.
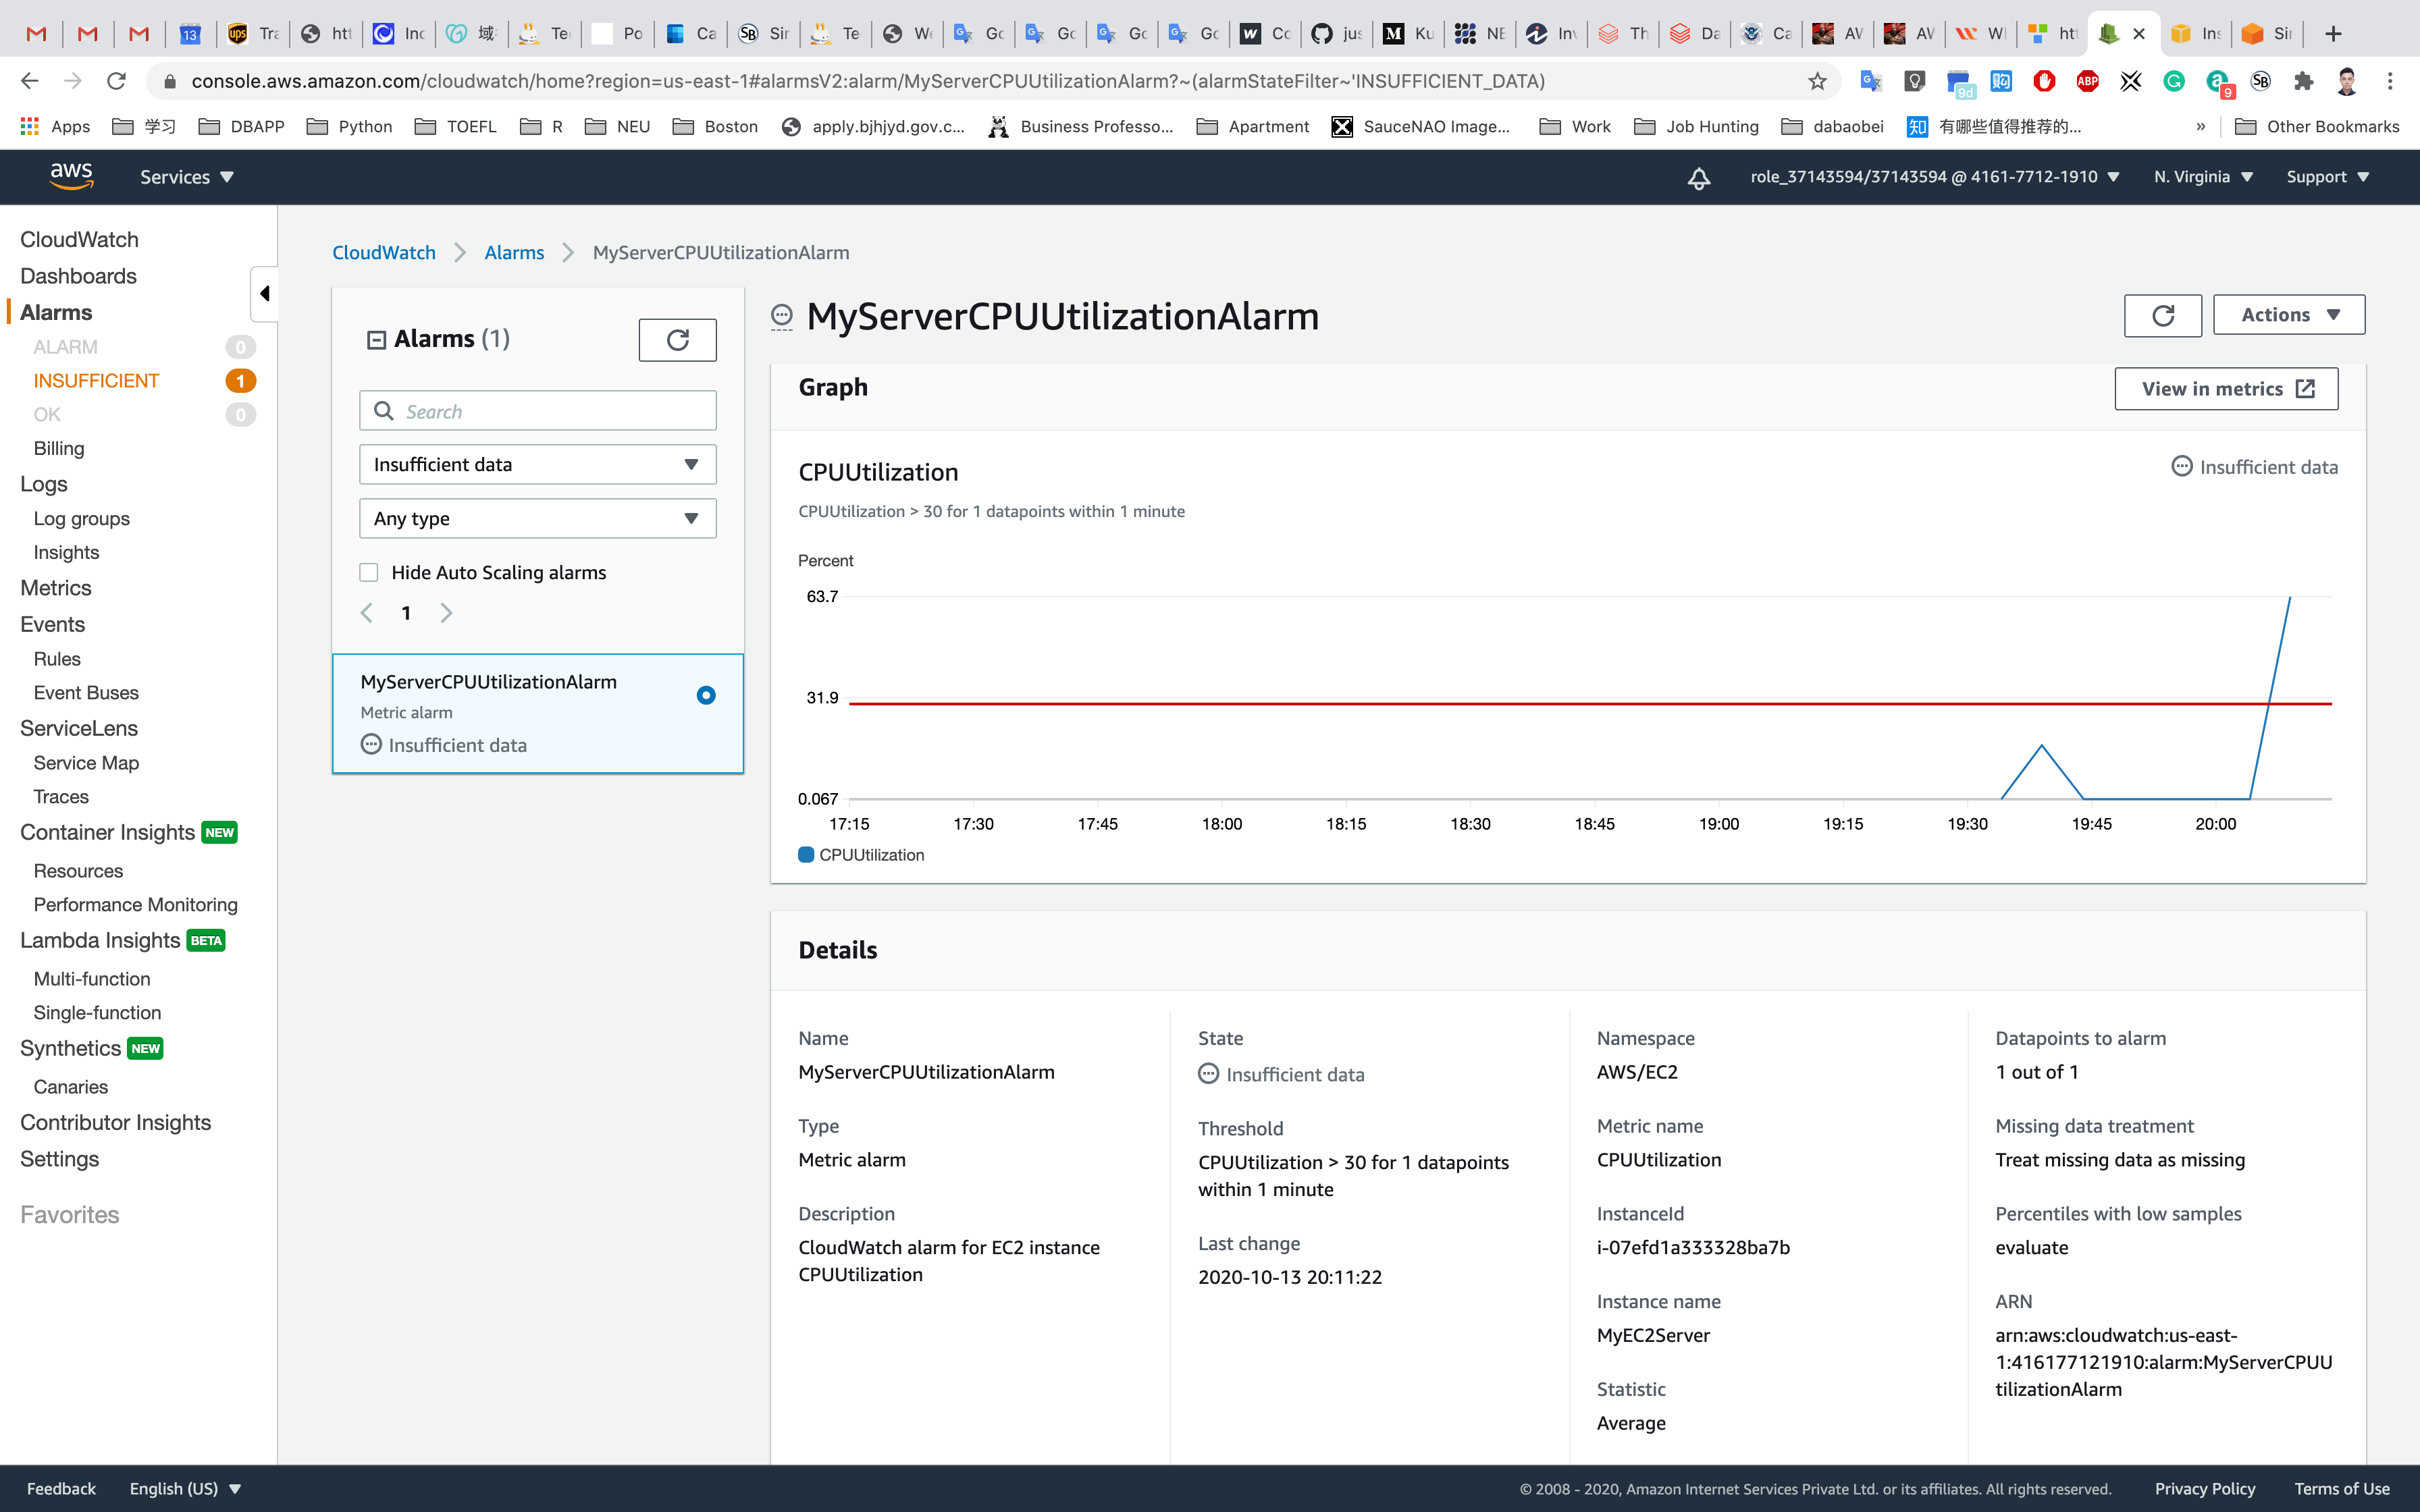
We can trigger CPUUtilization multiple times to see the spike on the graph.
You have successfully triggered a CloudWatch Alarm for CPUUtilization.
Create a CloudWatch Dashboard
We can create a simple Cloudwatch dashboard to see the CPUUtilization and various other metric widgets.
Click on Dashboard in the left panel of the CloudWatch page.
Click on Create Dashboard.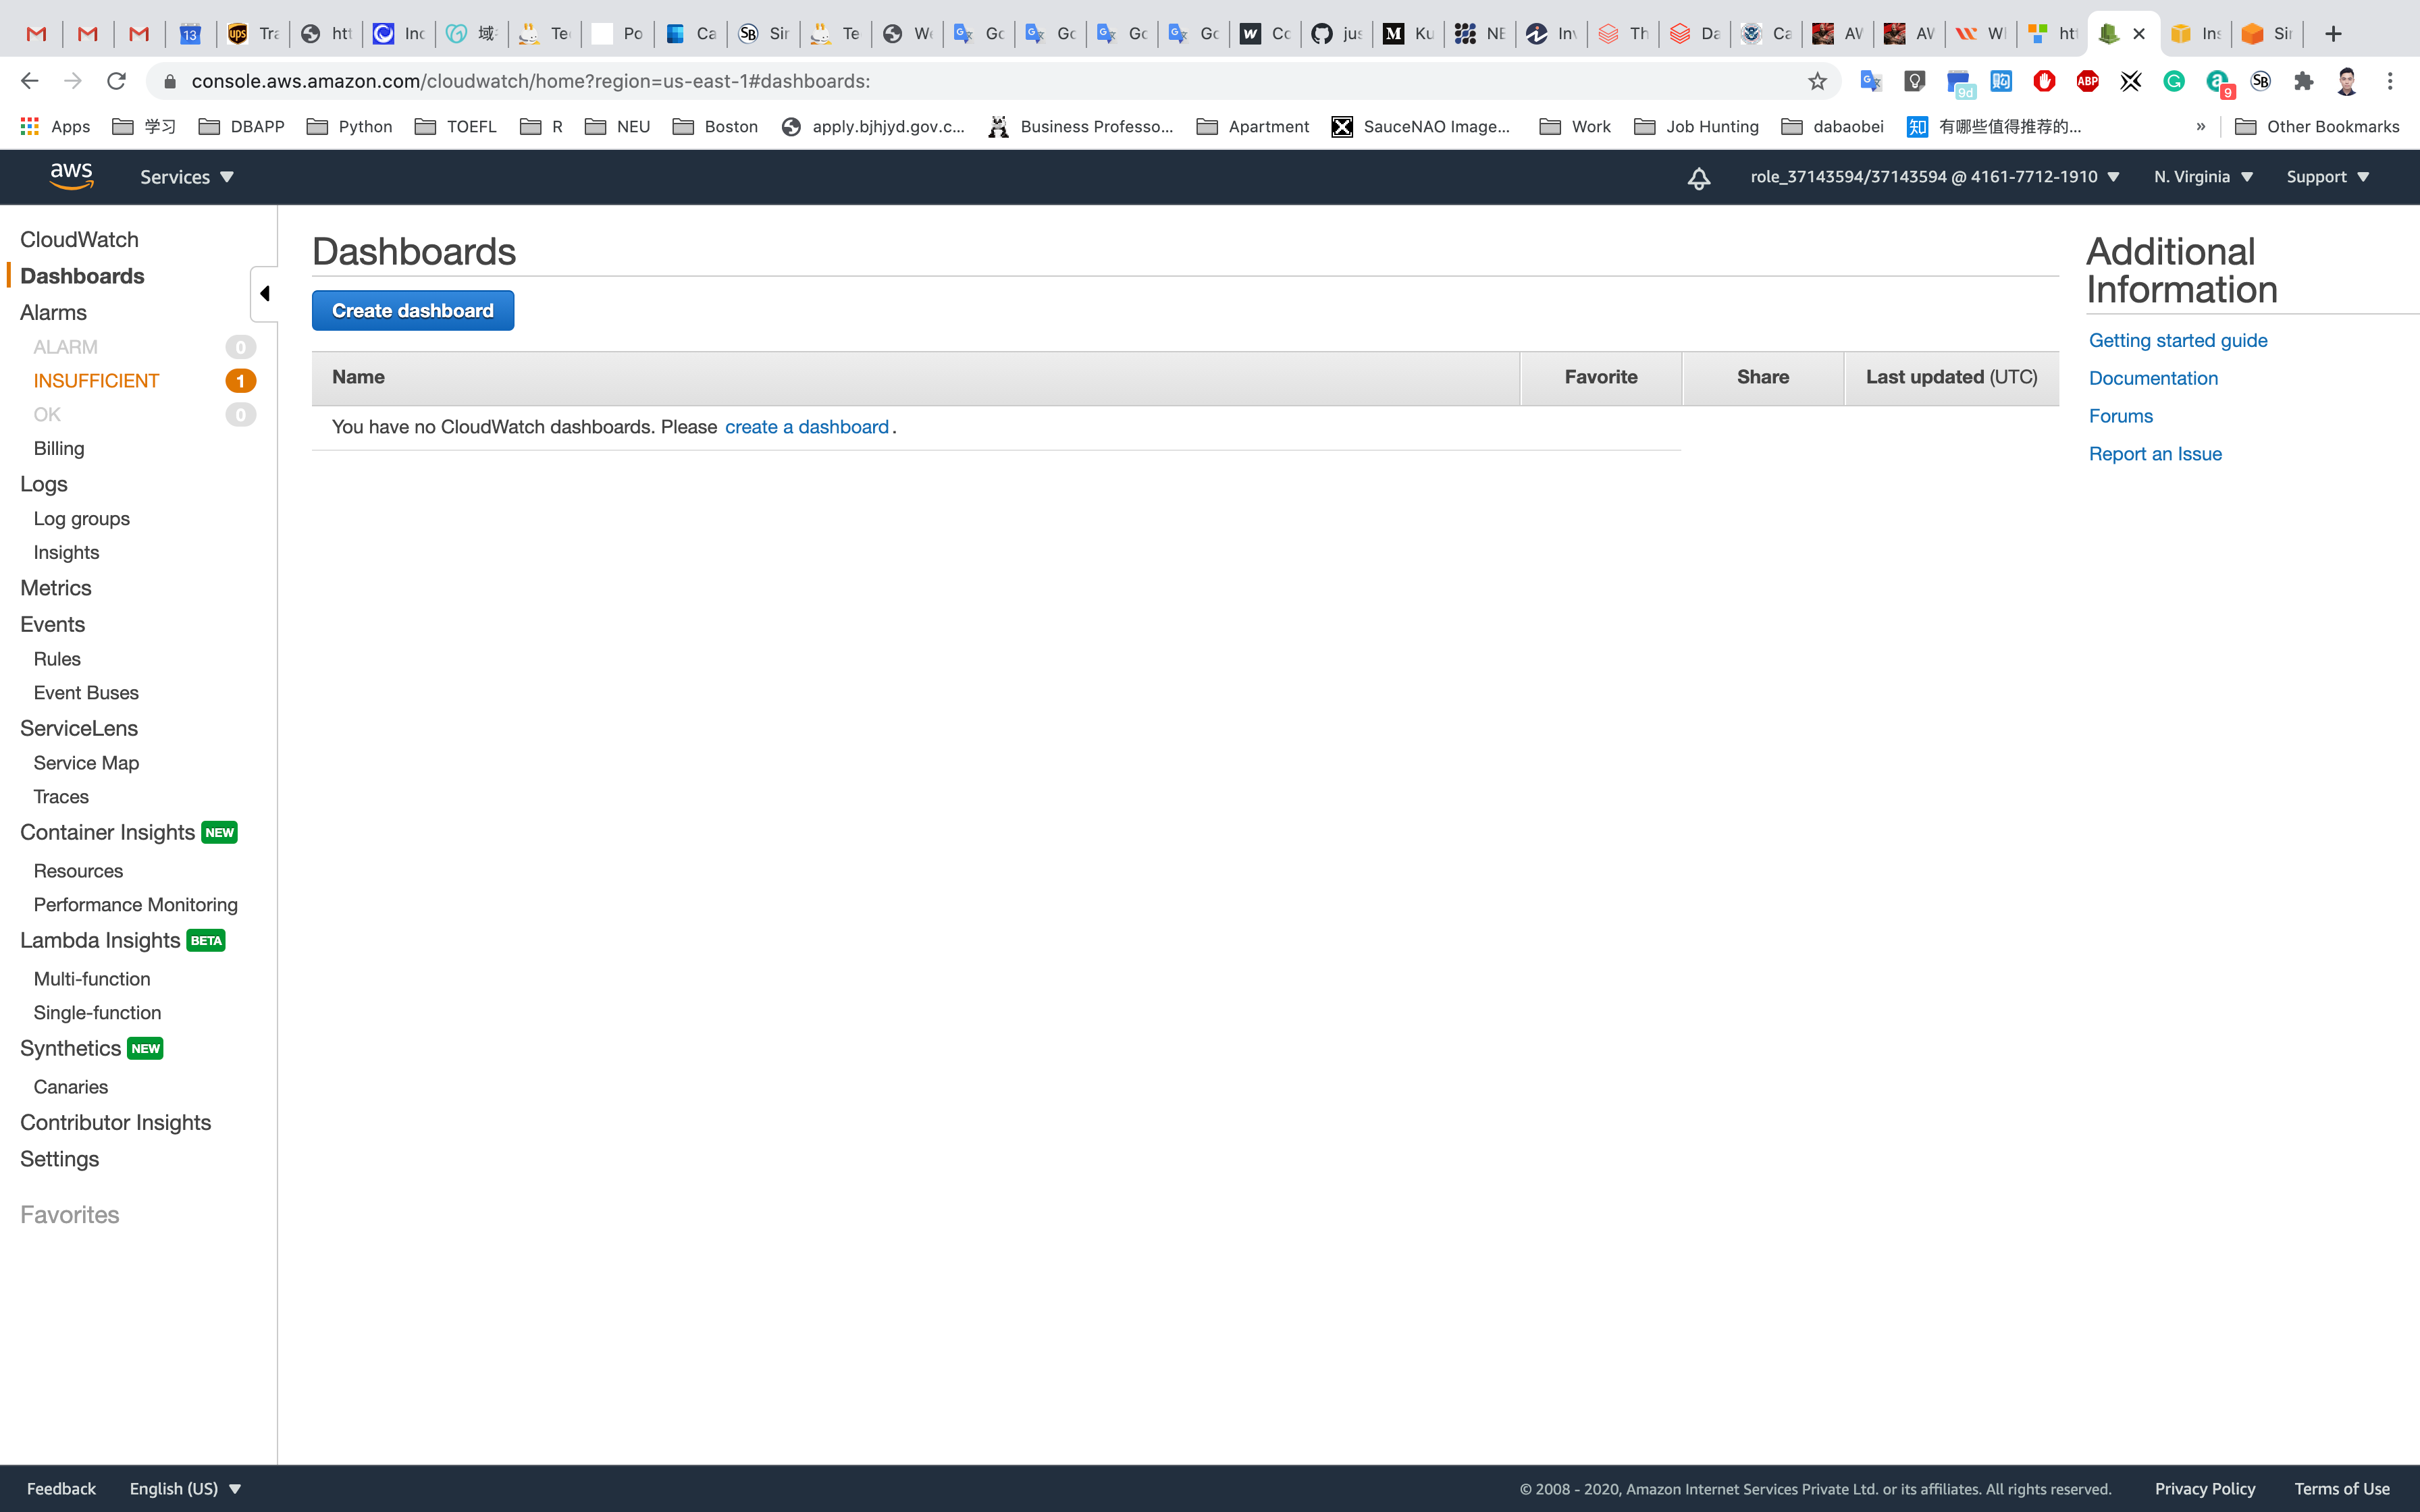
Dashboard name: MyEC2ServerDashboard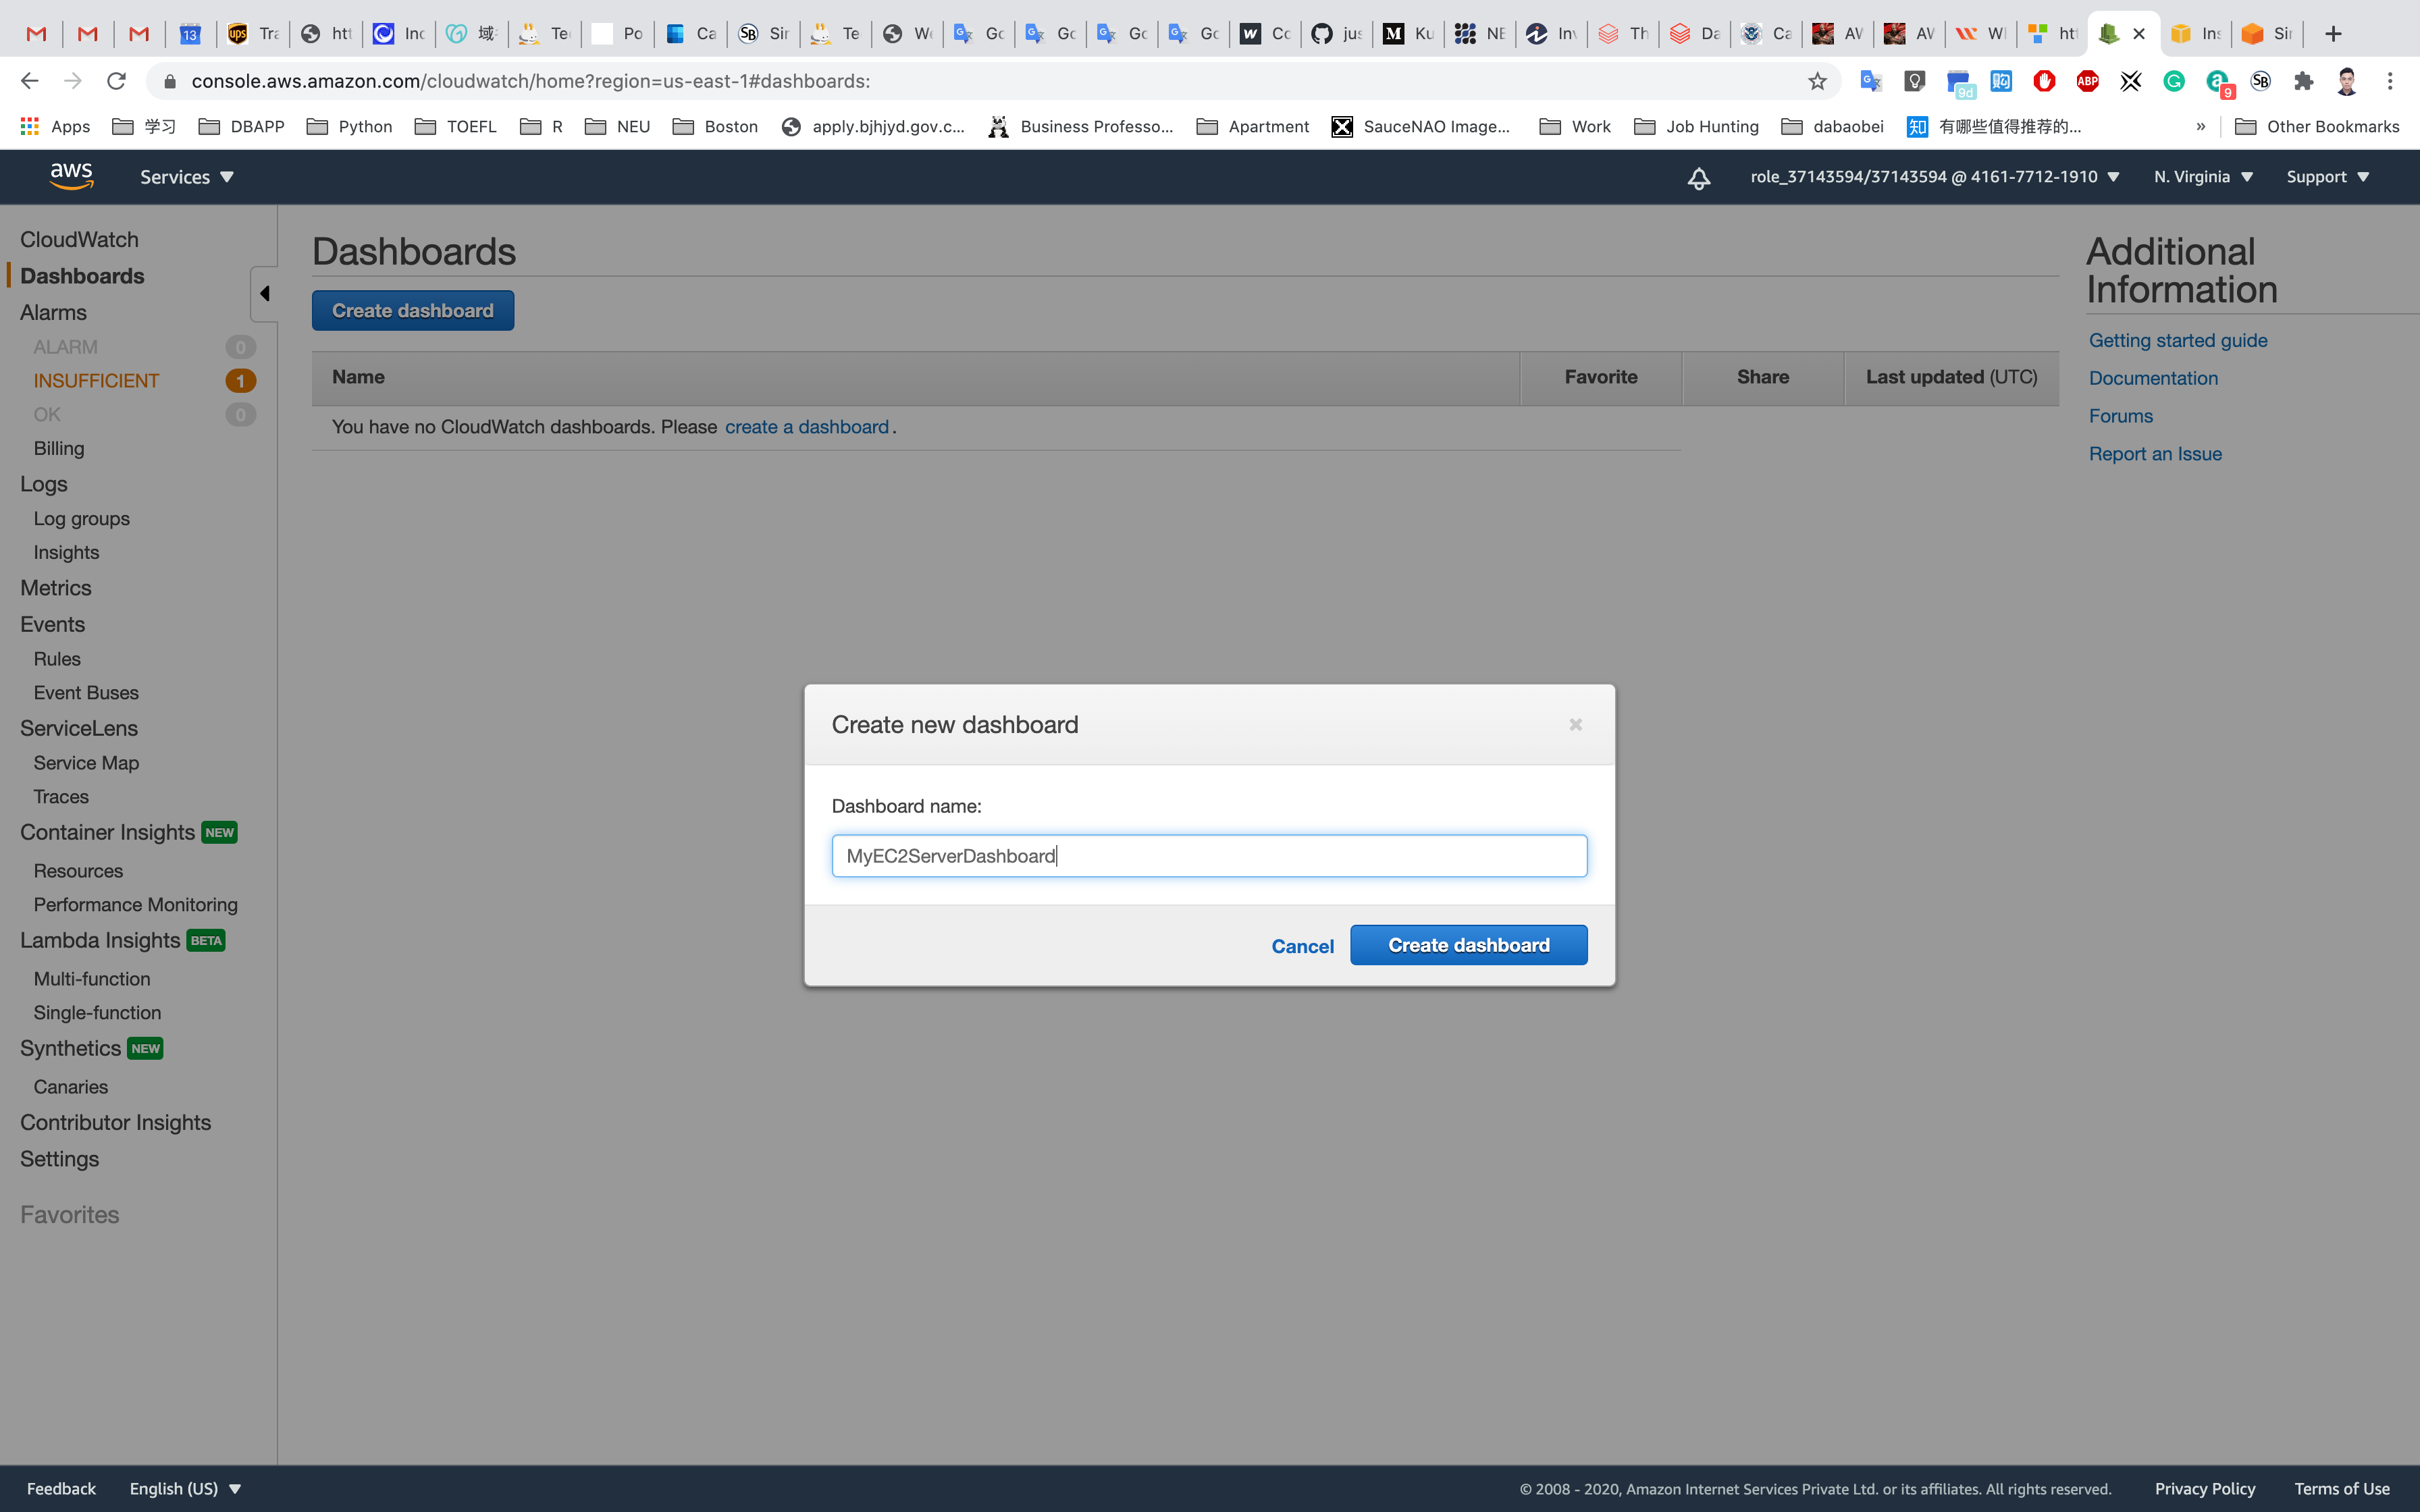
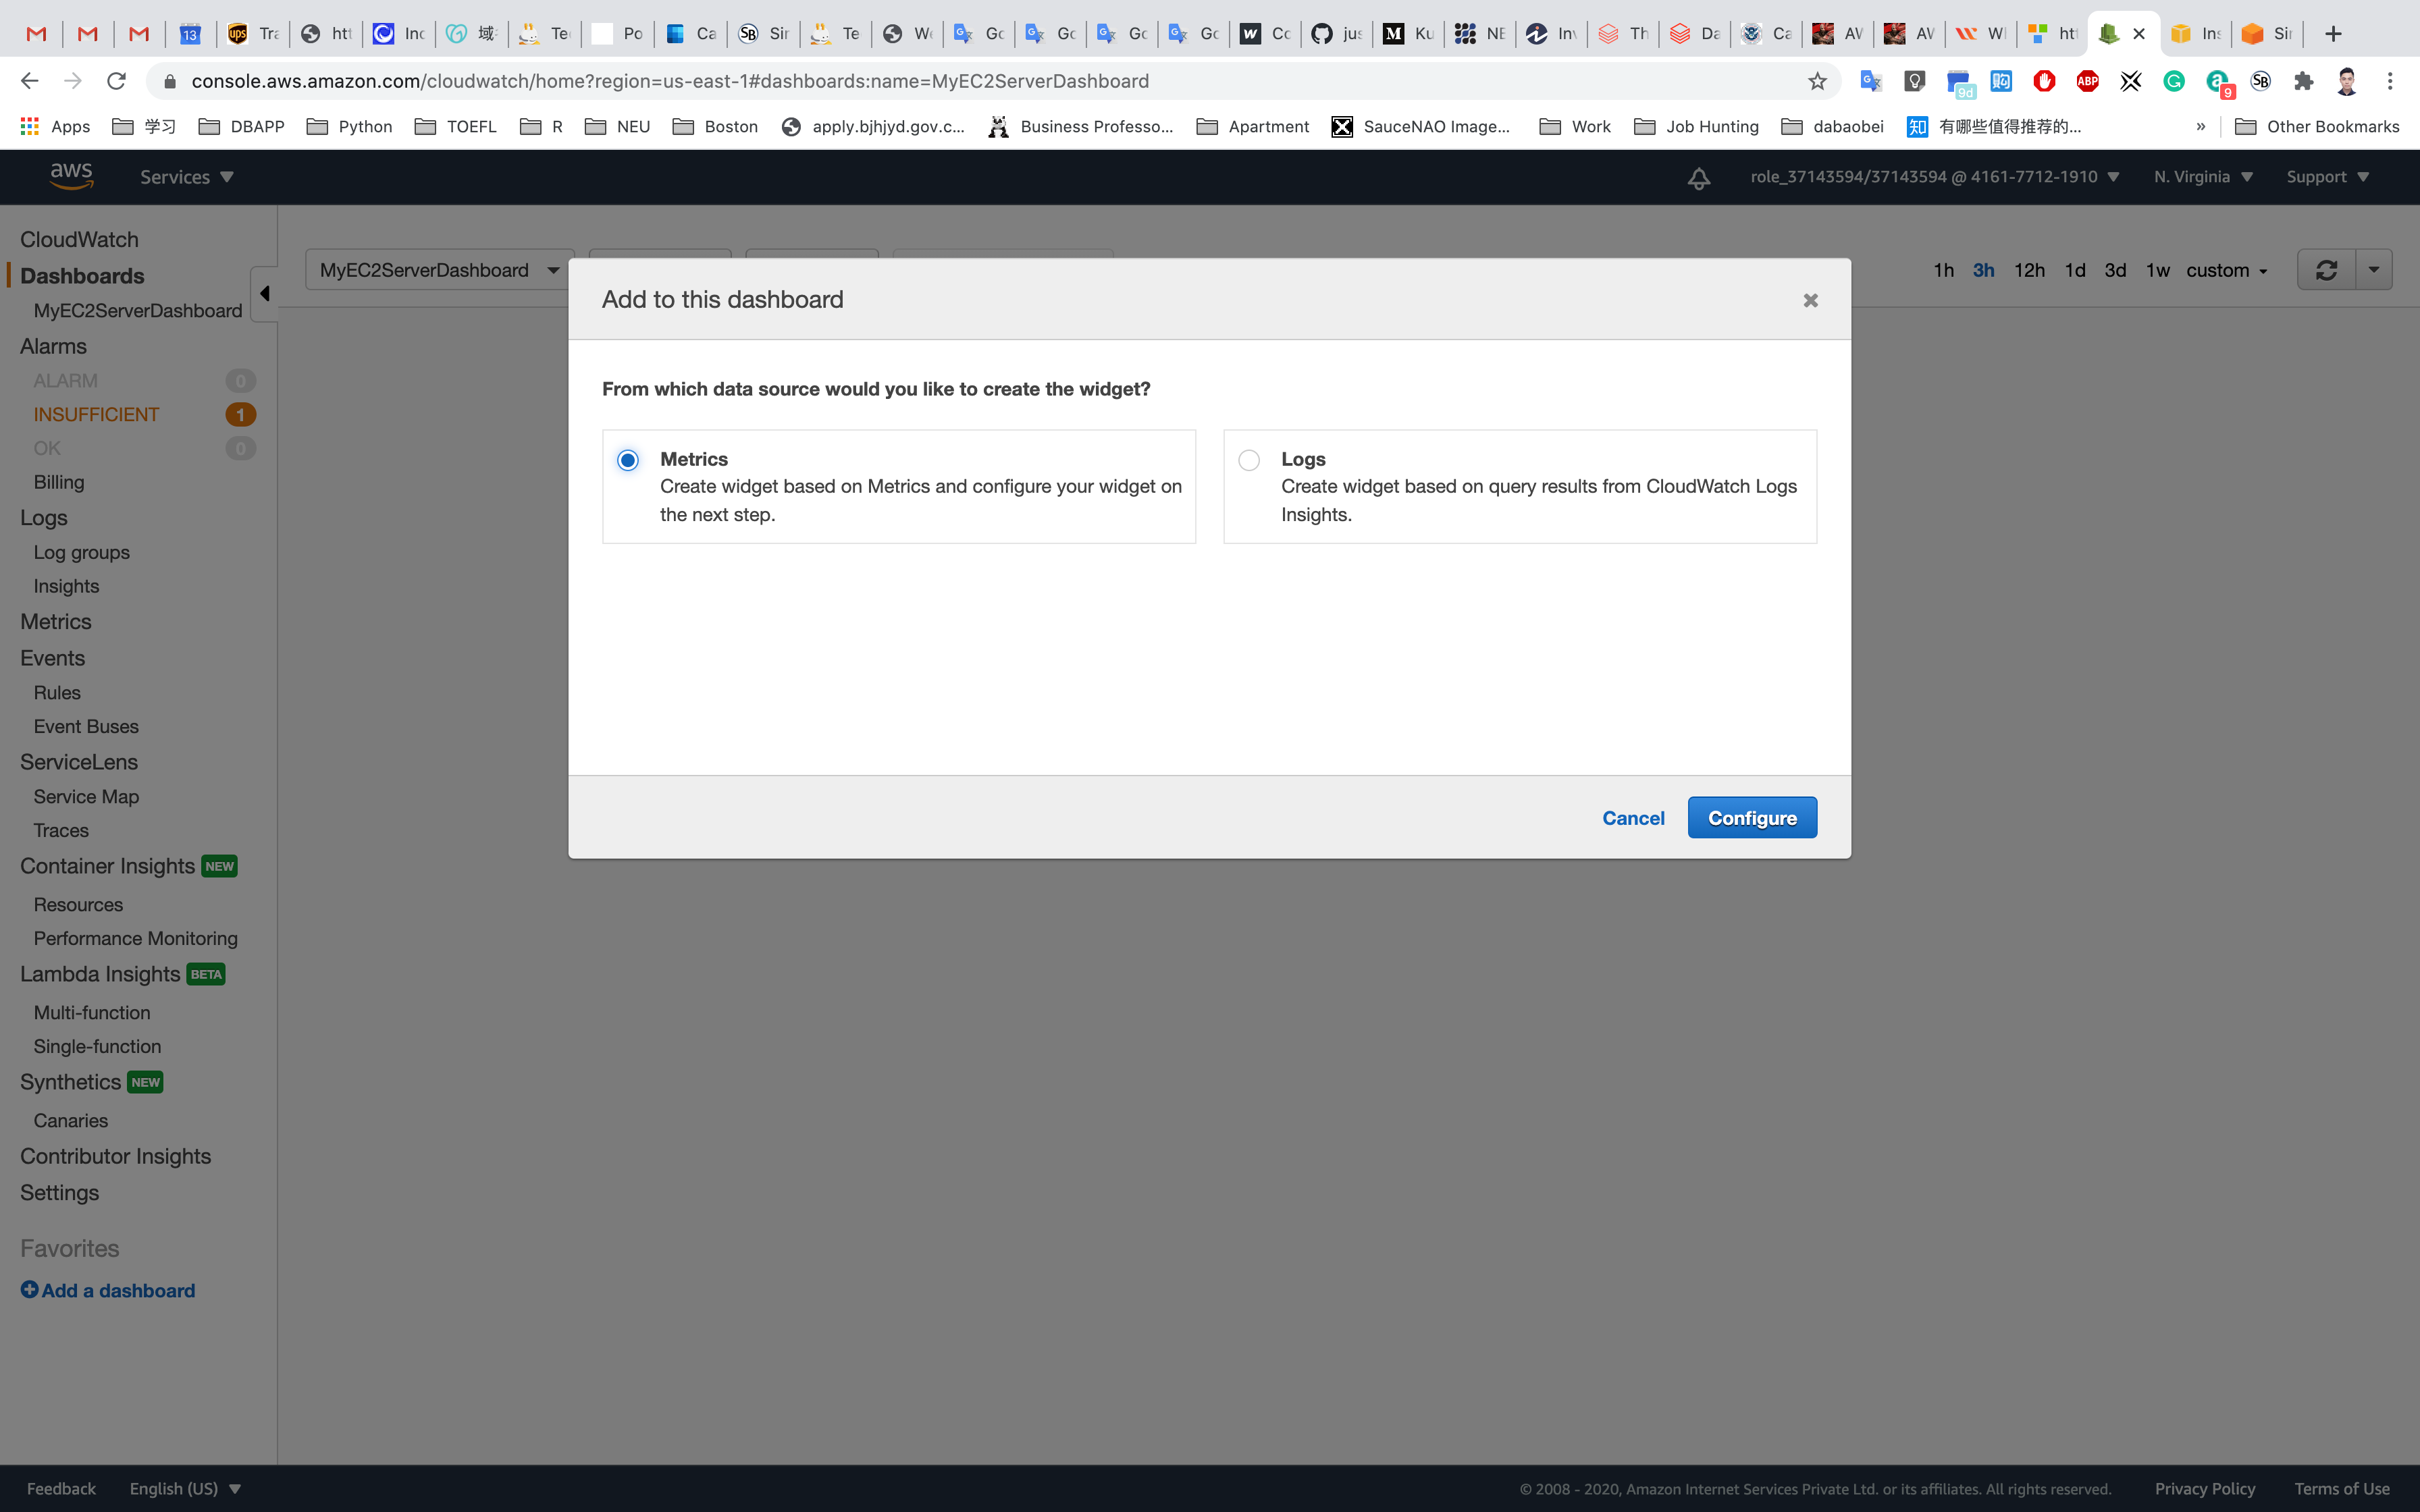
Add to this dashboard : Select Line Graph. Click on Next.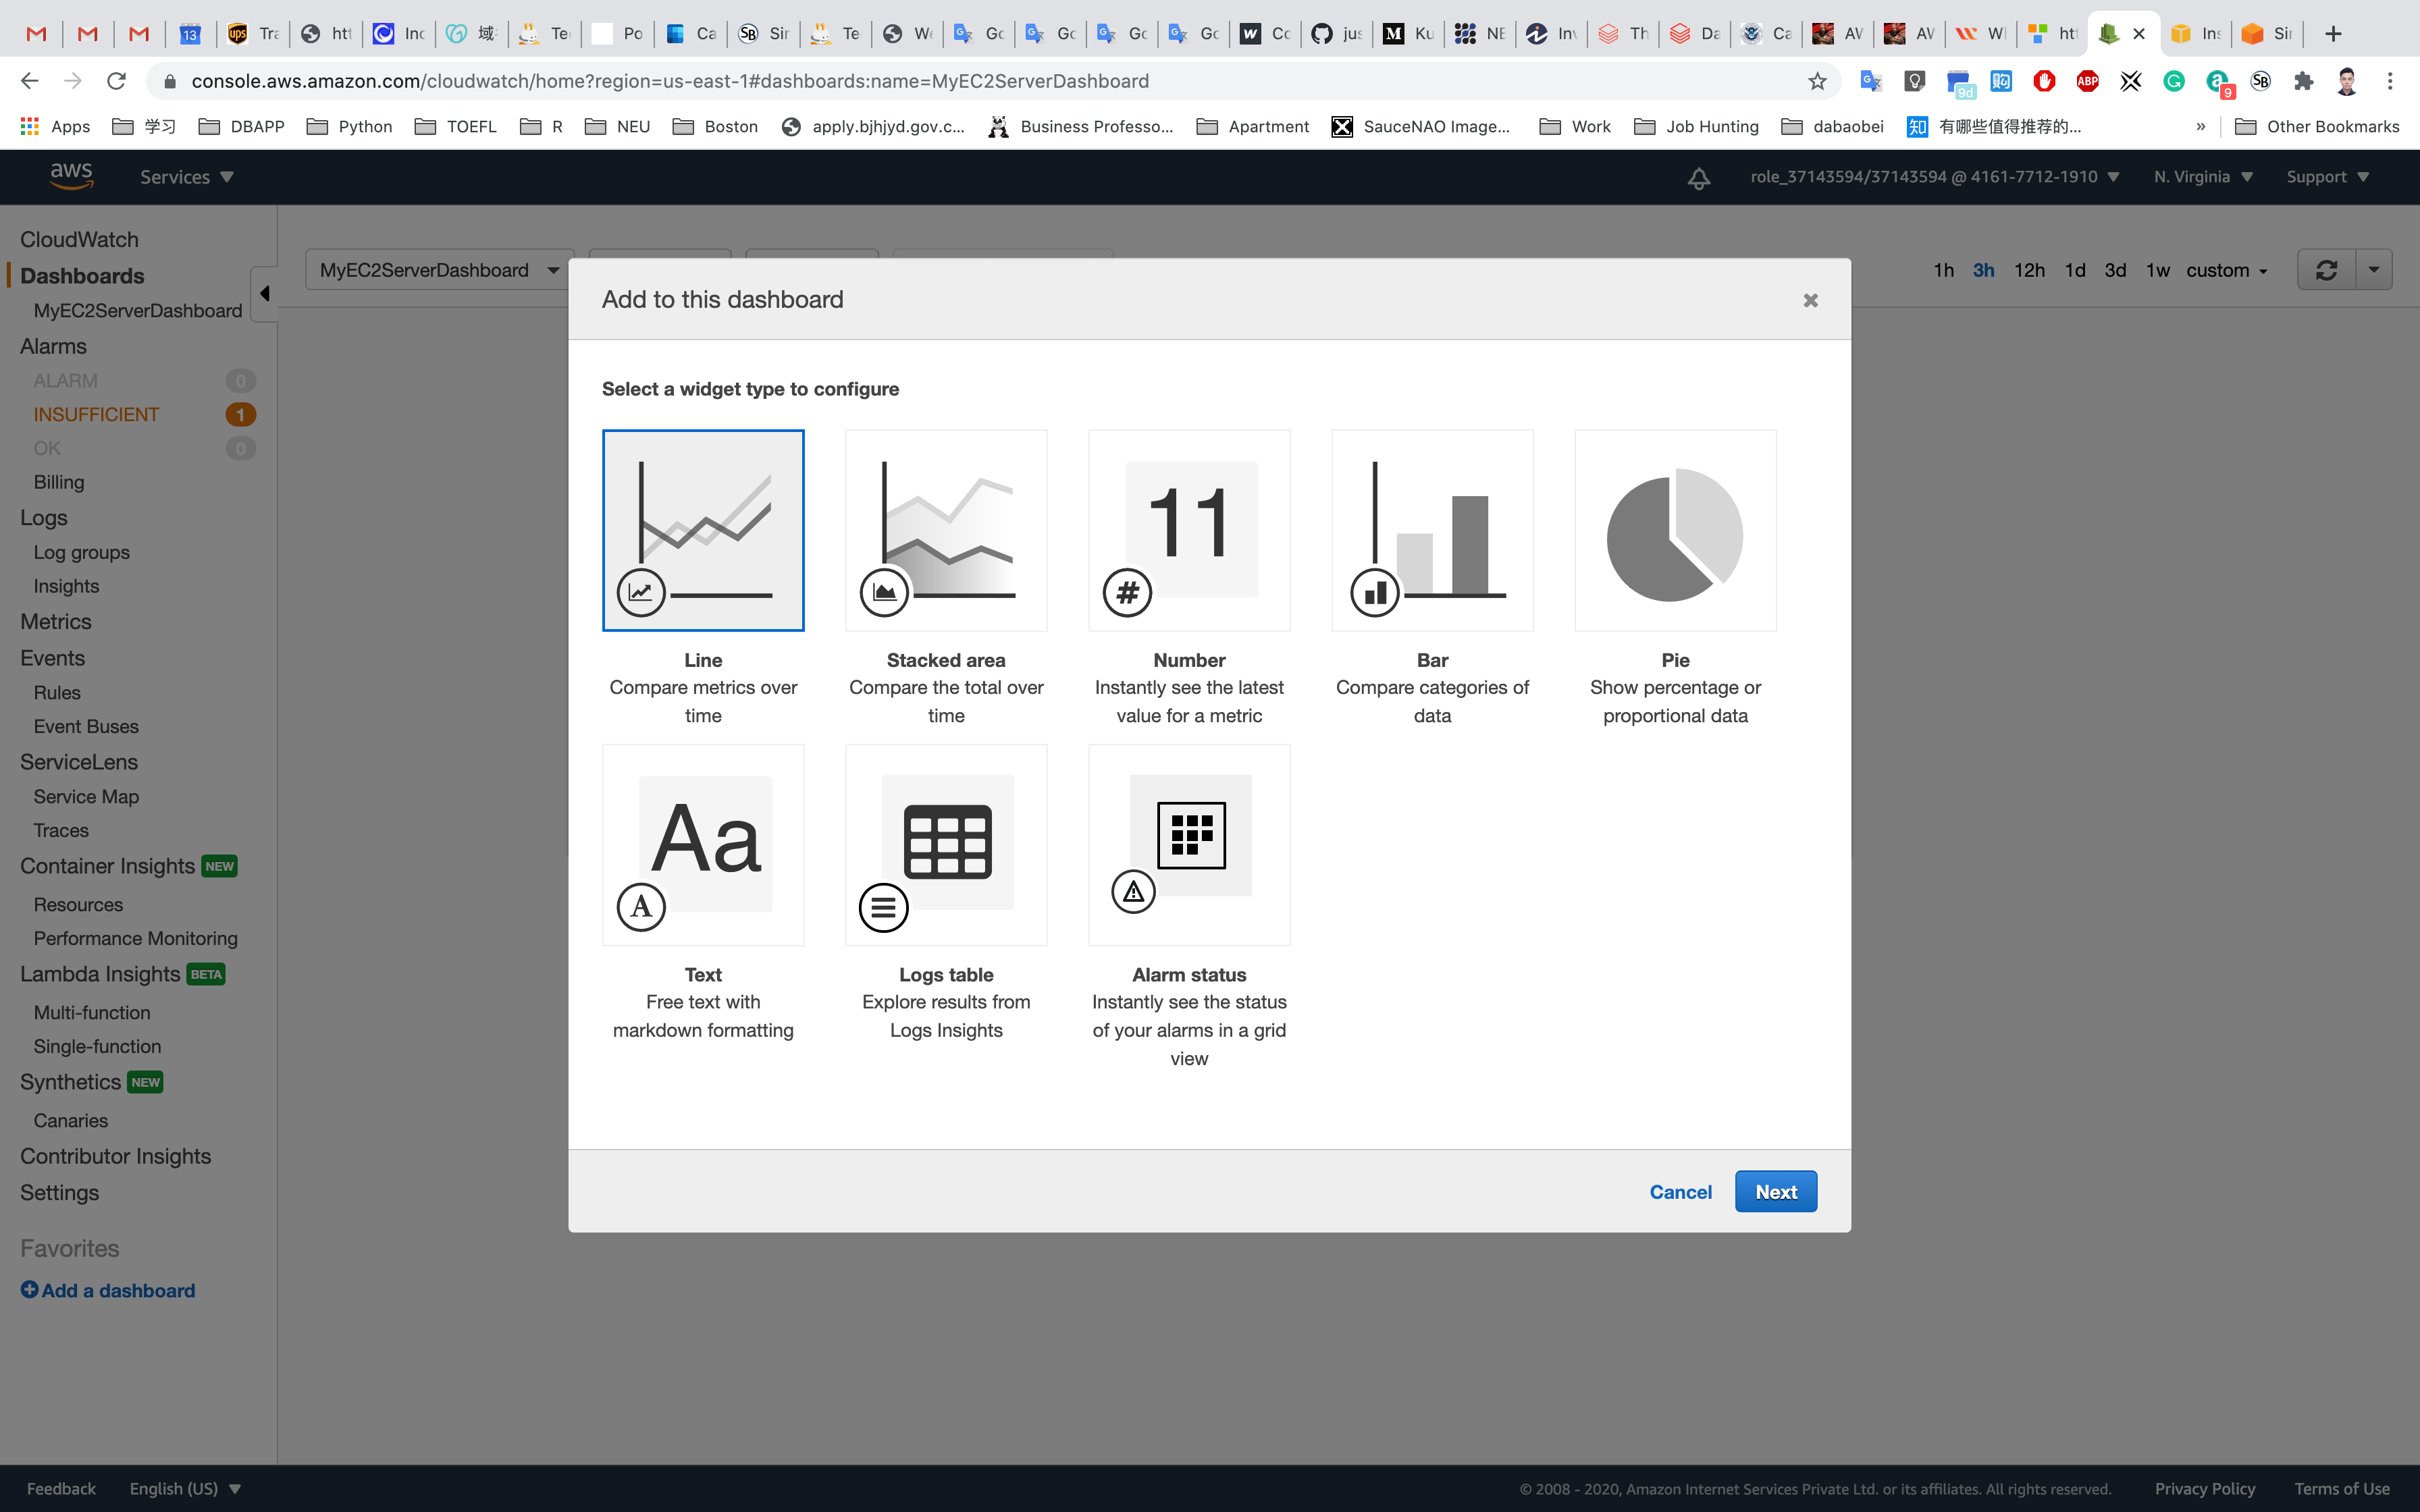
On the next page, Choose EC2 under the All Metrics tab. Choose Per-Instance Metrics.
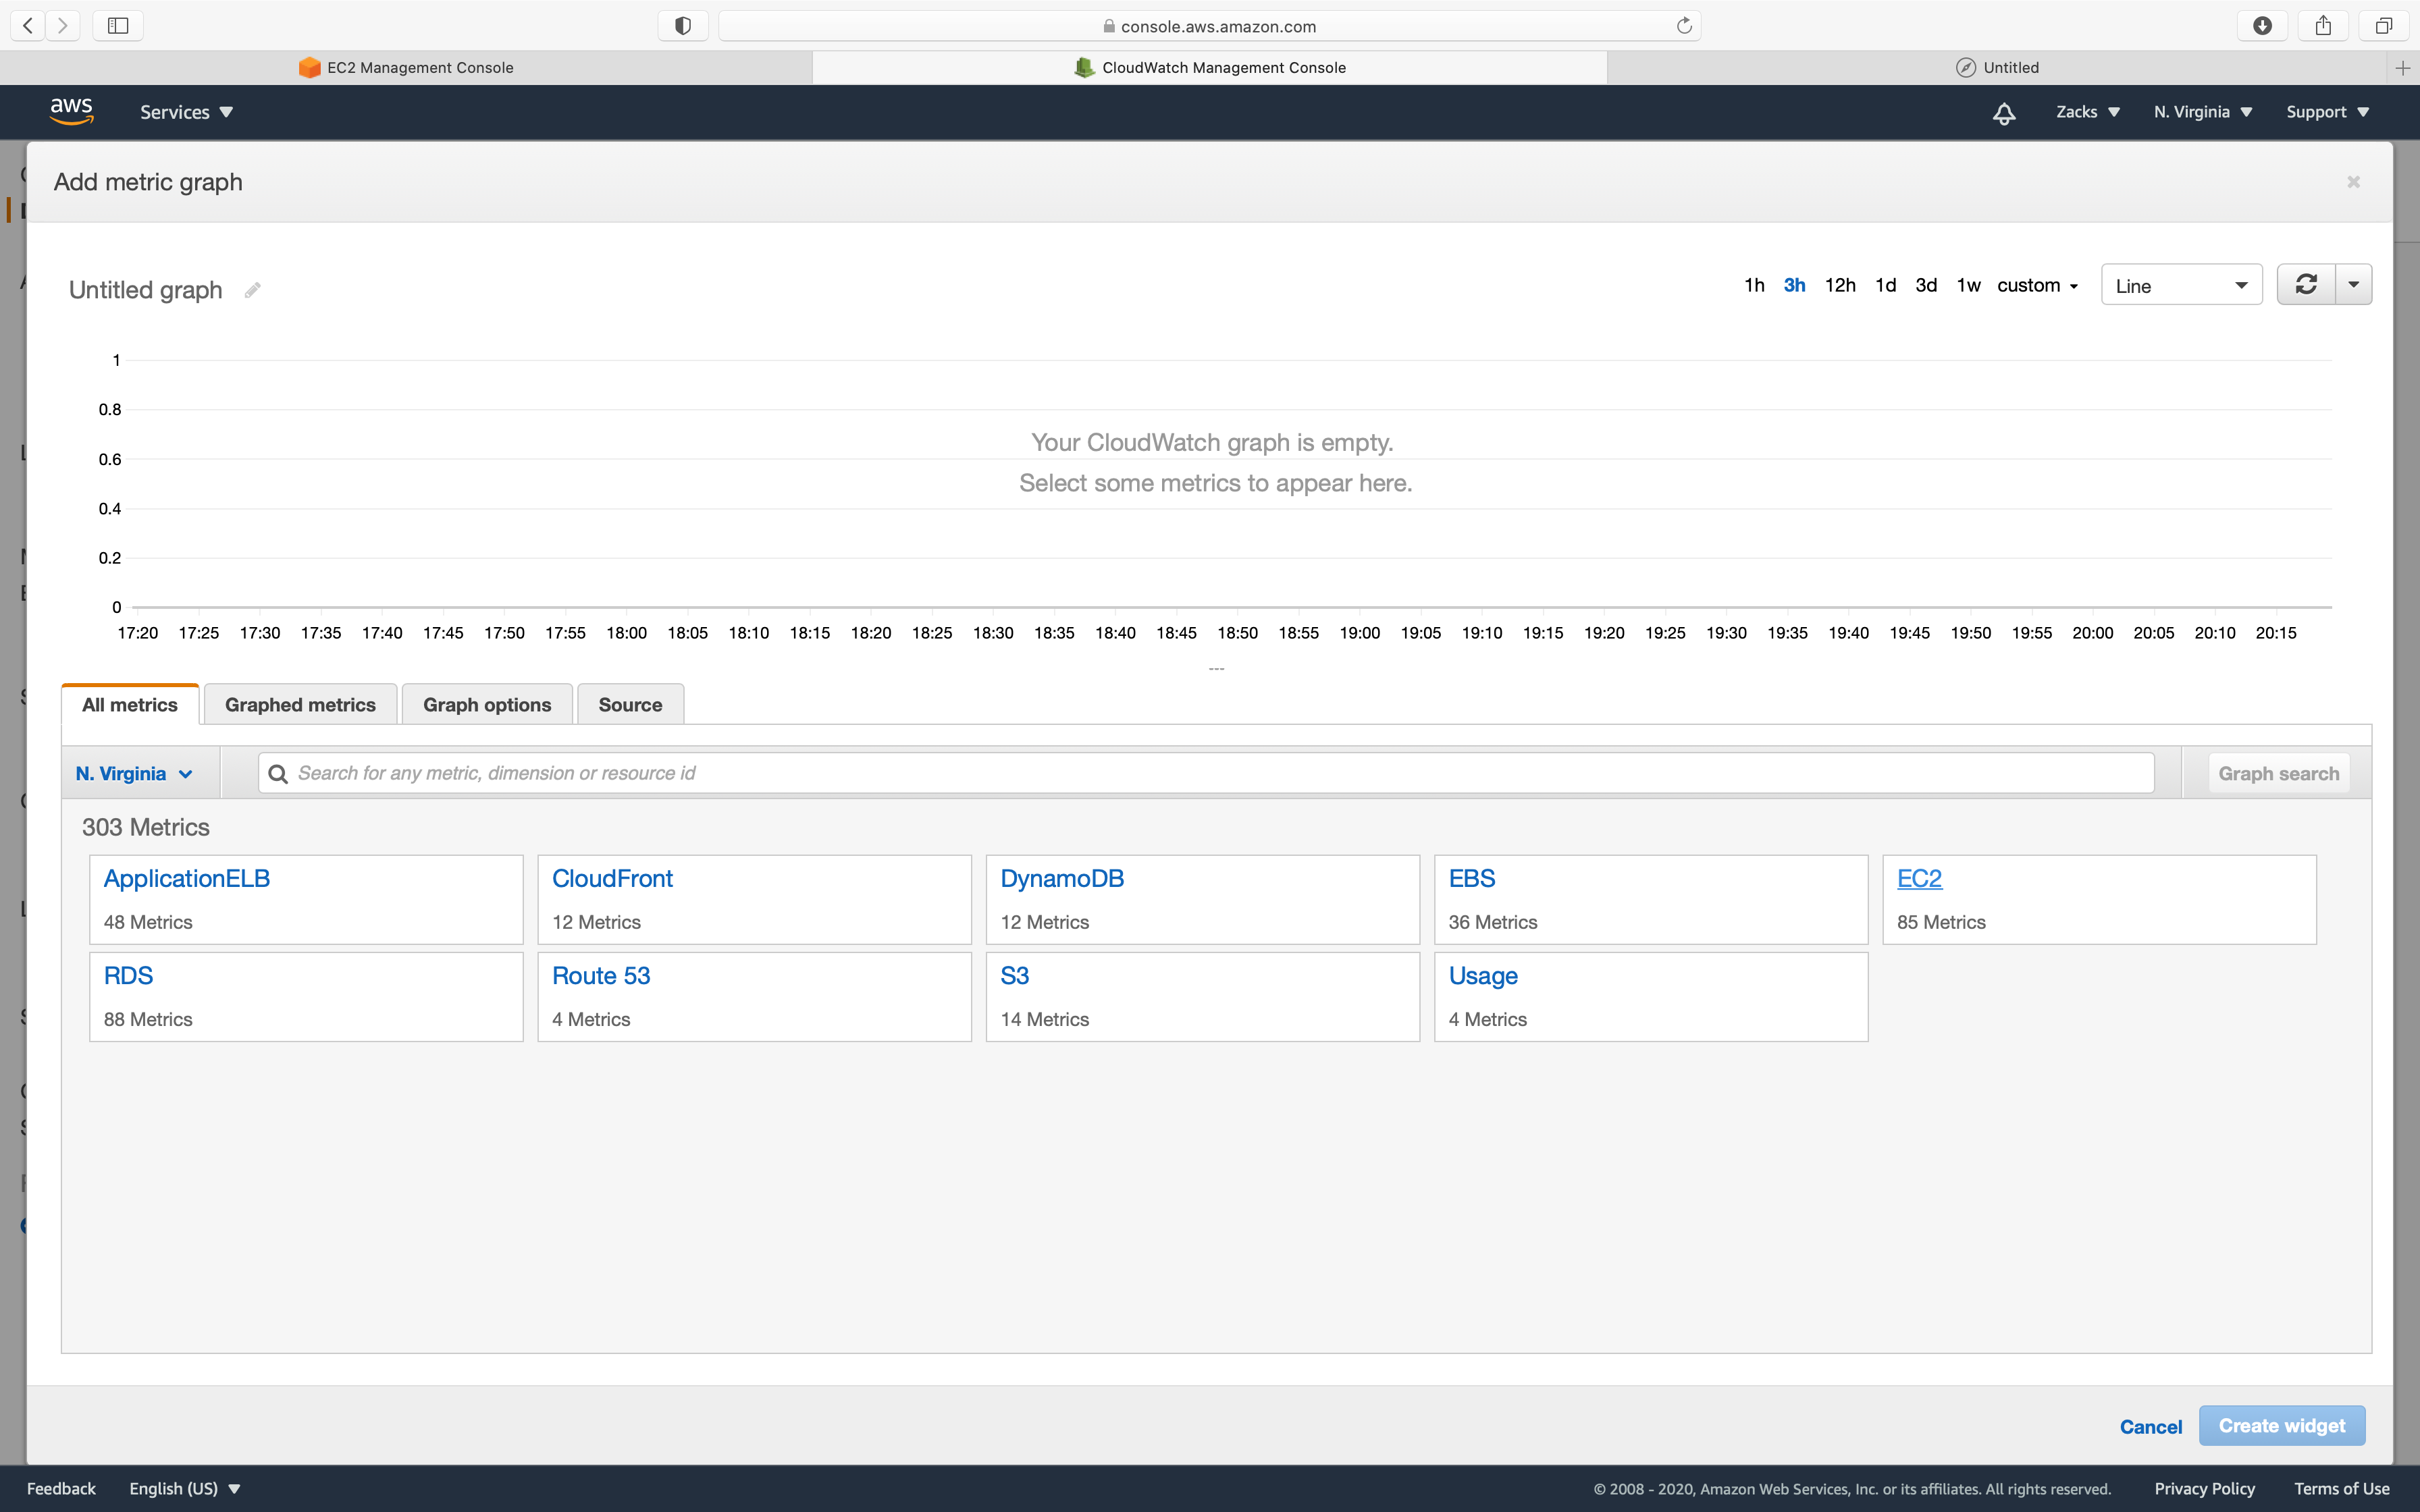
In the search bar, enter your EC2 Instance ID. Select CPUUtilization.
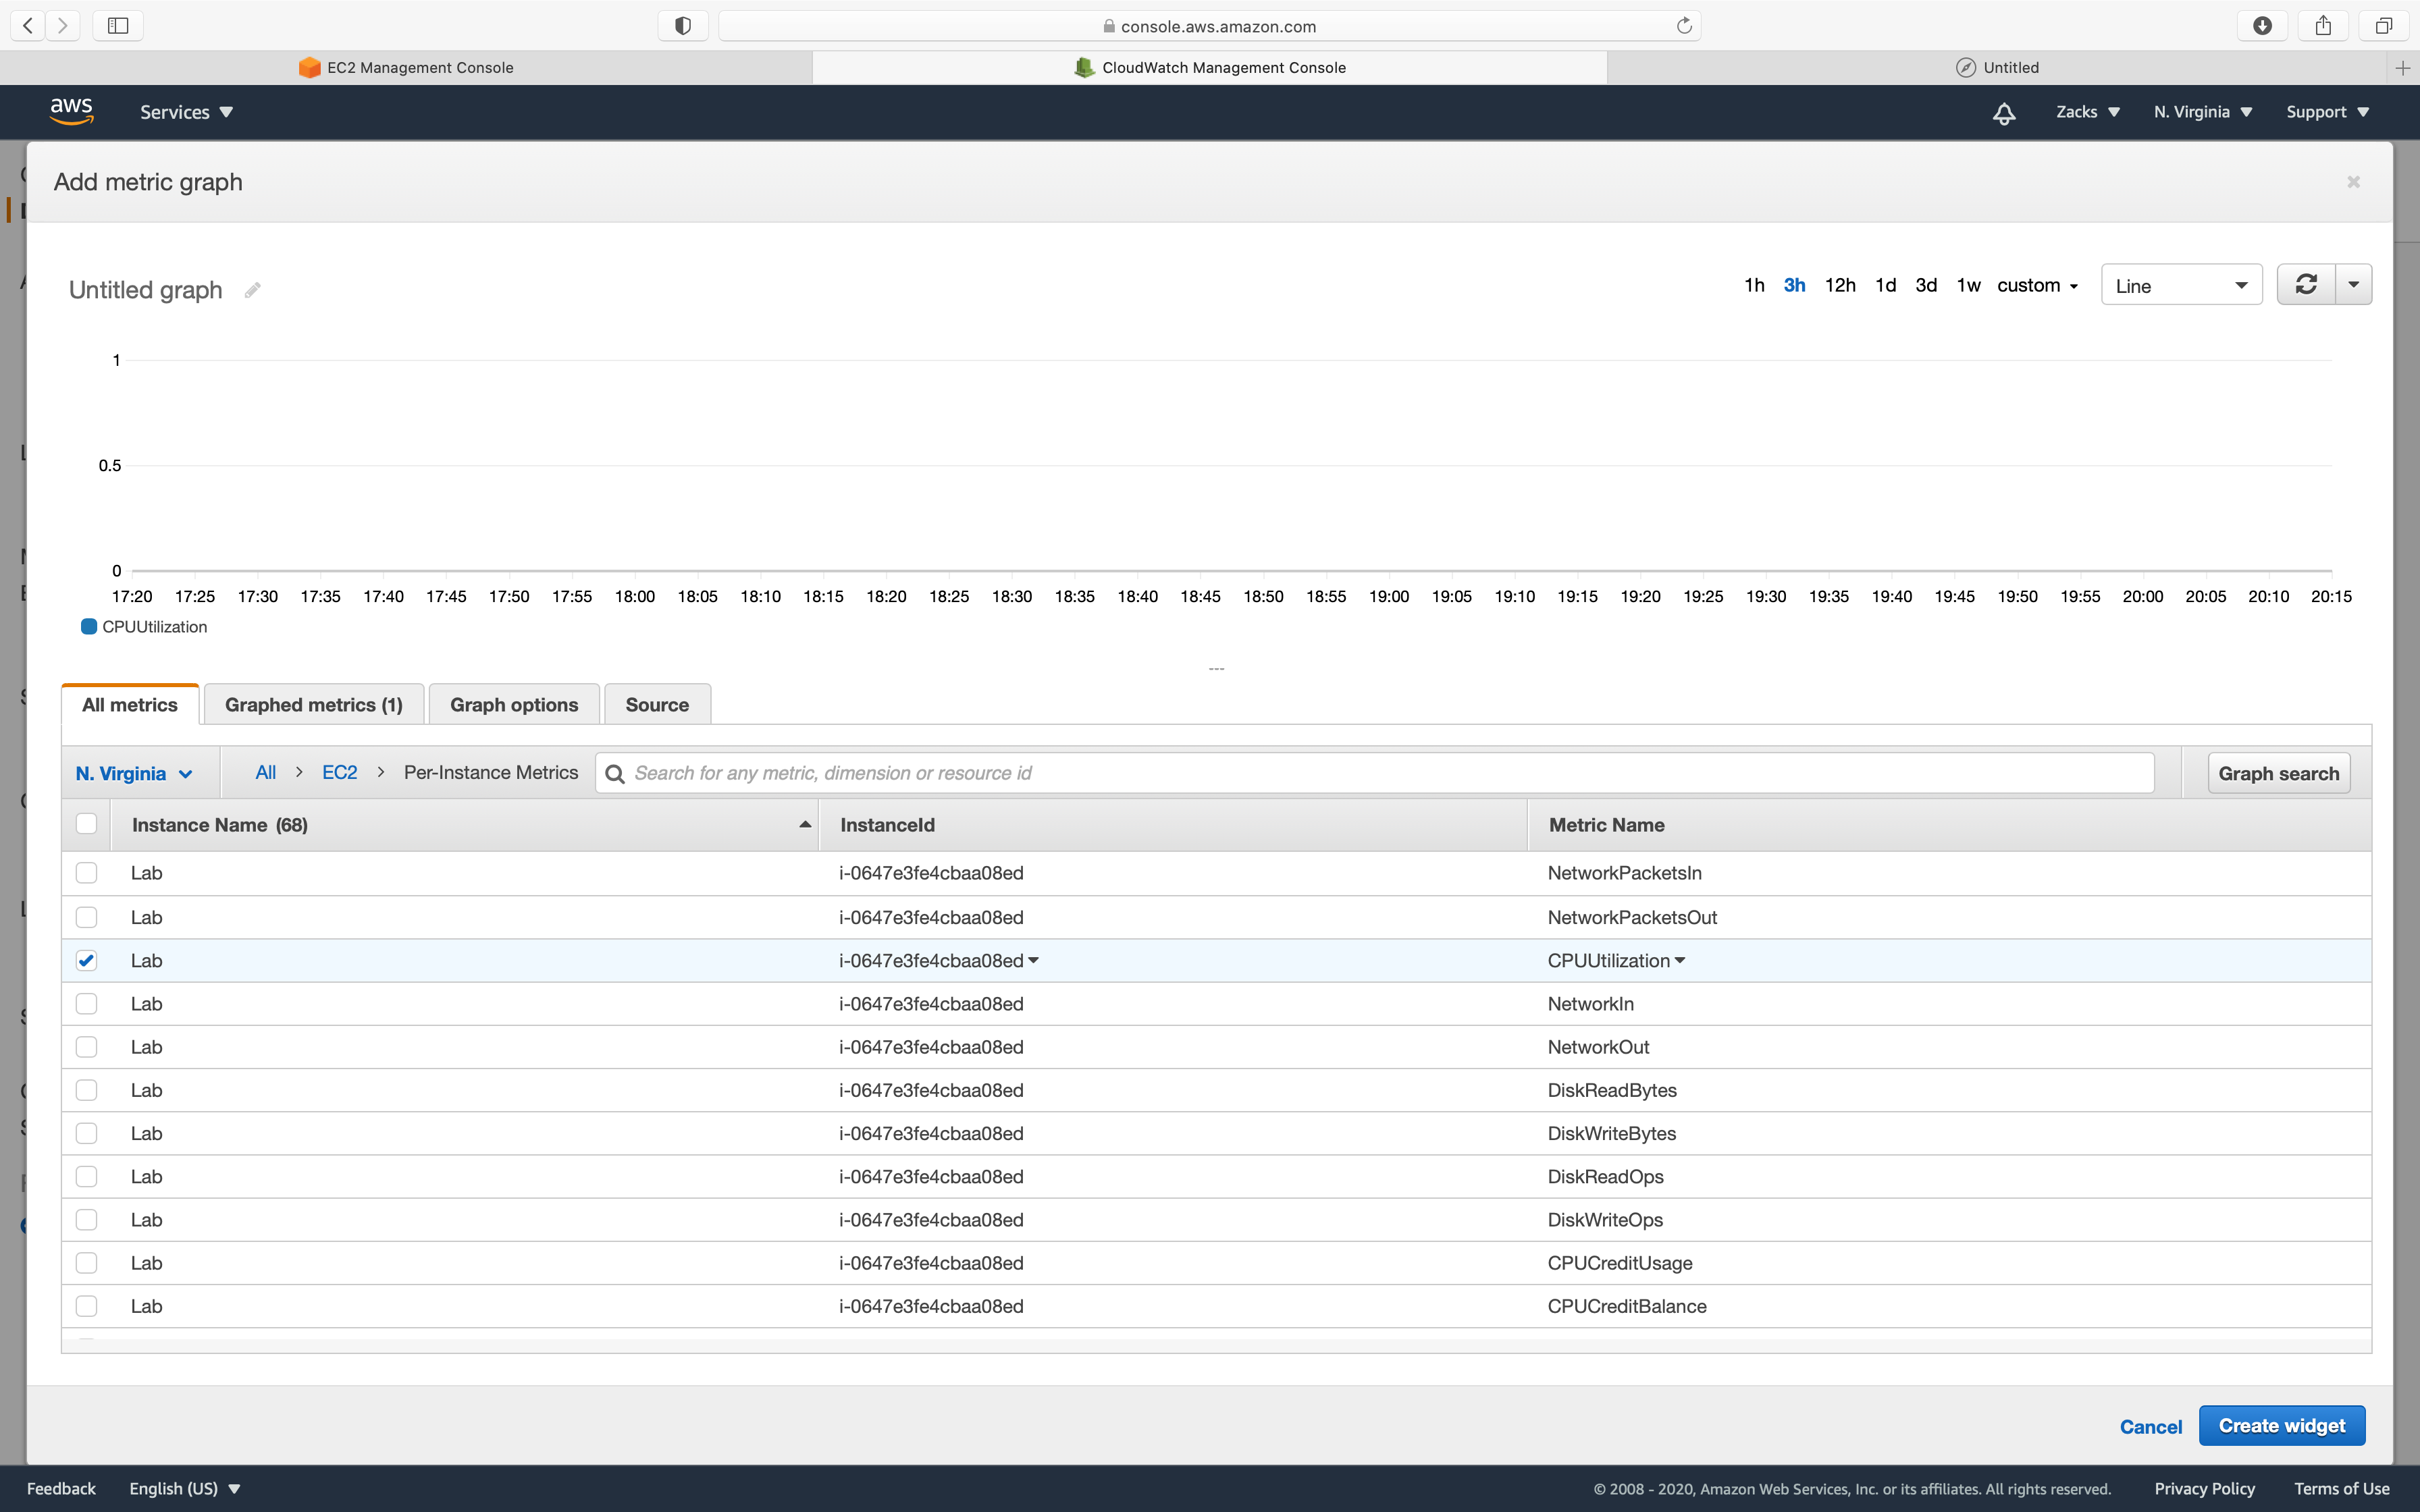
Click on .
Depending on how many times you triggered the stress command, you will see different spikes in the timeline.
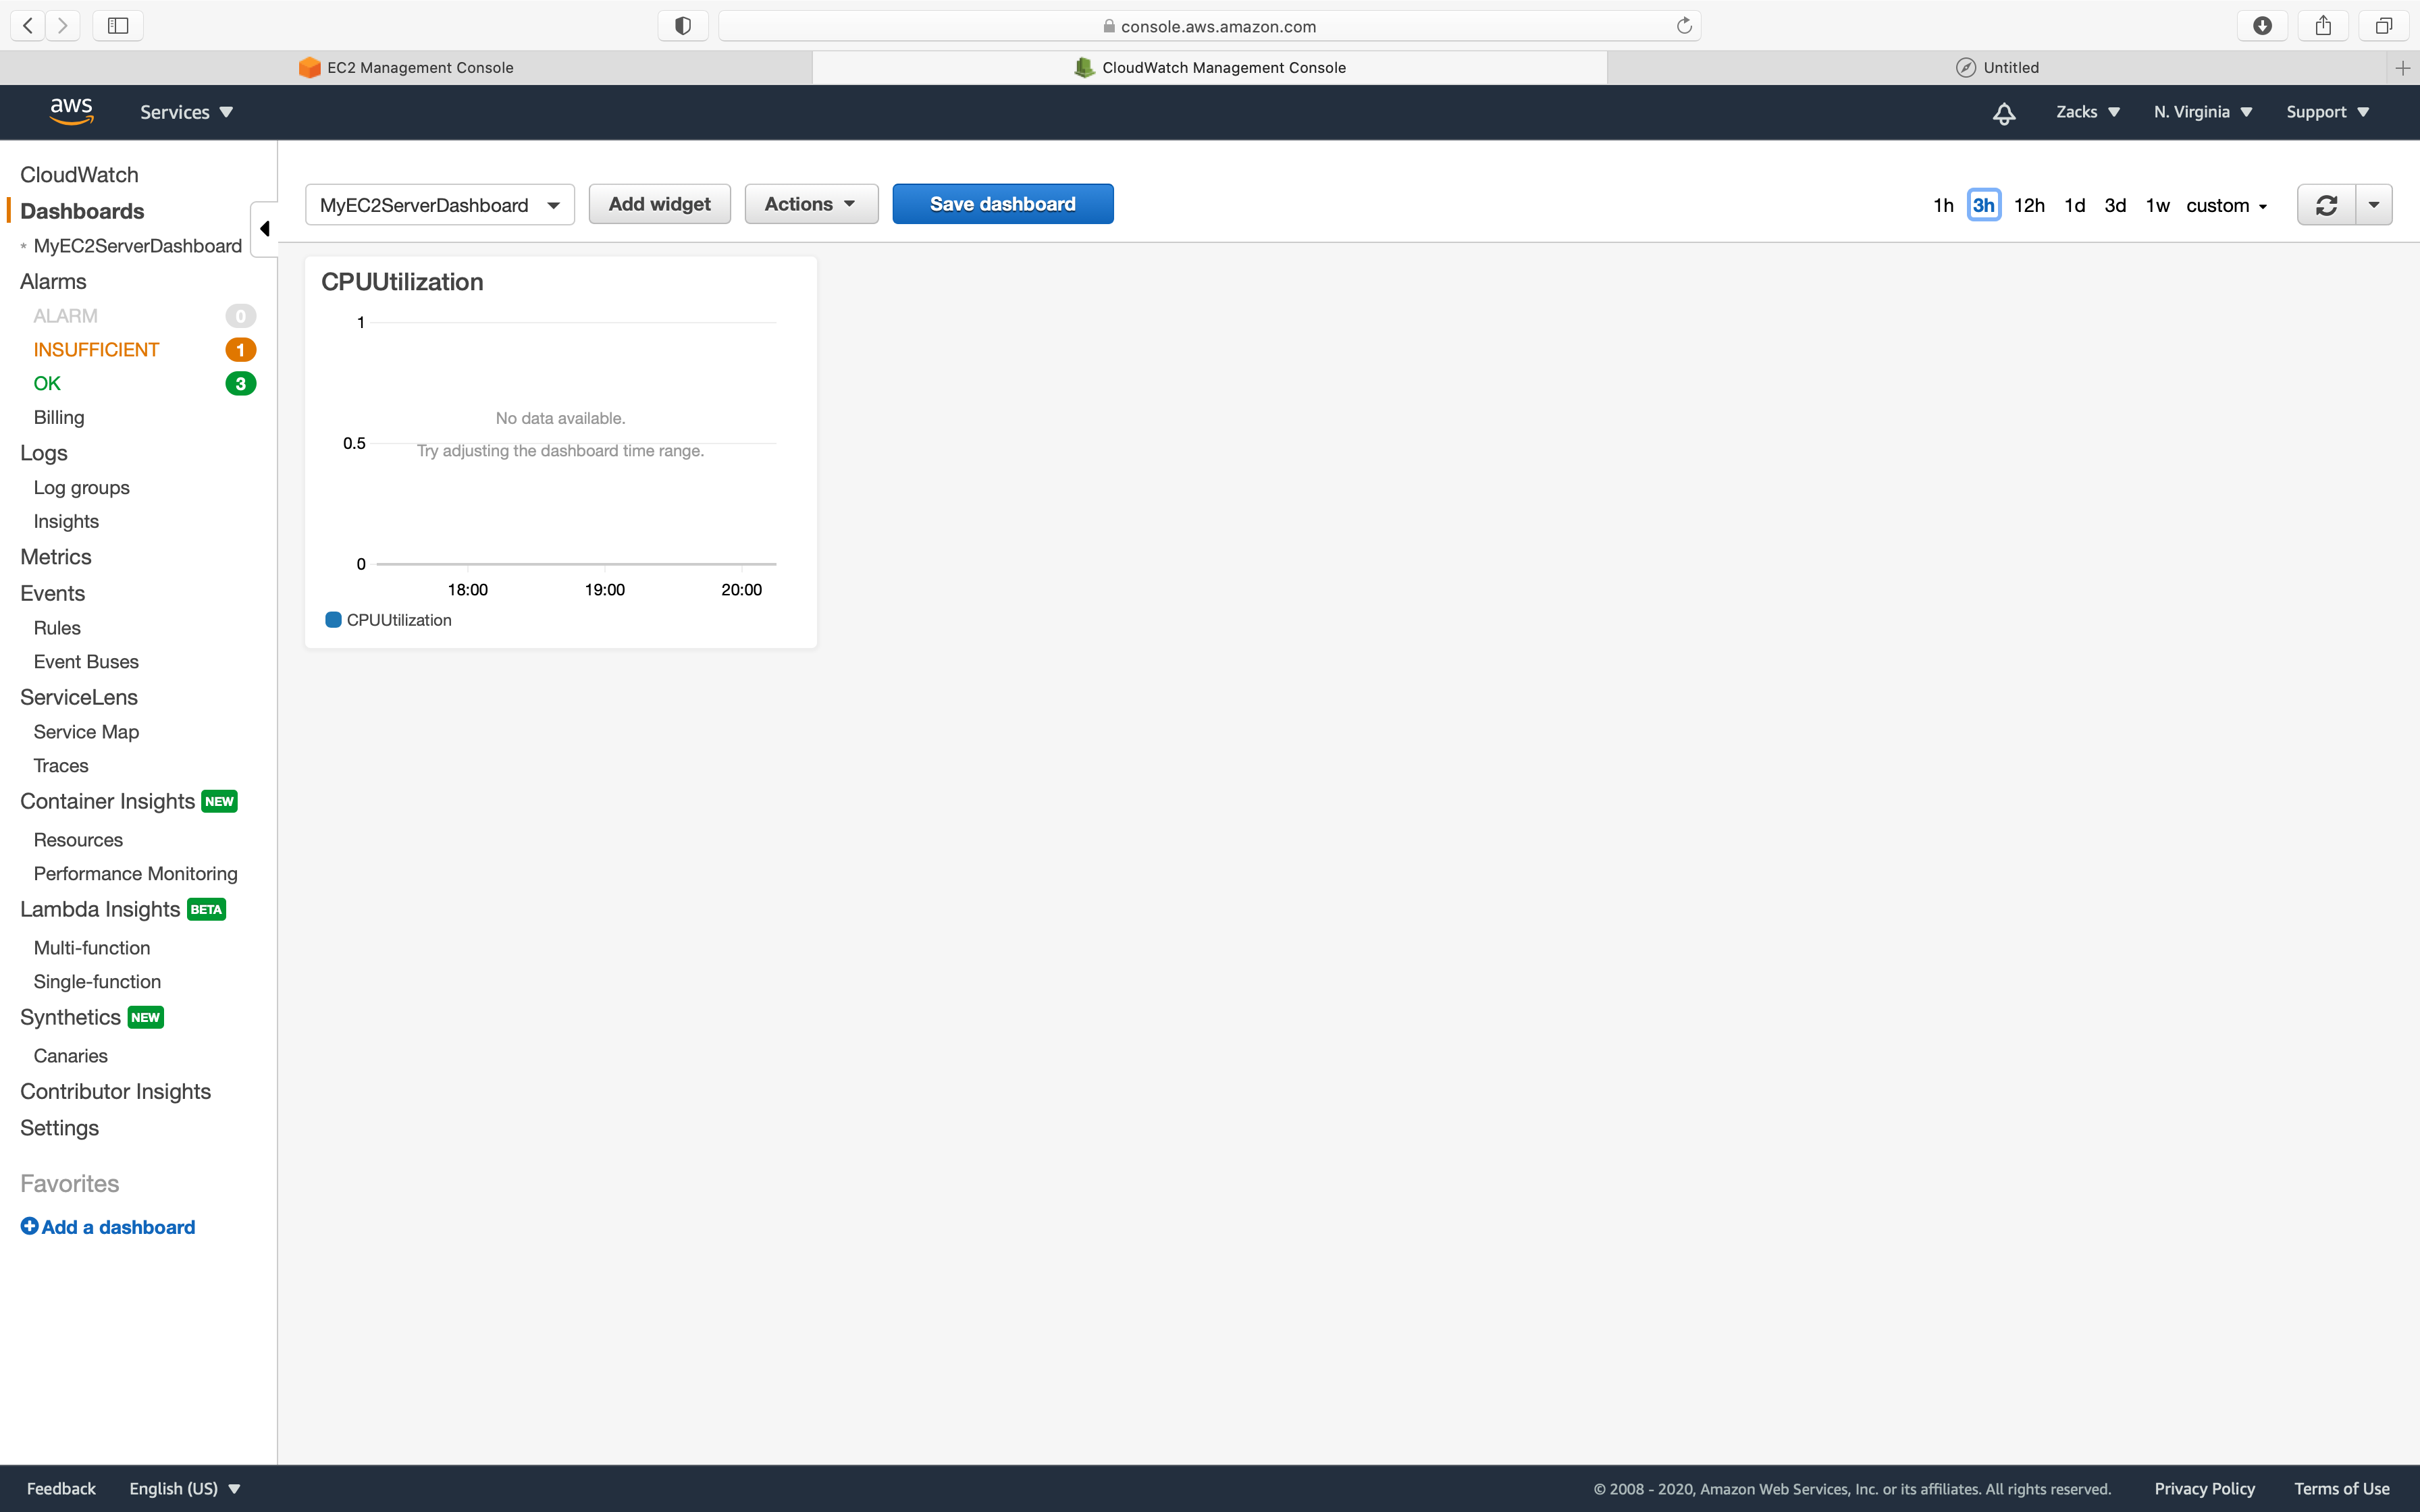
You can also add multiple Widgets to the same Dashboard by clicking on Add widget.
Creating Events in CloudWatch
Lab Details
- This lab walks you through creating rules in the Events section of Cloudwatch and adding a SNS target. It will be tested using an EC2 Instance.
Task Details
- Create EC2 Instance.
- Create SNS Topic. Subscribe to your email address.
- Create CloudWatch Event Rule.
- Stop and start the EC2 server to simulate an SNS Notification Email from the CloudWatch Event.
Architect Diagram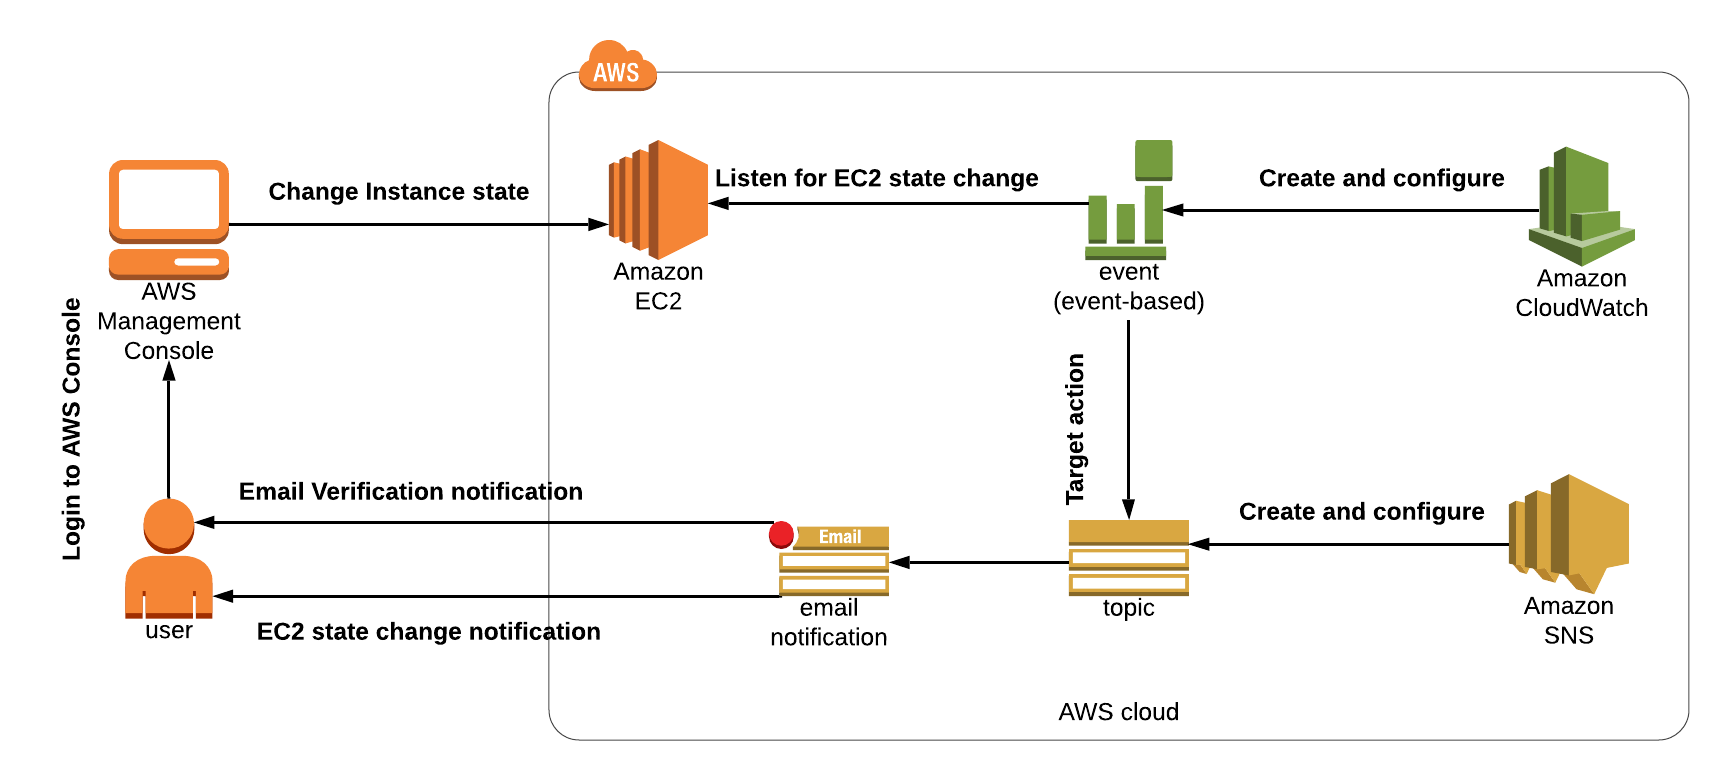
EC2 Configuration
Service -> EC2 -> Instances
Click on Launch Instance.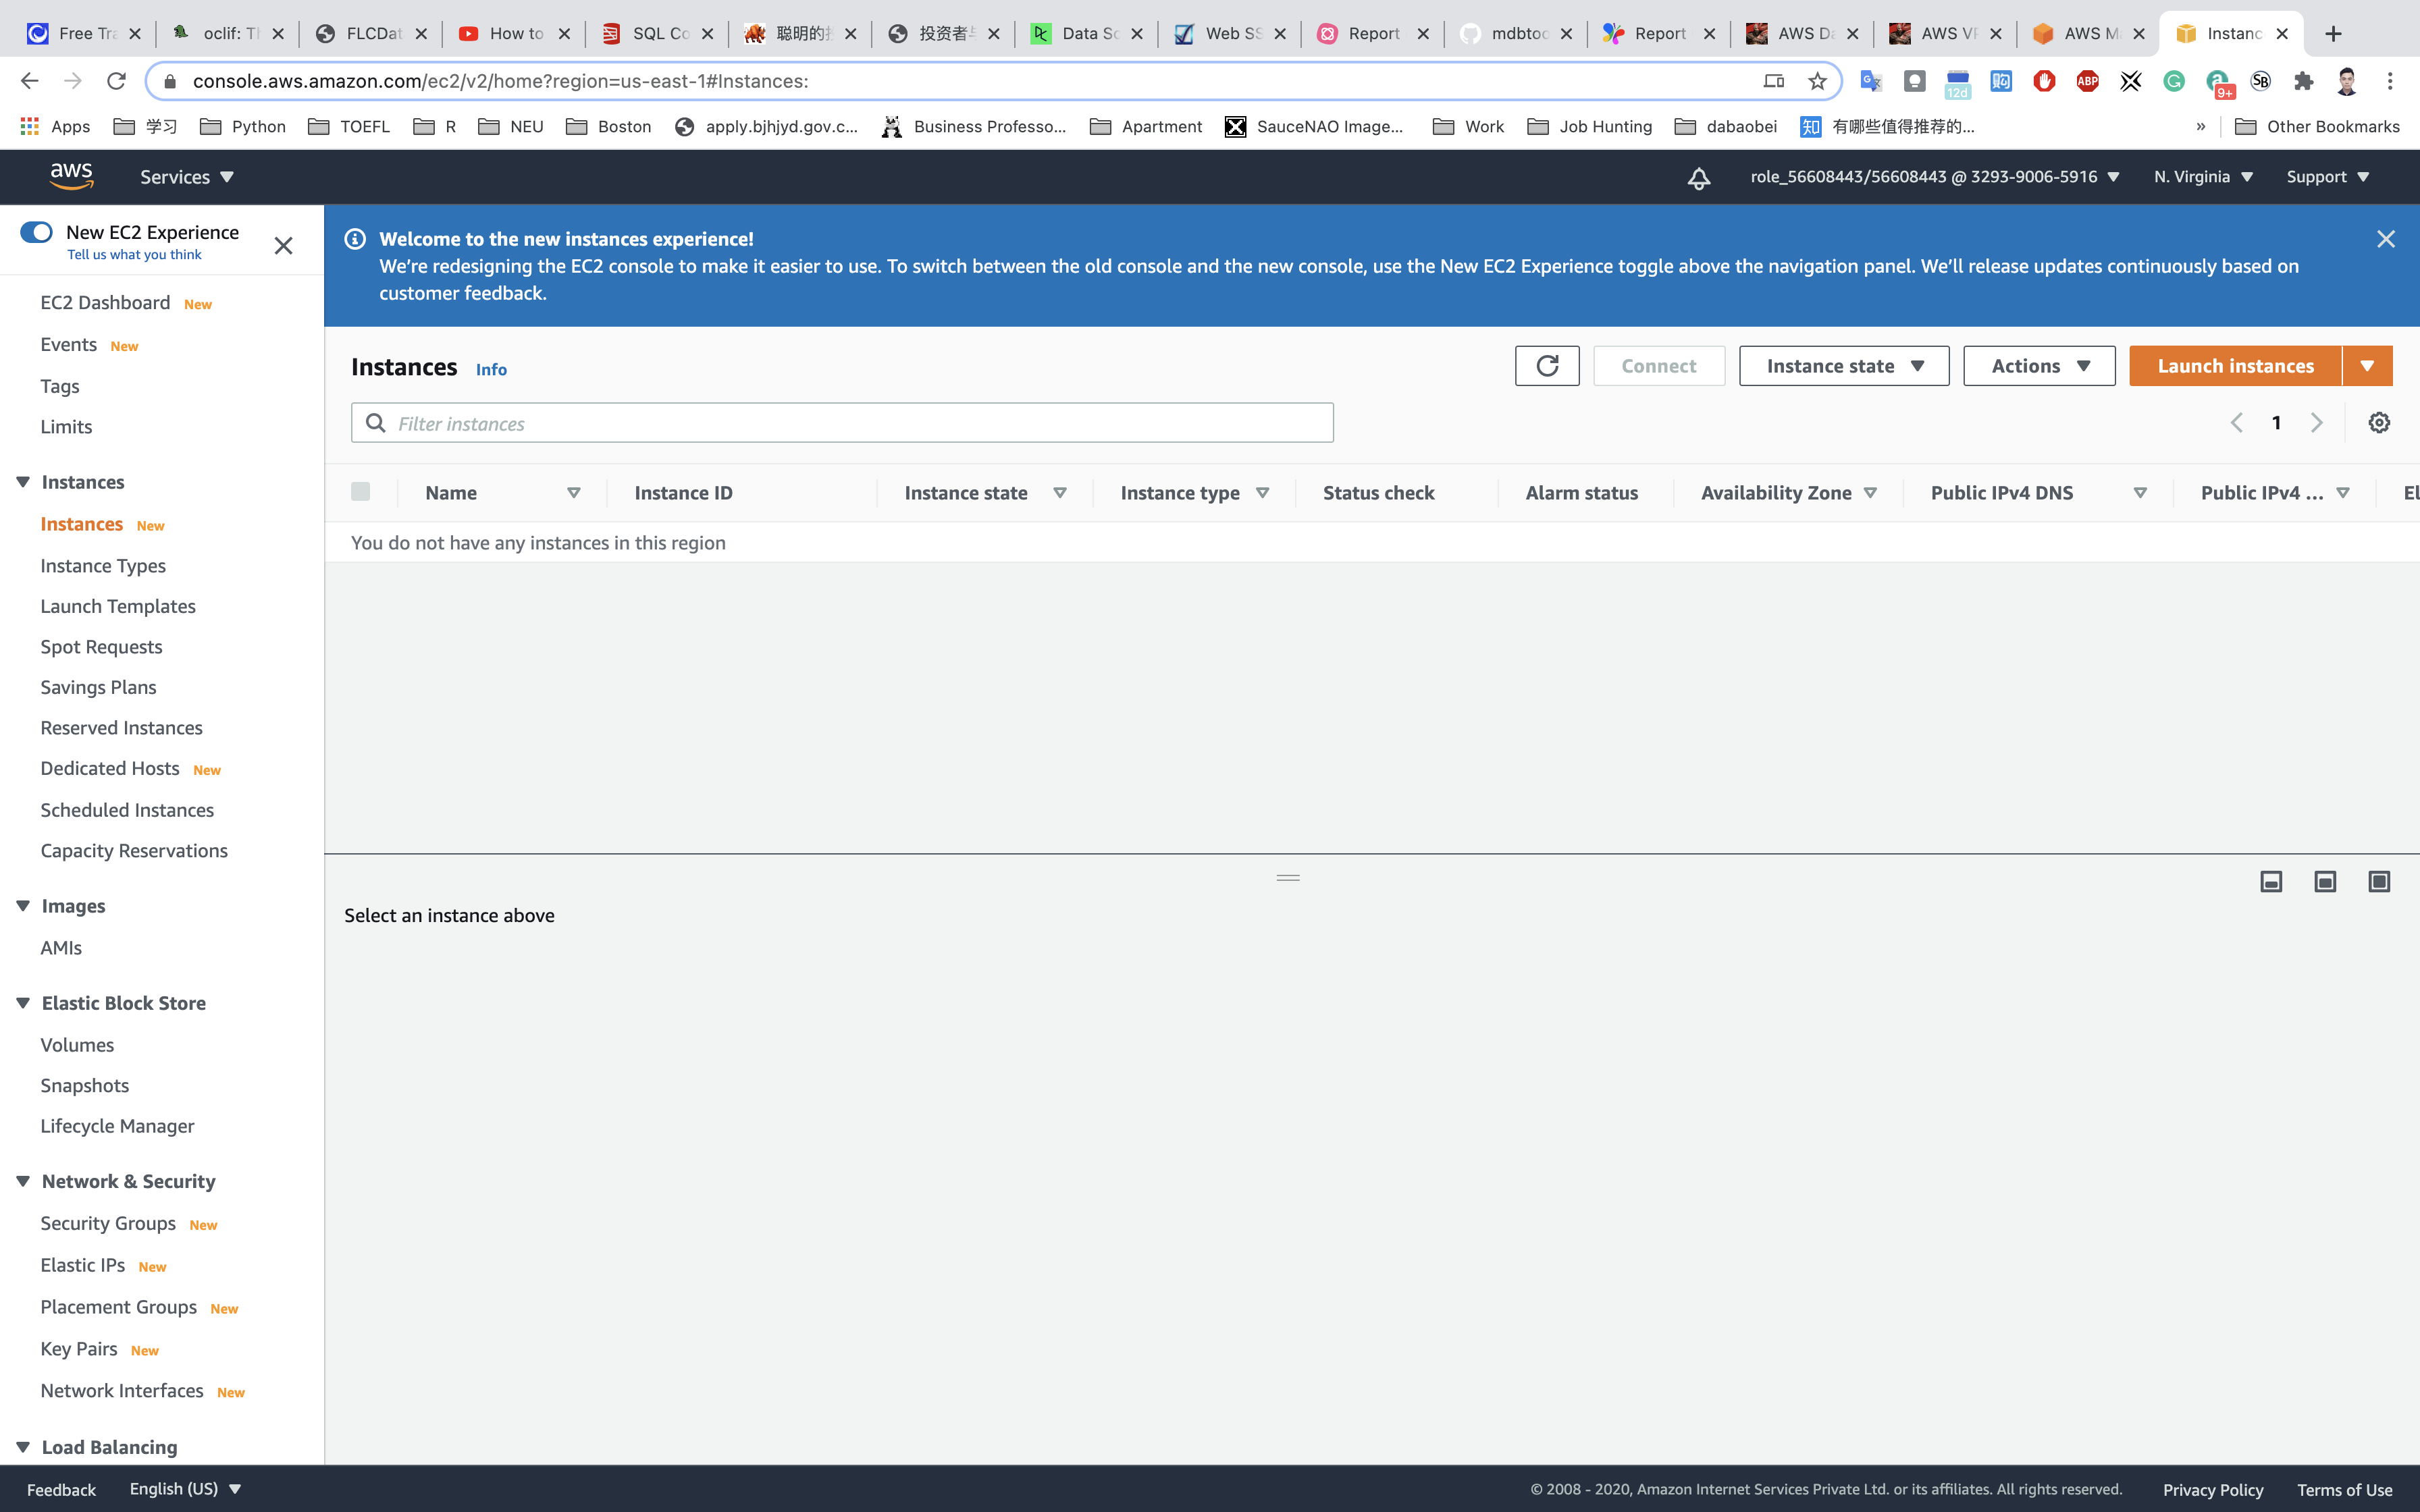
Choose an Amazon Machine Image (AMI): Search for Amazon Linux 2 AMI in the search box and click on the select button.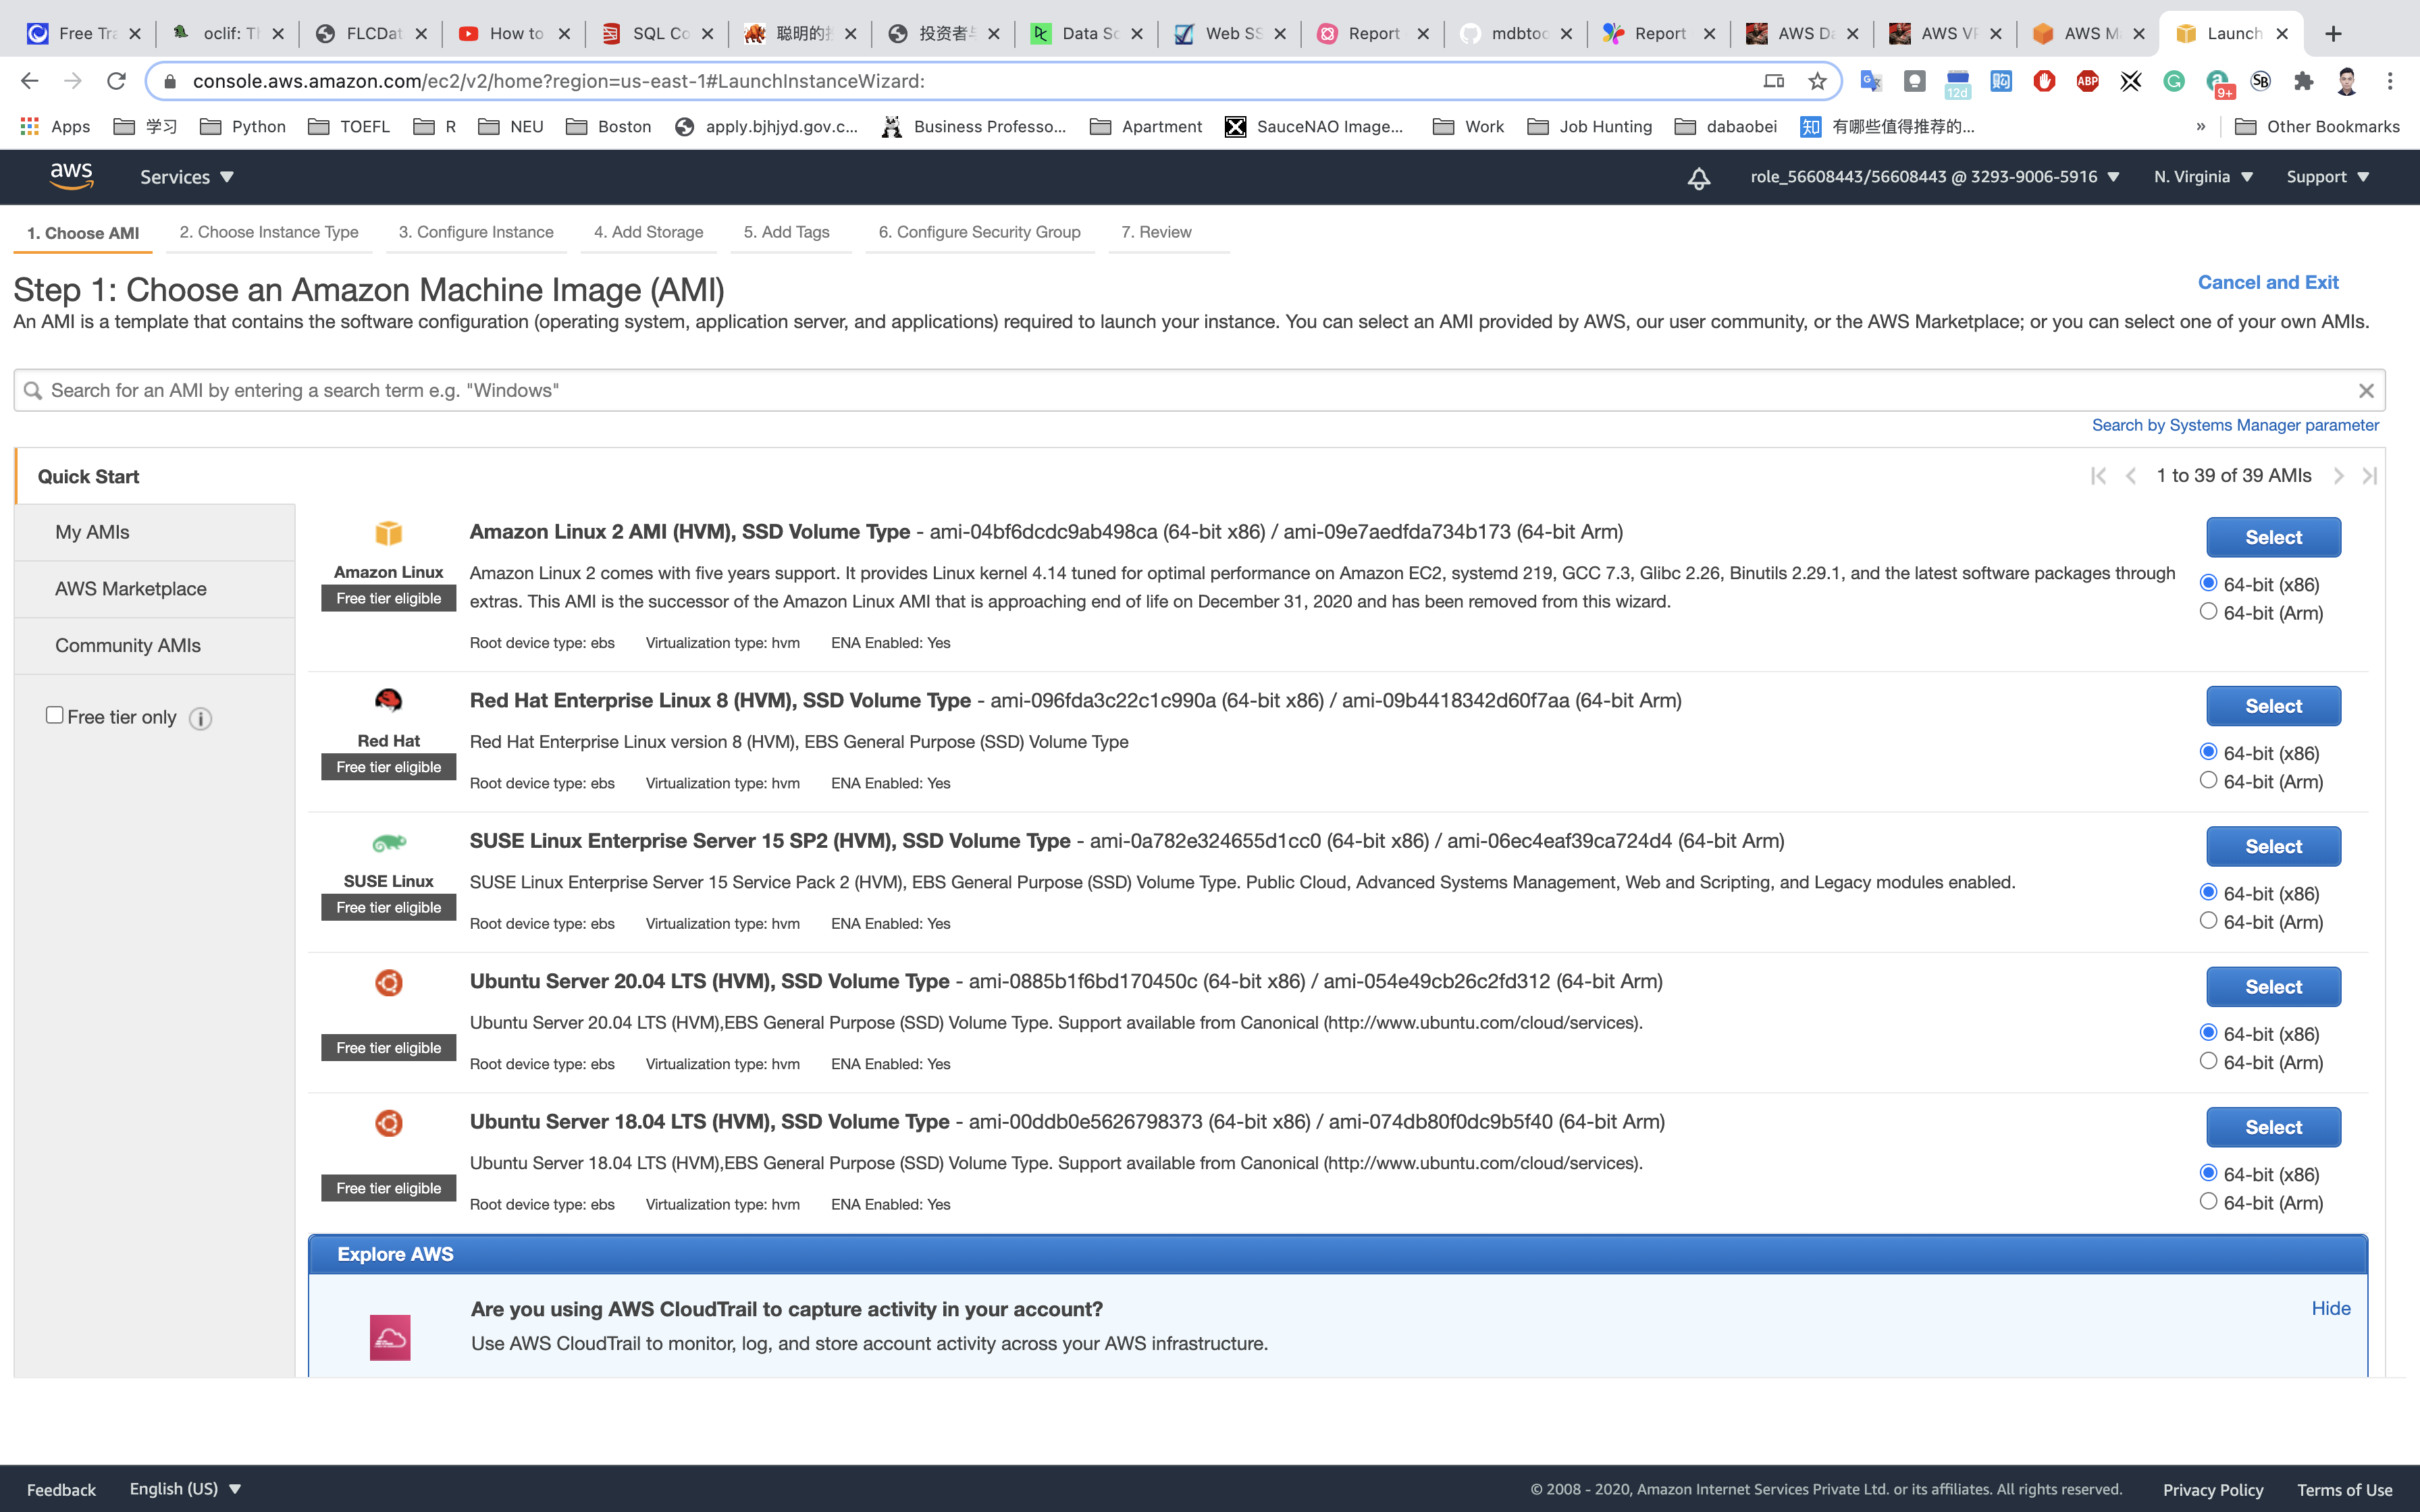
Choose an Instance Type: select t2.micro and click on the Next: Configure Instance Details
Configure Instance Details:
- Leave all settings as default.
Click on Nex: Add Storage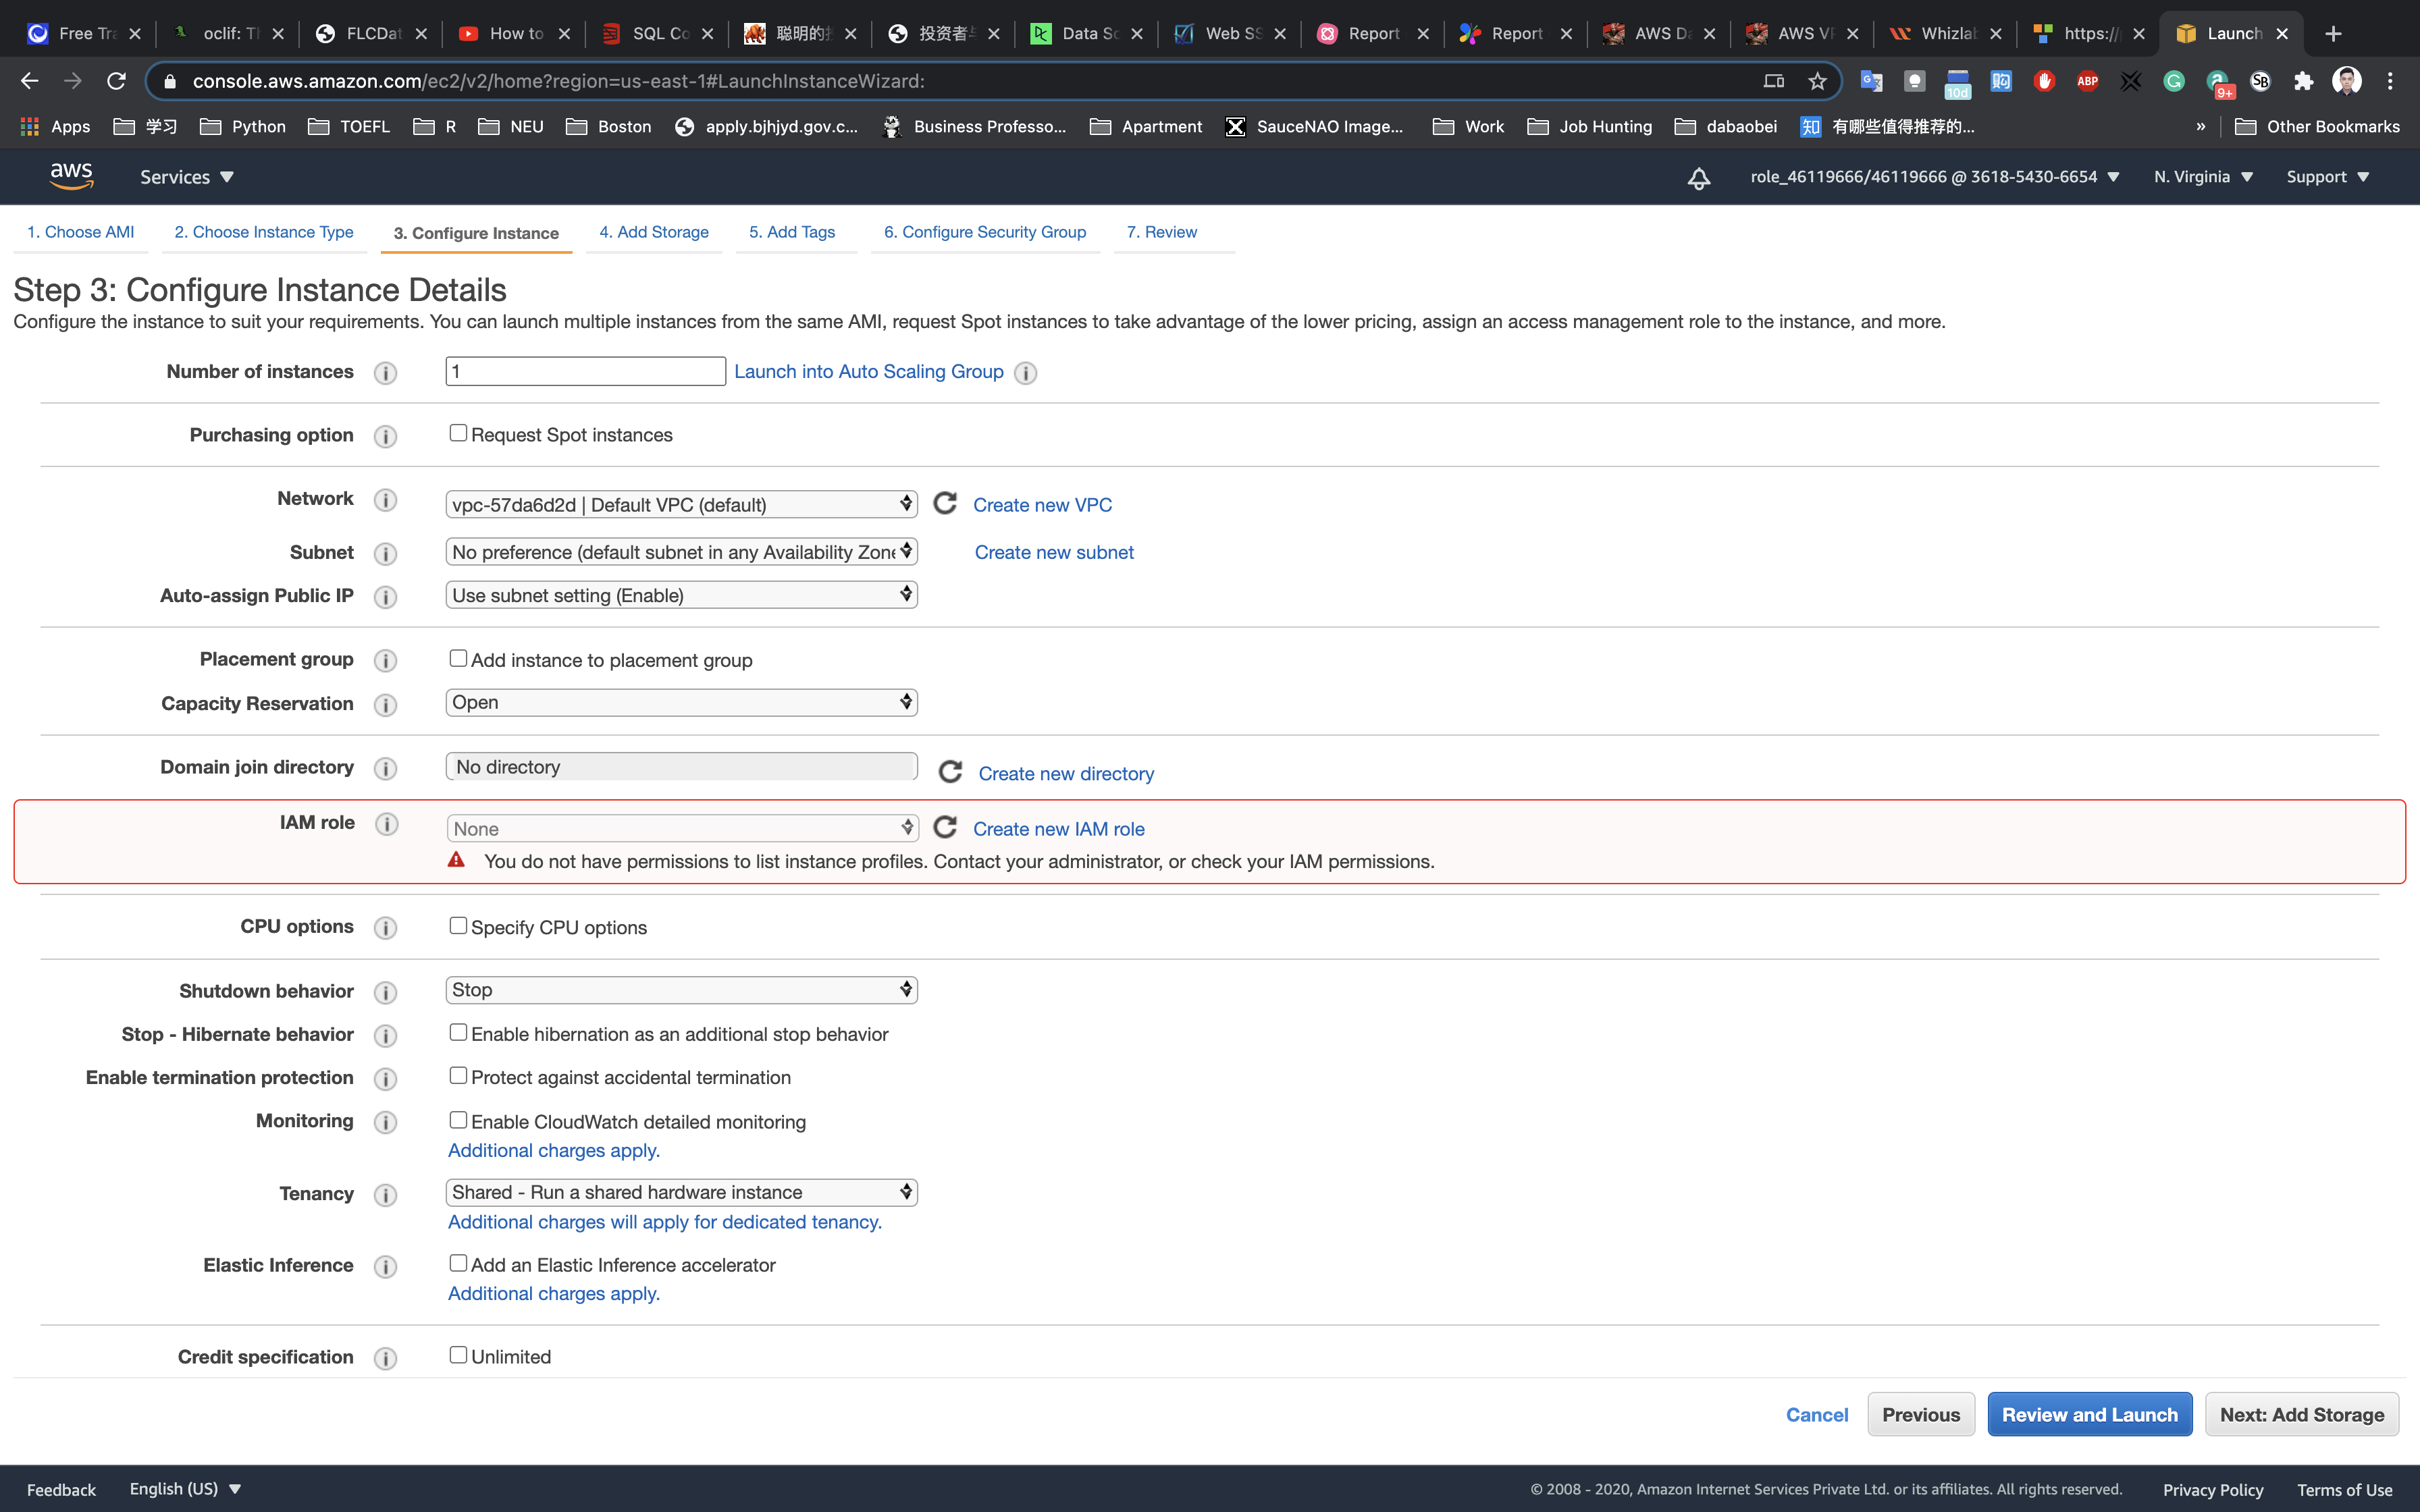
Add Storage: No need to change anything in this step. Click on Next: Add tags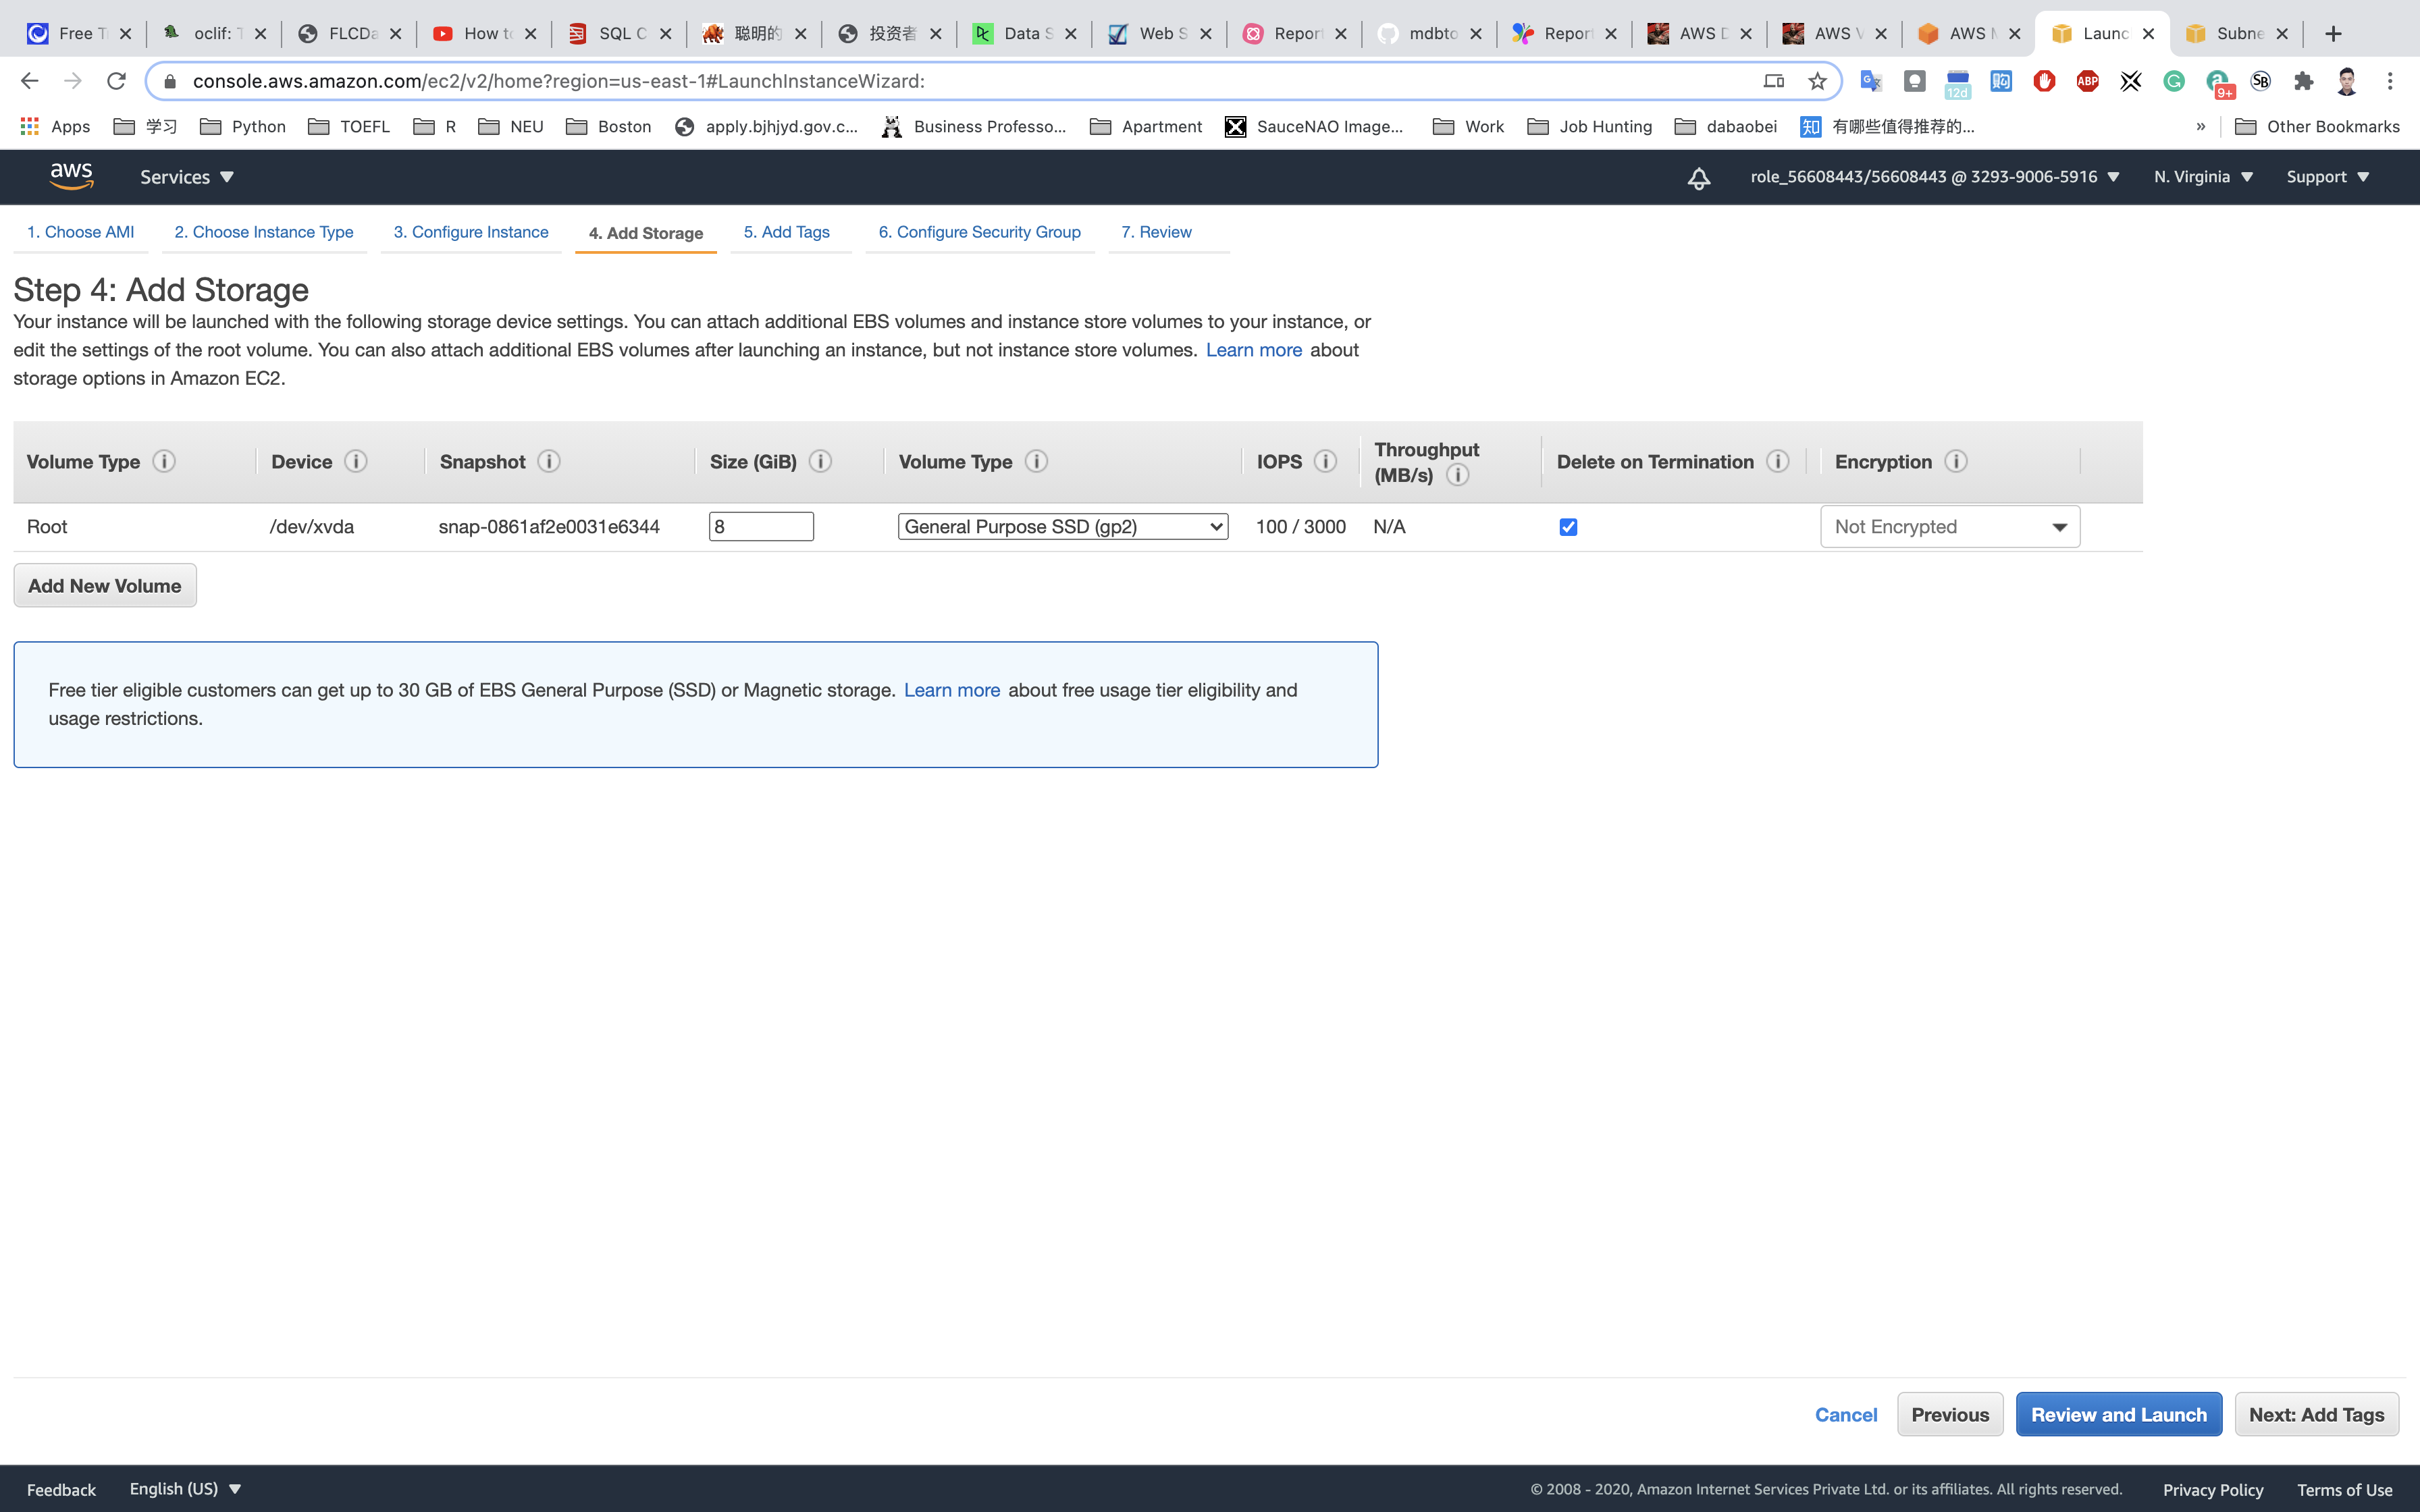
Add Tags: Click on Add tag
- Key:
Name - Value:
MyEC2Server
Click on Next: Configure Security Group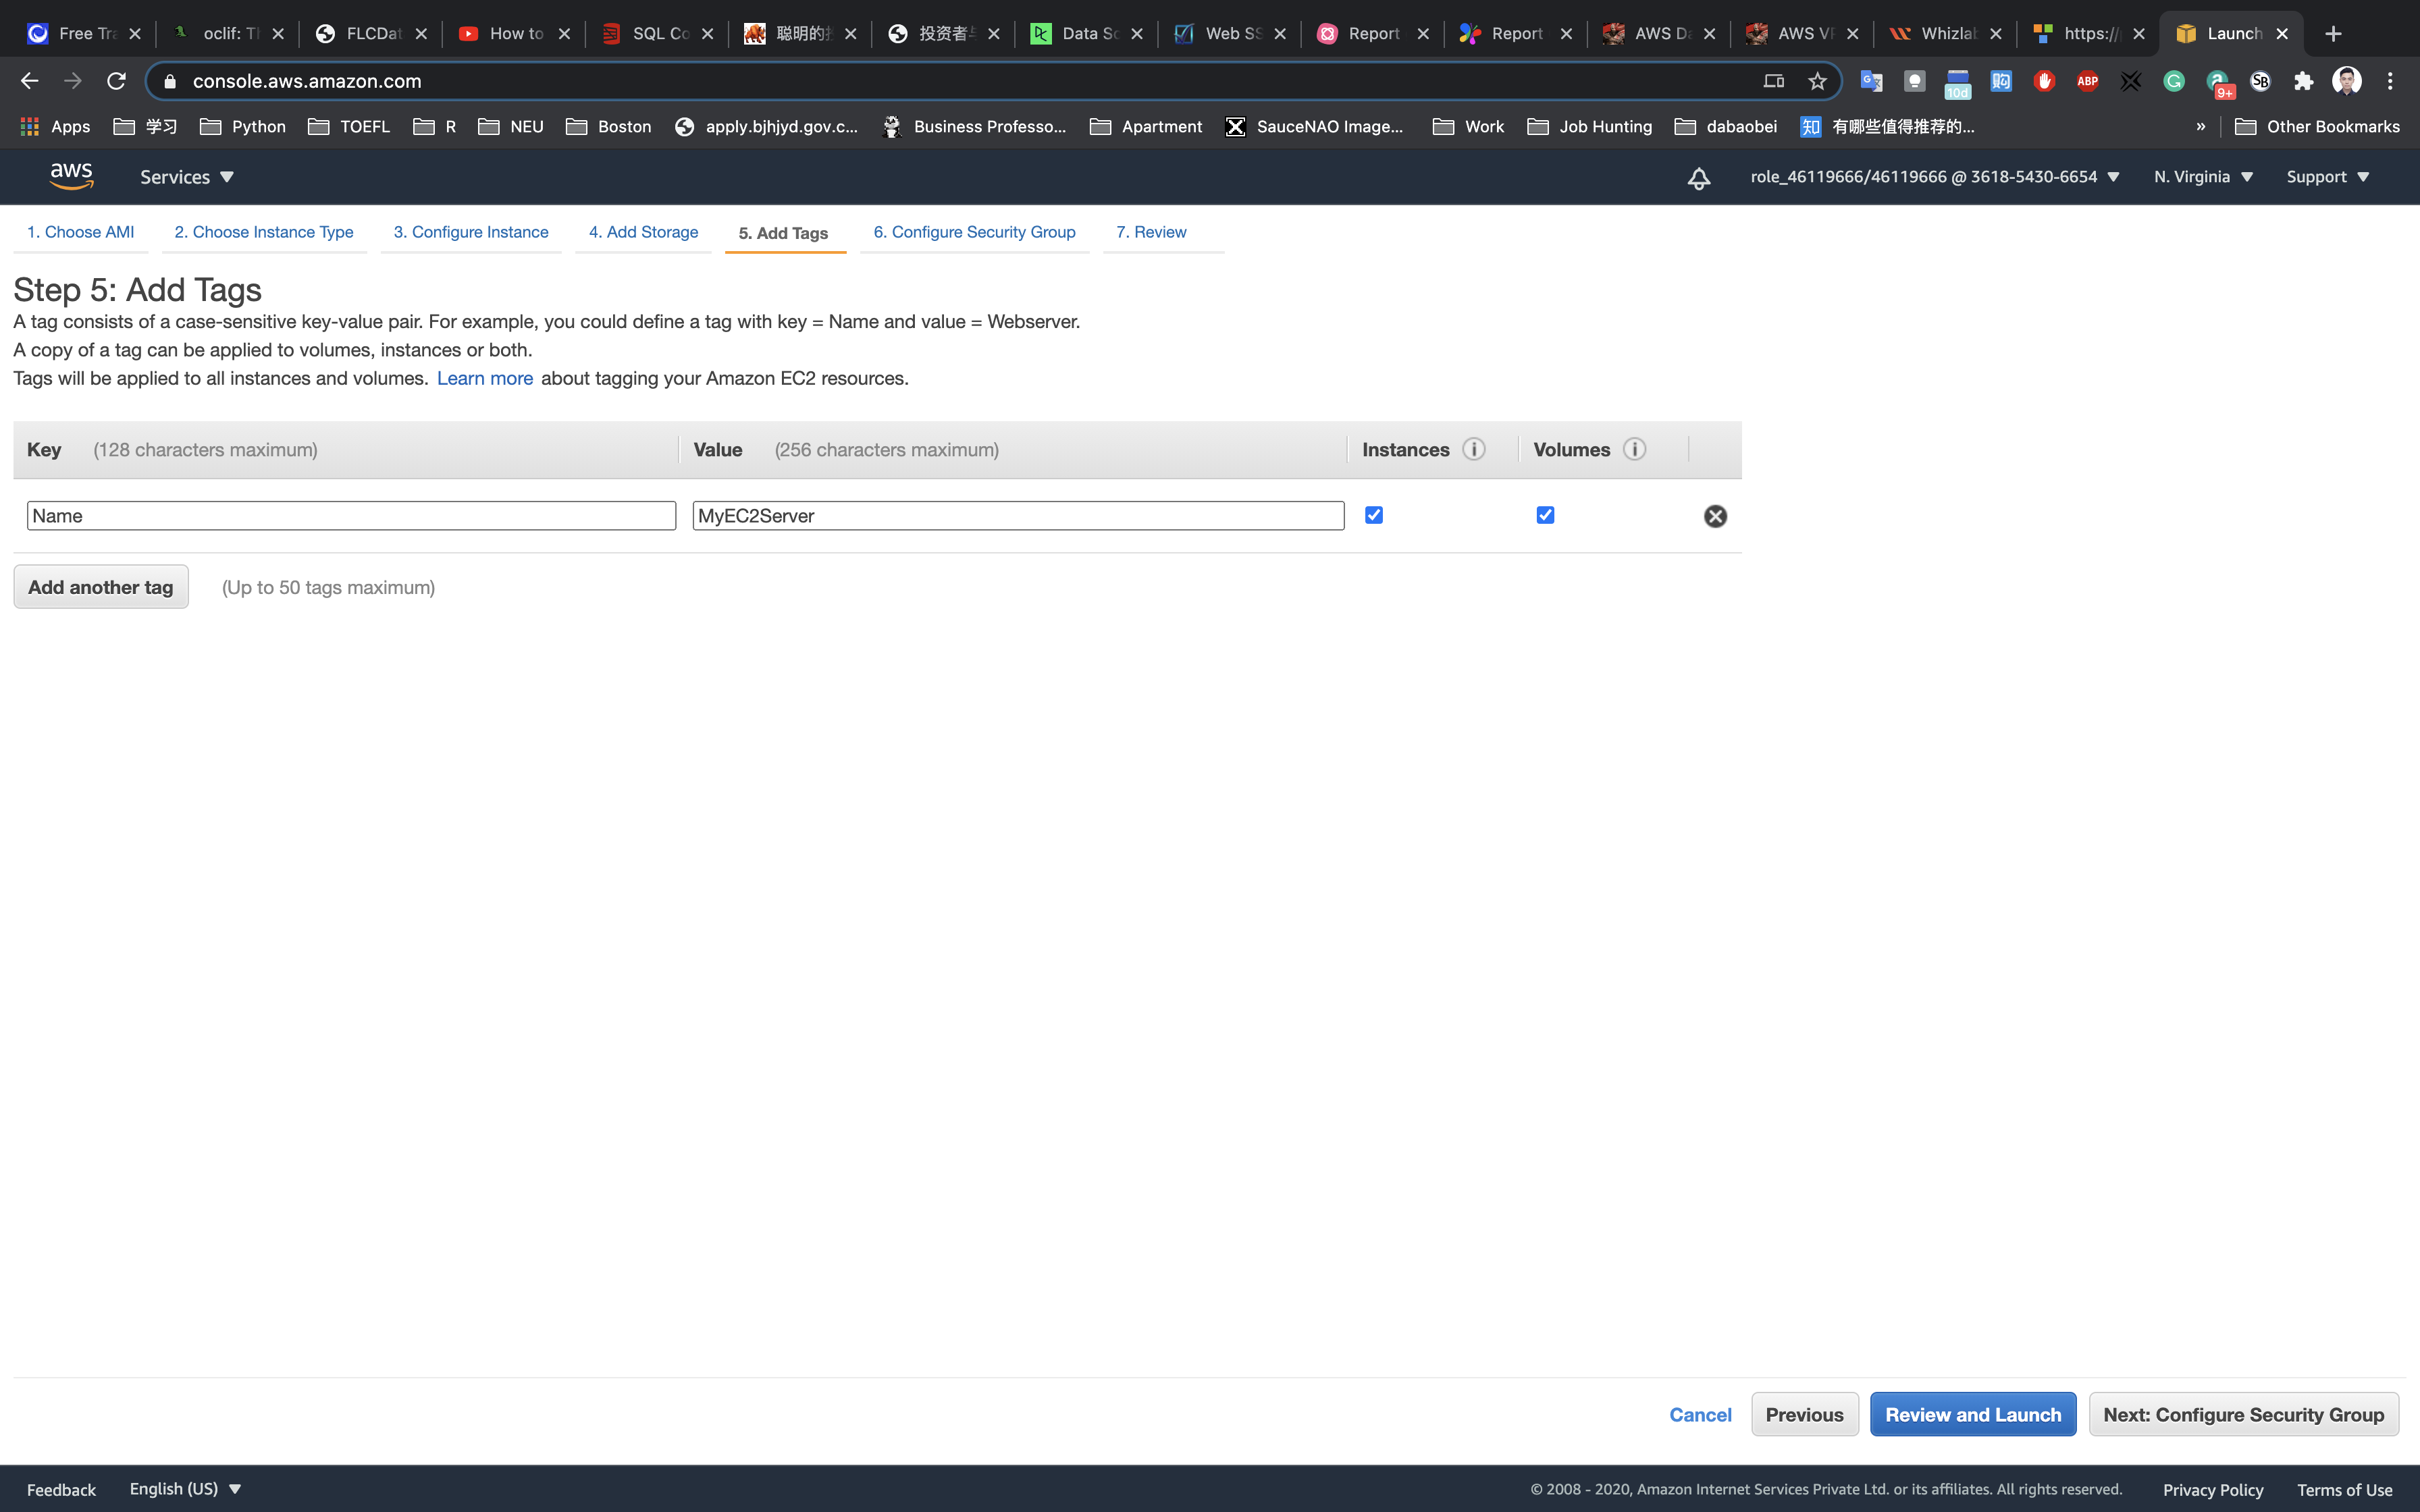
Configure Security Group:
- SSH is already available:
- Security Group Name:
PublicSG - Description:
Security Group for EC2 running on public subnet. - Choose Type:
SSH - Source:
Anywhere
- Security Group Name:
Click on Review and Launch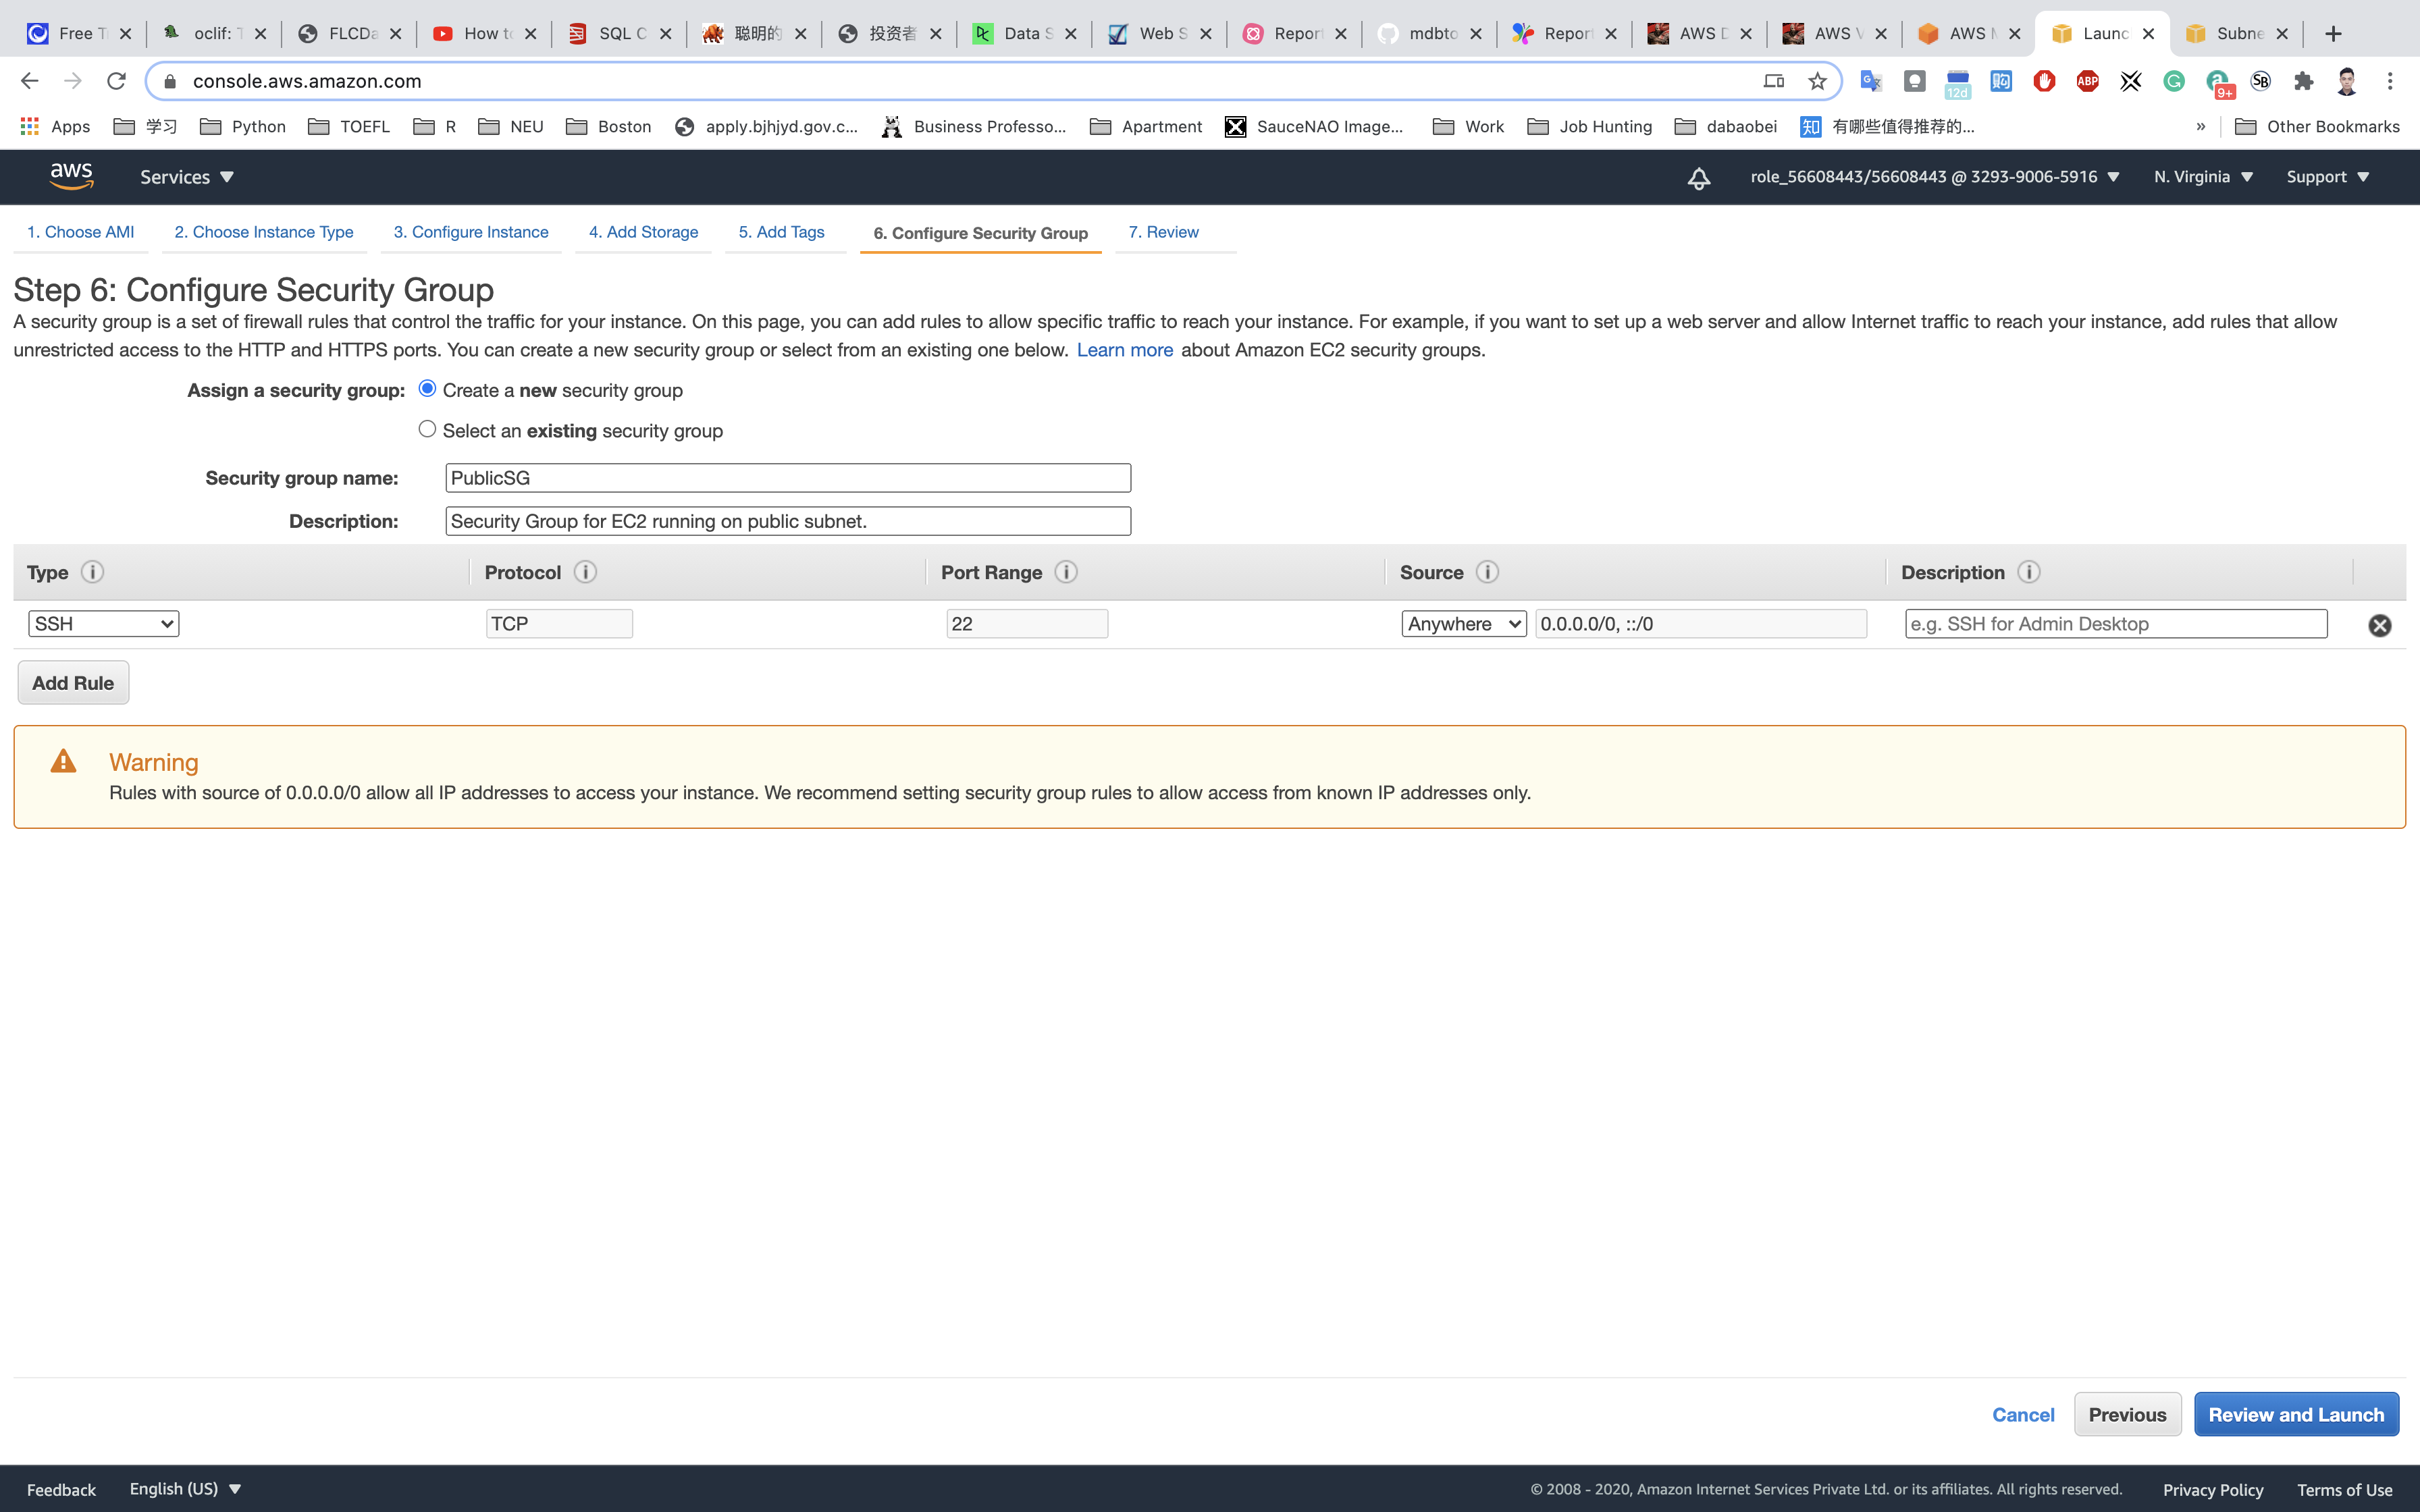
Review and Launch : Review all settings and click on Launch.
- Select
Create a new key pair - Key pair Name:
aws-ec2
Click on Download Key Pair.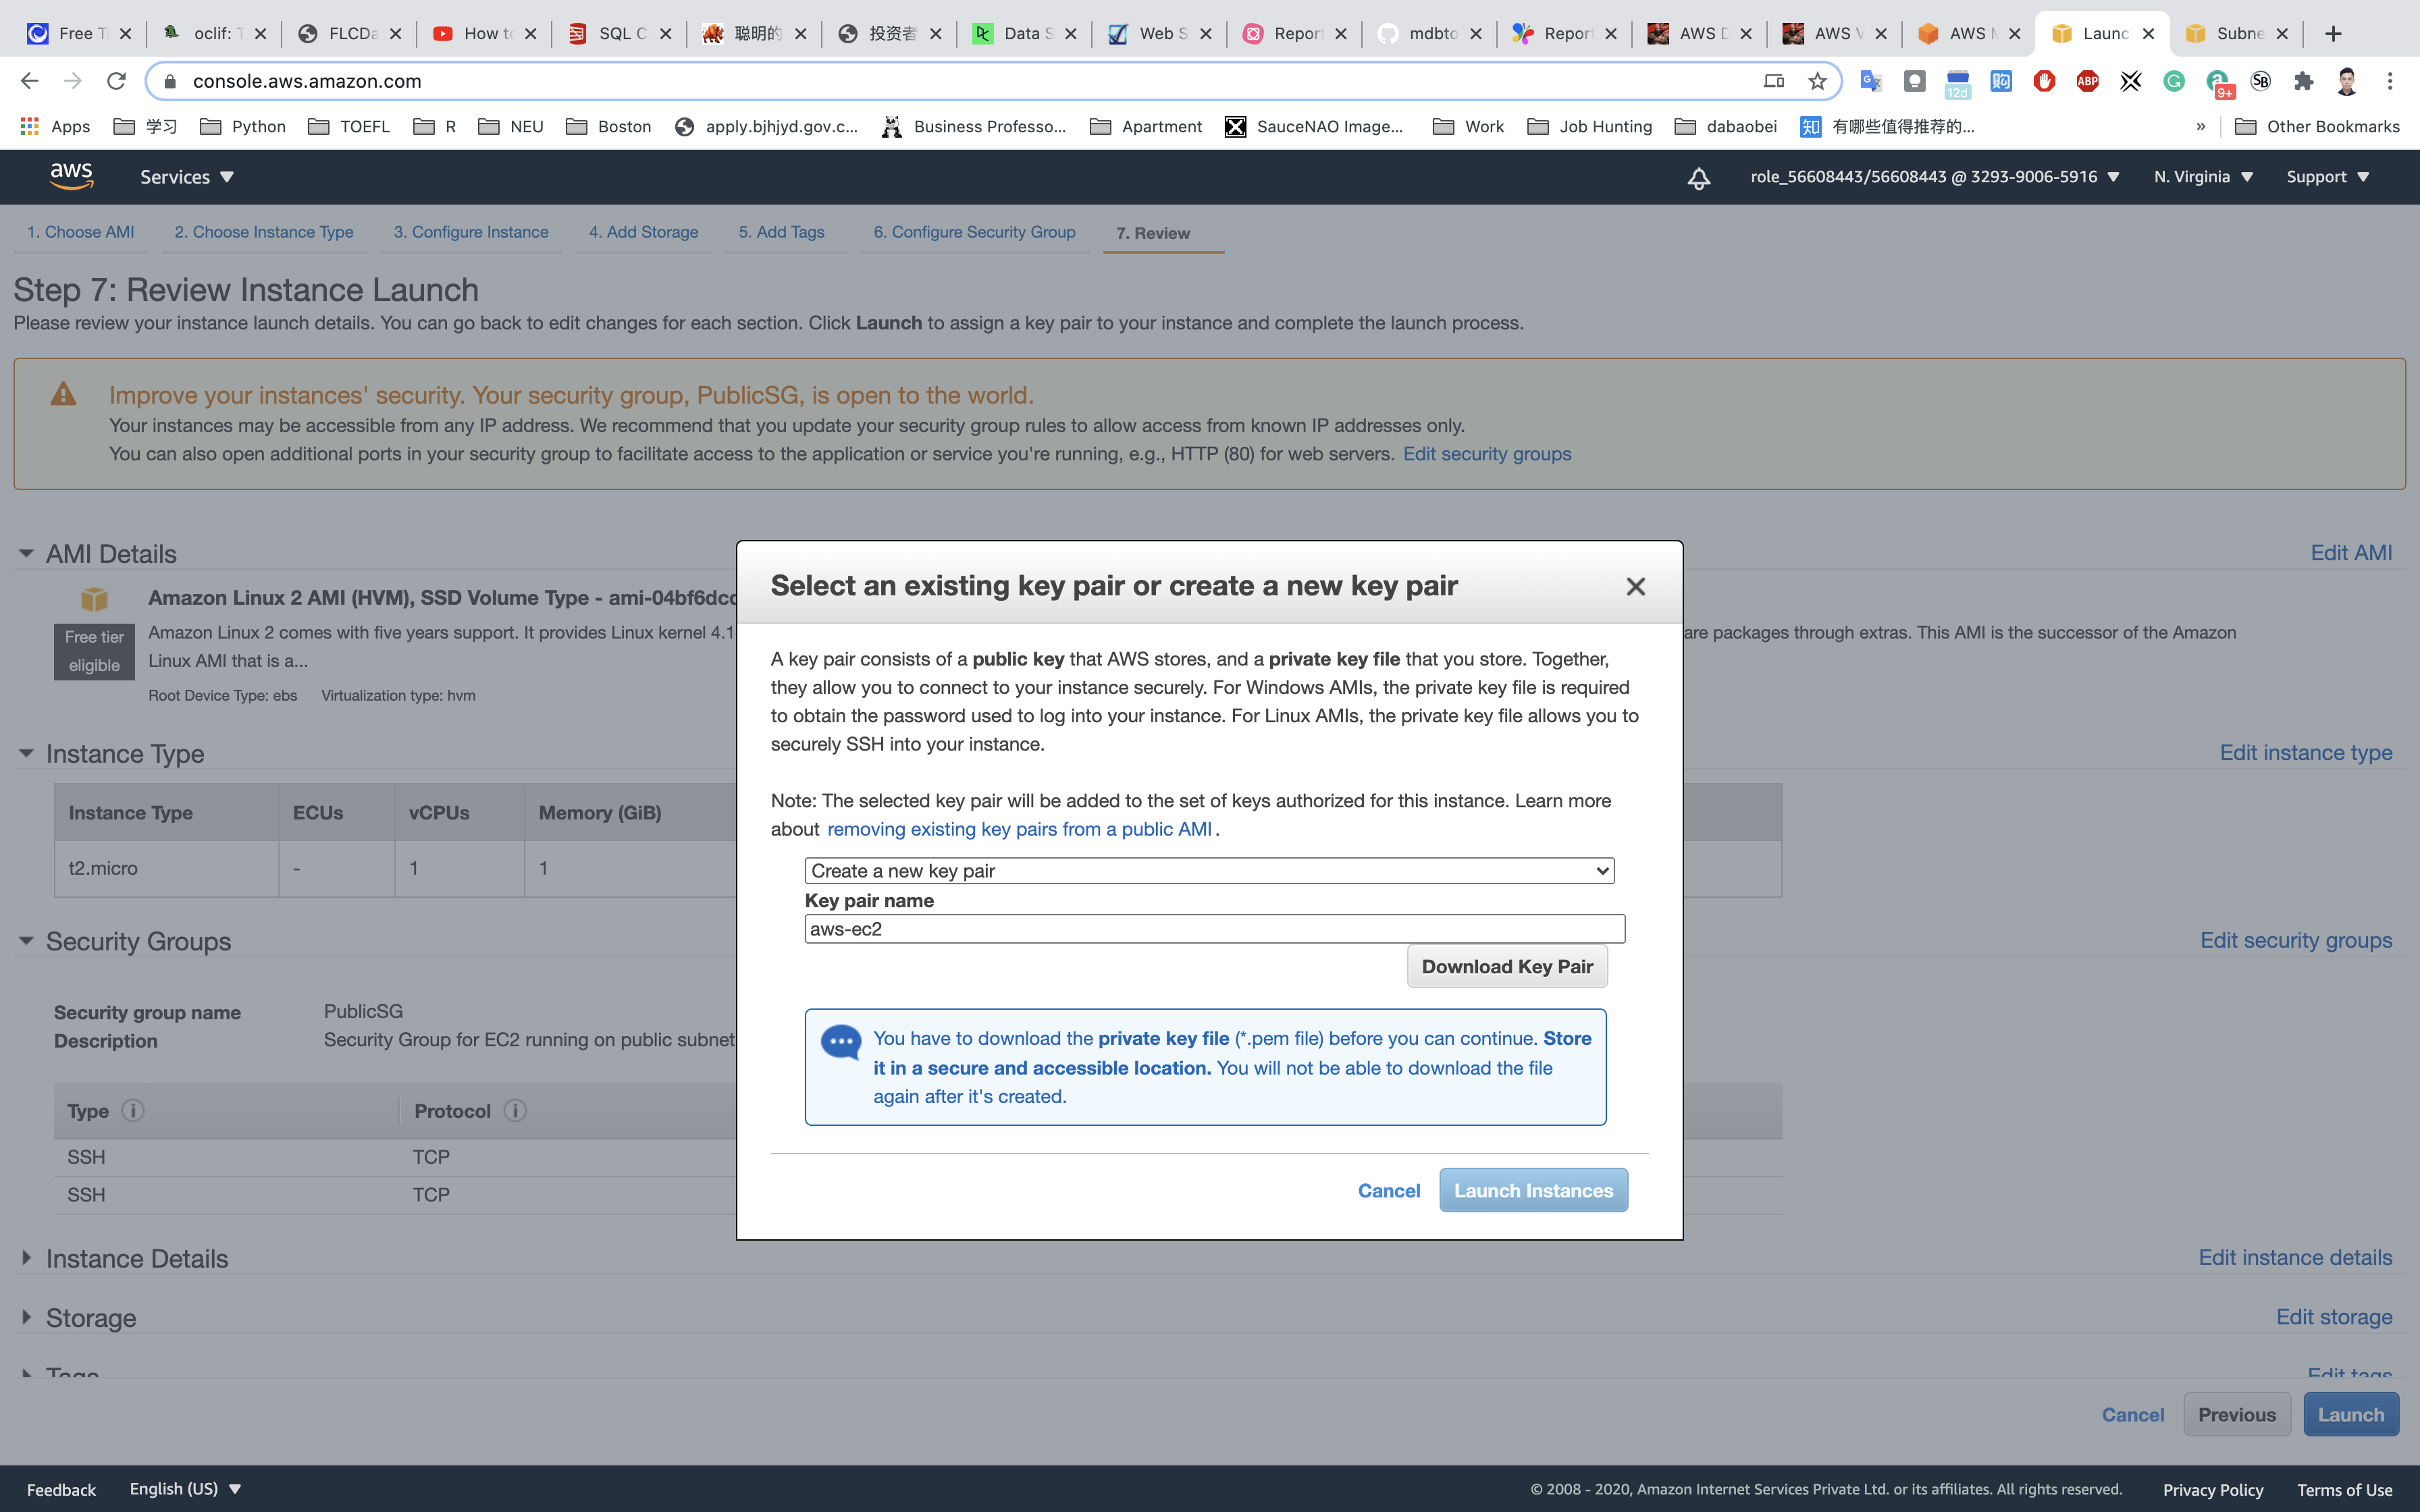
Click on Launch Instances.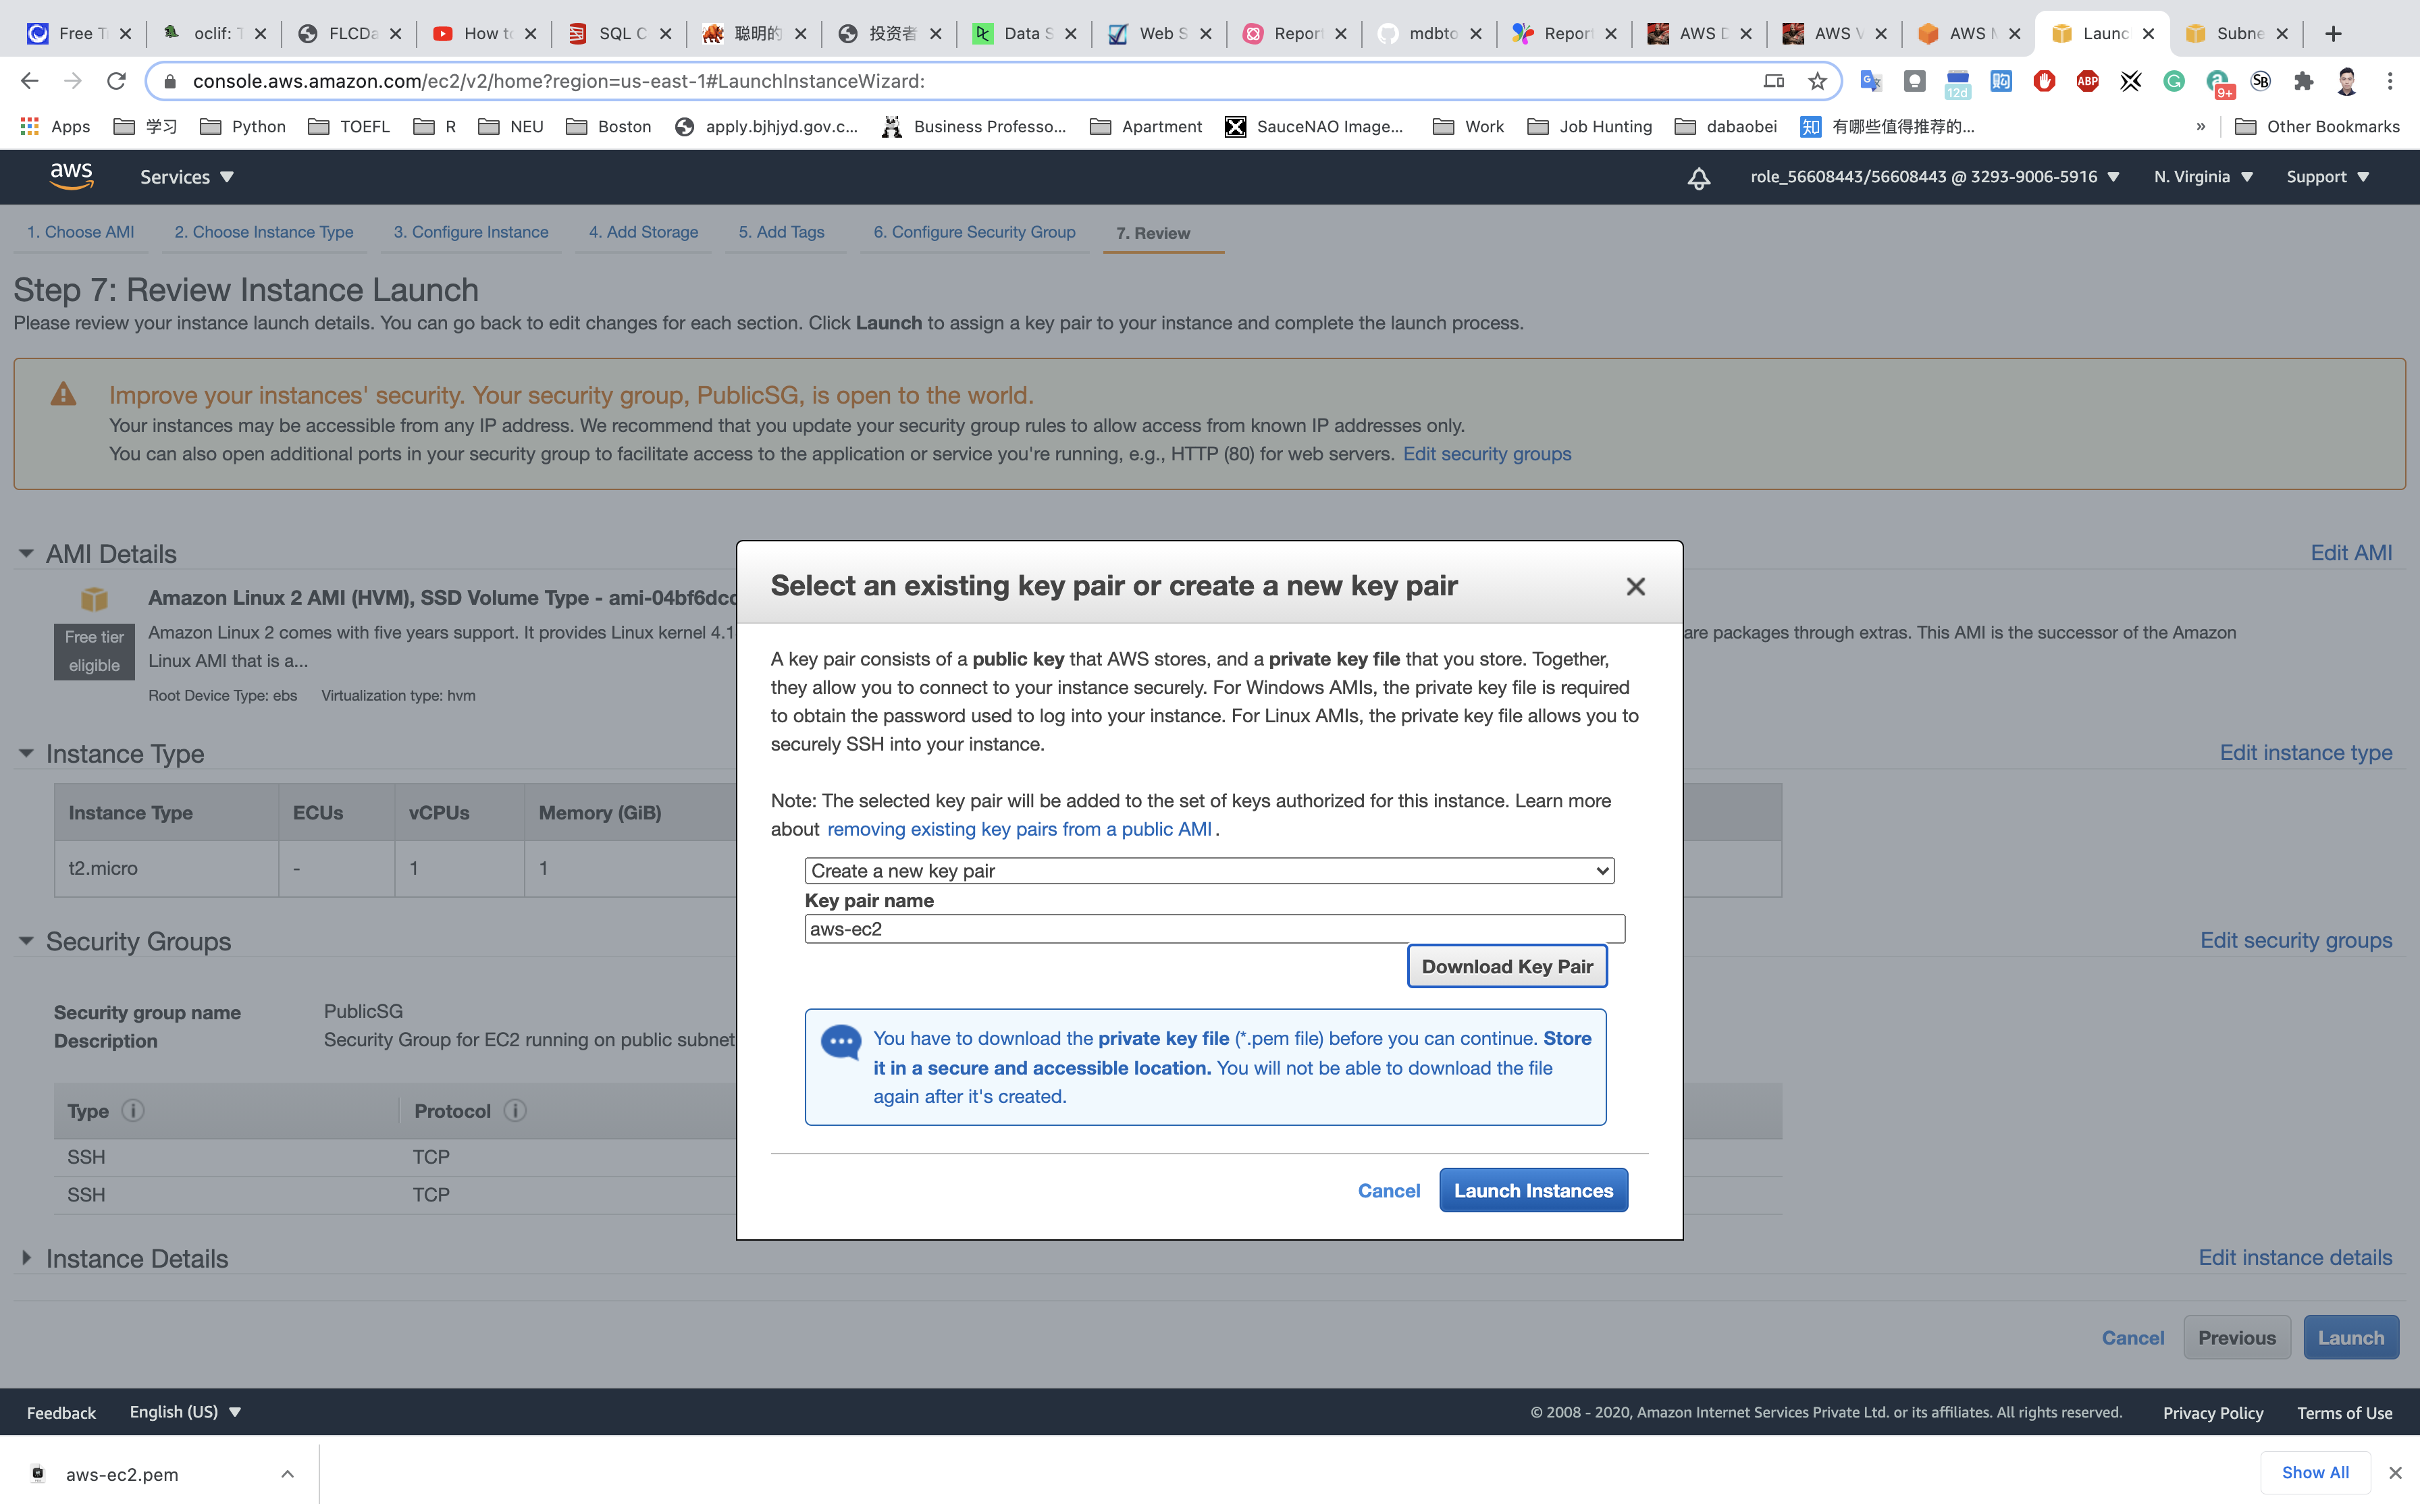
Launch Status: Your instance is now launching, Select the instance and wait for it to change status to running.
Note down the Public IP address of PublicEC2Server: 3.89.215.39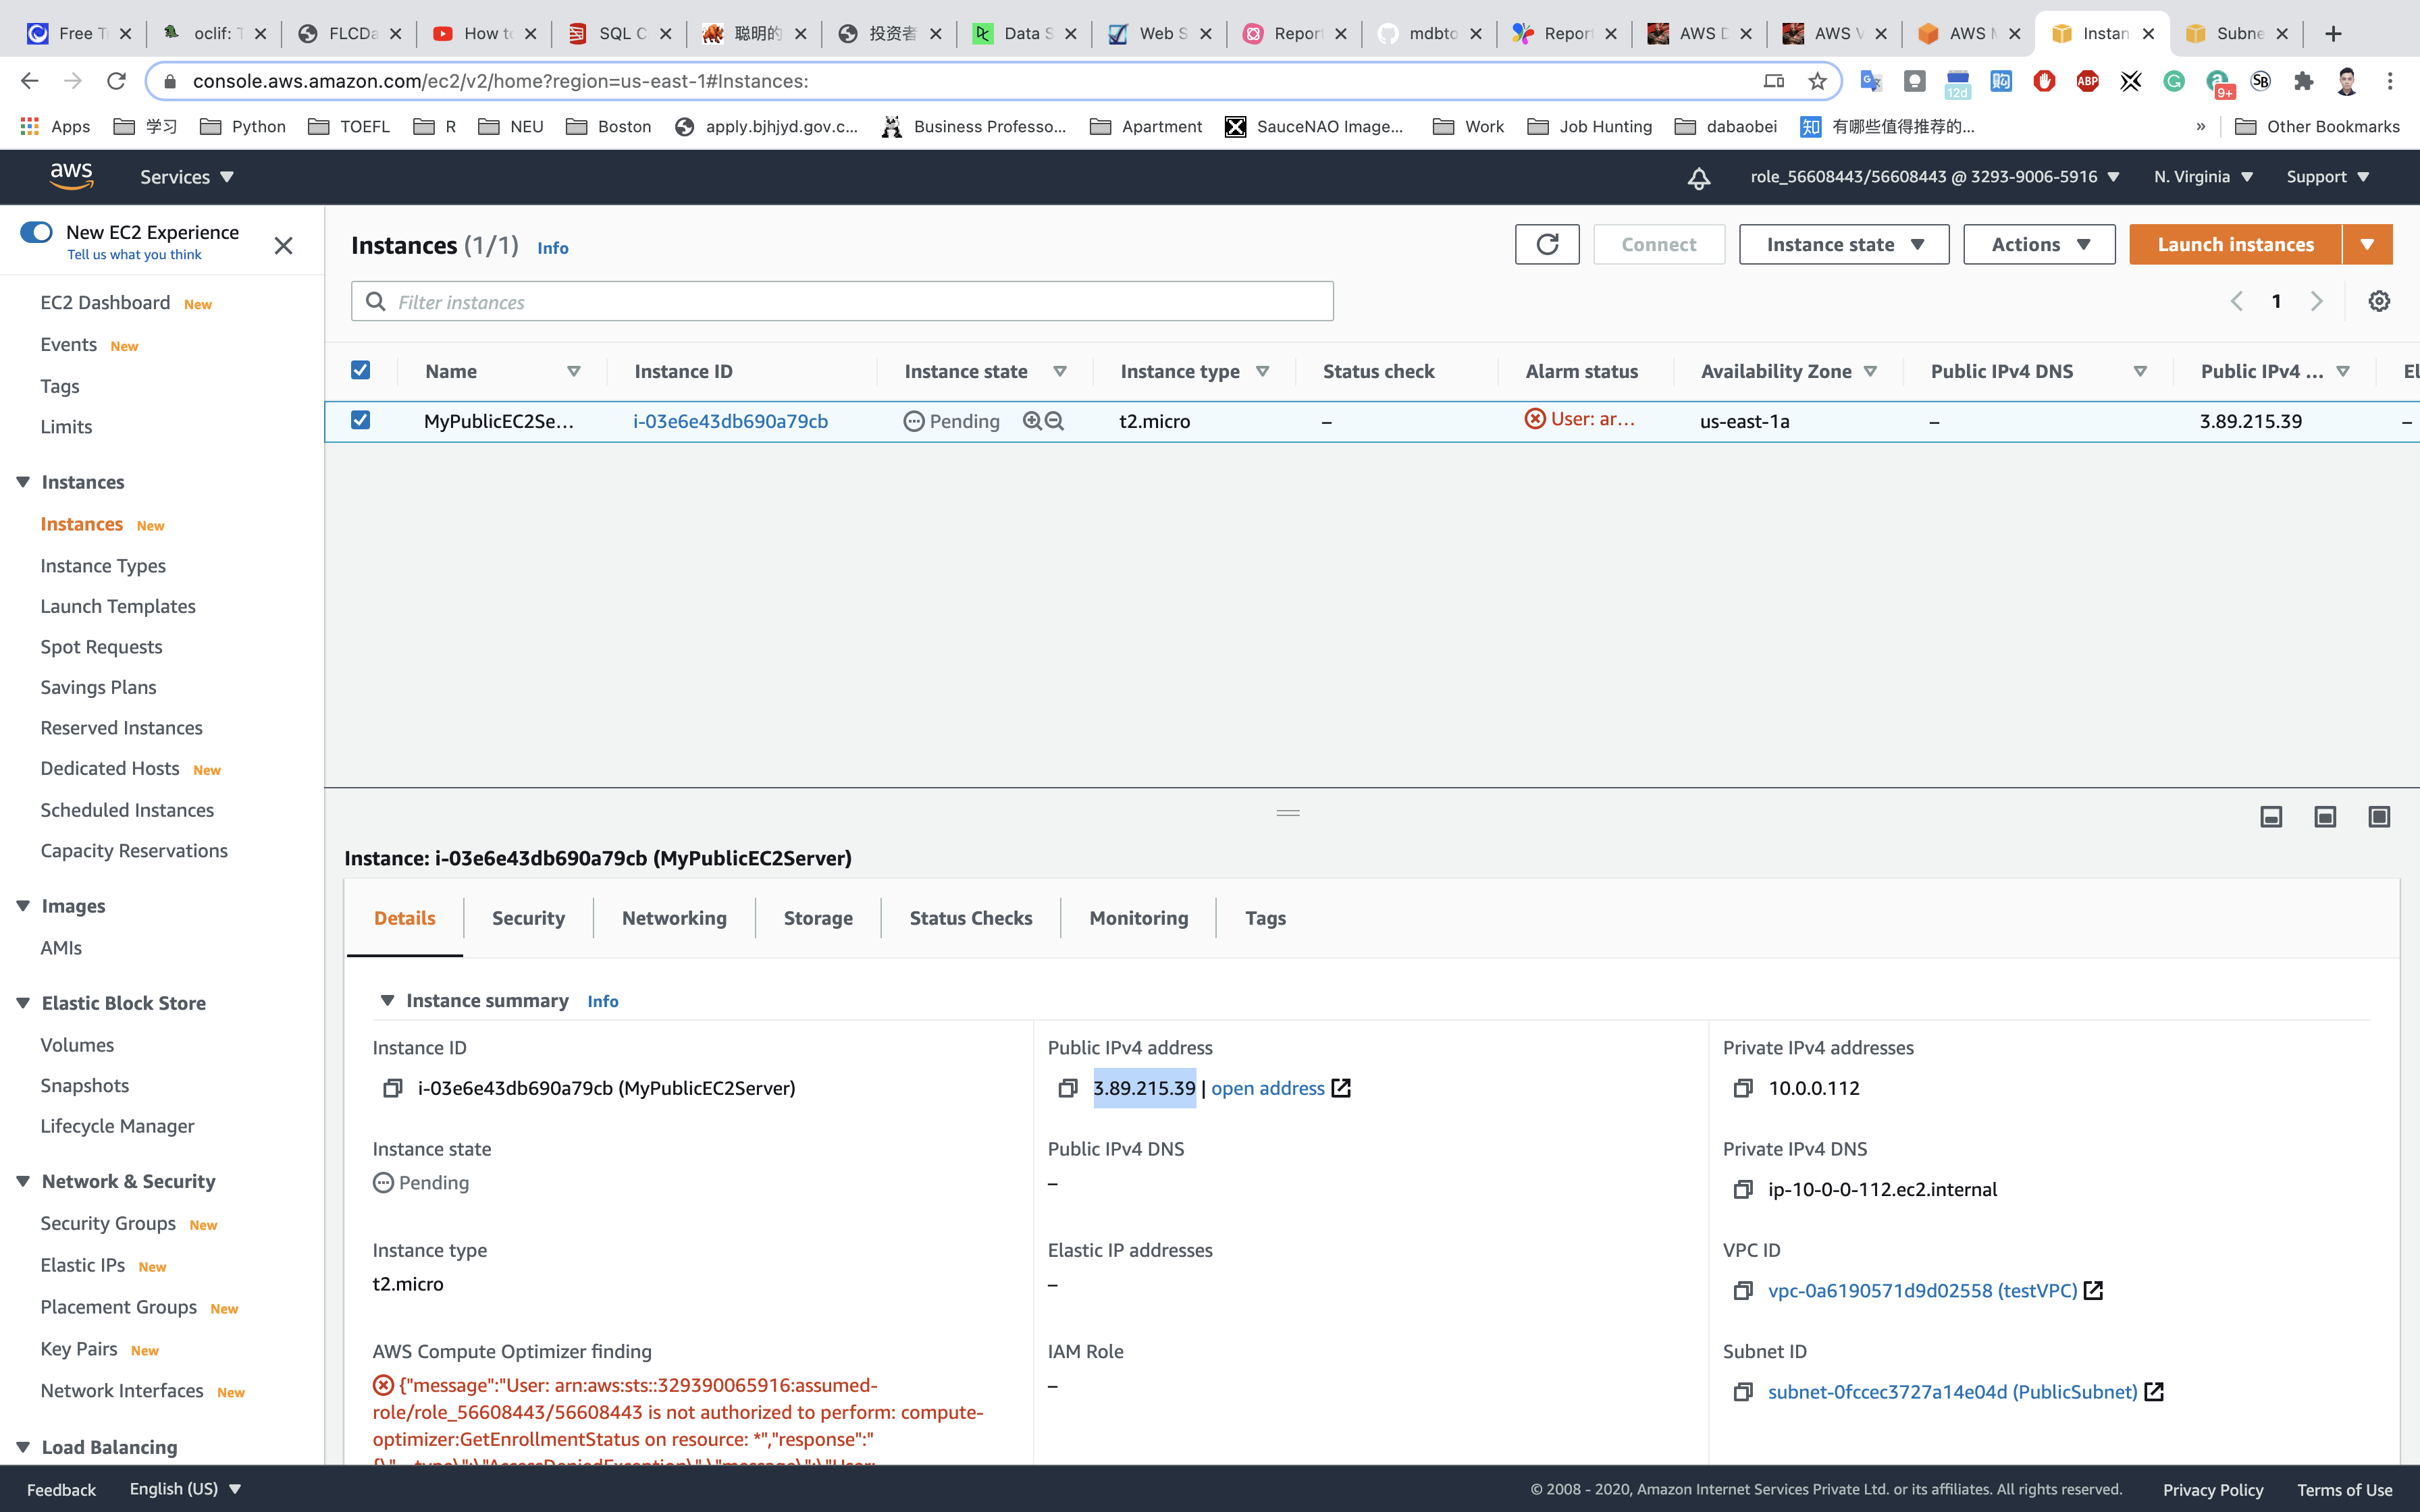
SNS Configuration
Services -> SNS -> Topics
Create SNS Topic
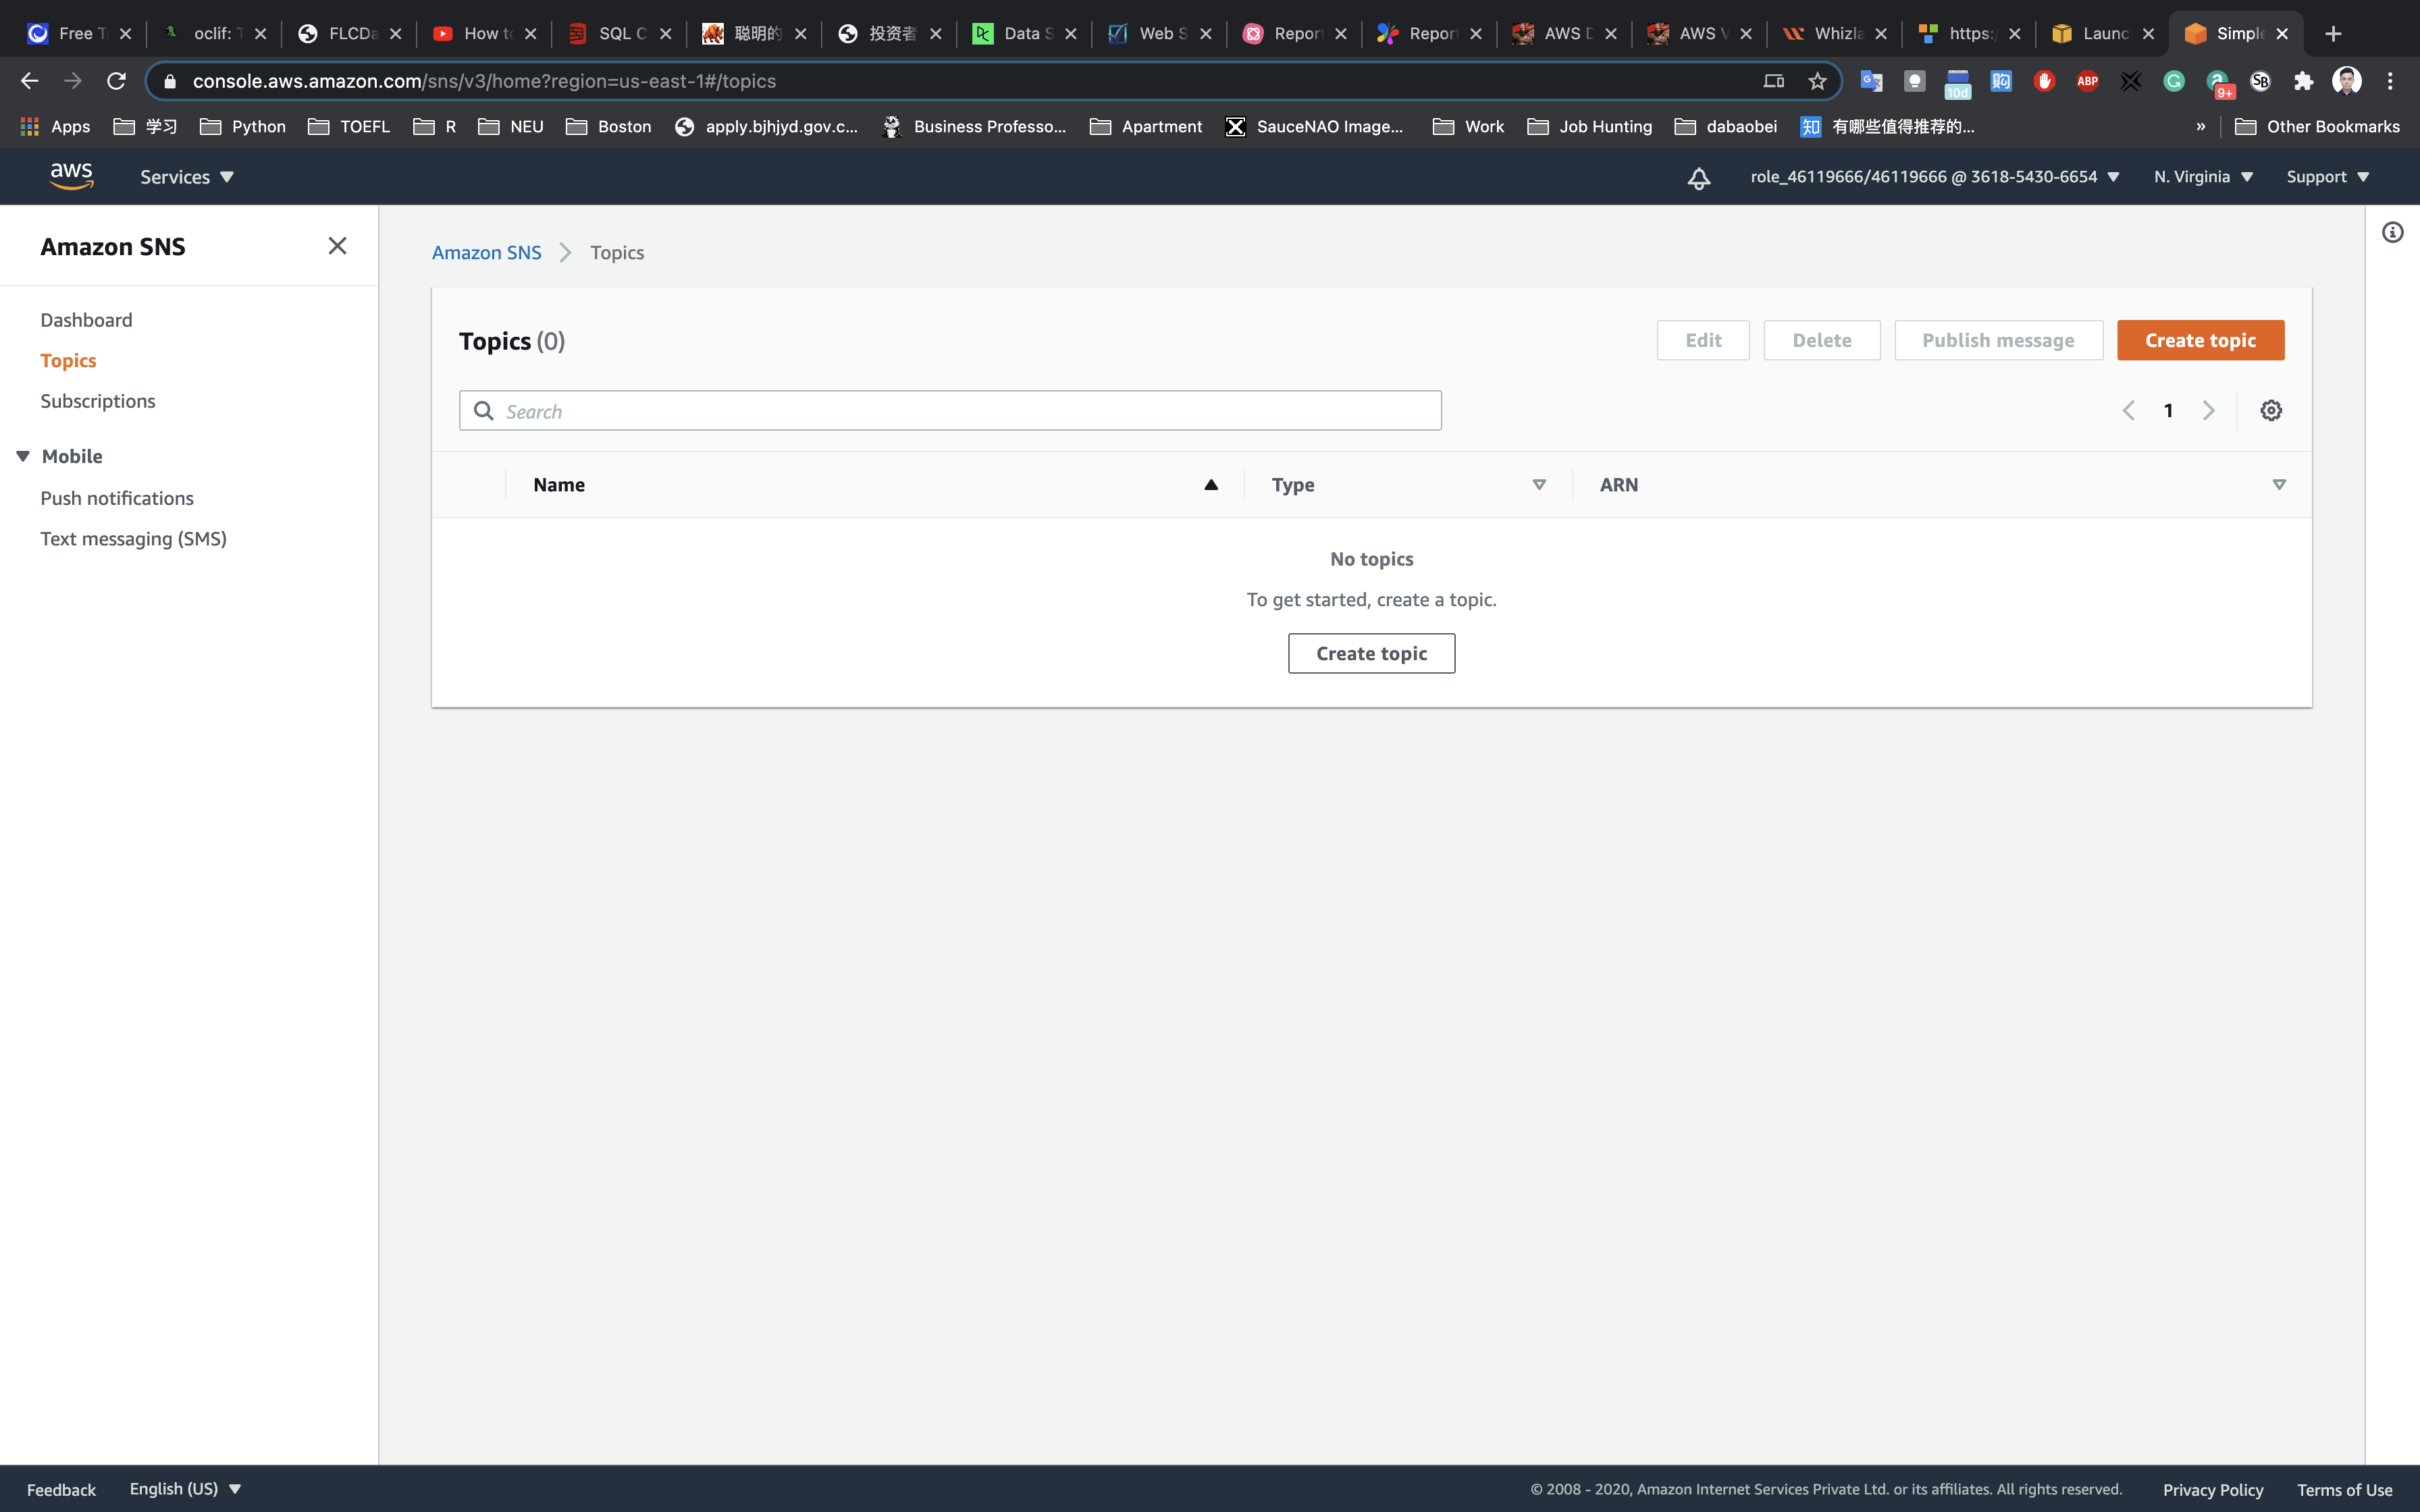
Navigate to SNS by clicking on the menu available under the section.
Click on Topics in the left panel.
Under Details:
- Select
Standard - Name:
MyServerMonitor - Display name:
MyServerMonitor
Leave other options as default and click on Create topic.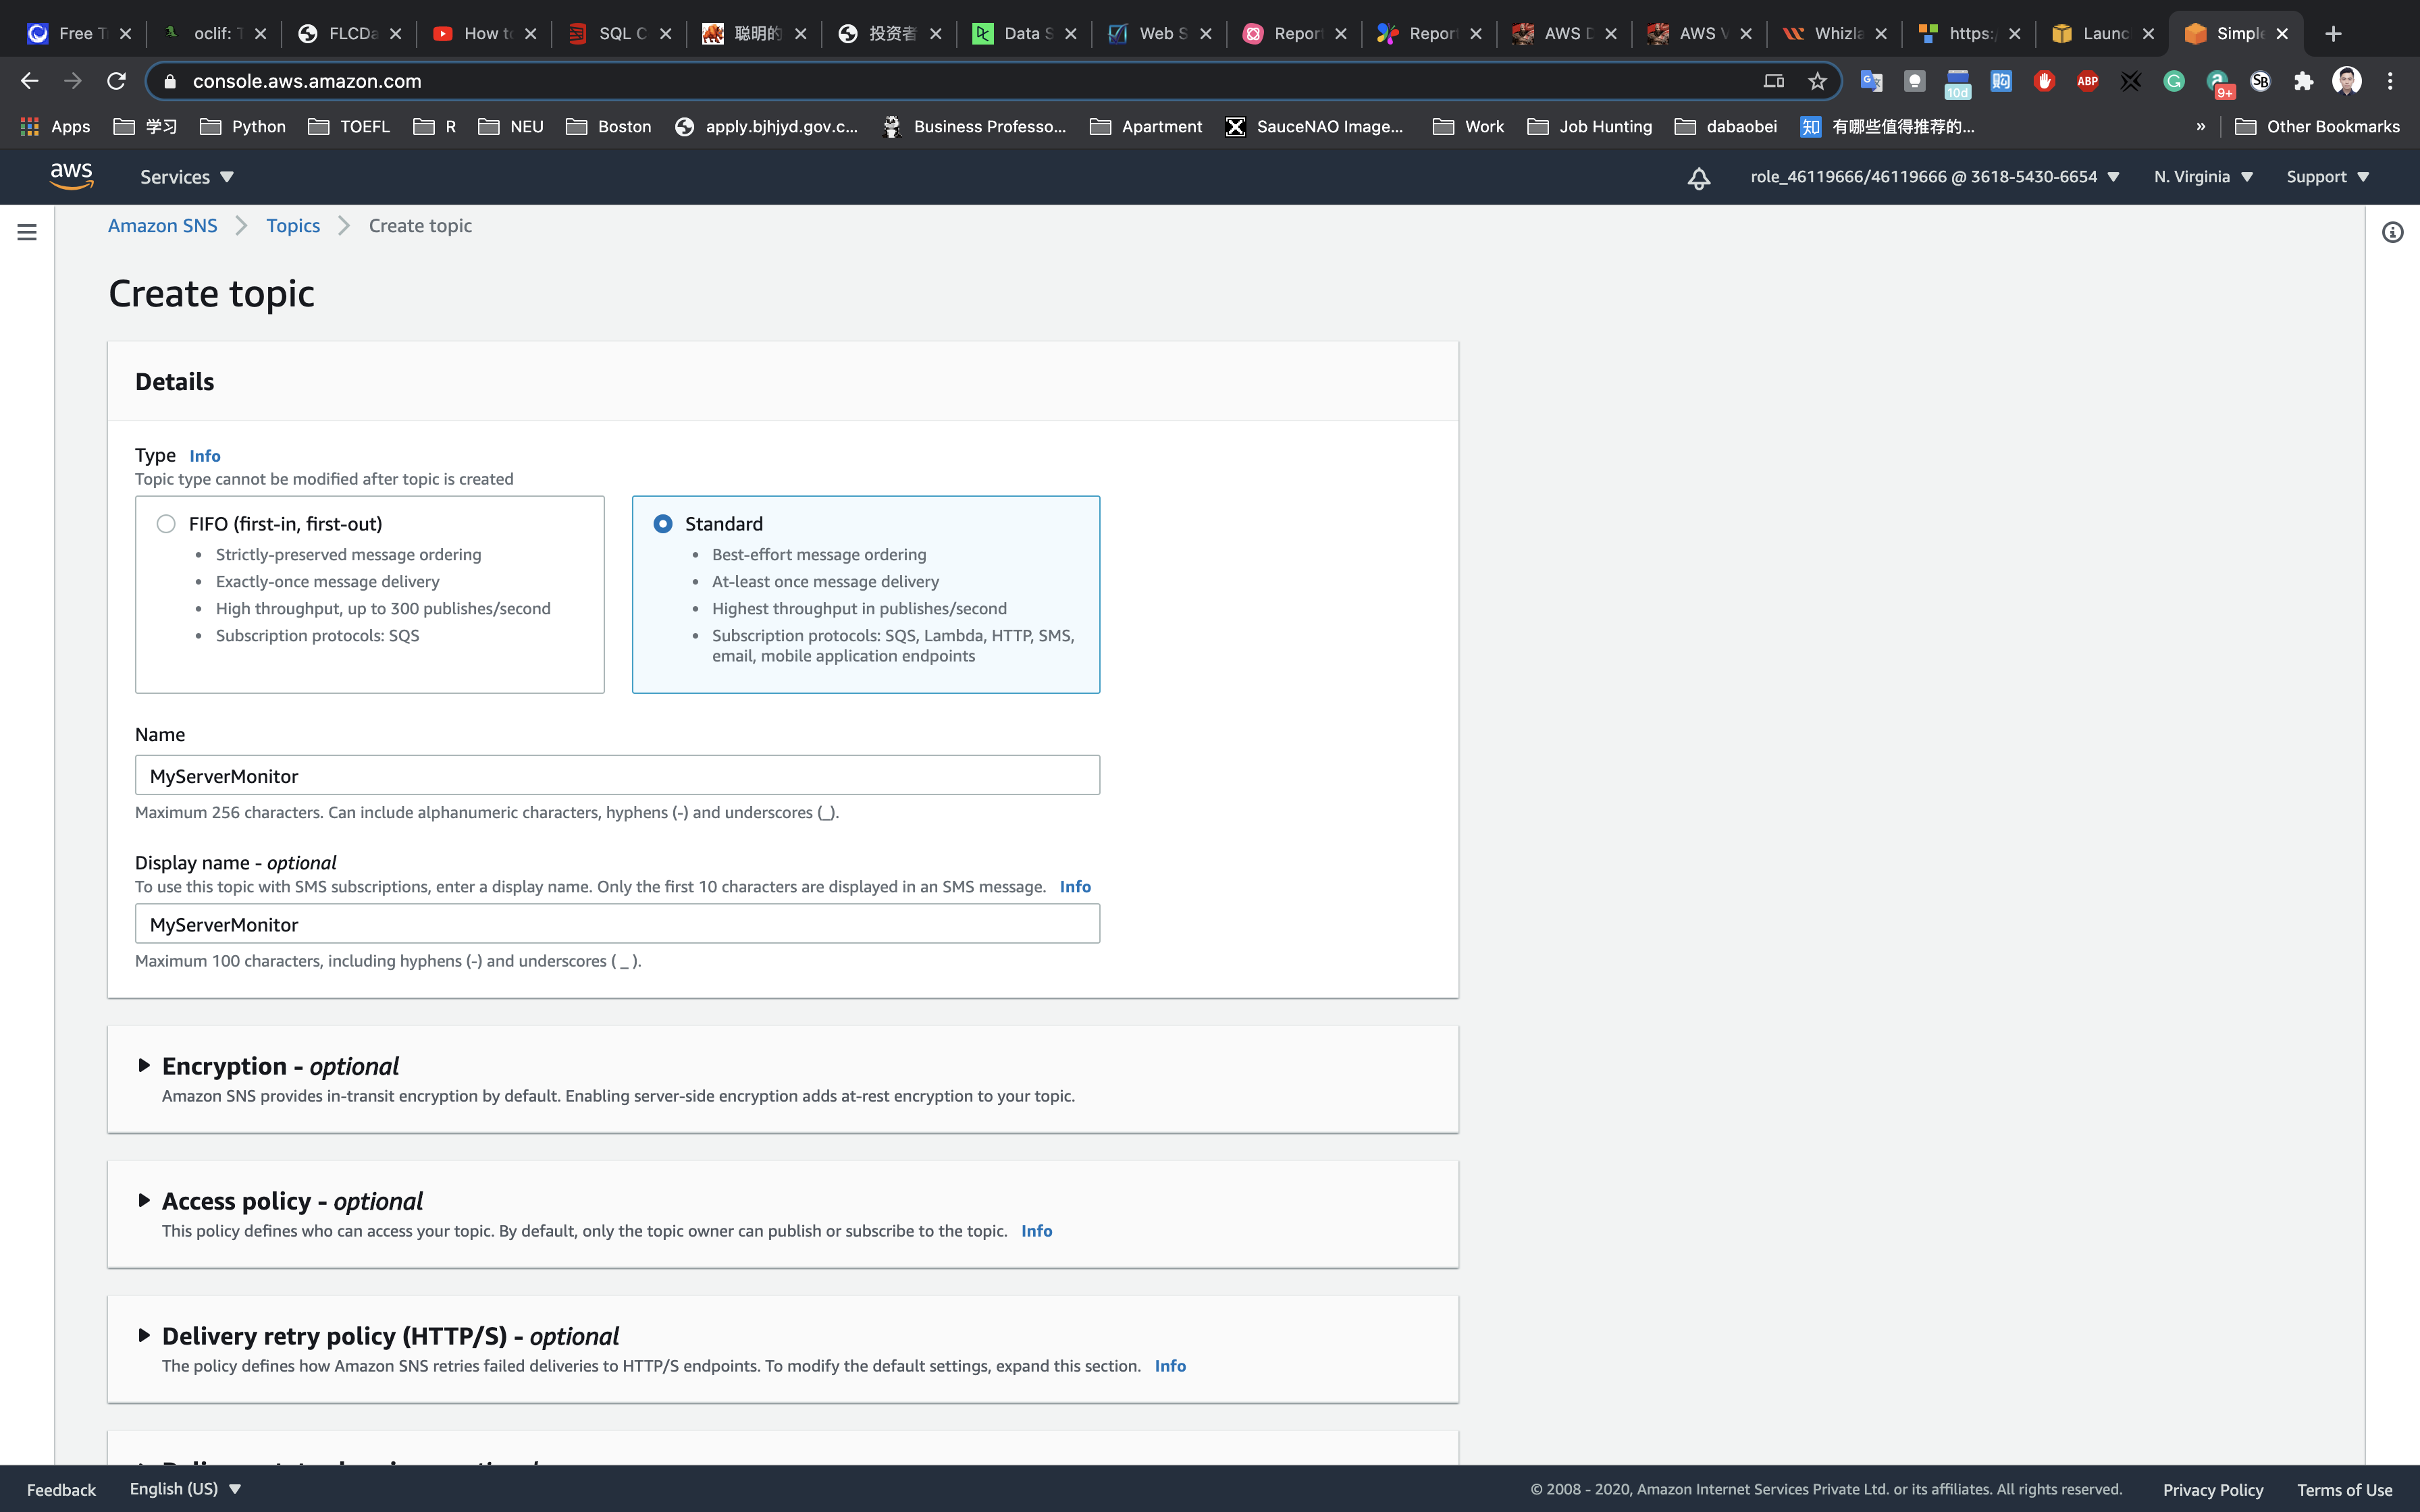
A SNS topic is now created.
Subscribe to SNS Topic
Once SNS topic is created. Click on SNS topic MyServerMonitor.
Click on Create subscription.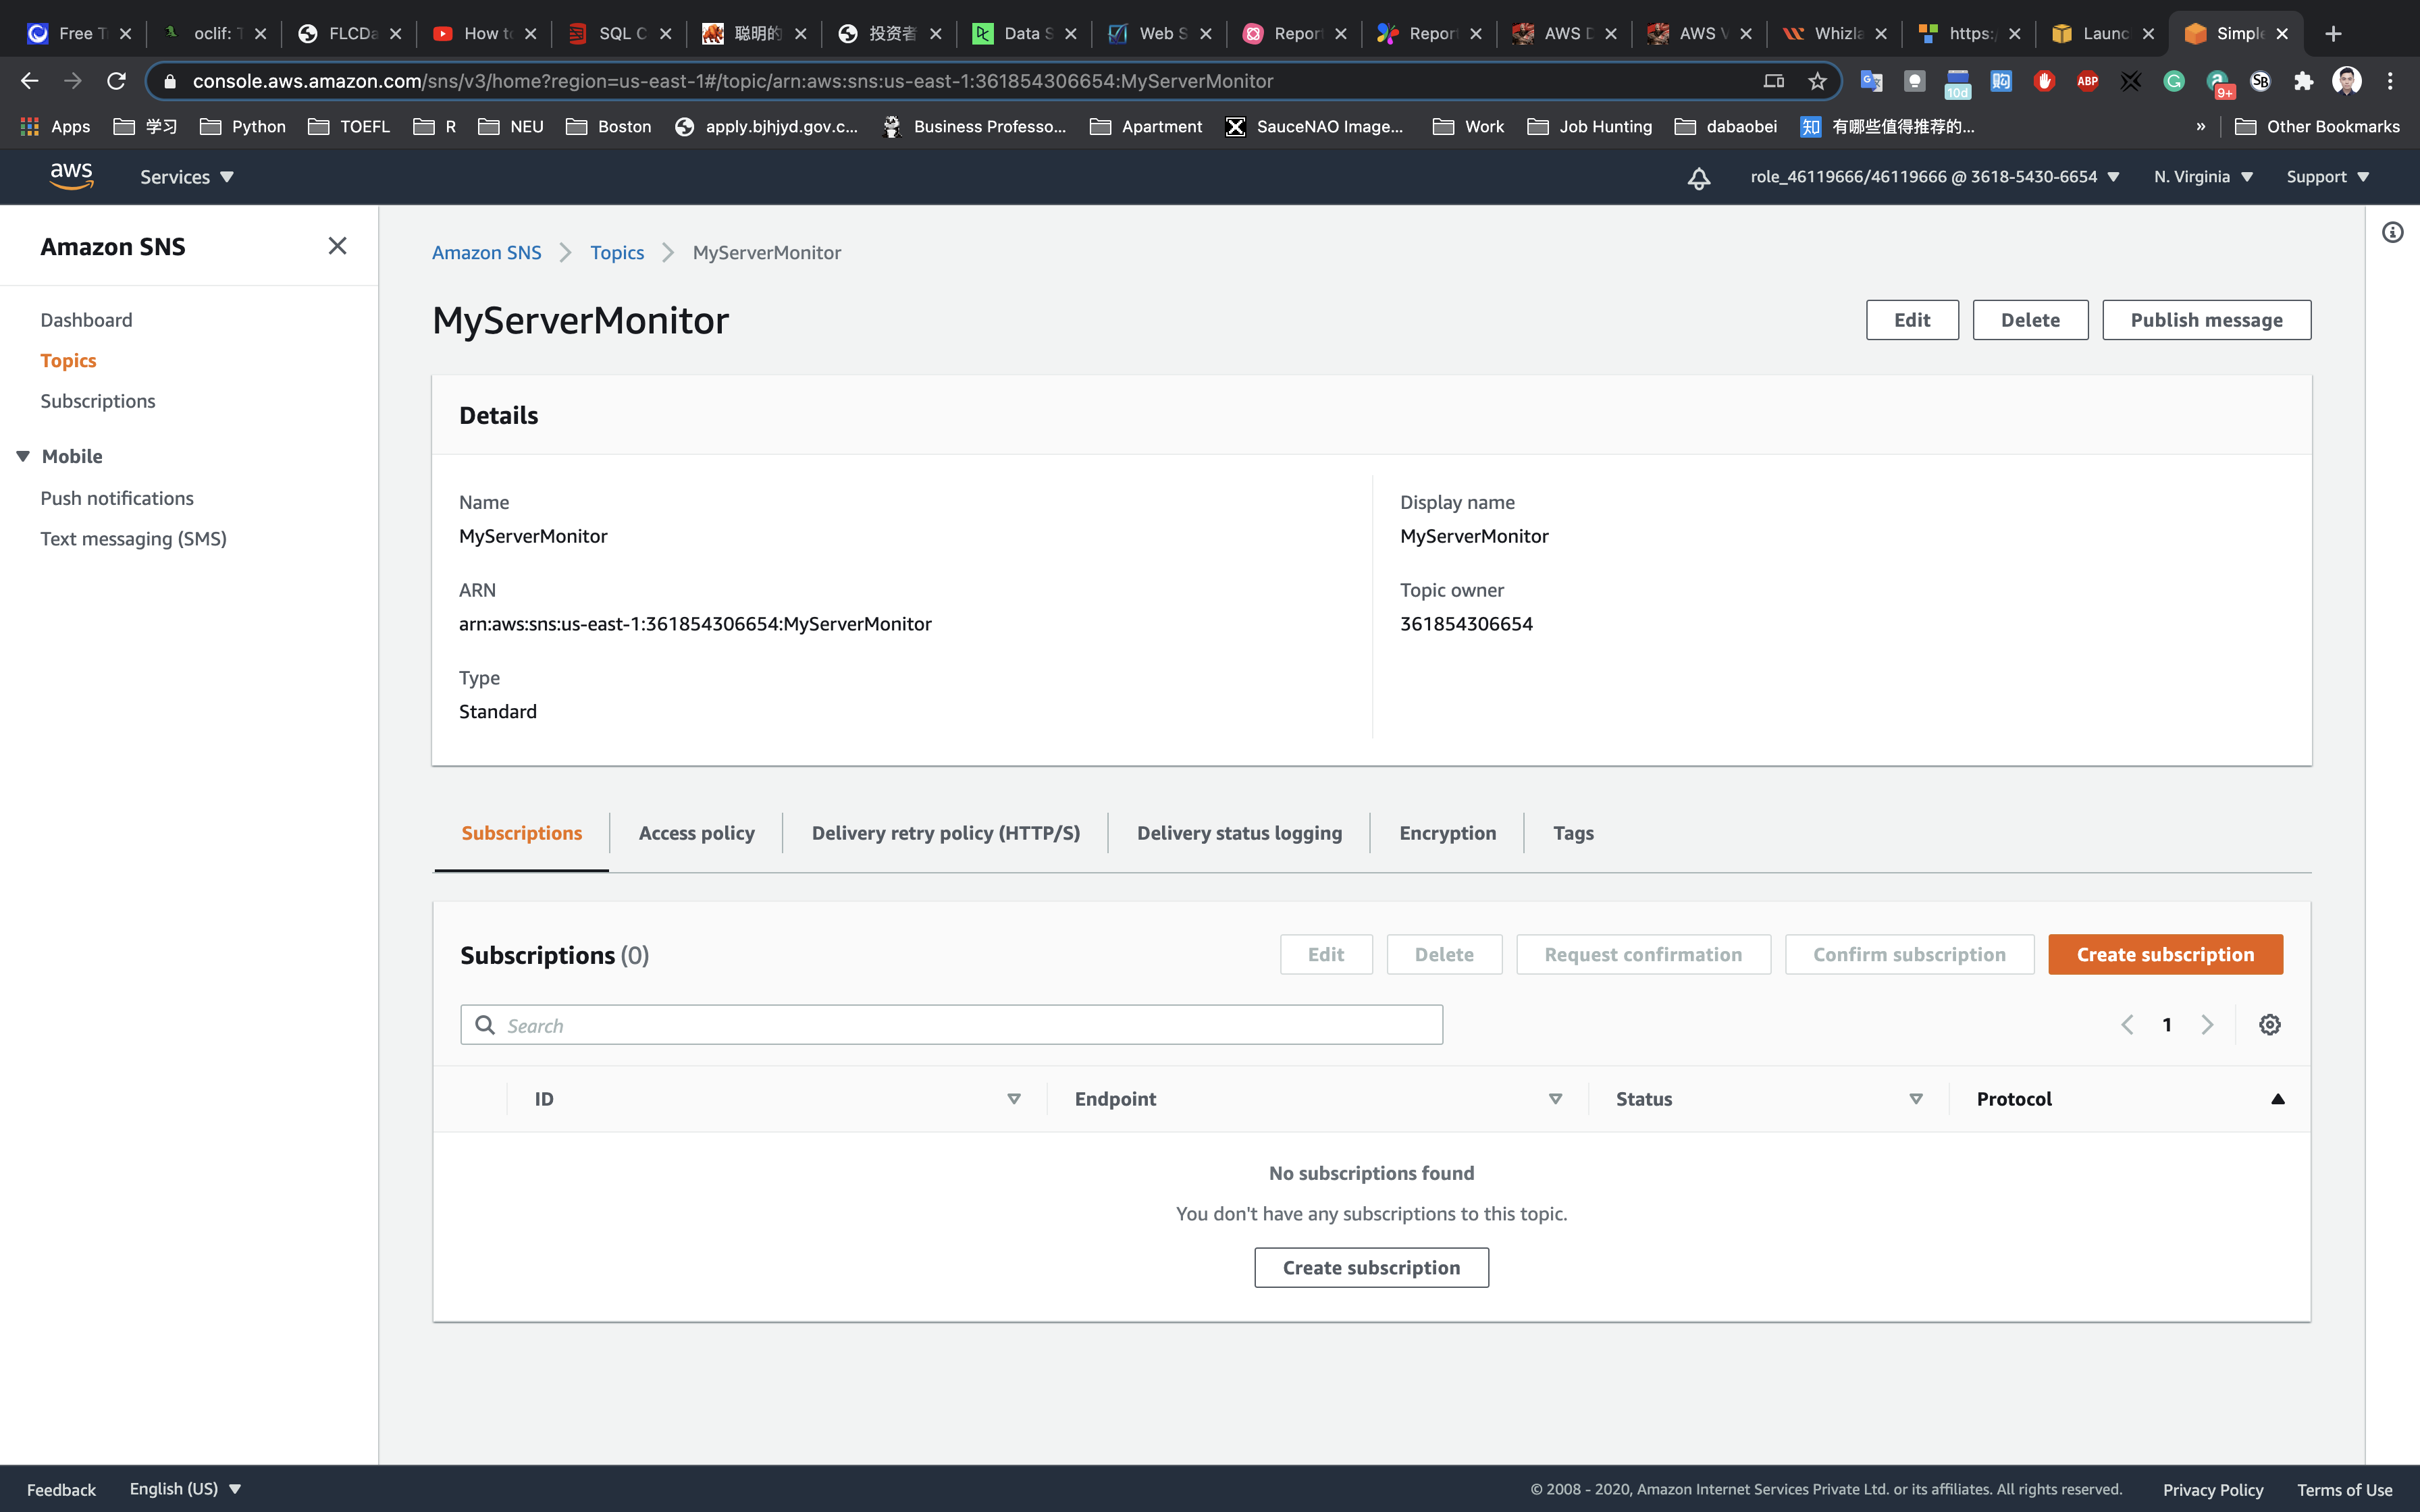
Under Details:
- Protocol: Select
Email - Endpoint: Enter your
Note: Make sure you give a valid email address as this is where you will receive SNS notifications.
You will receive an email confirming your subscription to your email address.
Click on Confirm subscription.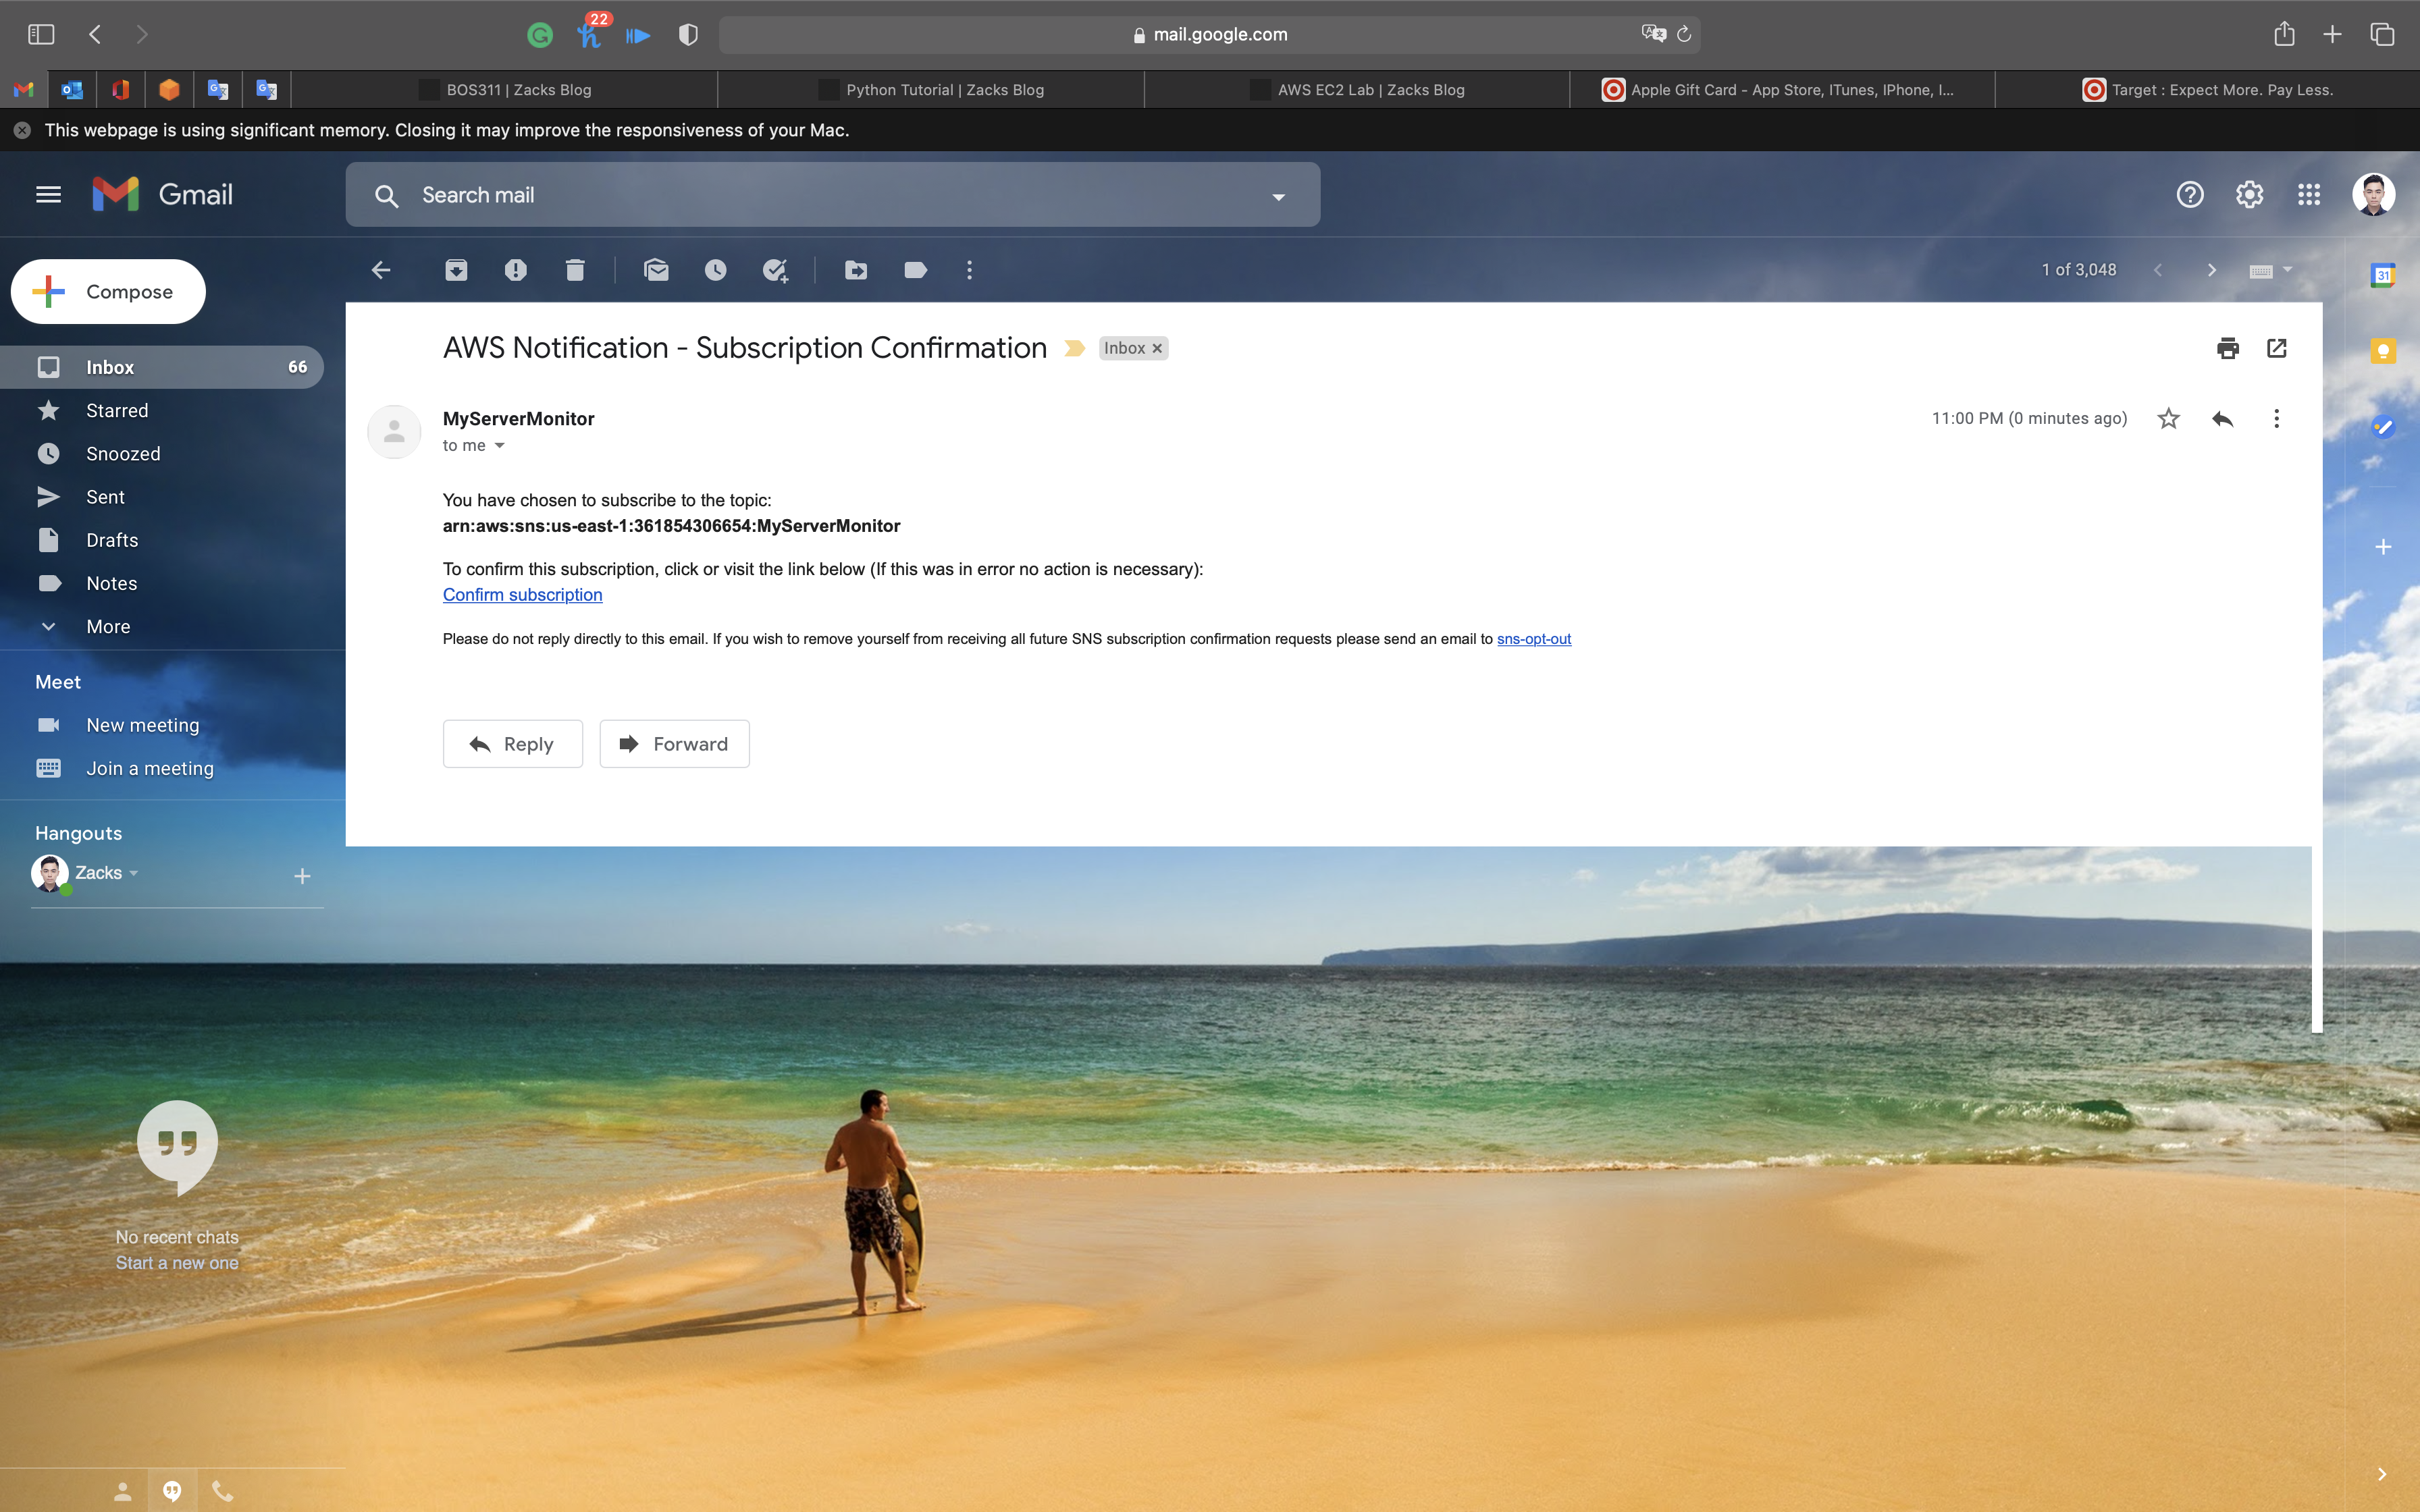
Your email address is now subscribed to the SNS Topic MyServerMonitor.
CloudWatch Configuration
Services -> CloudWatch -> Events
Create CloudWatch Events
Using CloudWatch Events we will trigger SNS Notifications by stopping and starting an EC2 instance.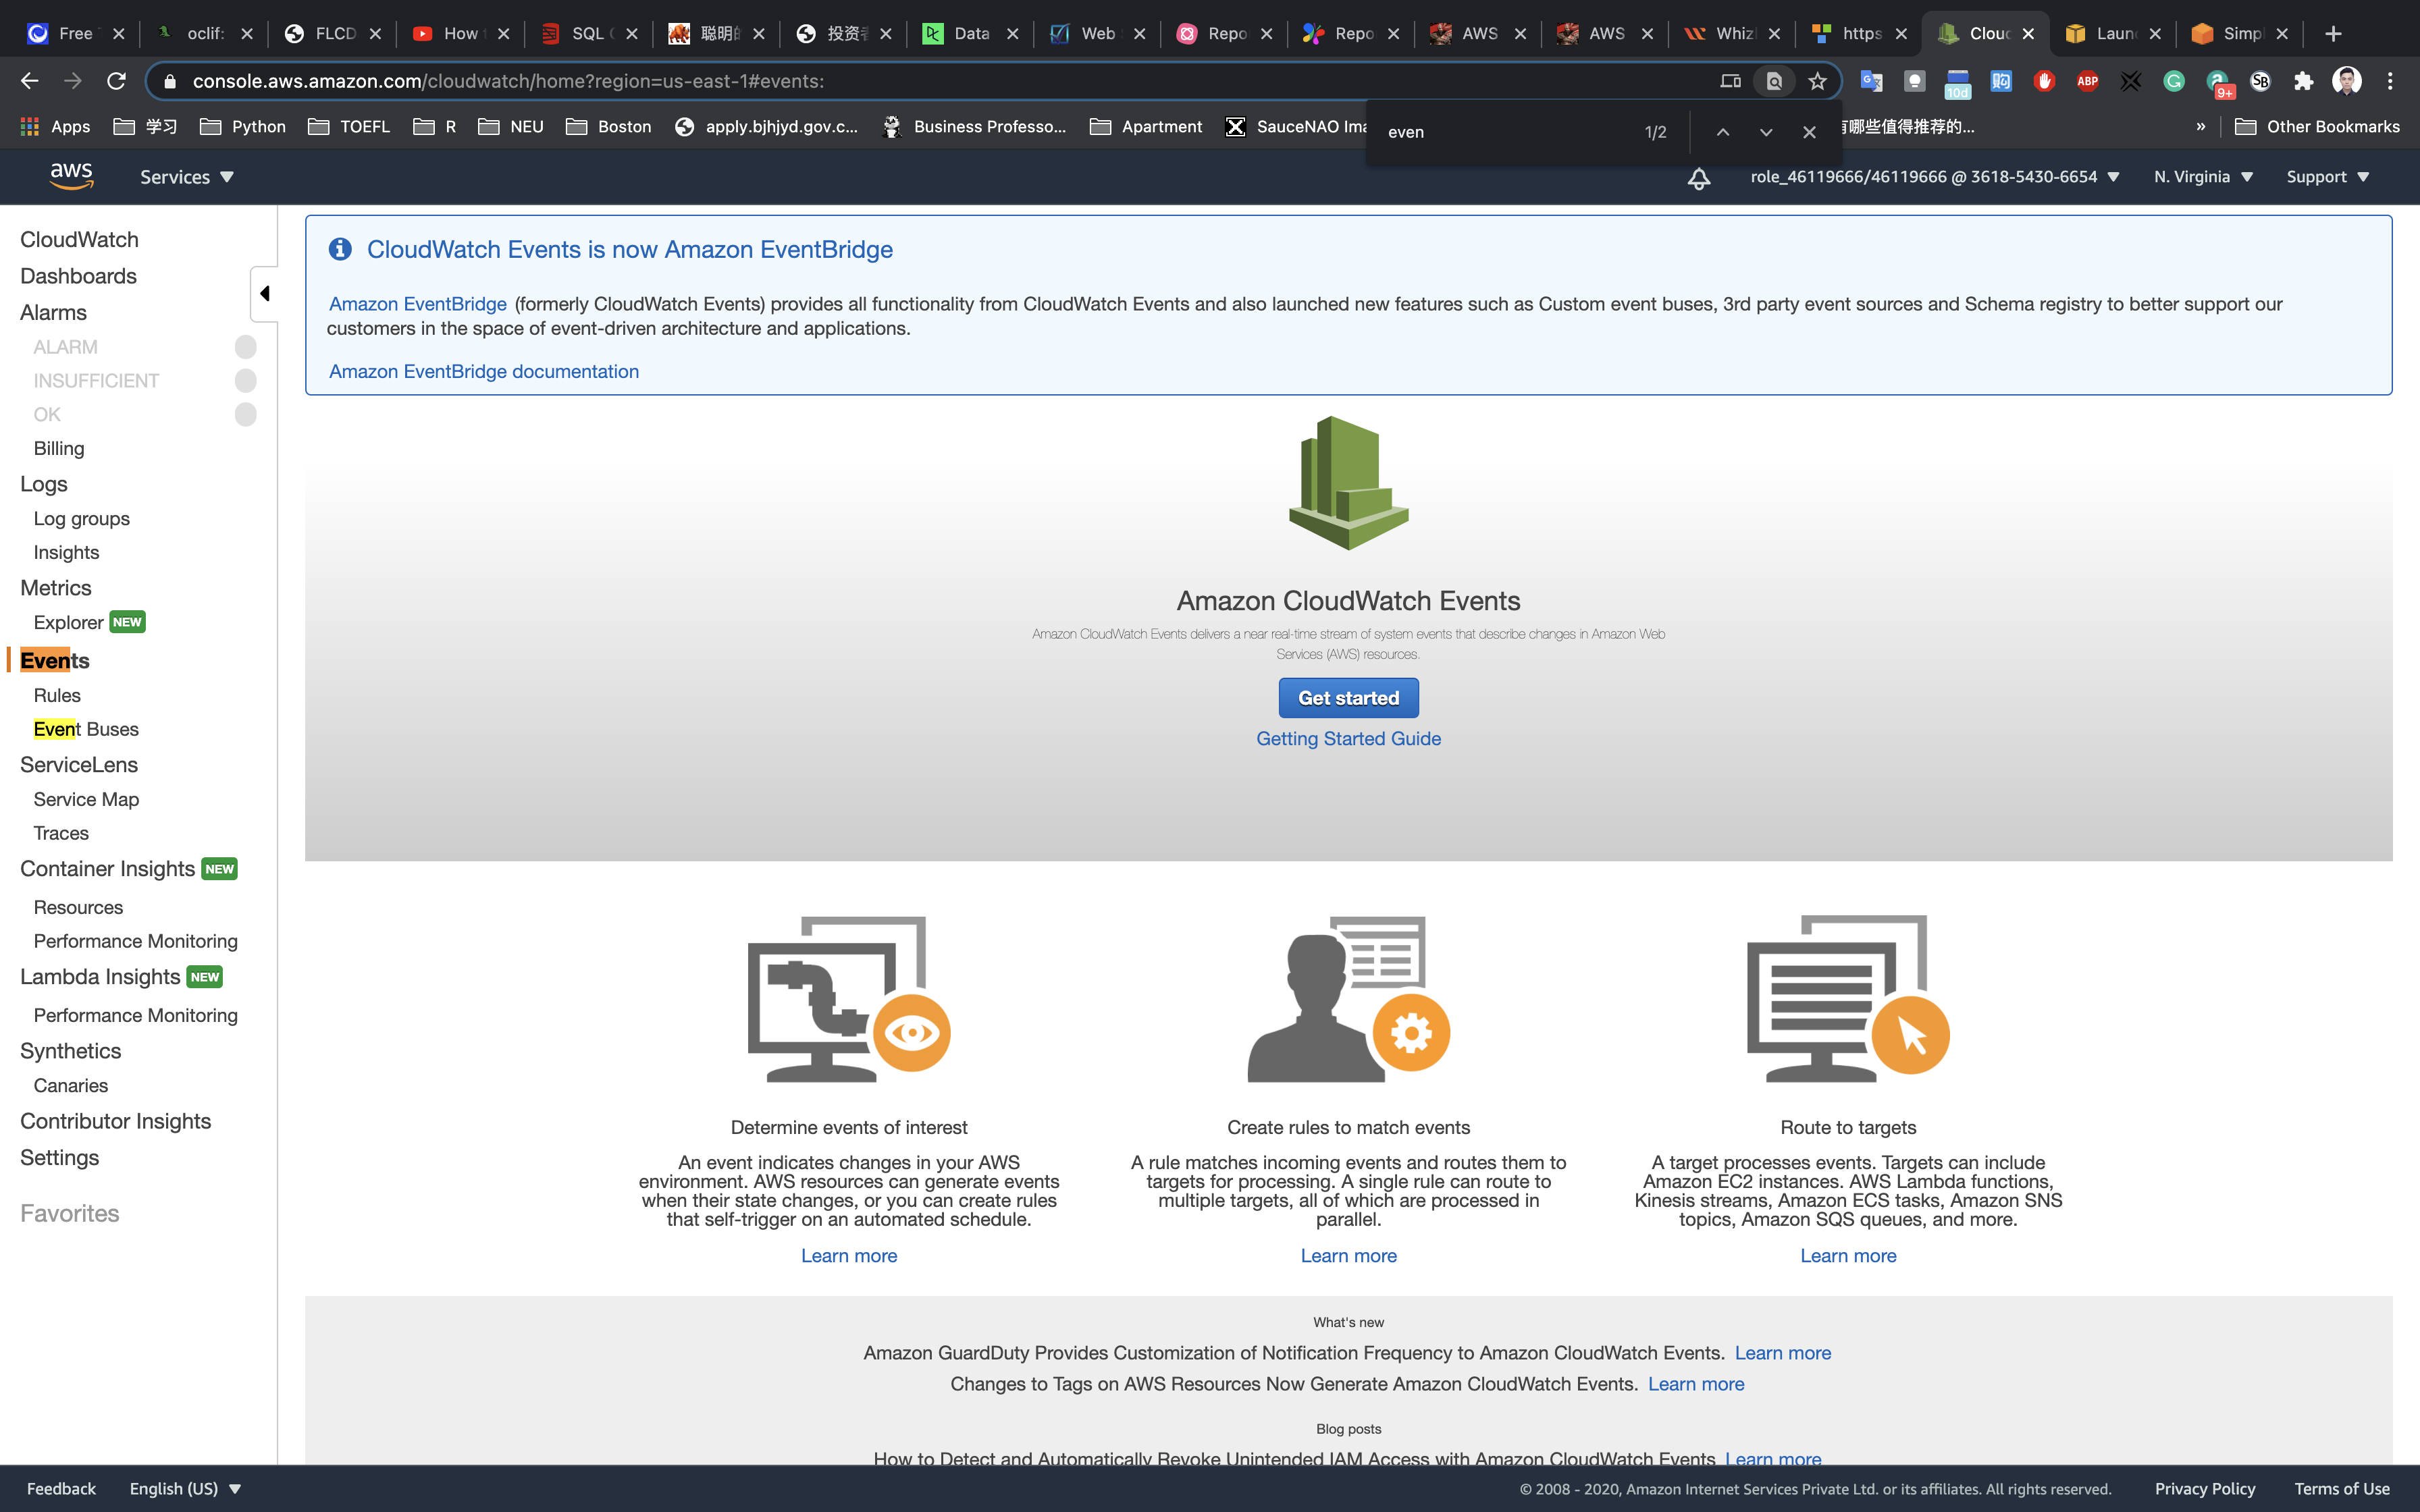
Click on Rules under Events. Click on Create rule.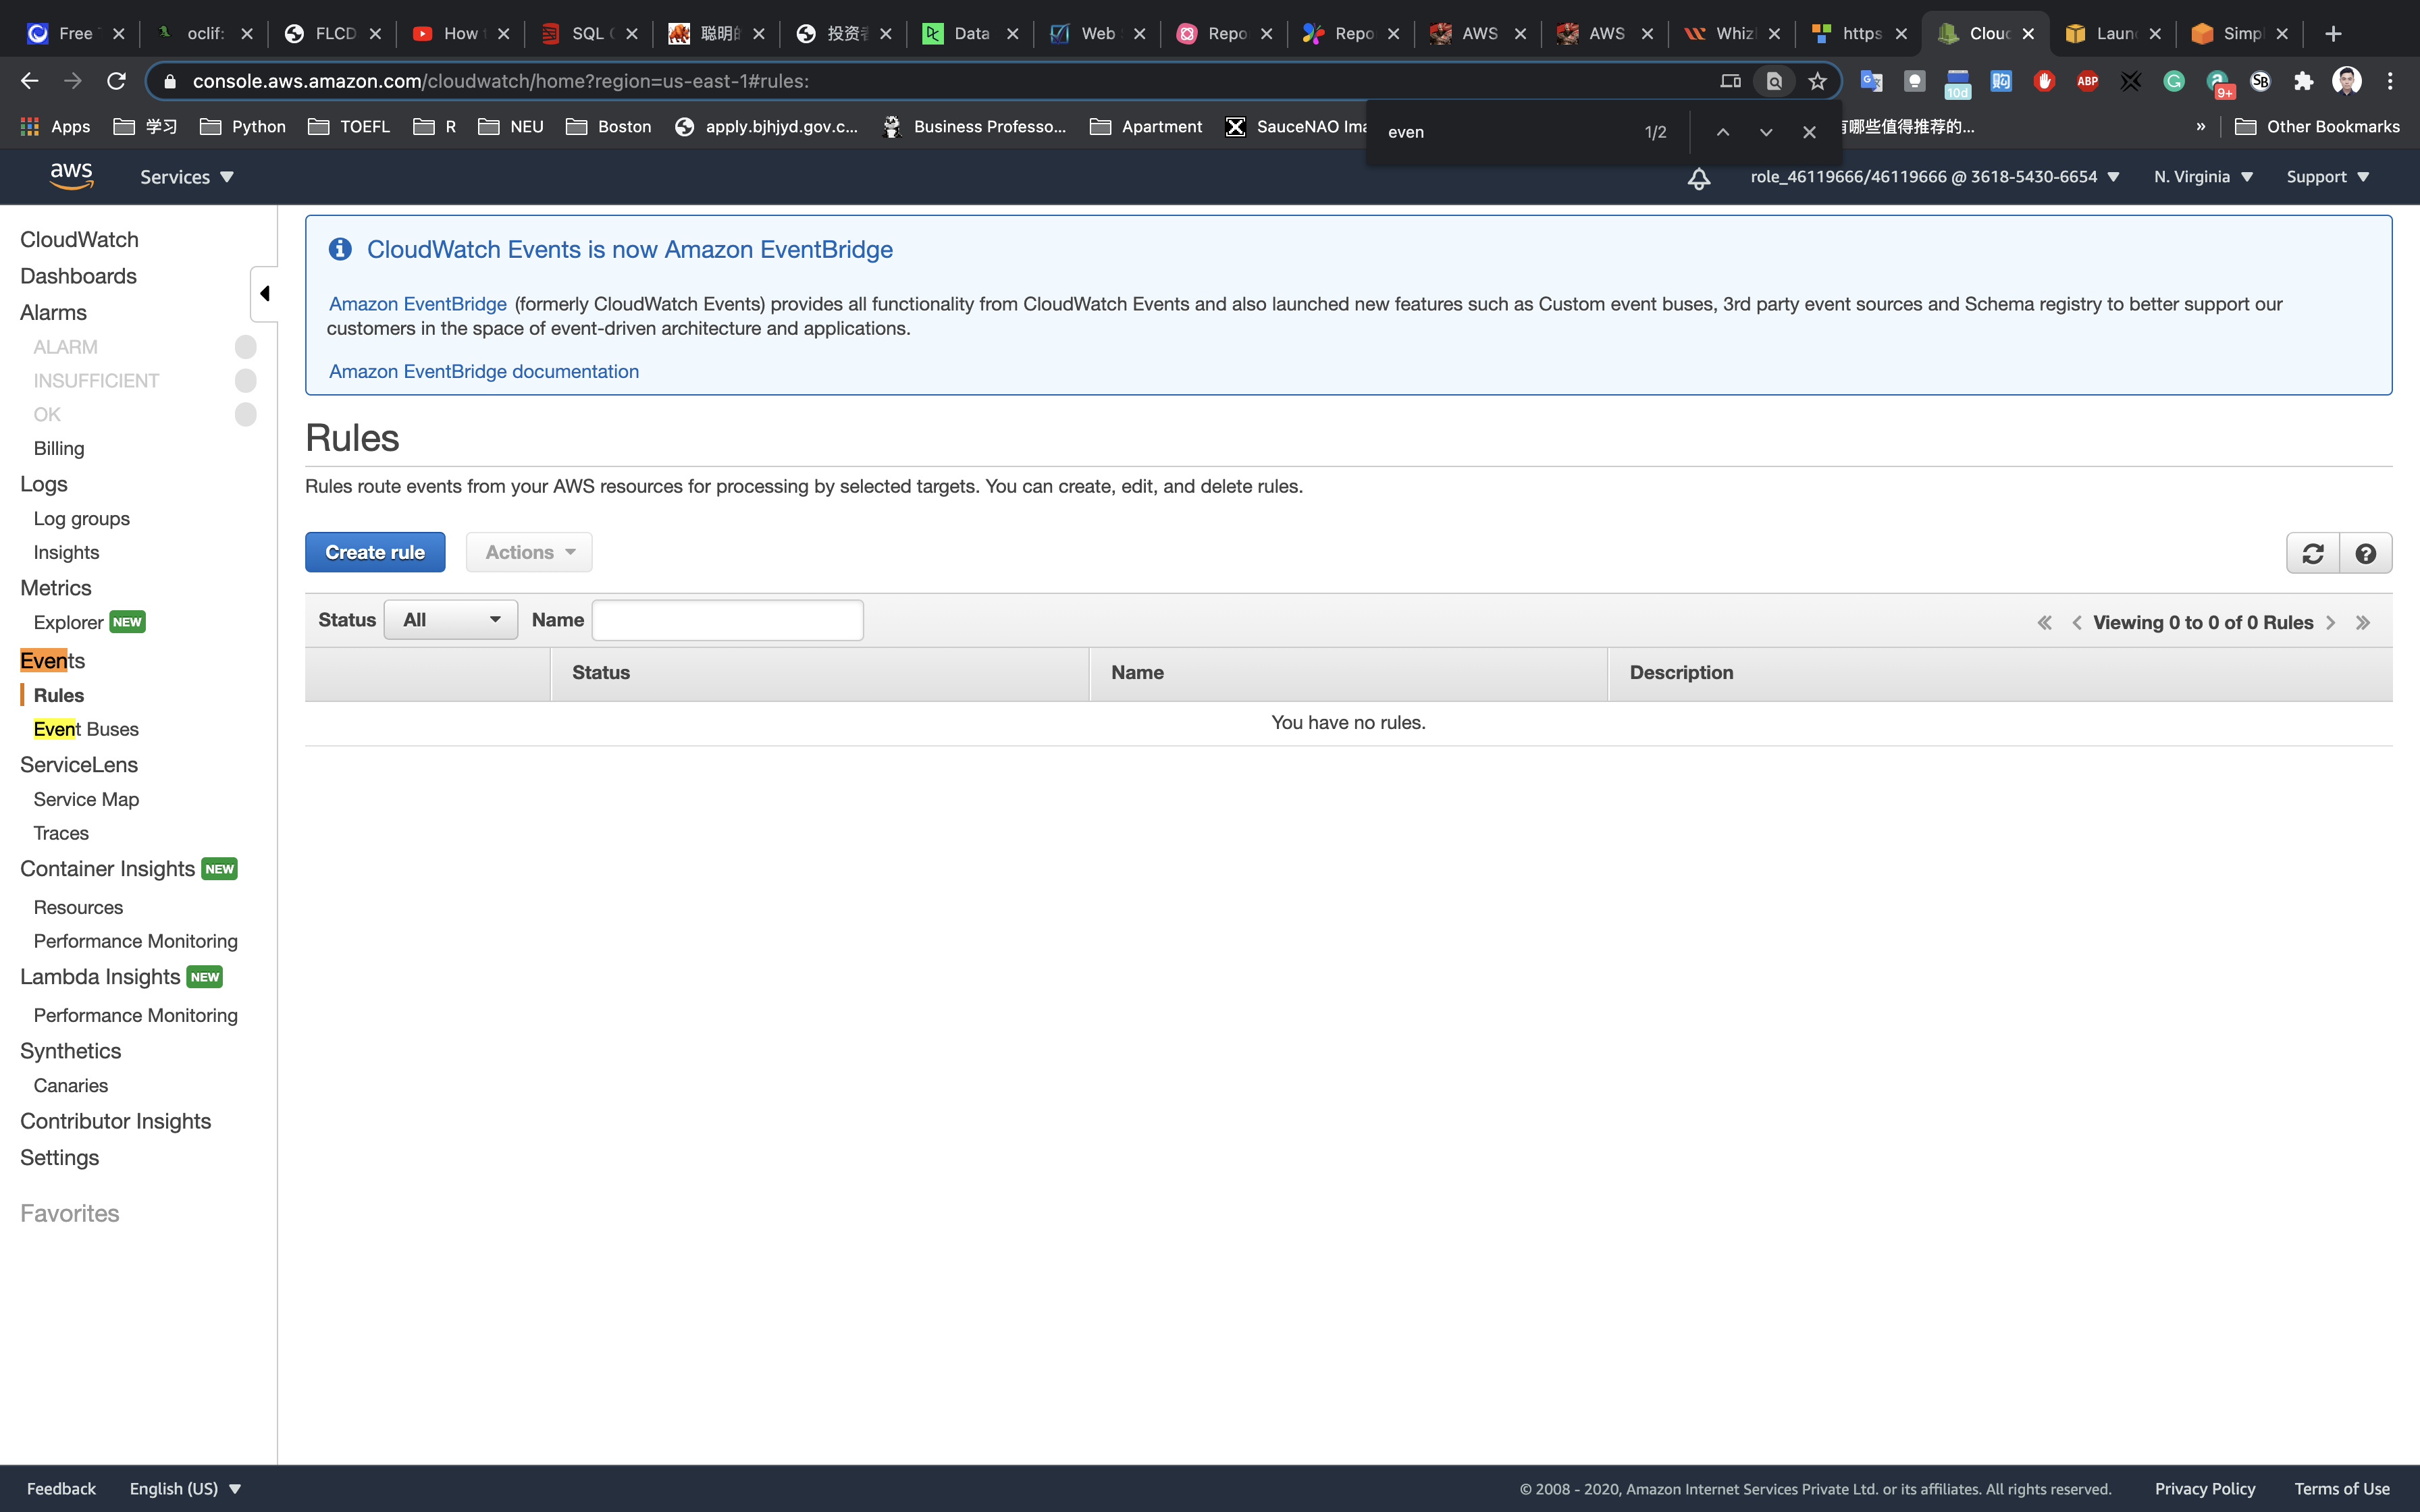
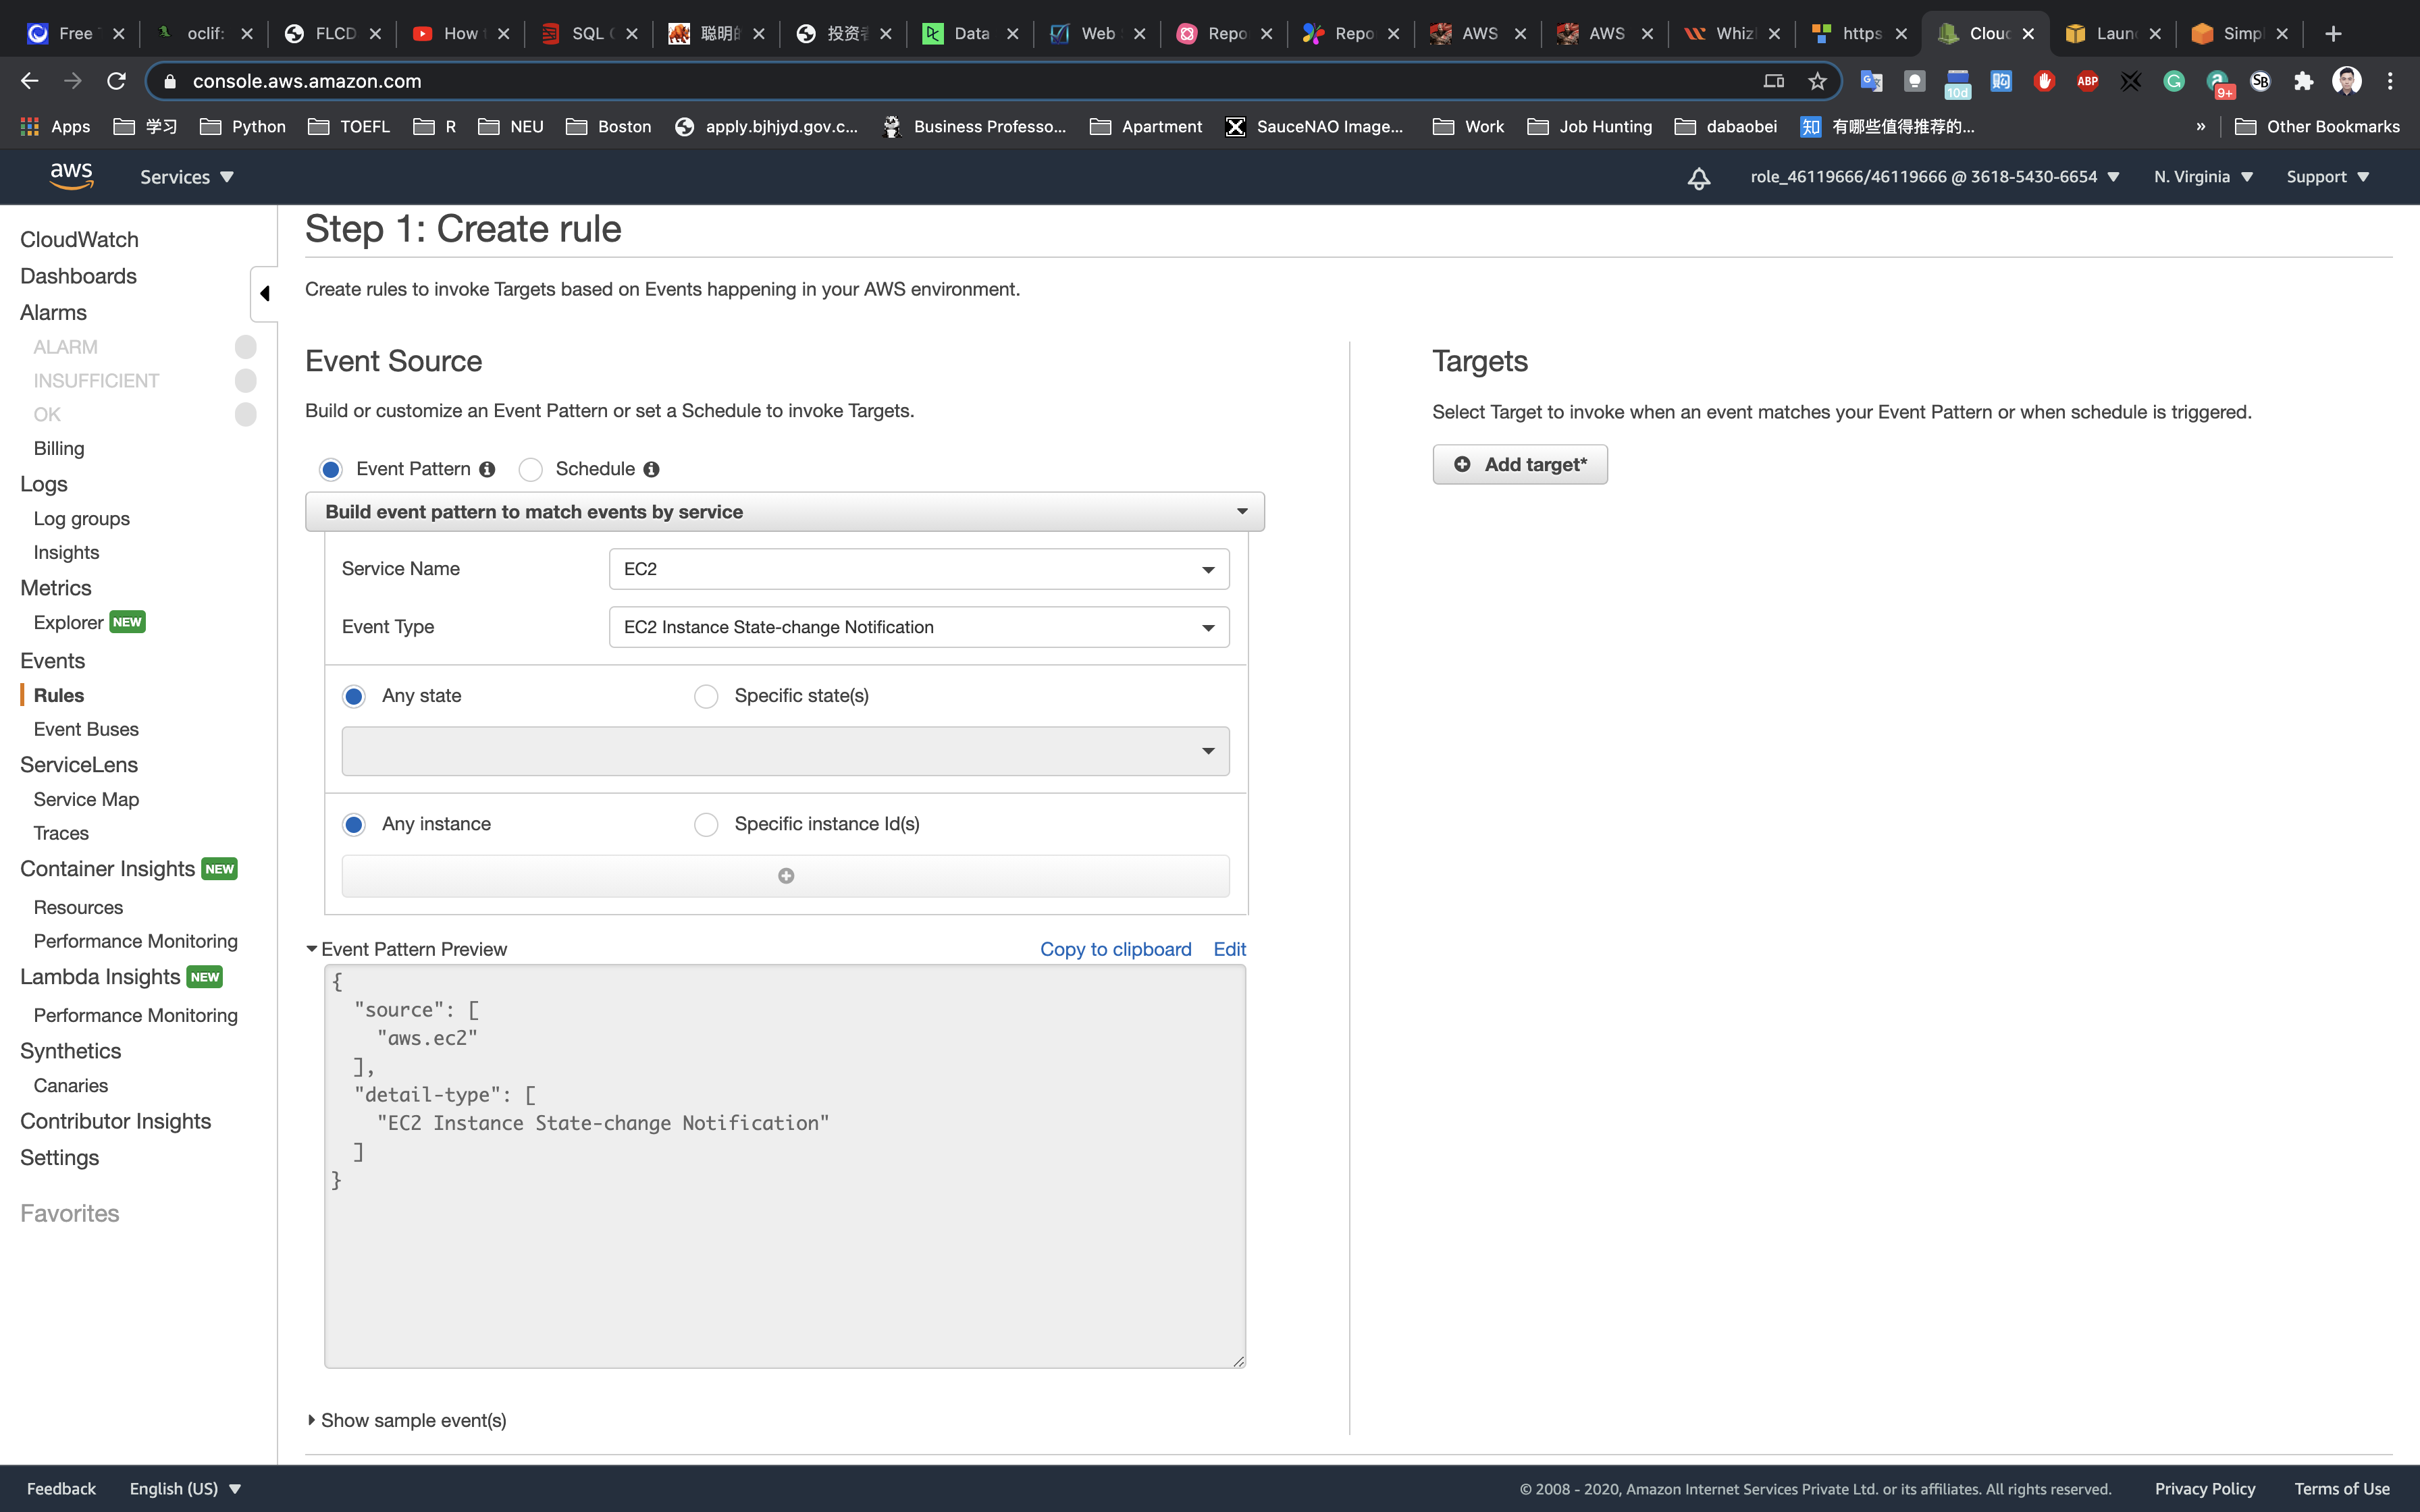
In Step1: Create Rule Page,
- Under Event Source:
- Choose Event Pattern
- Service Name: Select
EC2 - Event Type: Choose
EC2 Instance State-change Notification - No other changes required in this section.
Under Targets:
- Click on
Add target. - Select SNS Topic from the target dropdown
- Topic:
MyServerMonitor
Click on Configure details.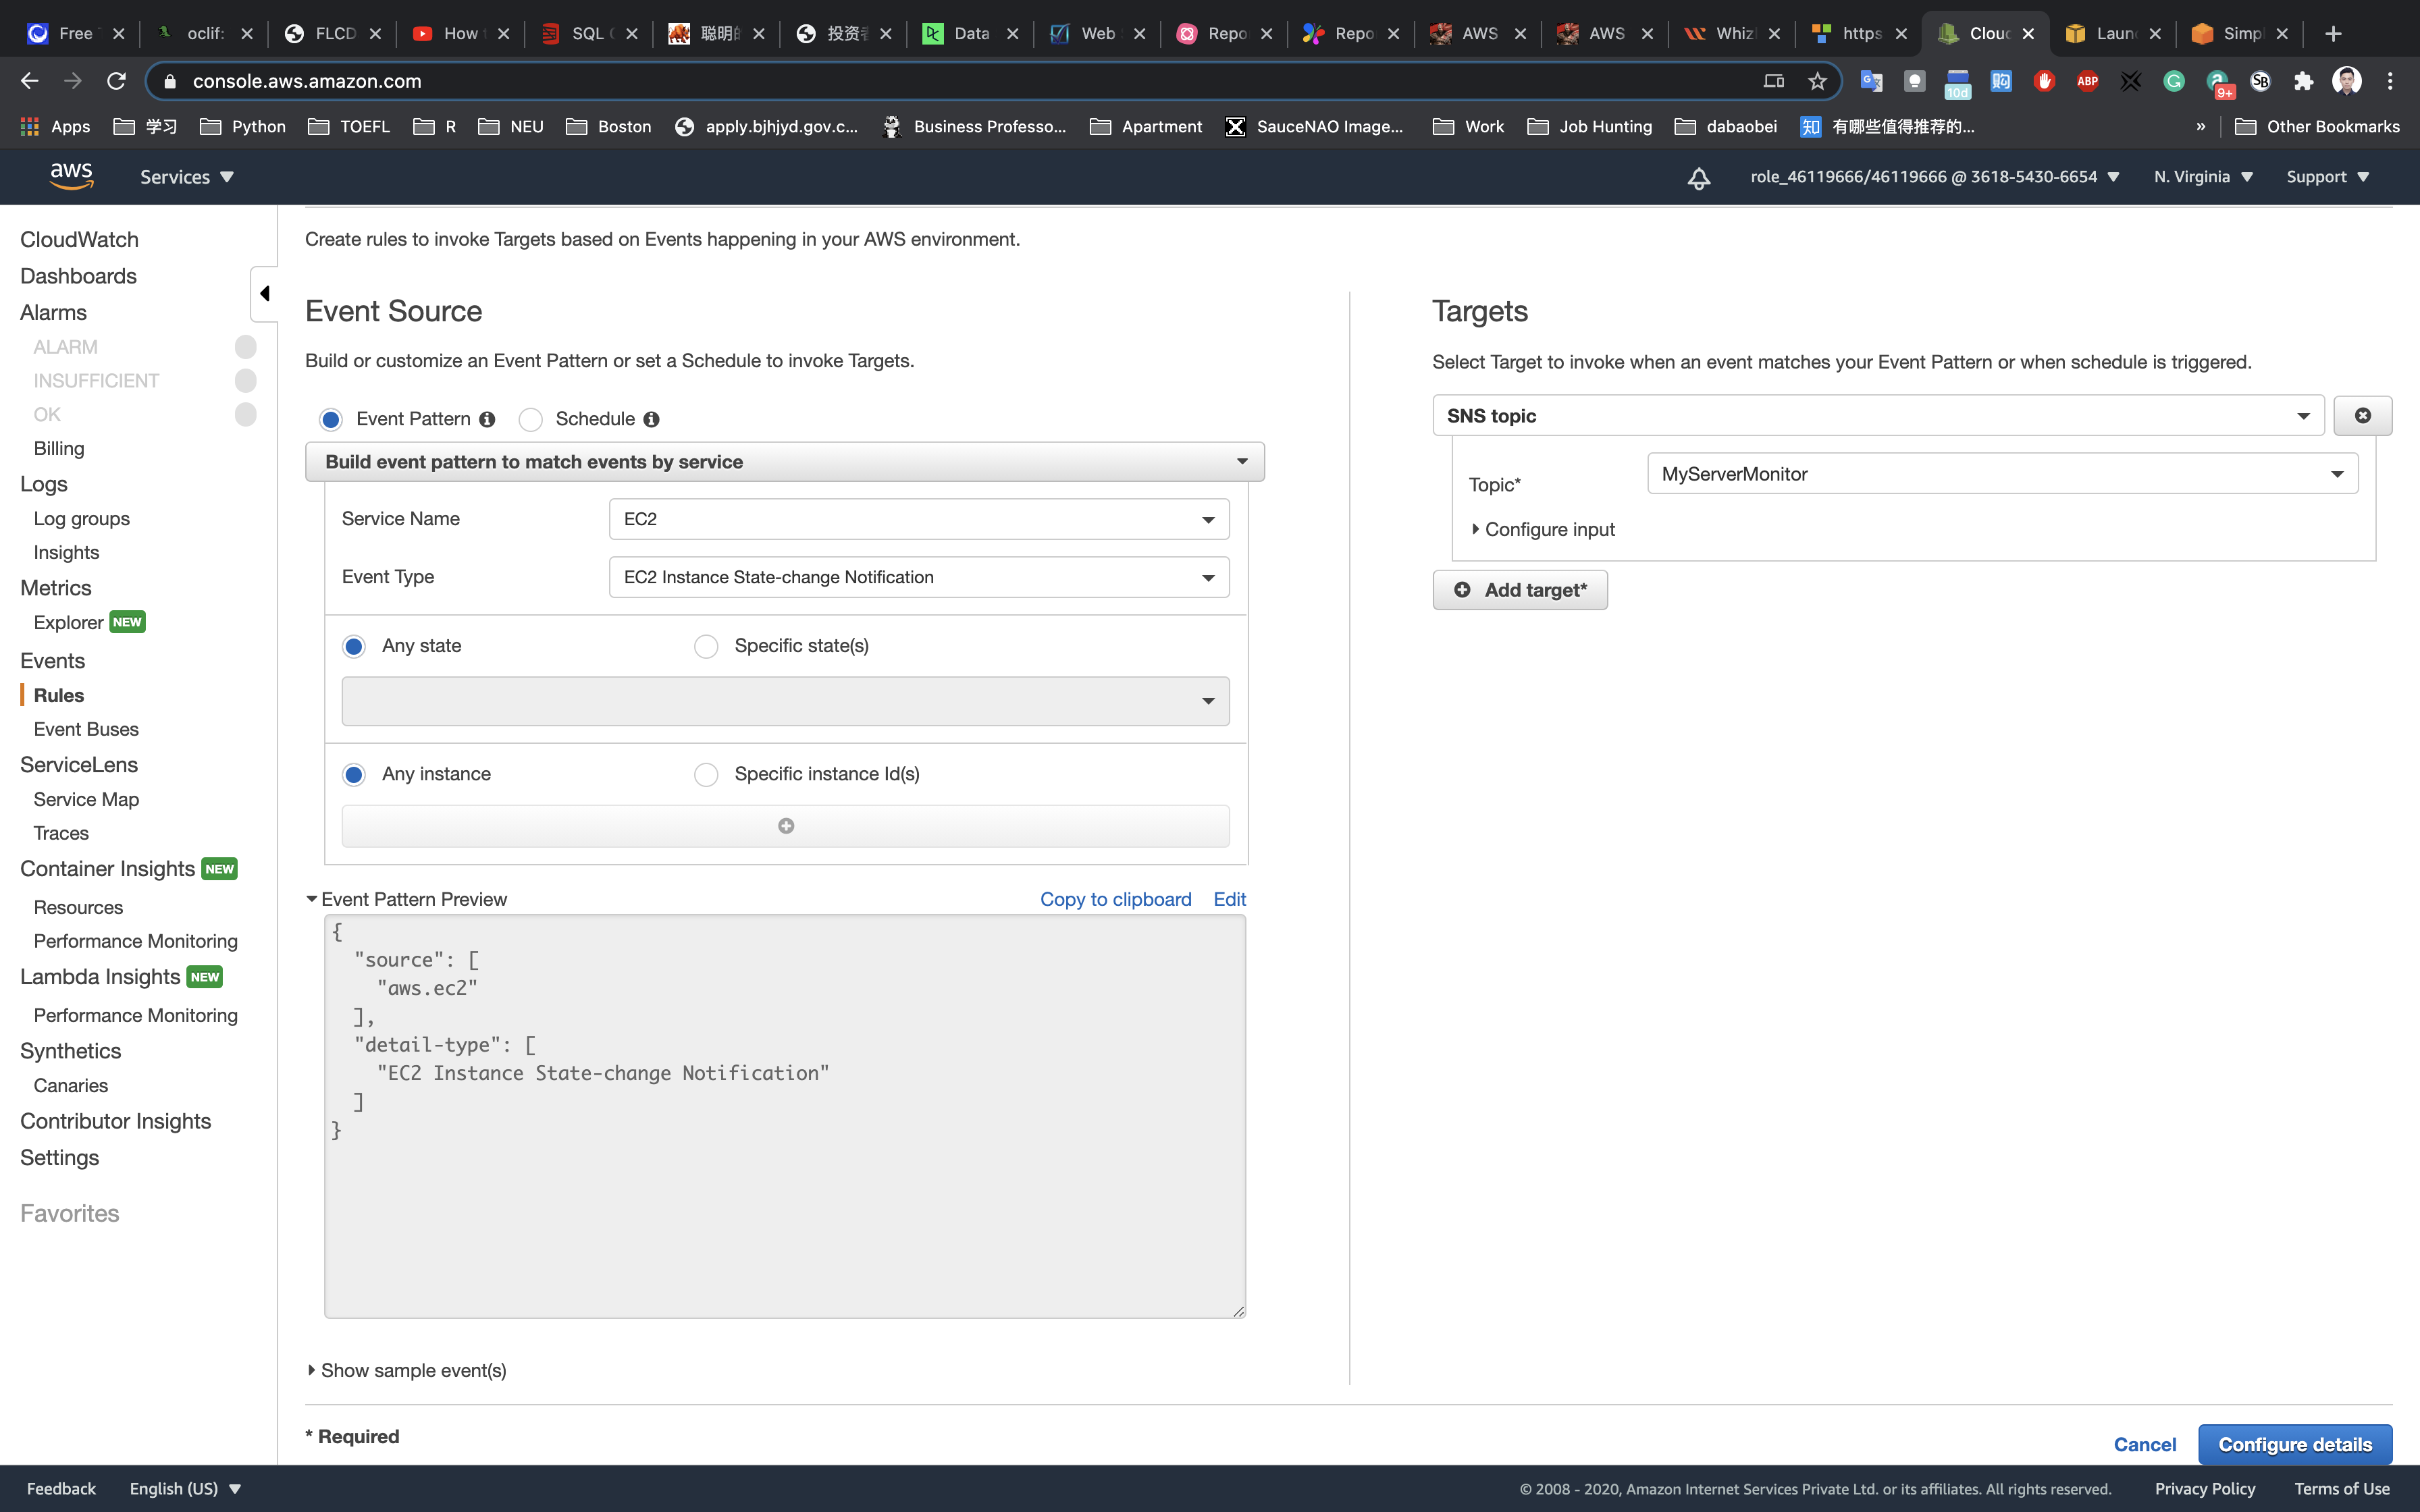
In Step 2: Configure rule details Page. Under Rule definition:
- Name:
MyEC2StateChangeEvent - Description:
MyEC2StateChangeEvent - State: check
Enable(default)
Click on Create rule.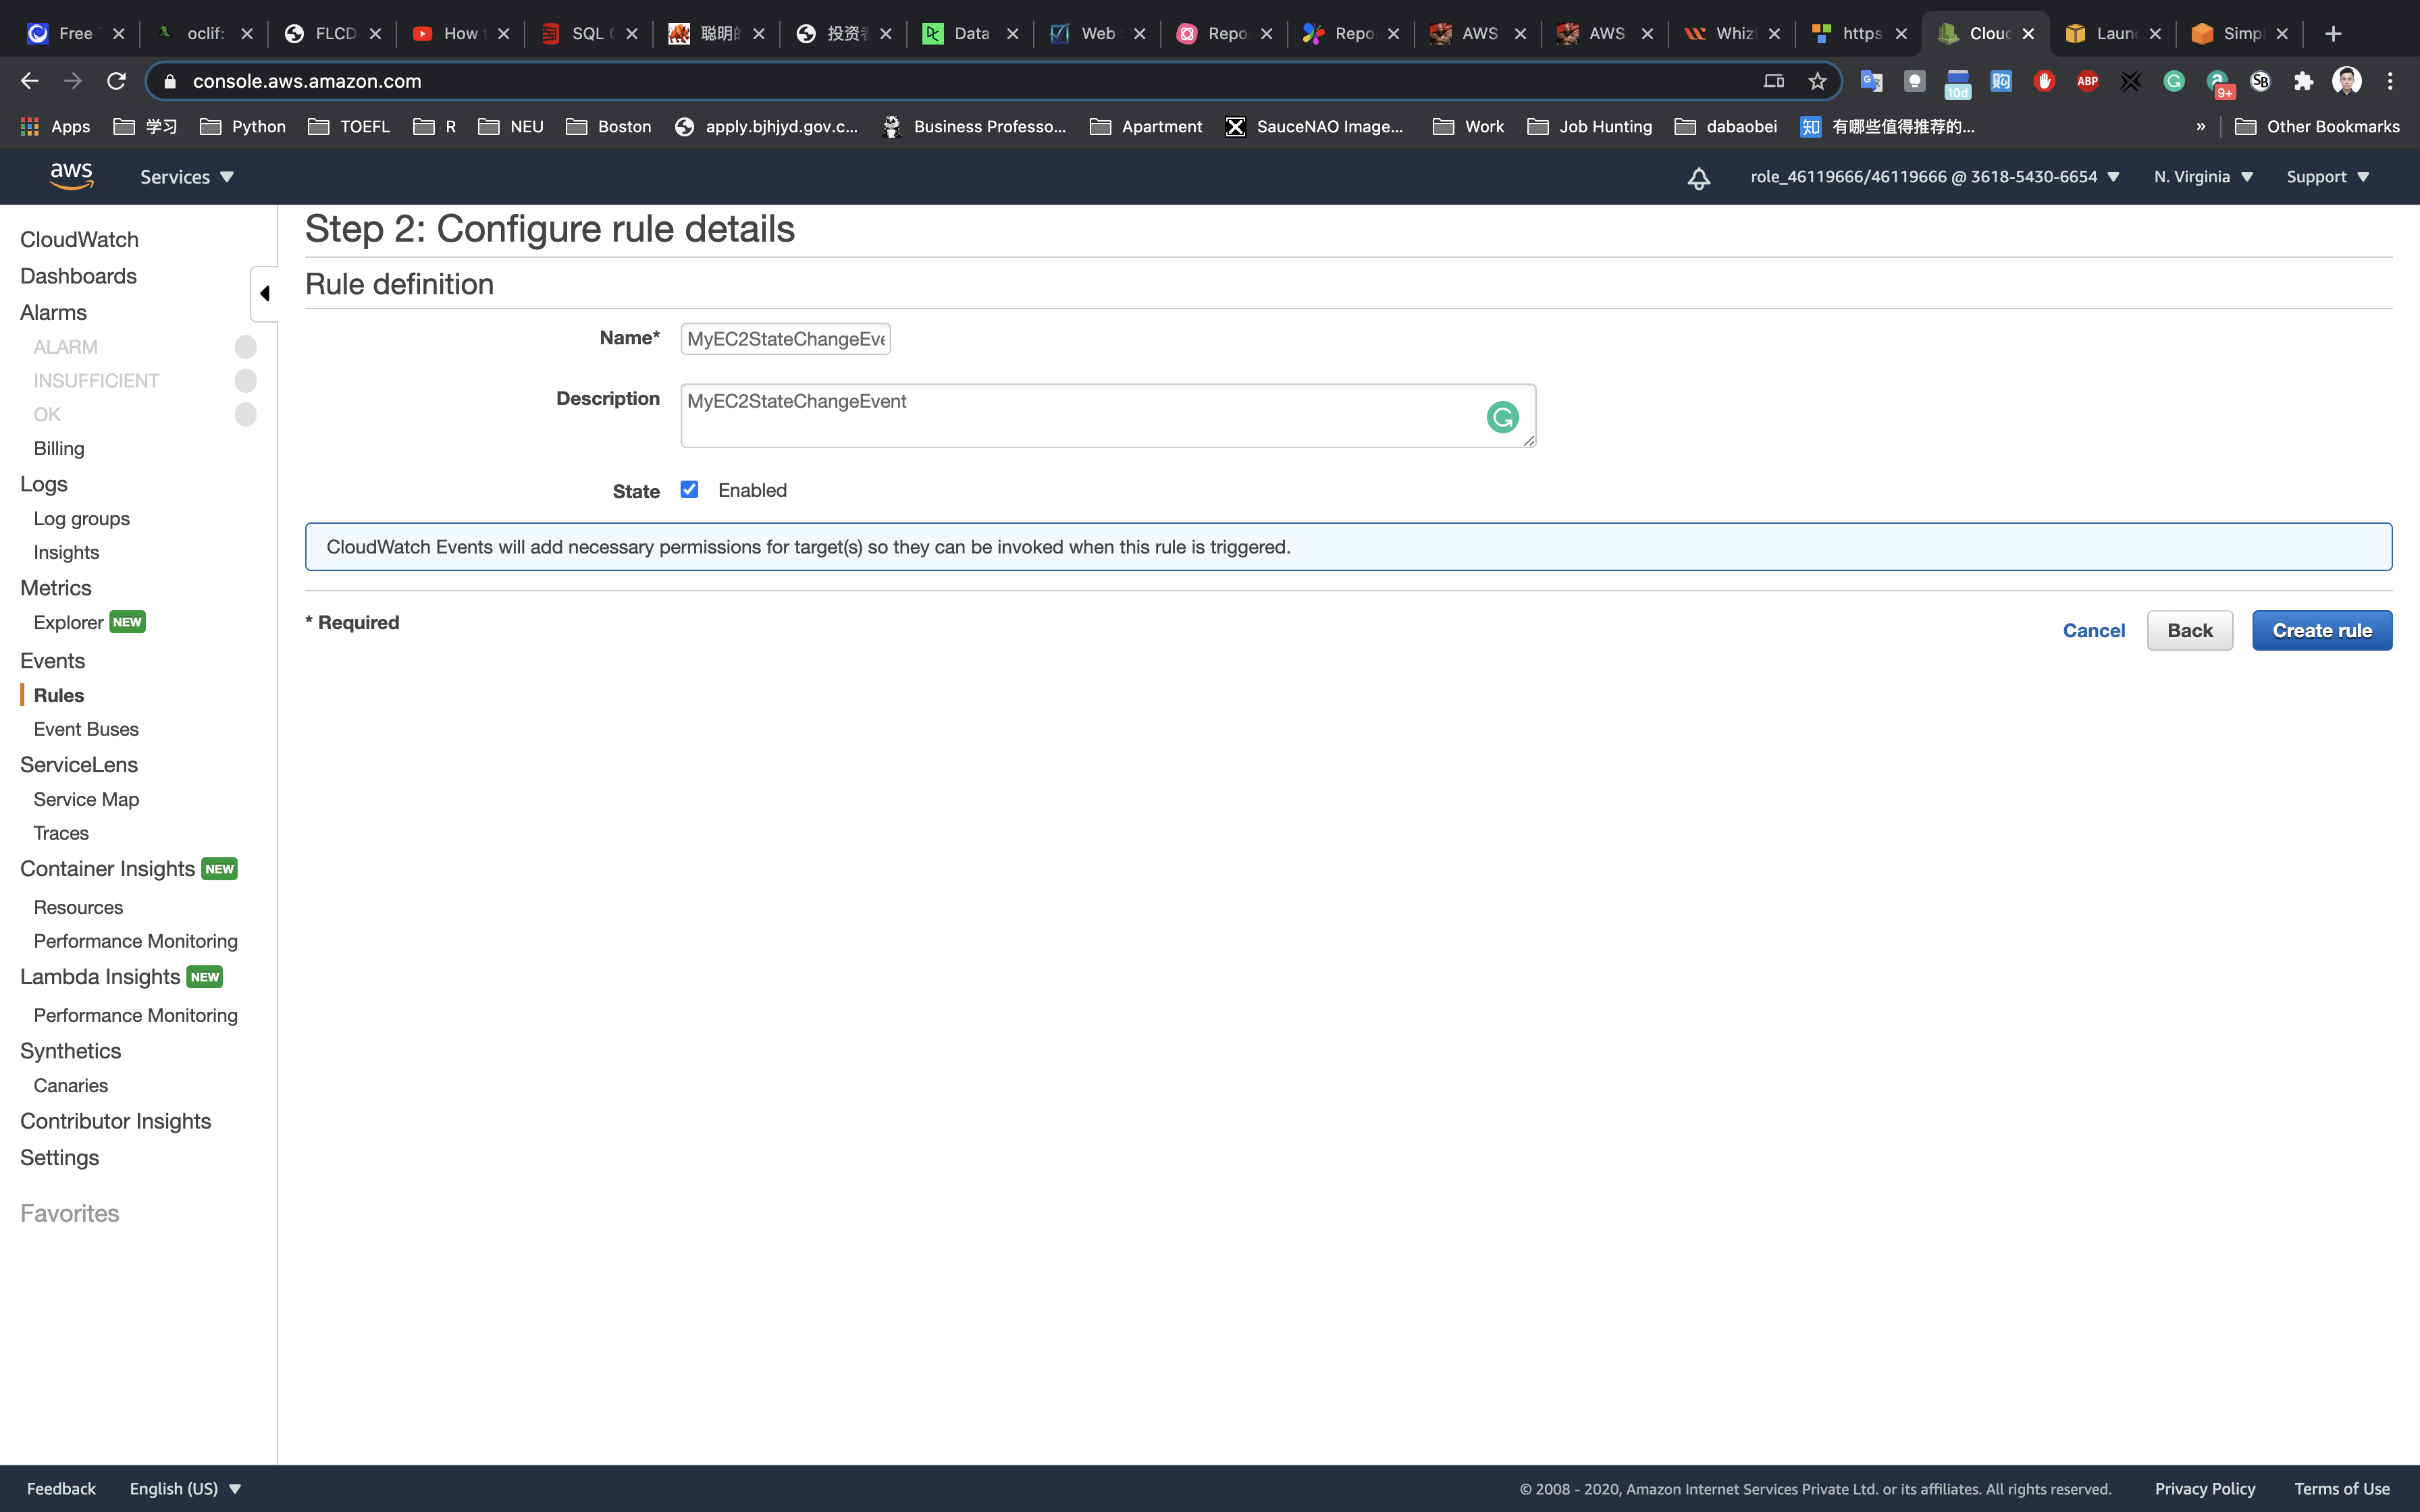
Now every time the EC2 Server (MyEC2Server) is stopped or started up, an email notification is sent to the email address configured in the SNS Subscription.
Validation Test
Test CloudWatch Event
Services -> EC2 -> Instances
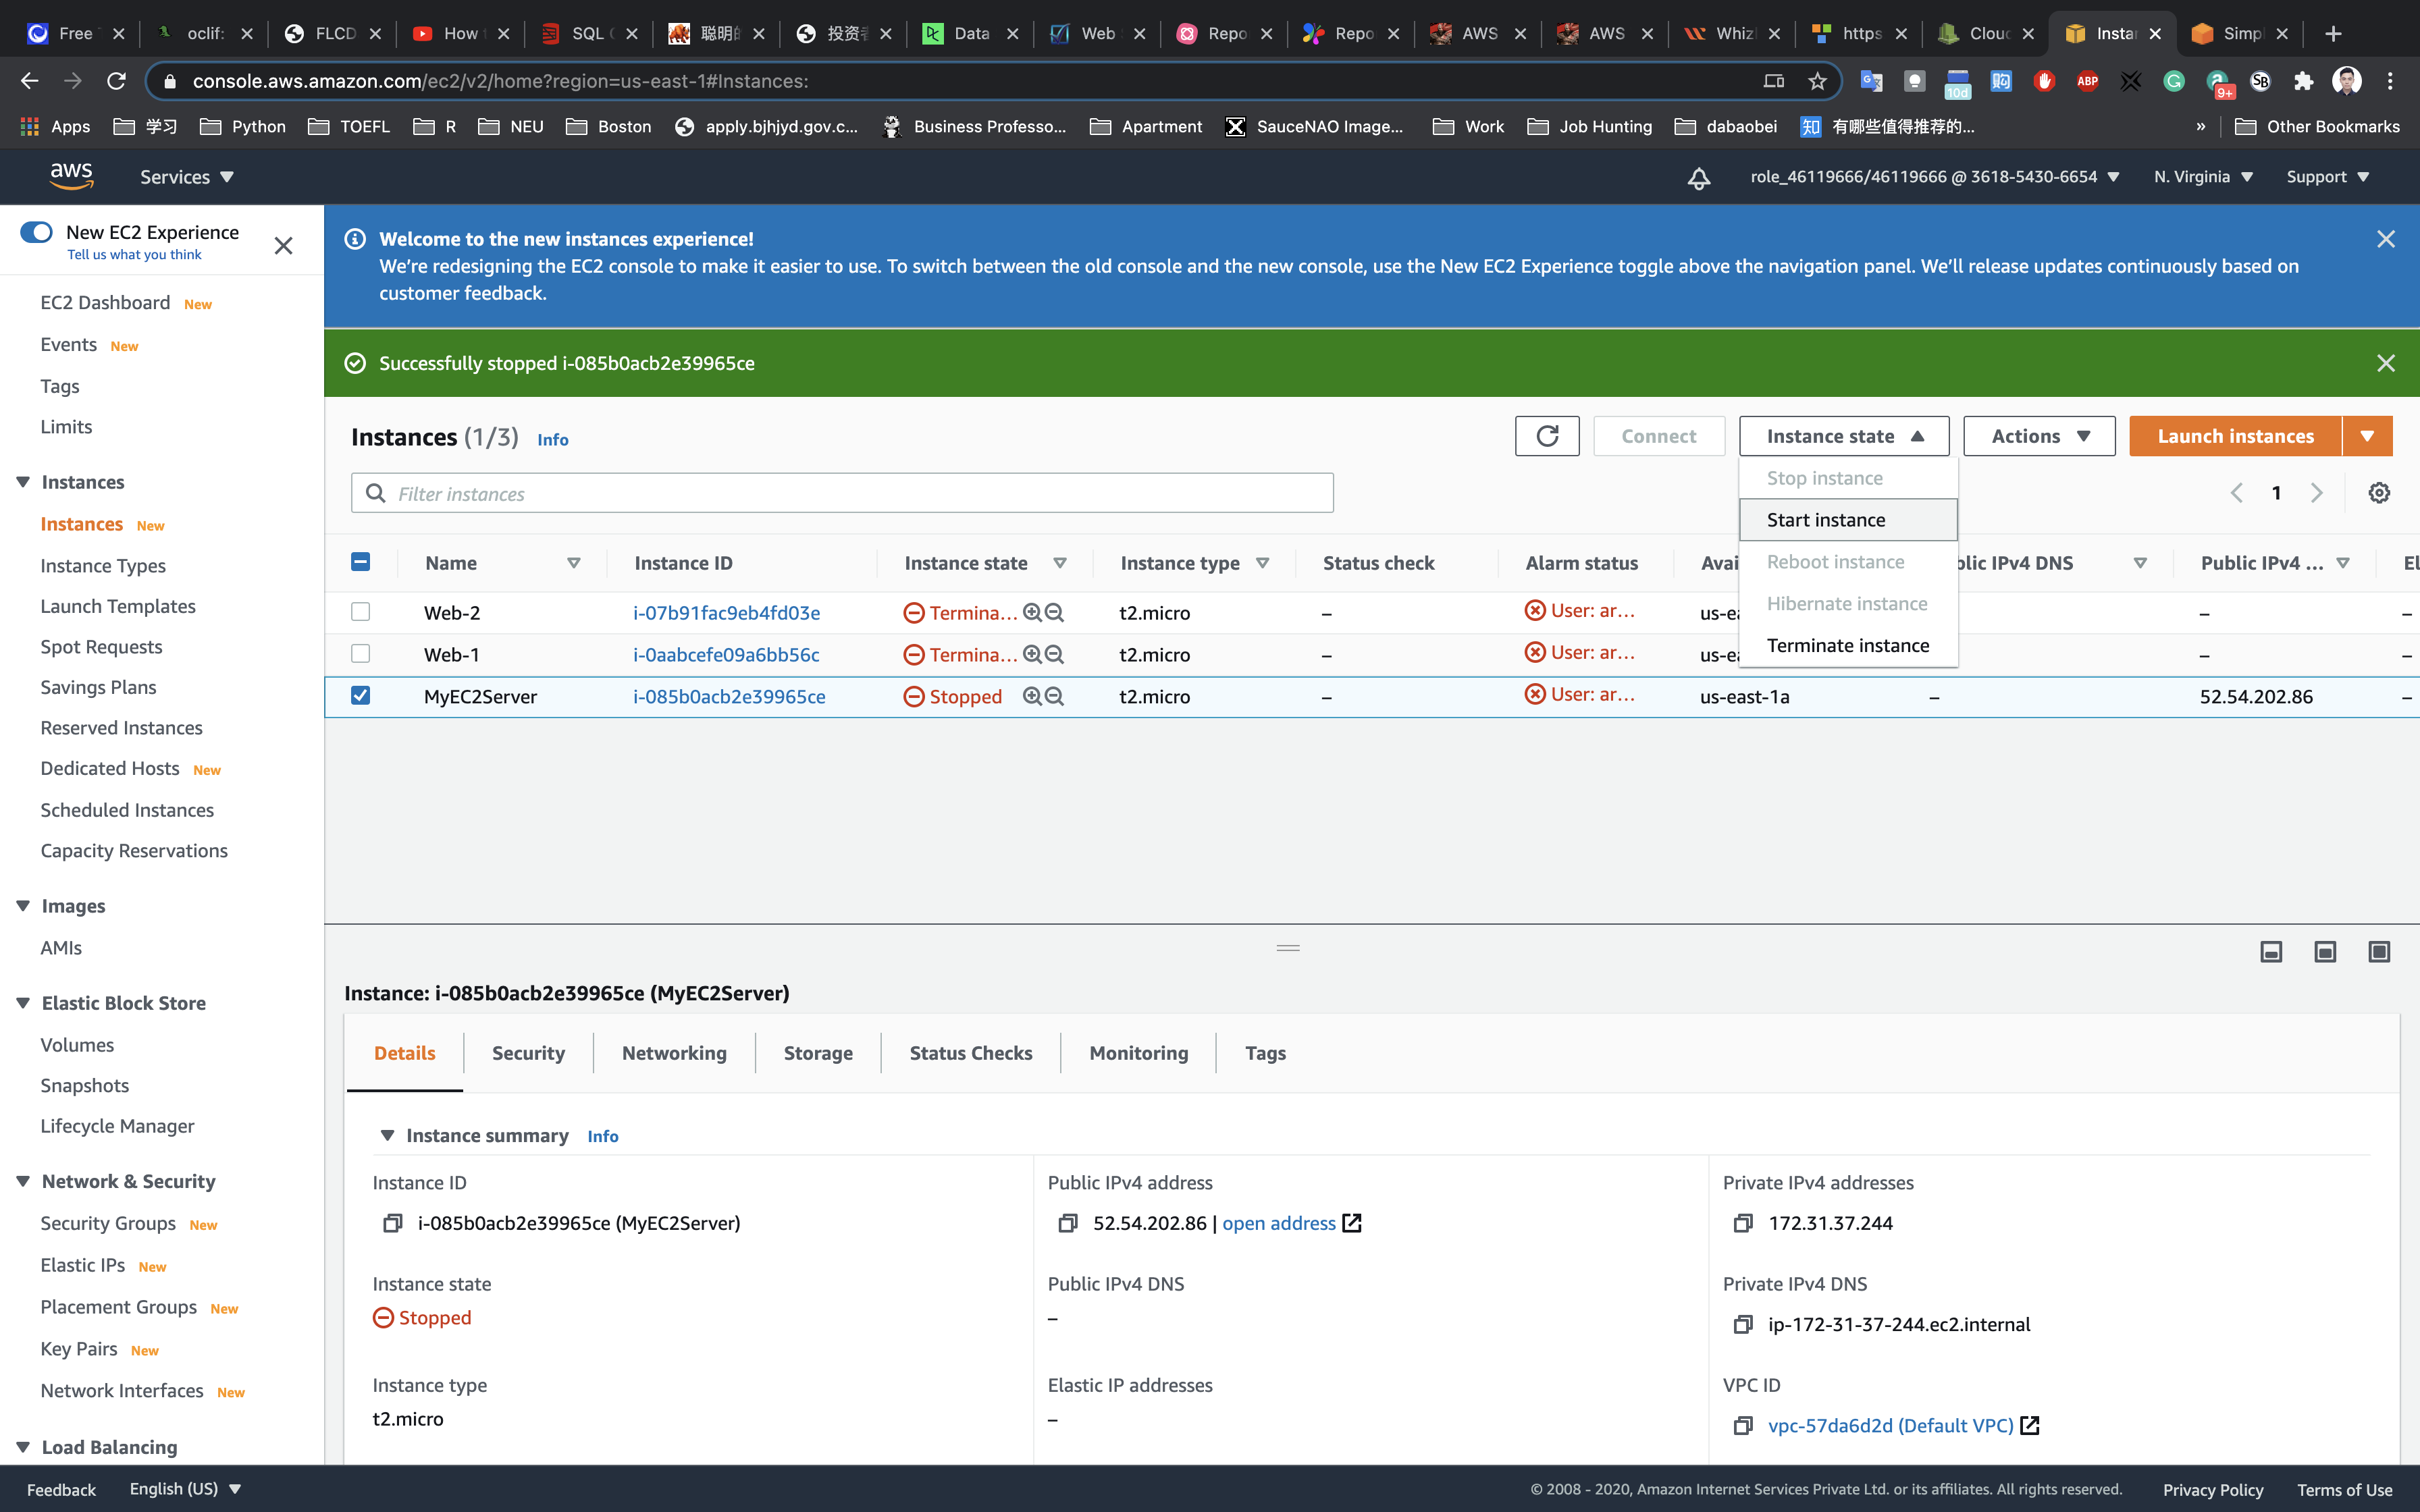
Select the MyEC2Server → Click on Actions → Instance State → Click on Stop.
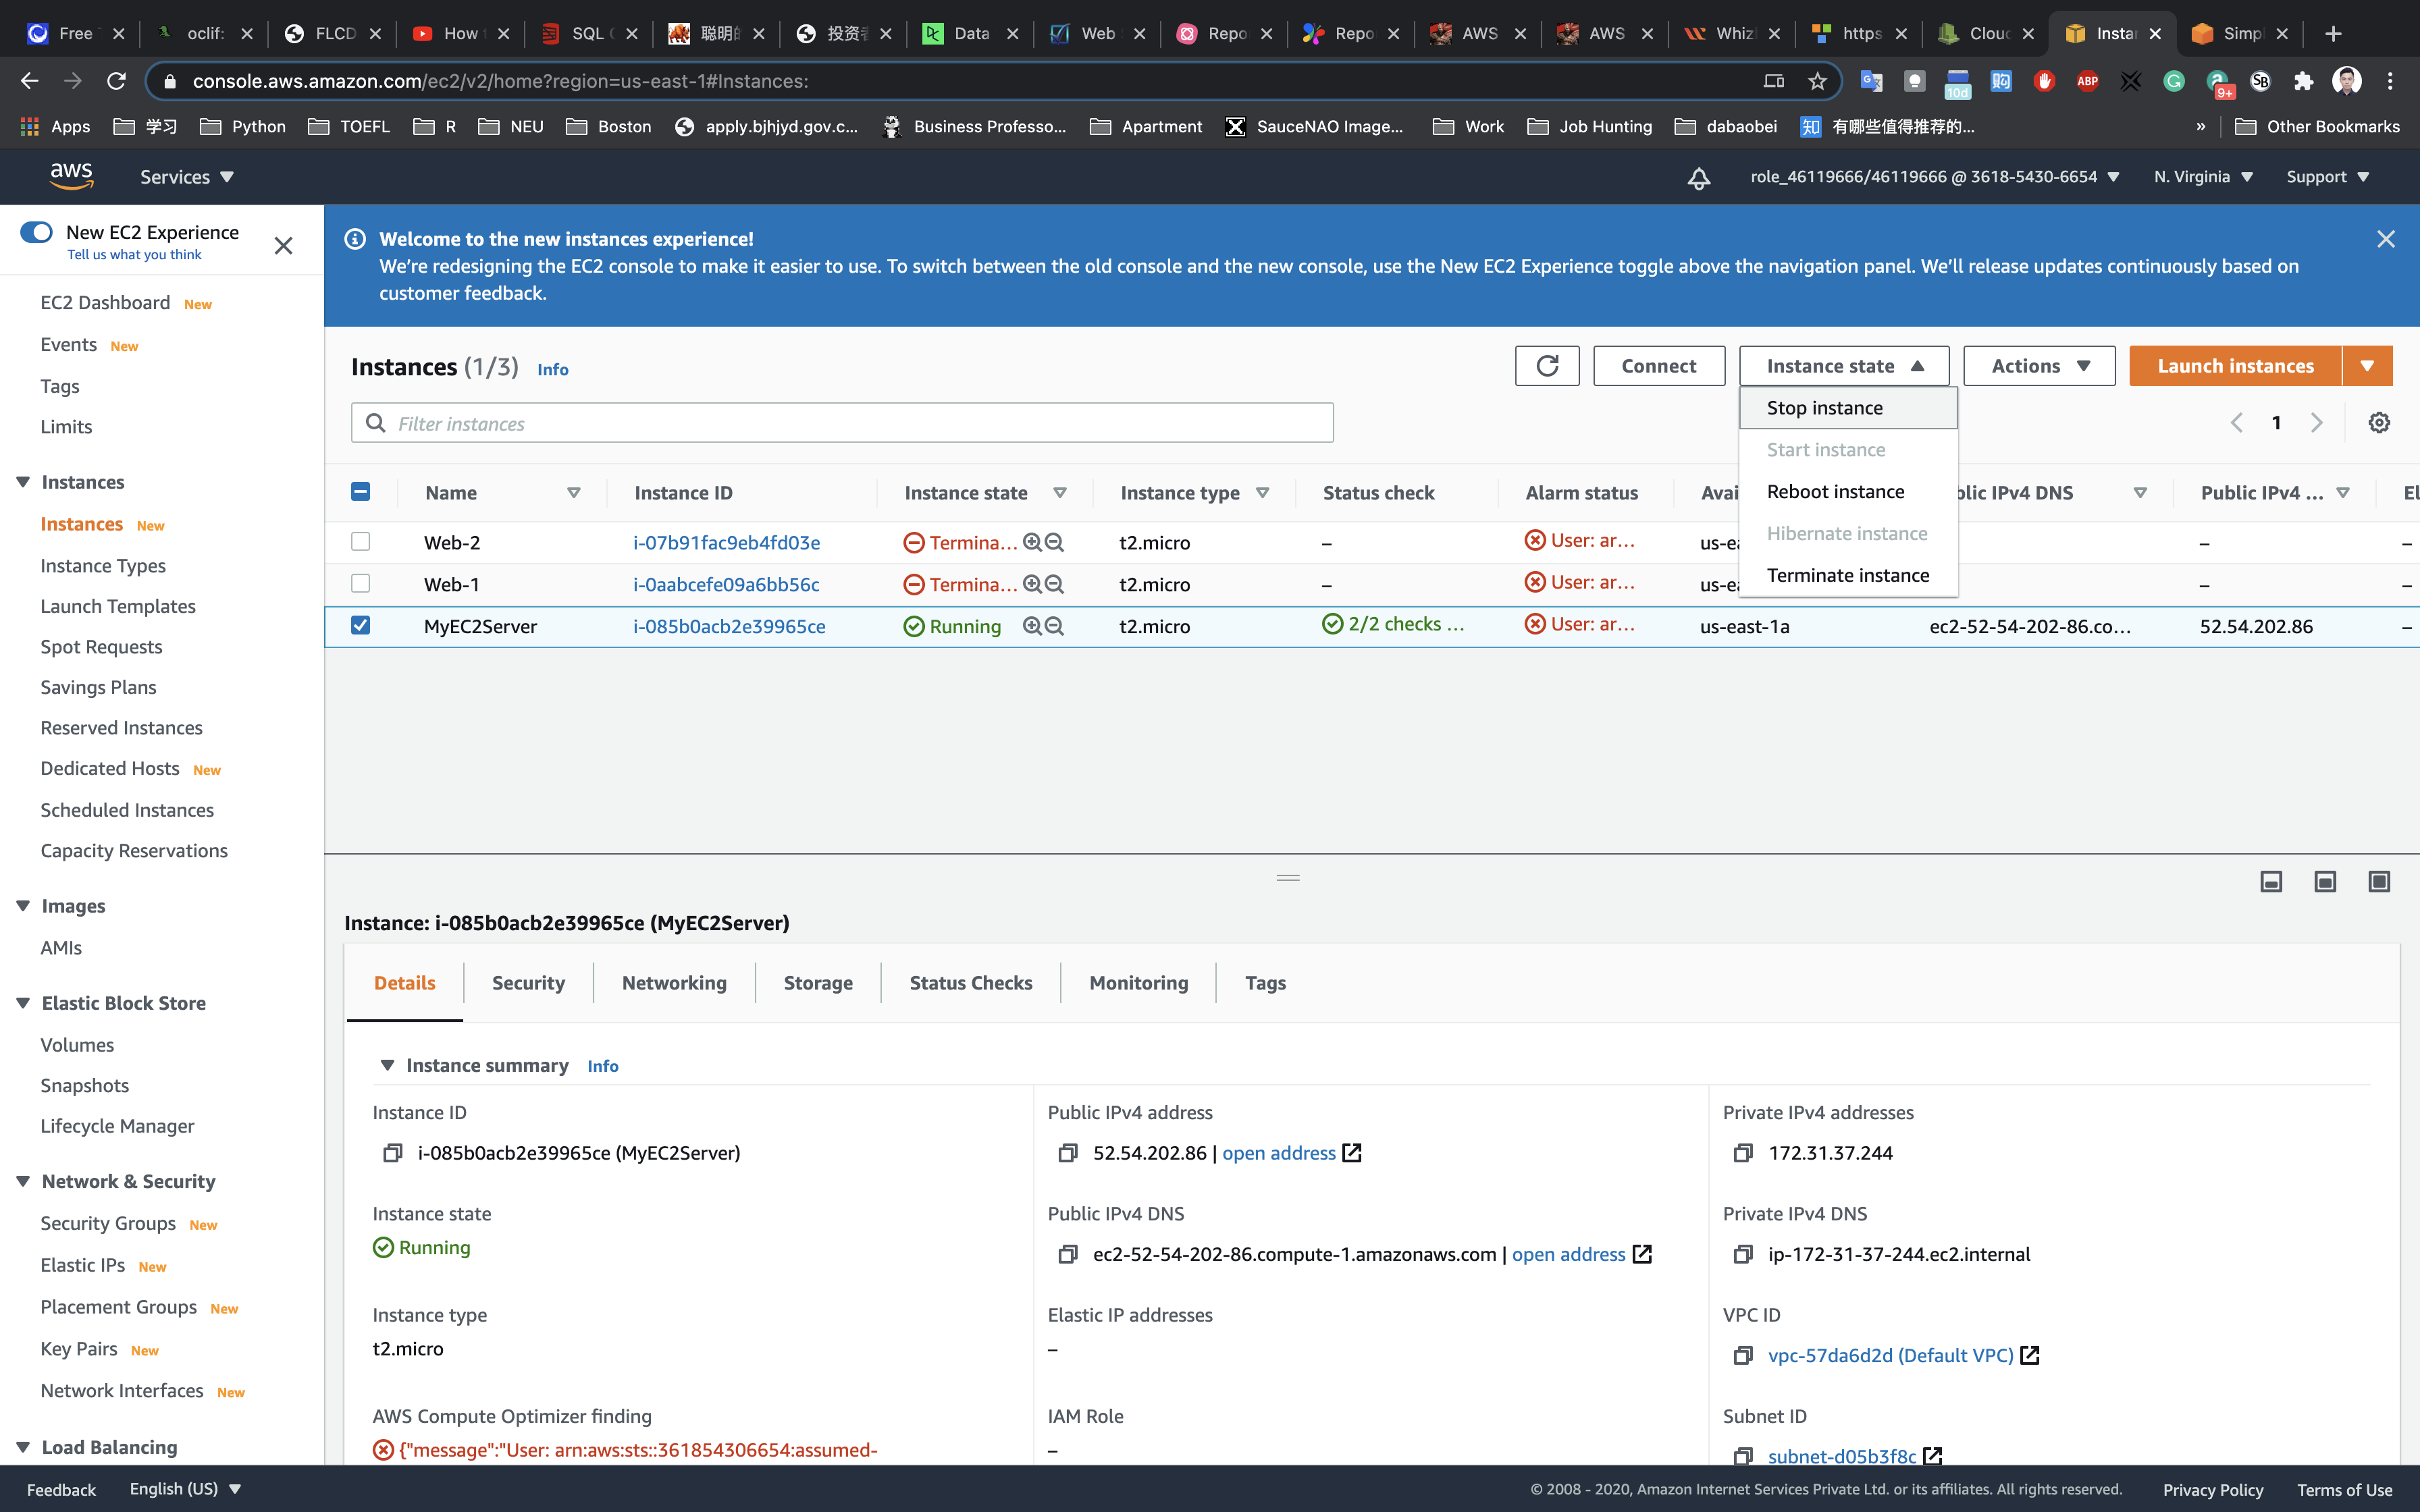
Click on Stop in the pop up box.
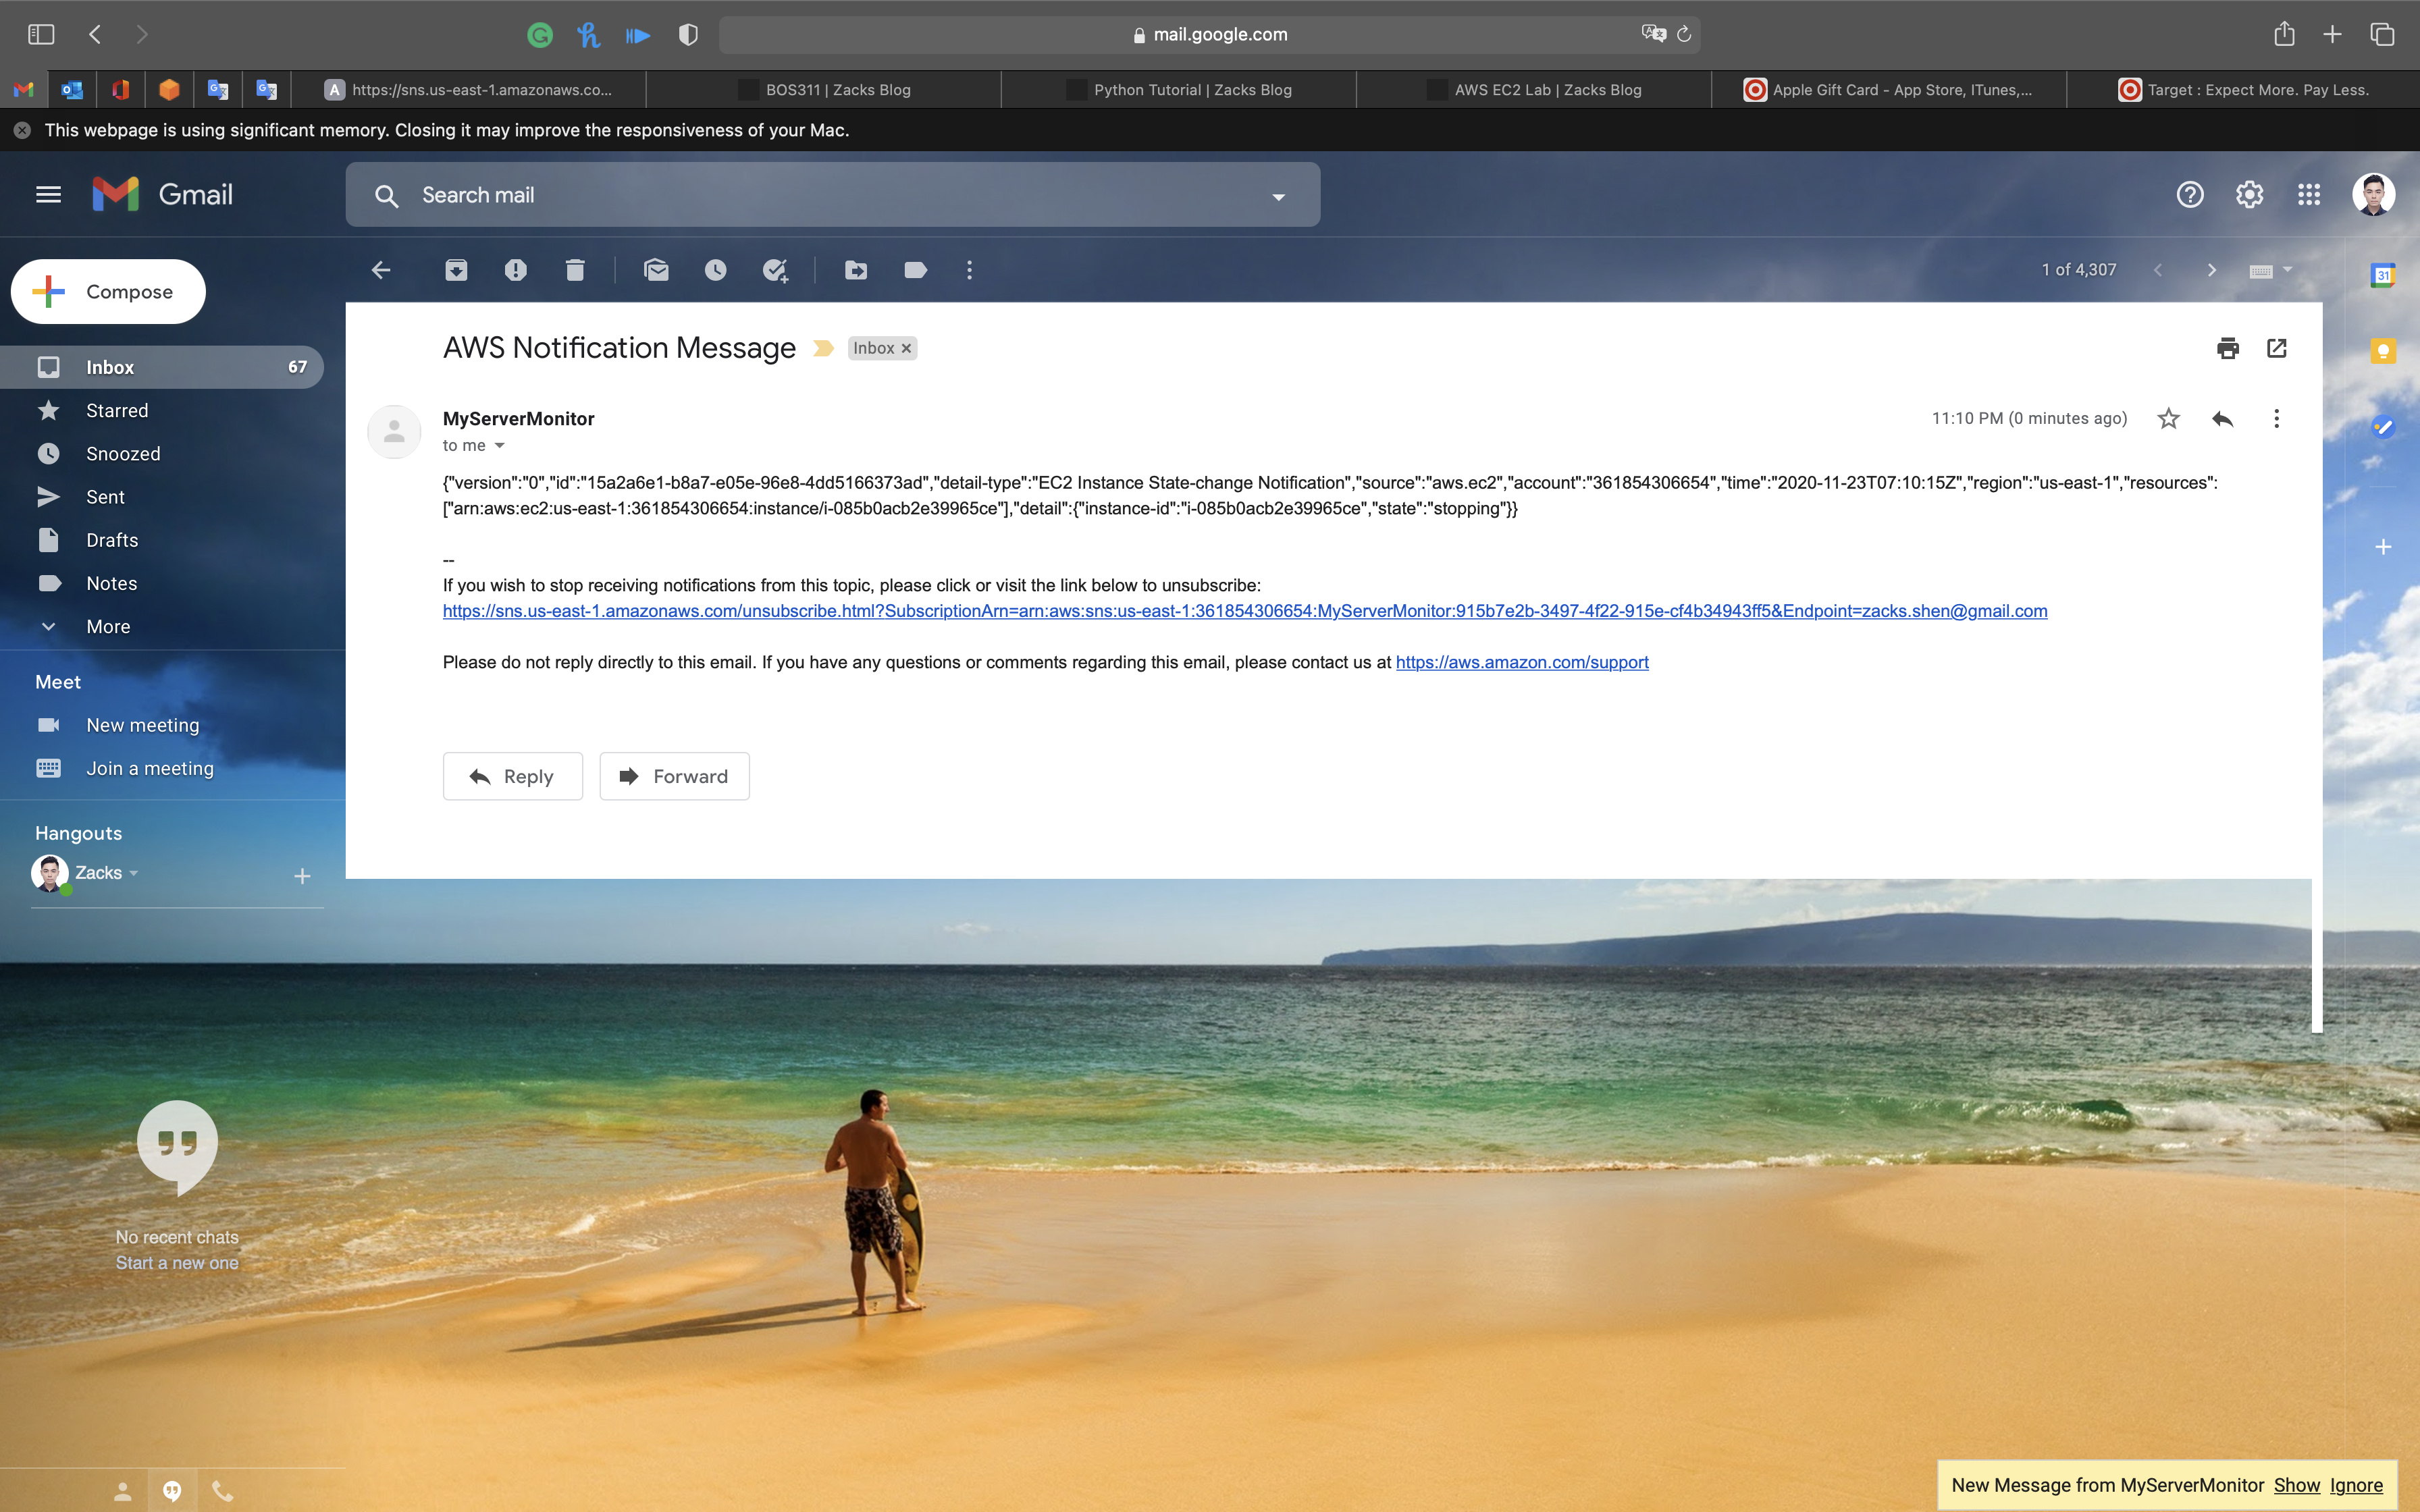
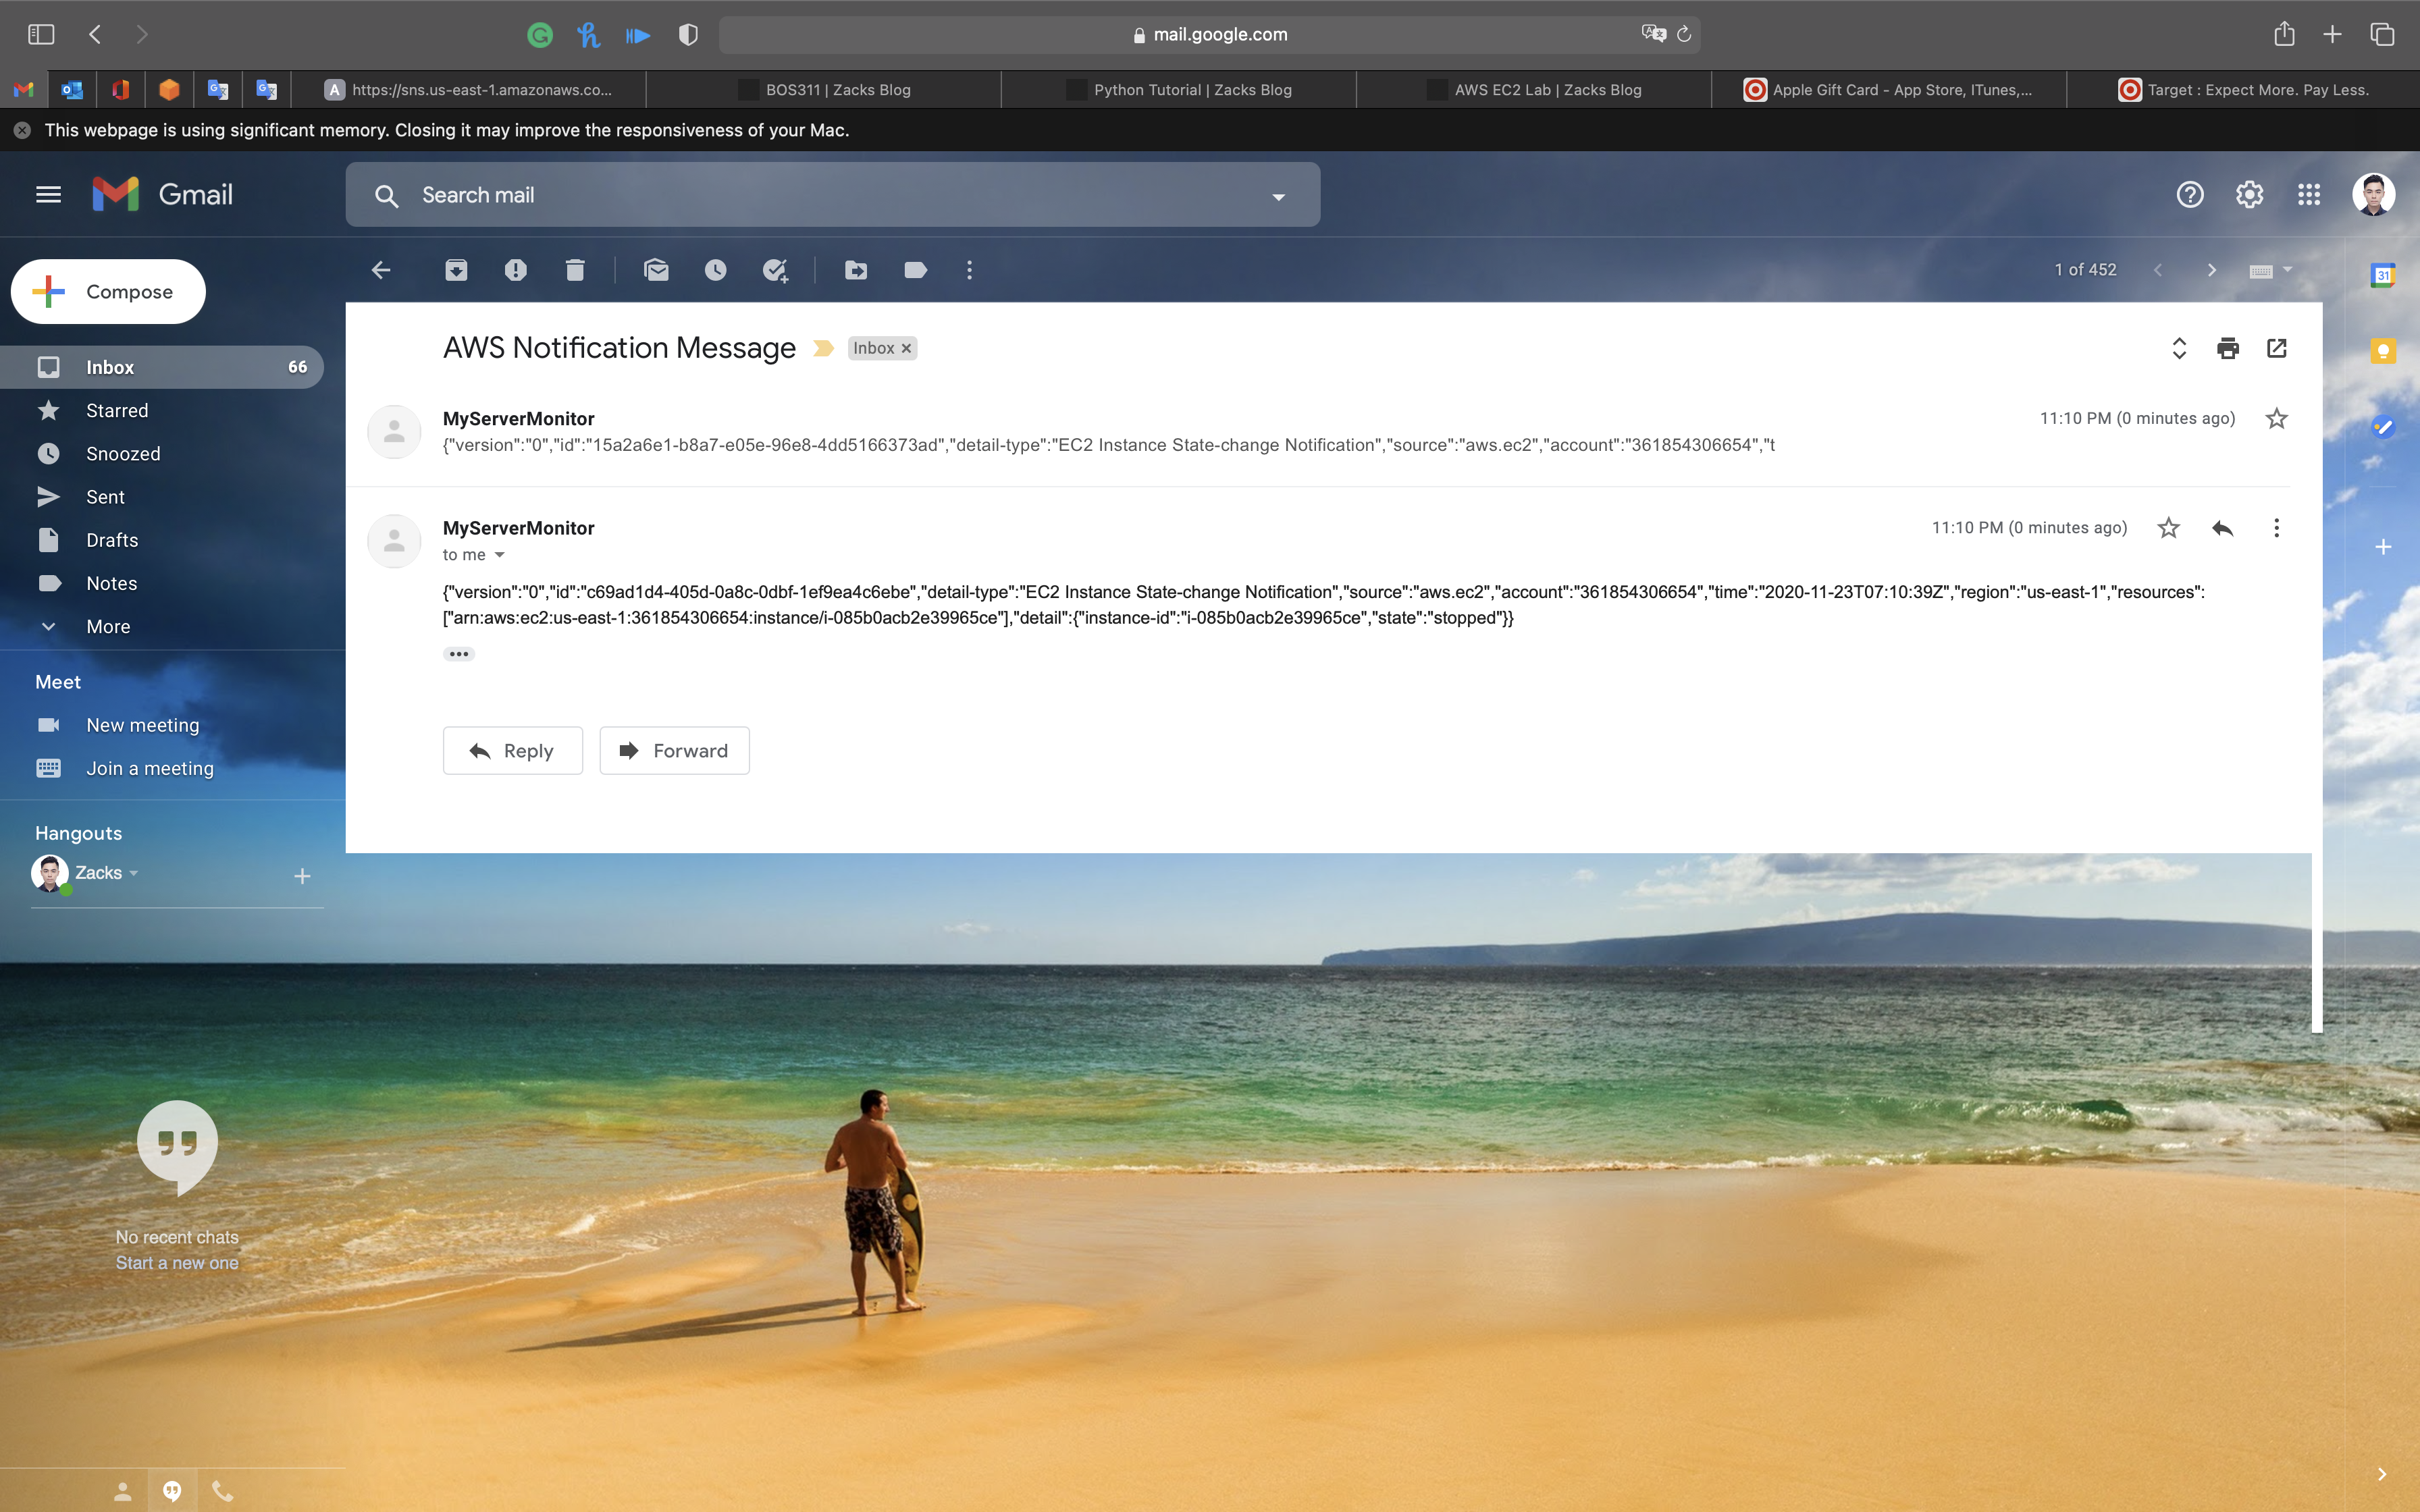
Go back to your email address. You should have received some email.
Two CloudWatch Event emails have been sent due to the MyEC2Server State changes. (stopping and stopped).
Navigate back to the EC2 Page and start the EC2 instance. You will receive another two emails for the state changes. (pending and running).
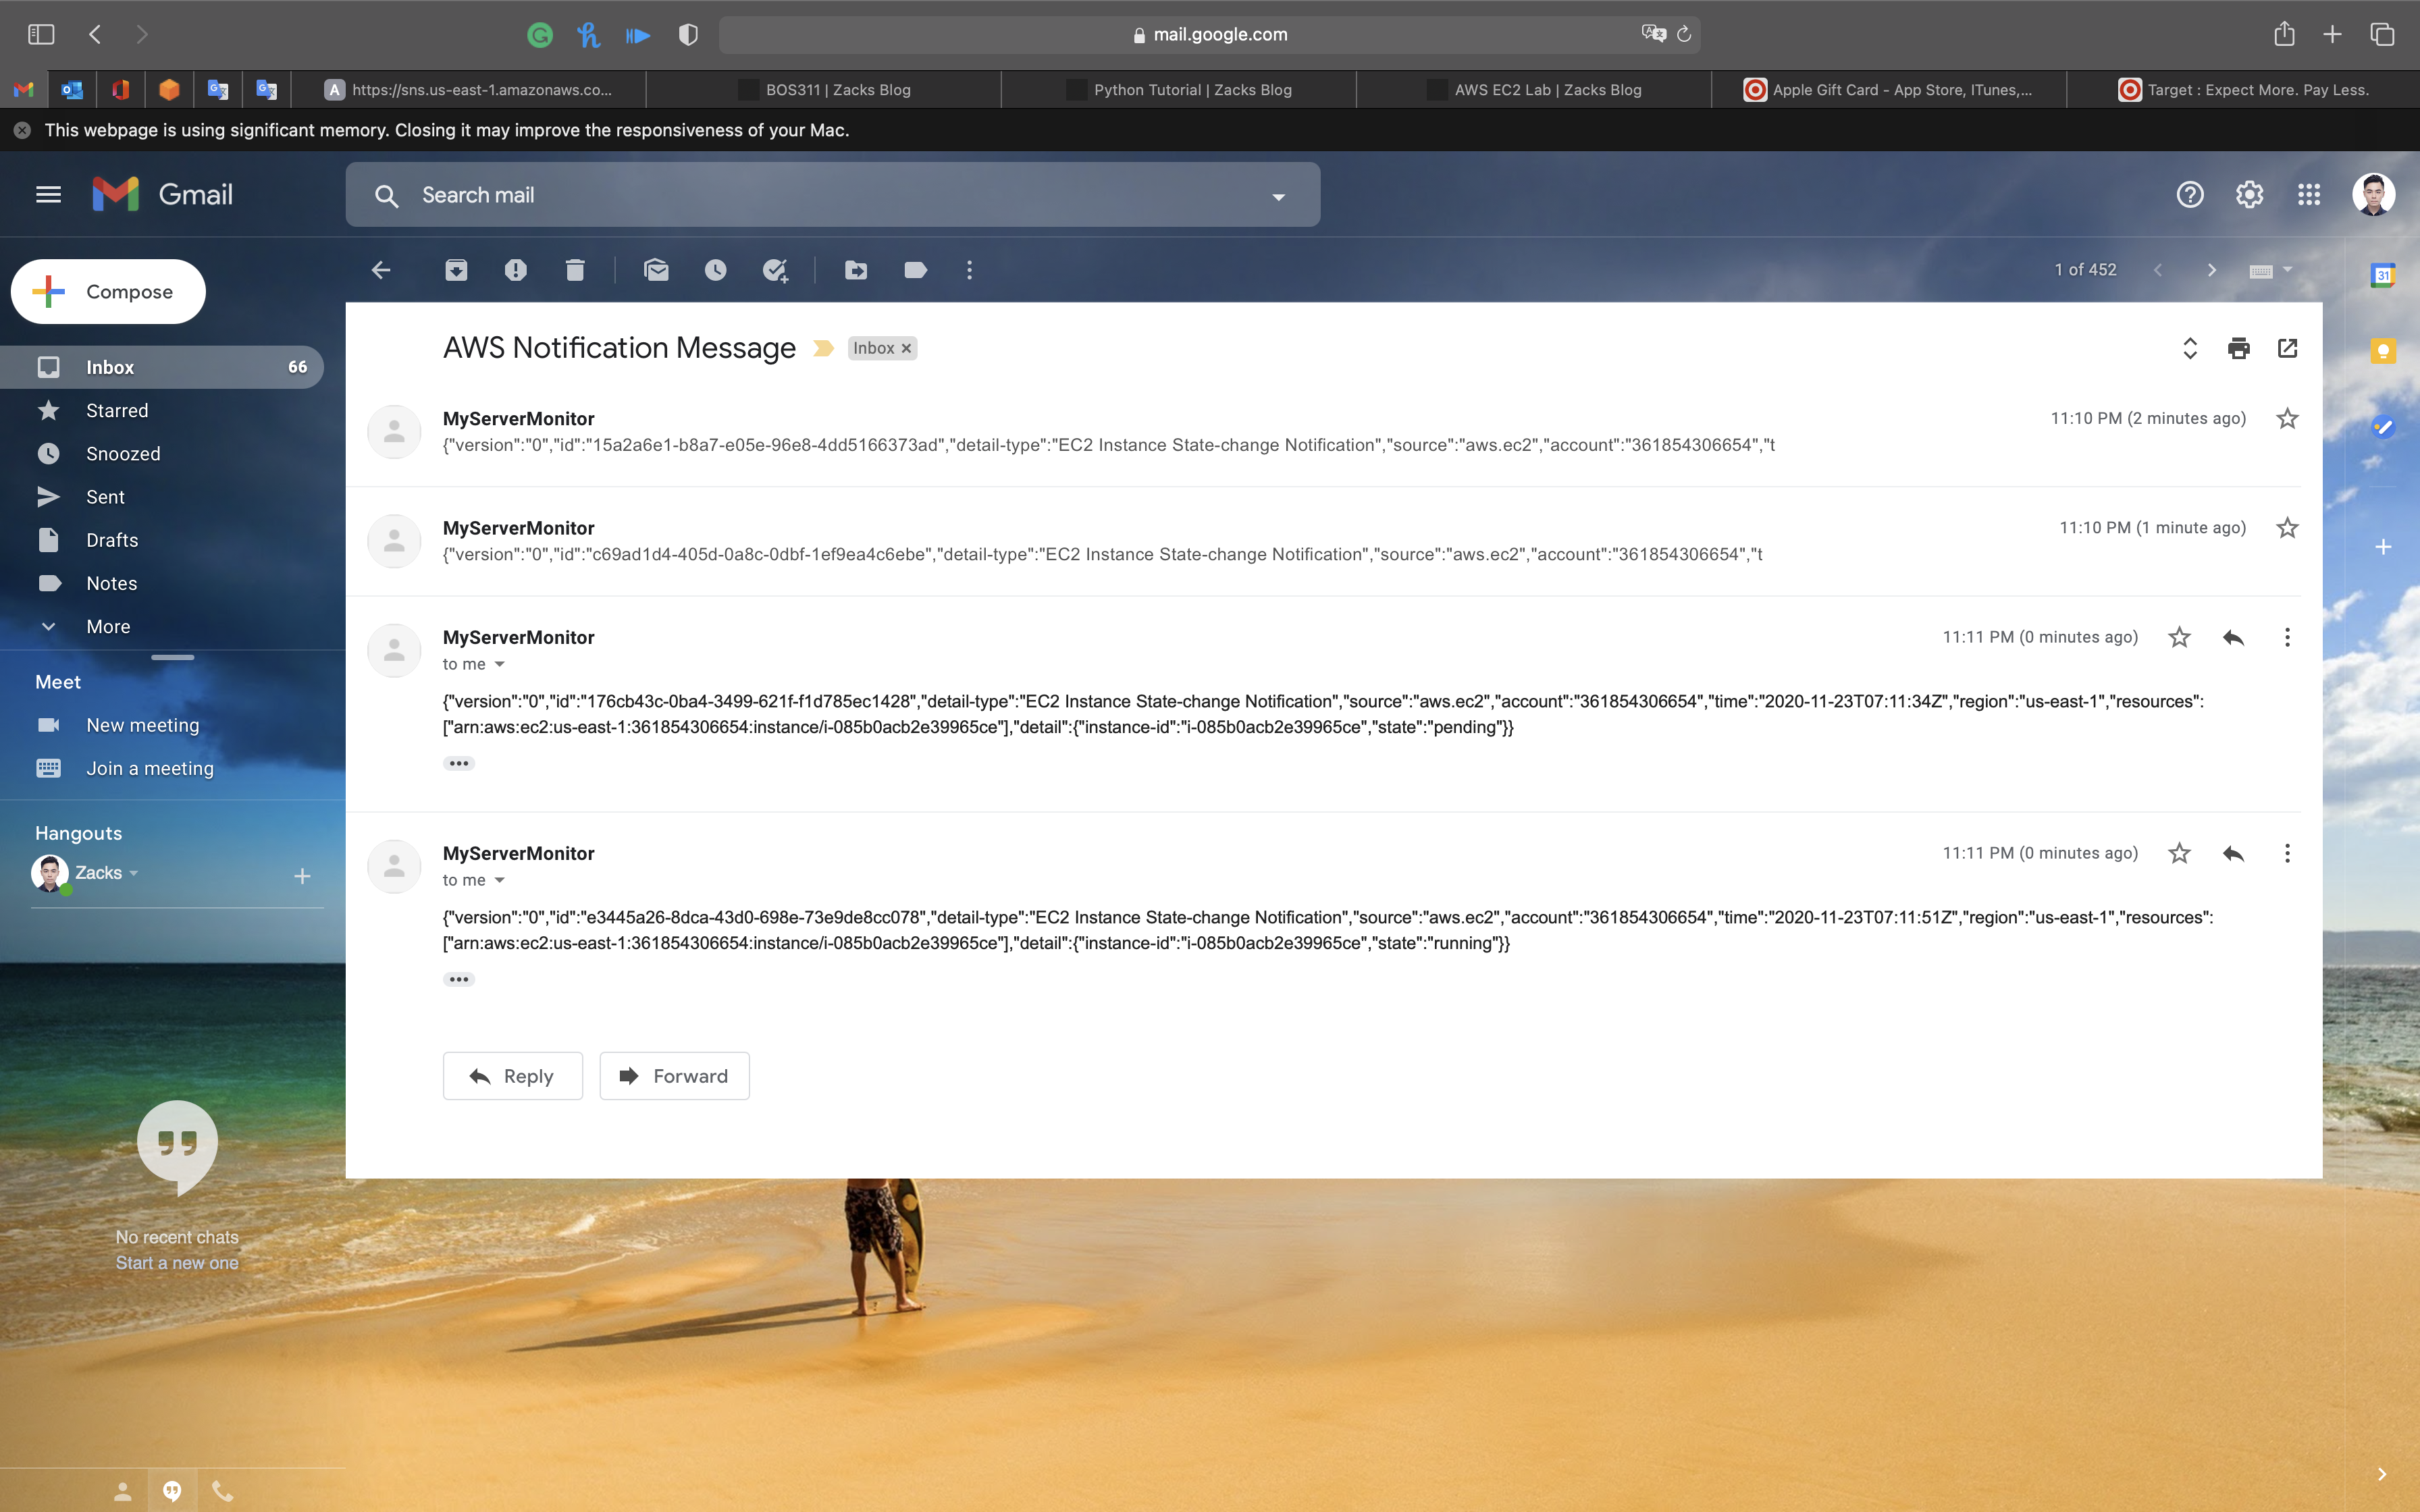
You have successfully triggered CloudWatch Event SNS notification emails.
You can also create Cloudwatch Event Notification for other AWS resources as well.
Completion and Conclusion
- You created an EC2 Instance for which CloudWatch Events were triggered.
- You successfully created an Amazon SNS Topic which was used in CloudWatch.
- You successfully subscribed to an SNS topic using your email address.
- You successfully created and triggered a CloudWatch Event based on an instance’s state change.