AWS Athena Lab
AWS Athena
Athena Data Analytics
Athena in Analysis and Visualization Solution
Core Components
- AWS Glue
- Glue Data Catalog
- Glue Crawler
- Glue ETL
- AWS S3
- AWS Athena
- QuickSight
Lab Details
- Athena working with GLue
- Crawl NYC Taxi CSV data to catalog taxi data
- Run Glue ETL to convert taxi data to Parquet
- Crawl Parquet data to catalog columnar formatted taxi data
- Use Athena to query taxi data
- Use QuickSight to visualize our taxi data
Task Details
Query Non-SQL batch data in SQL statement.
- AWS S3
- Download data from TLC and upload the data to Amazon S3
- AWS Glue
- Using AWS Glue to create the database then crawl the data in S3 for building table schemas.
- Using AWS Glue ETL Job to transform the raw data (.csv) to (.parquet) for getting the date in
timestamptype instead ofstringtype.
- AWS Athena
- Connect to Glue for loading schemas(databases and tables)
- Choose your database
- Query data
- QuickSight
- Connect to Athena for visualization
Prerequisite
Download Data
Download data from NYC gov, visit TLC Trip Record Data
Or click here ot download 2016 January - Yellow Taxi Trip Records (CSV)
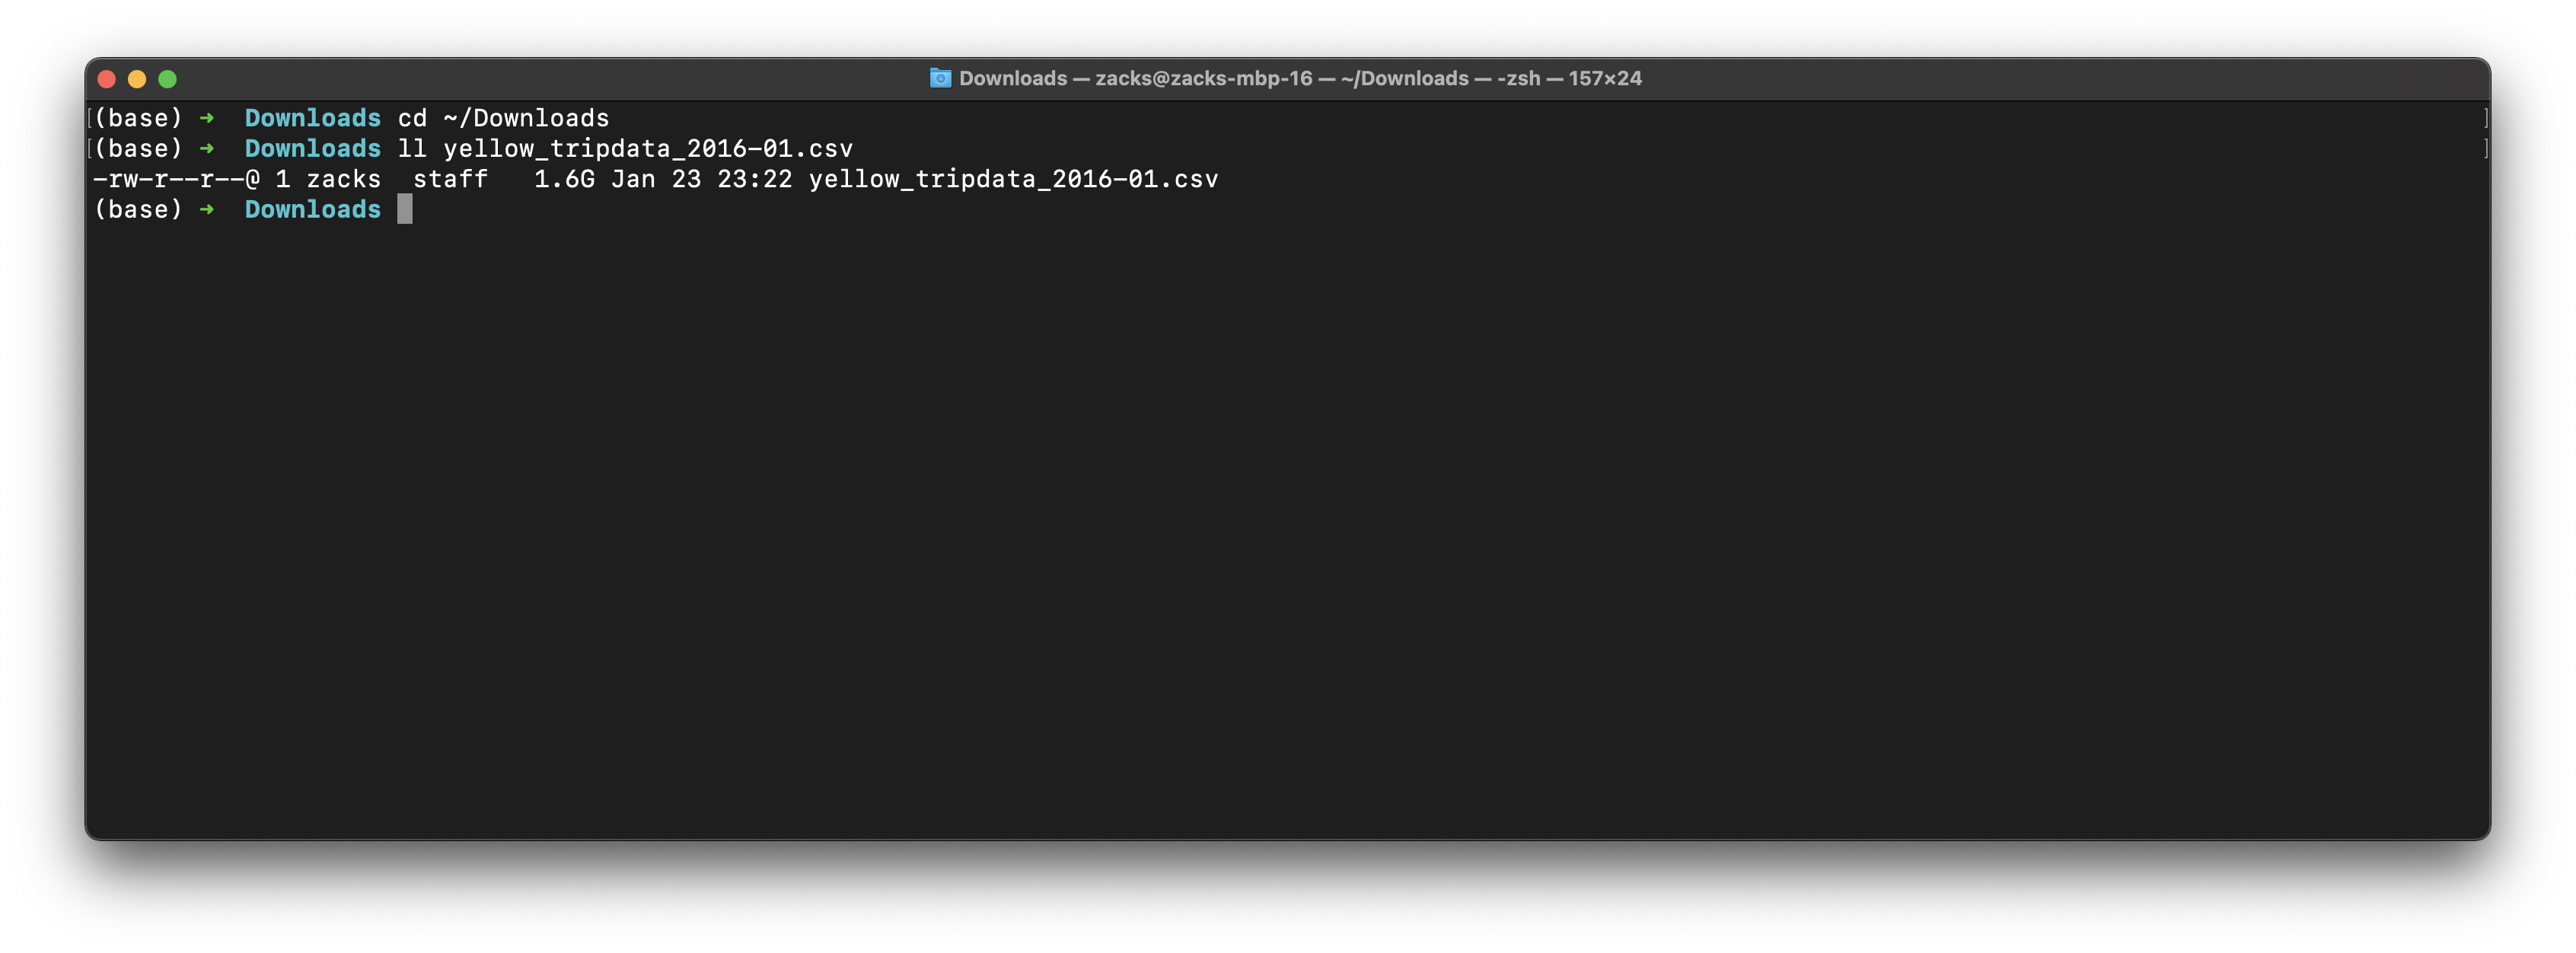
Validate raw data
We can see it is a huge data with 1.6GB
1 | cd ~/Downloads |
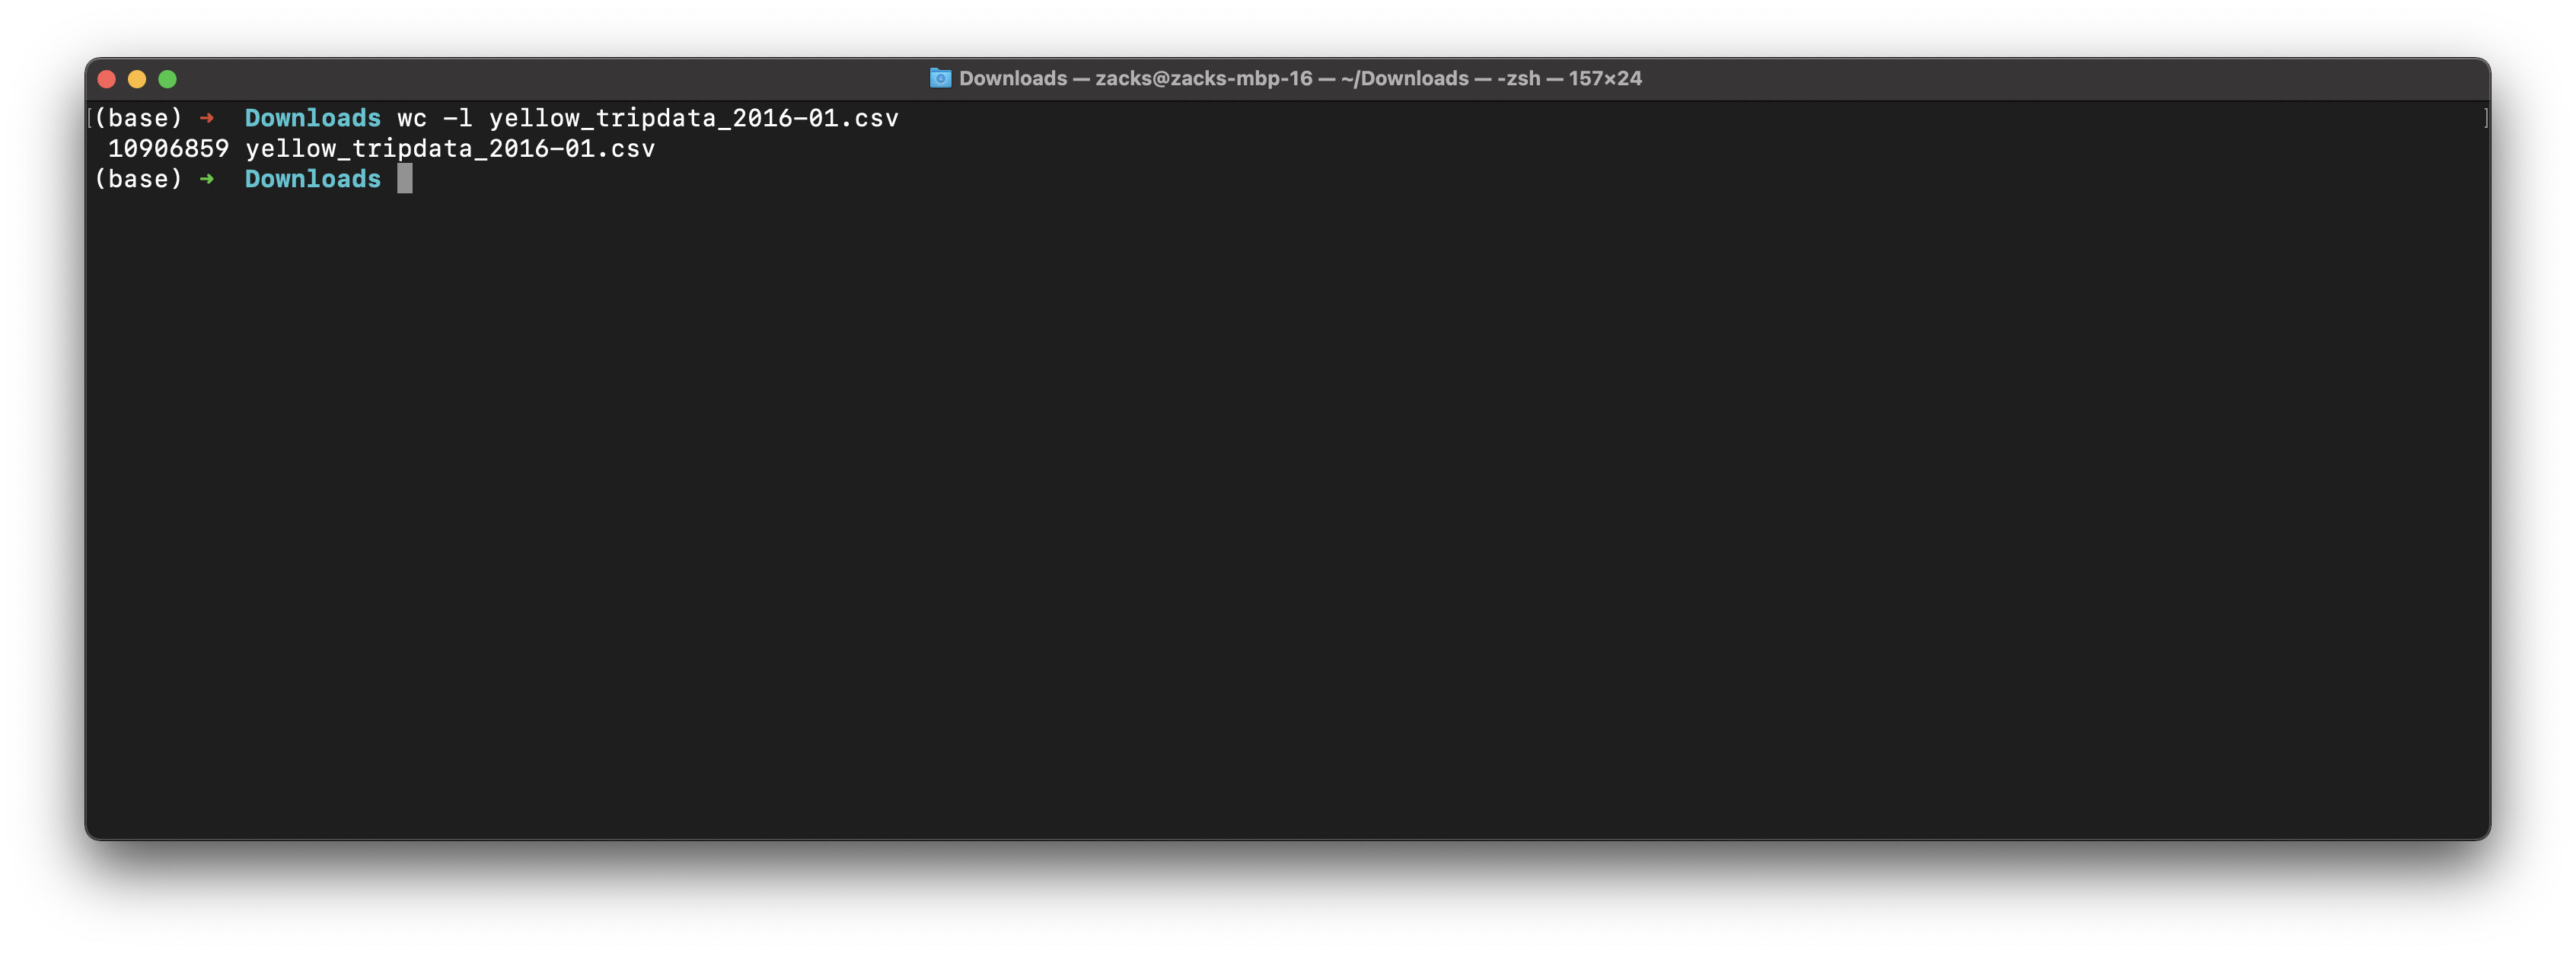
New York city has 10,906,859 records of yellow taxi in Jan, 2016.
1 | wc -l yellow_tripdata_2016-01.csv |
S3 Configuration
Create a bucket for storing the lab data.
Create bucket and folders
Create a folder in your S3 bucket for storing raw data.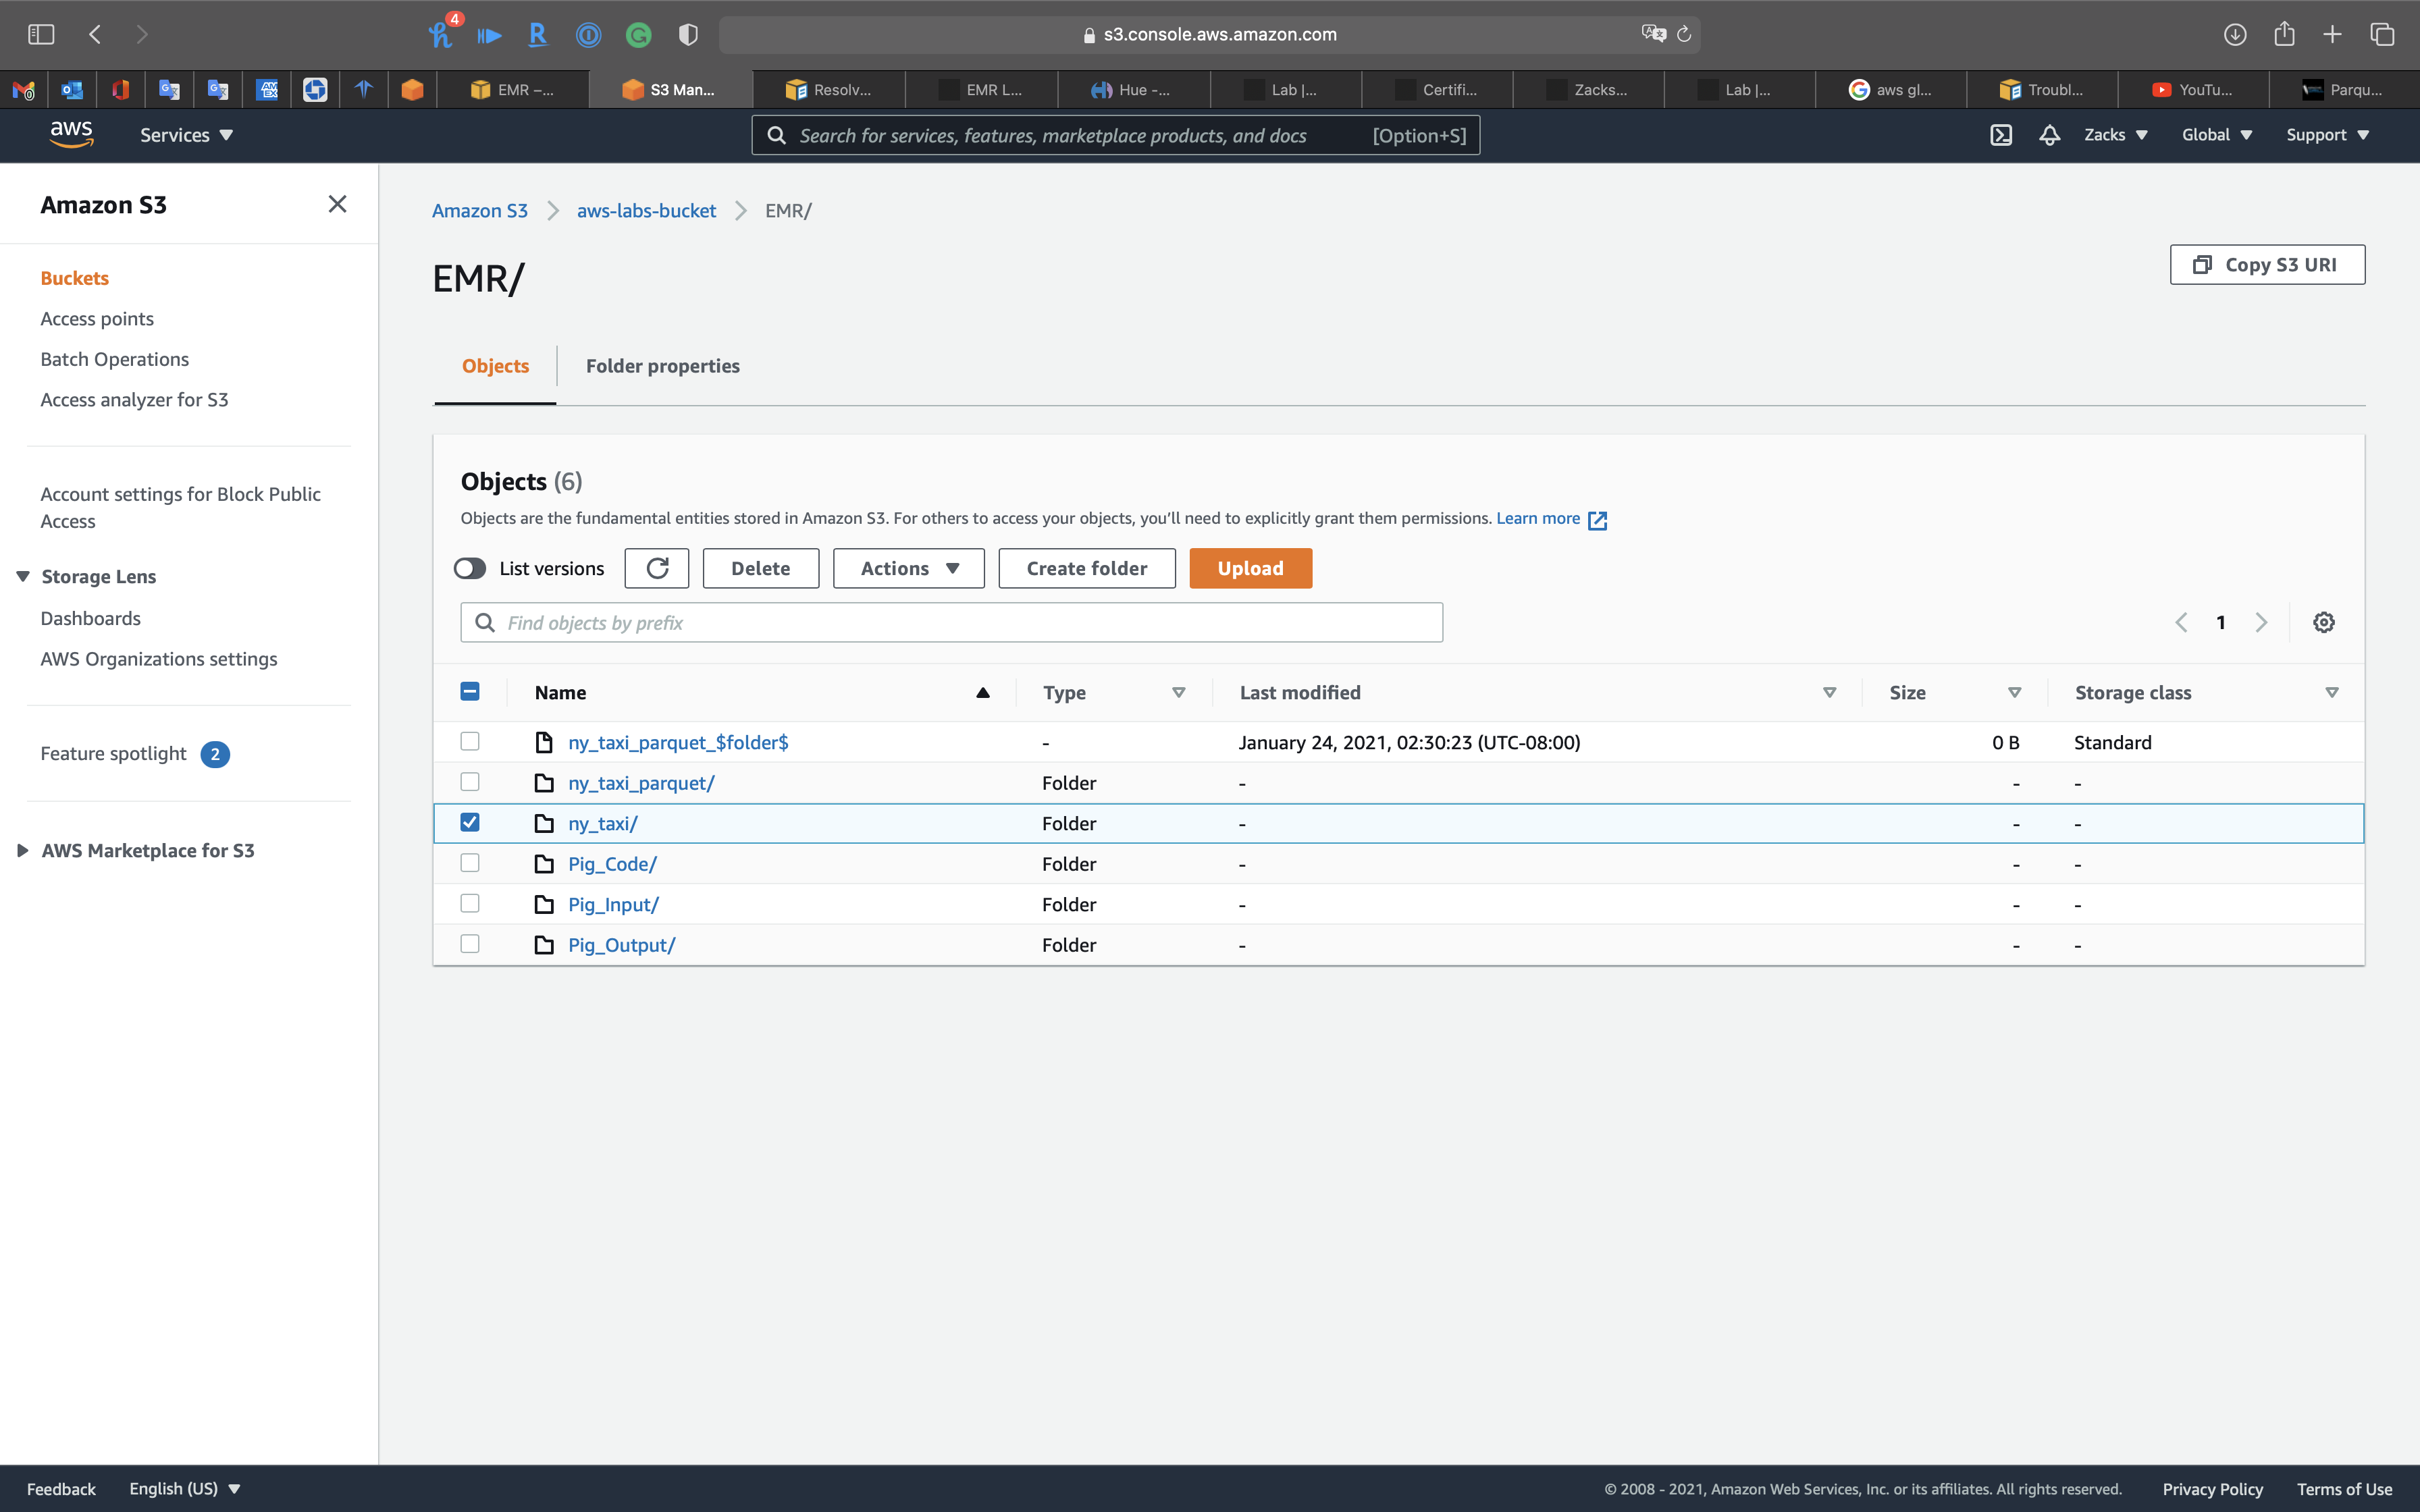
Create a folder in your S3 bucket for storing parquet data.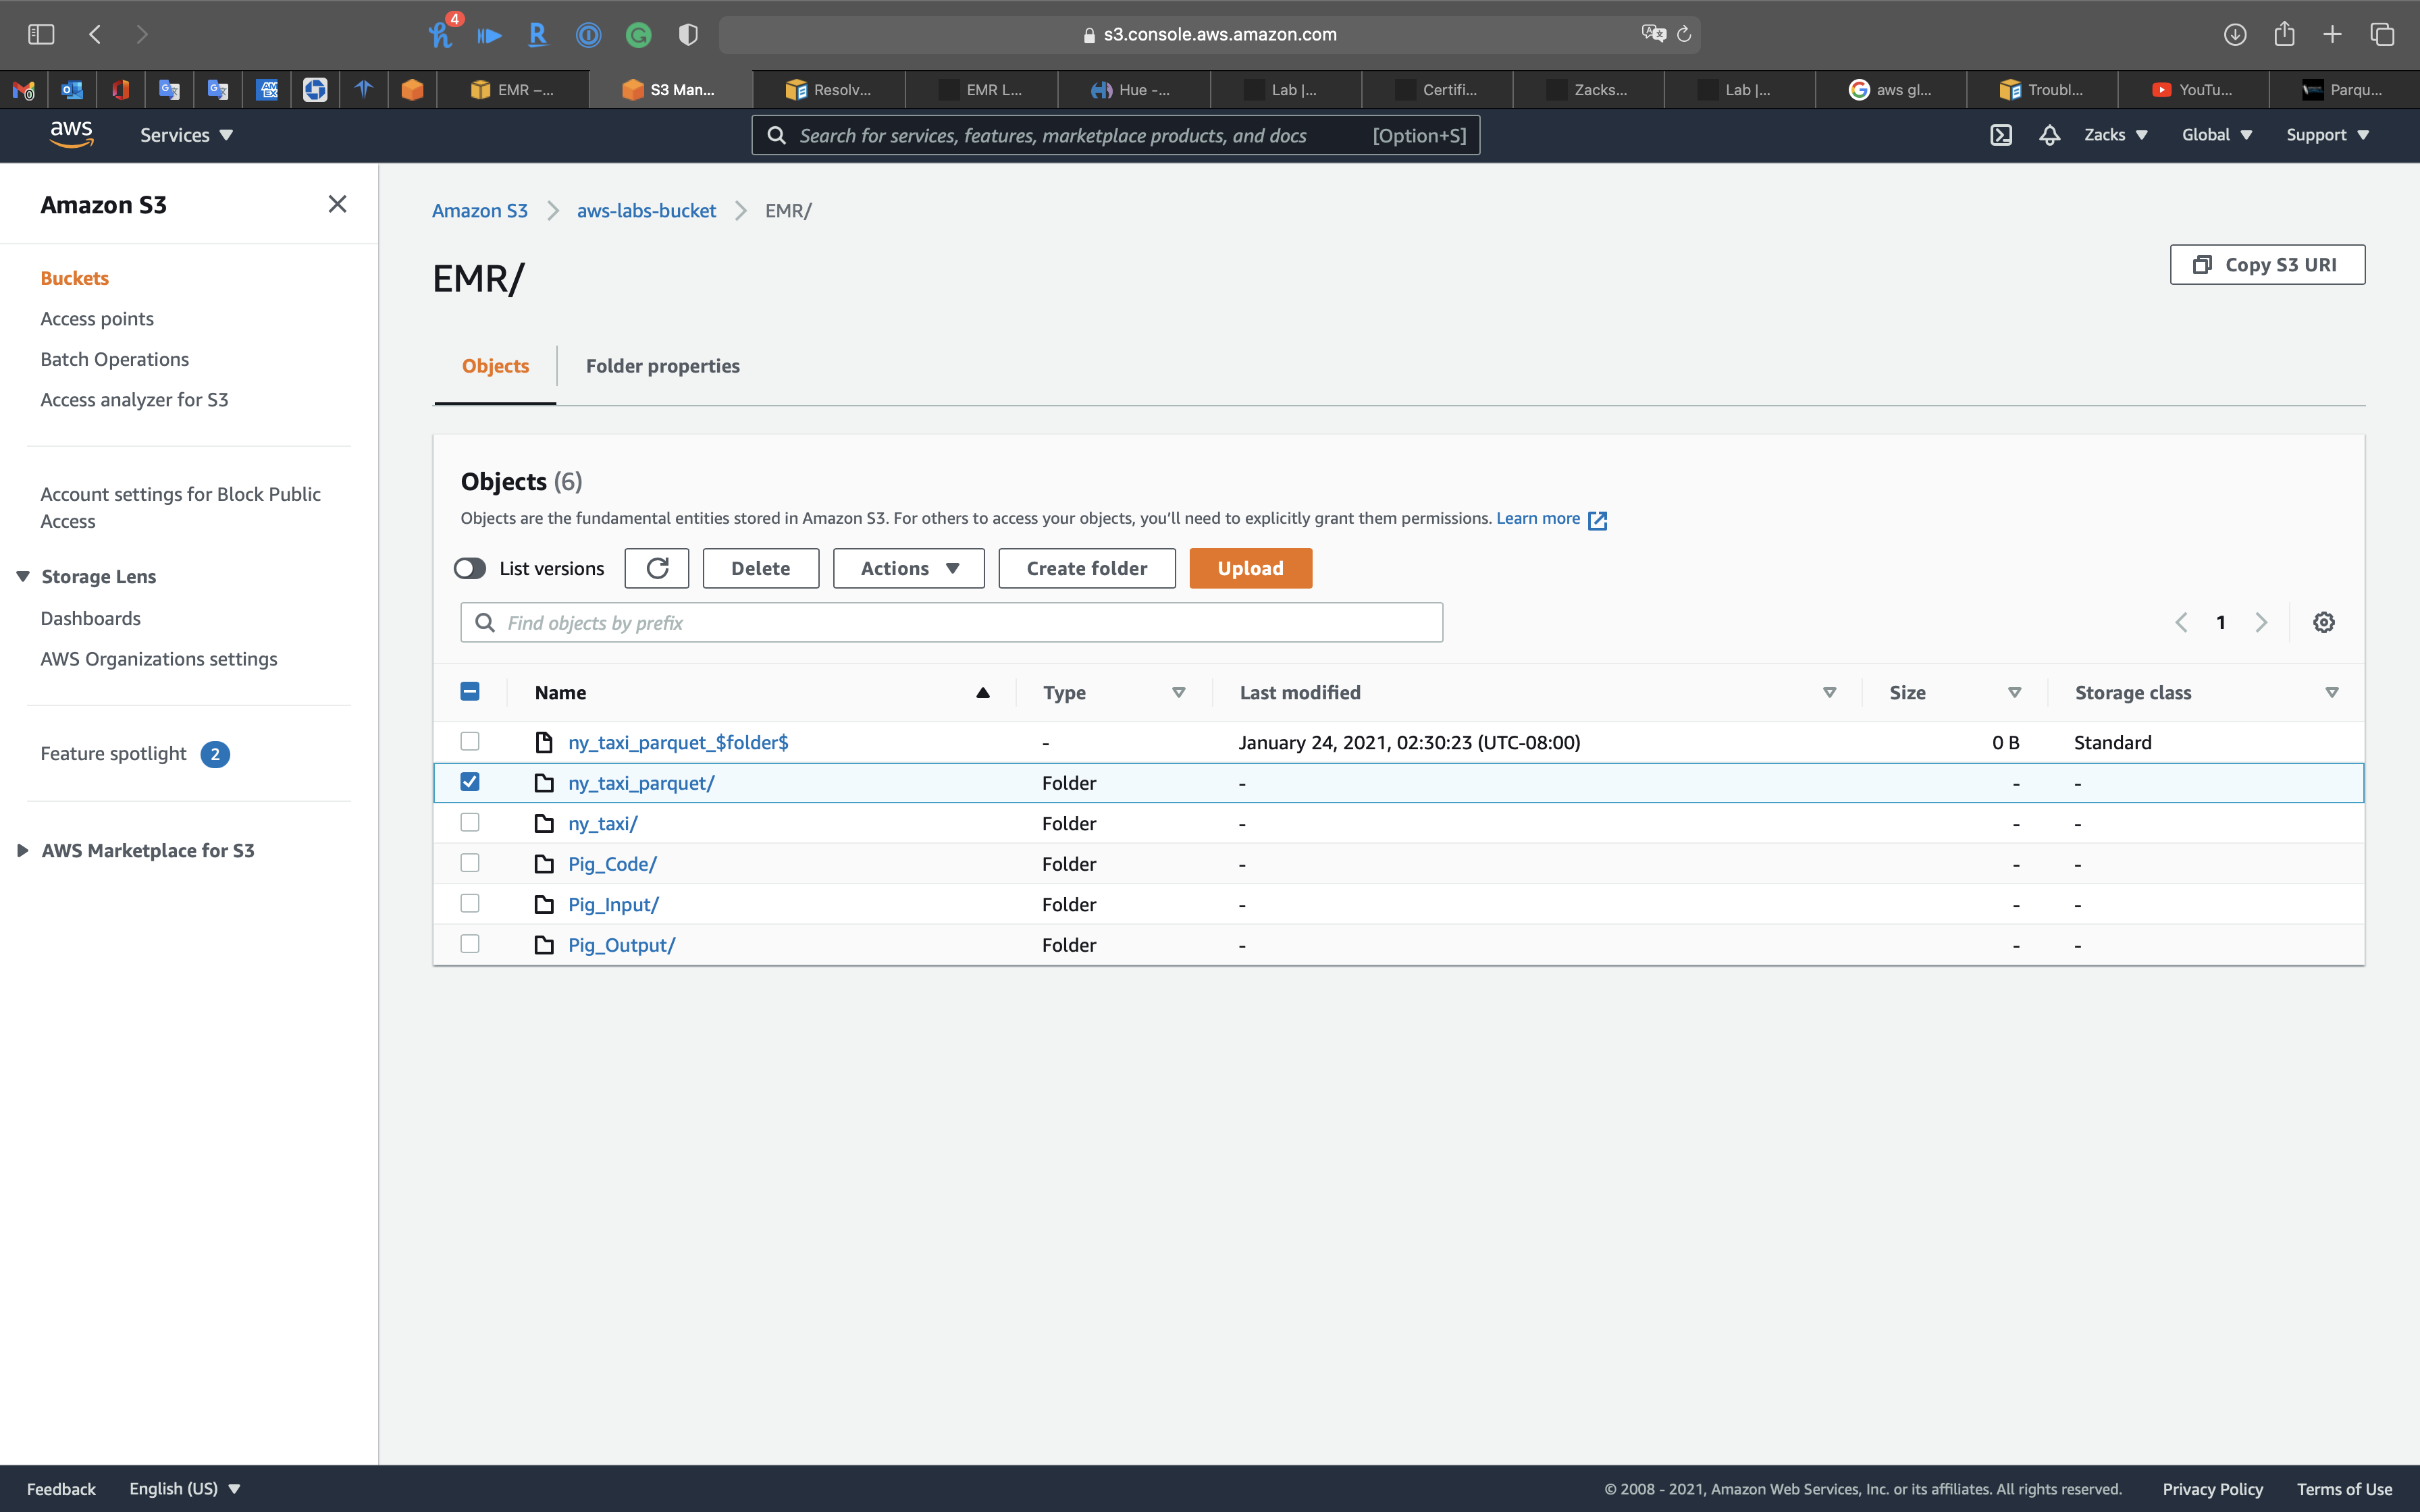
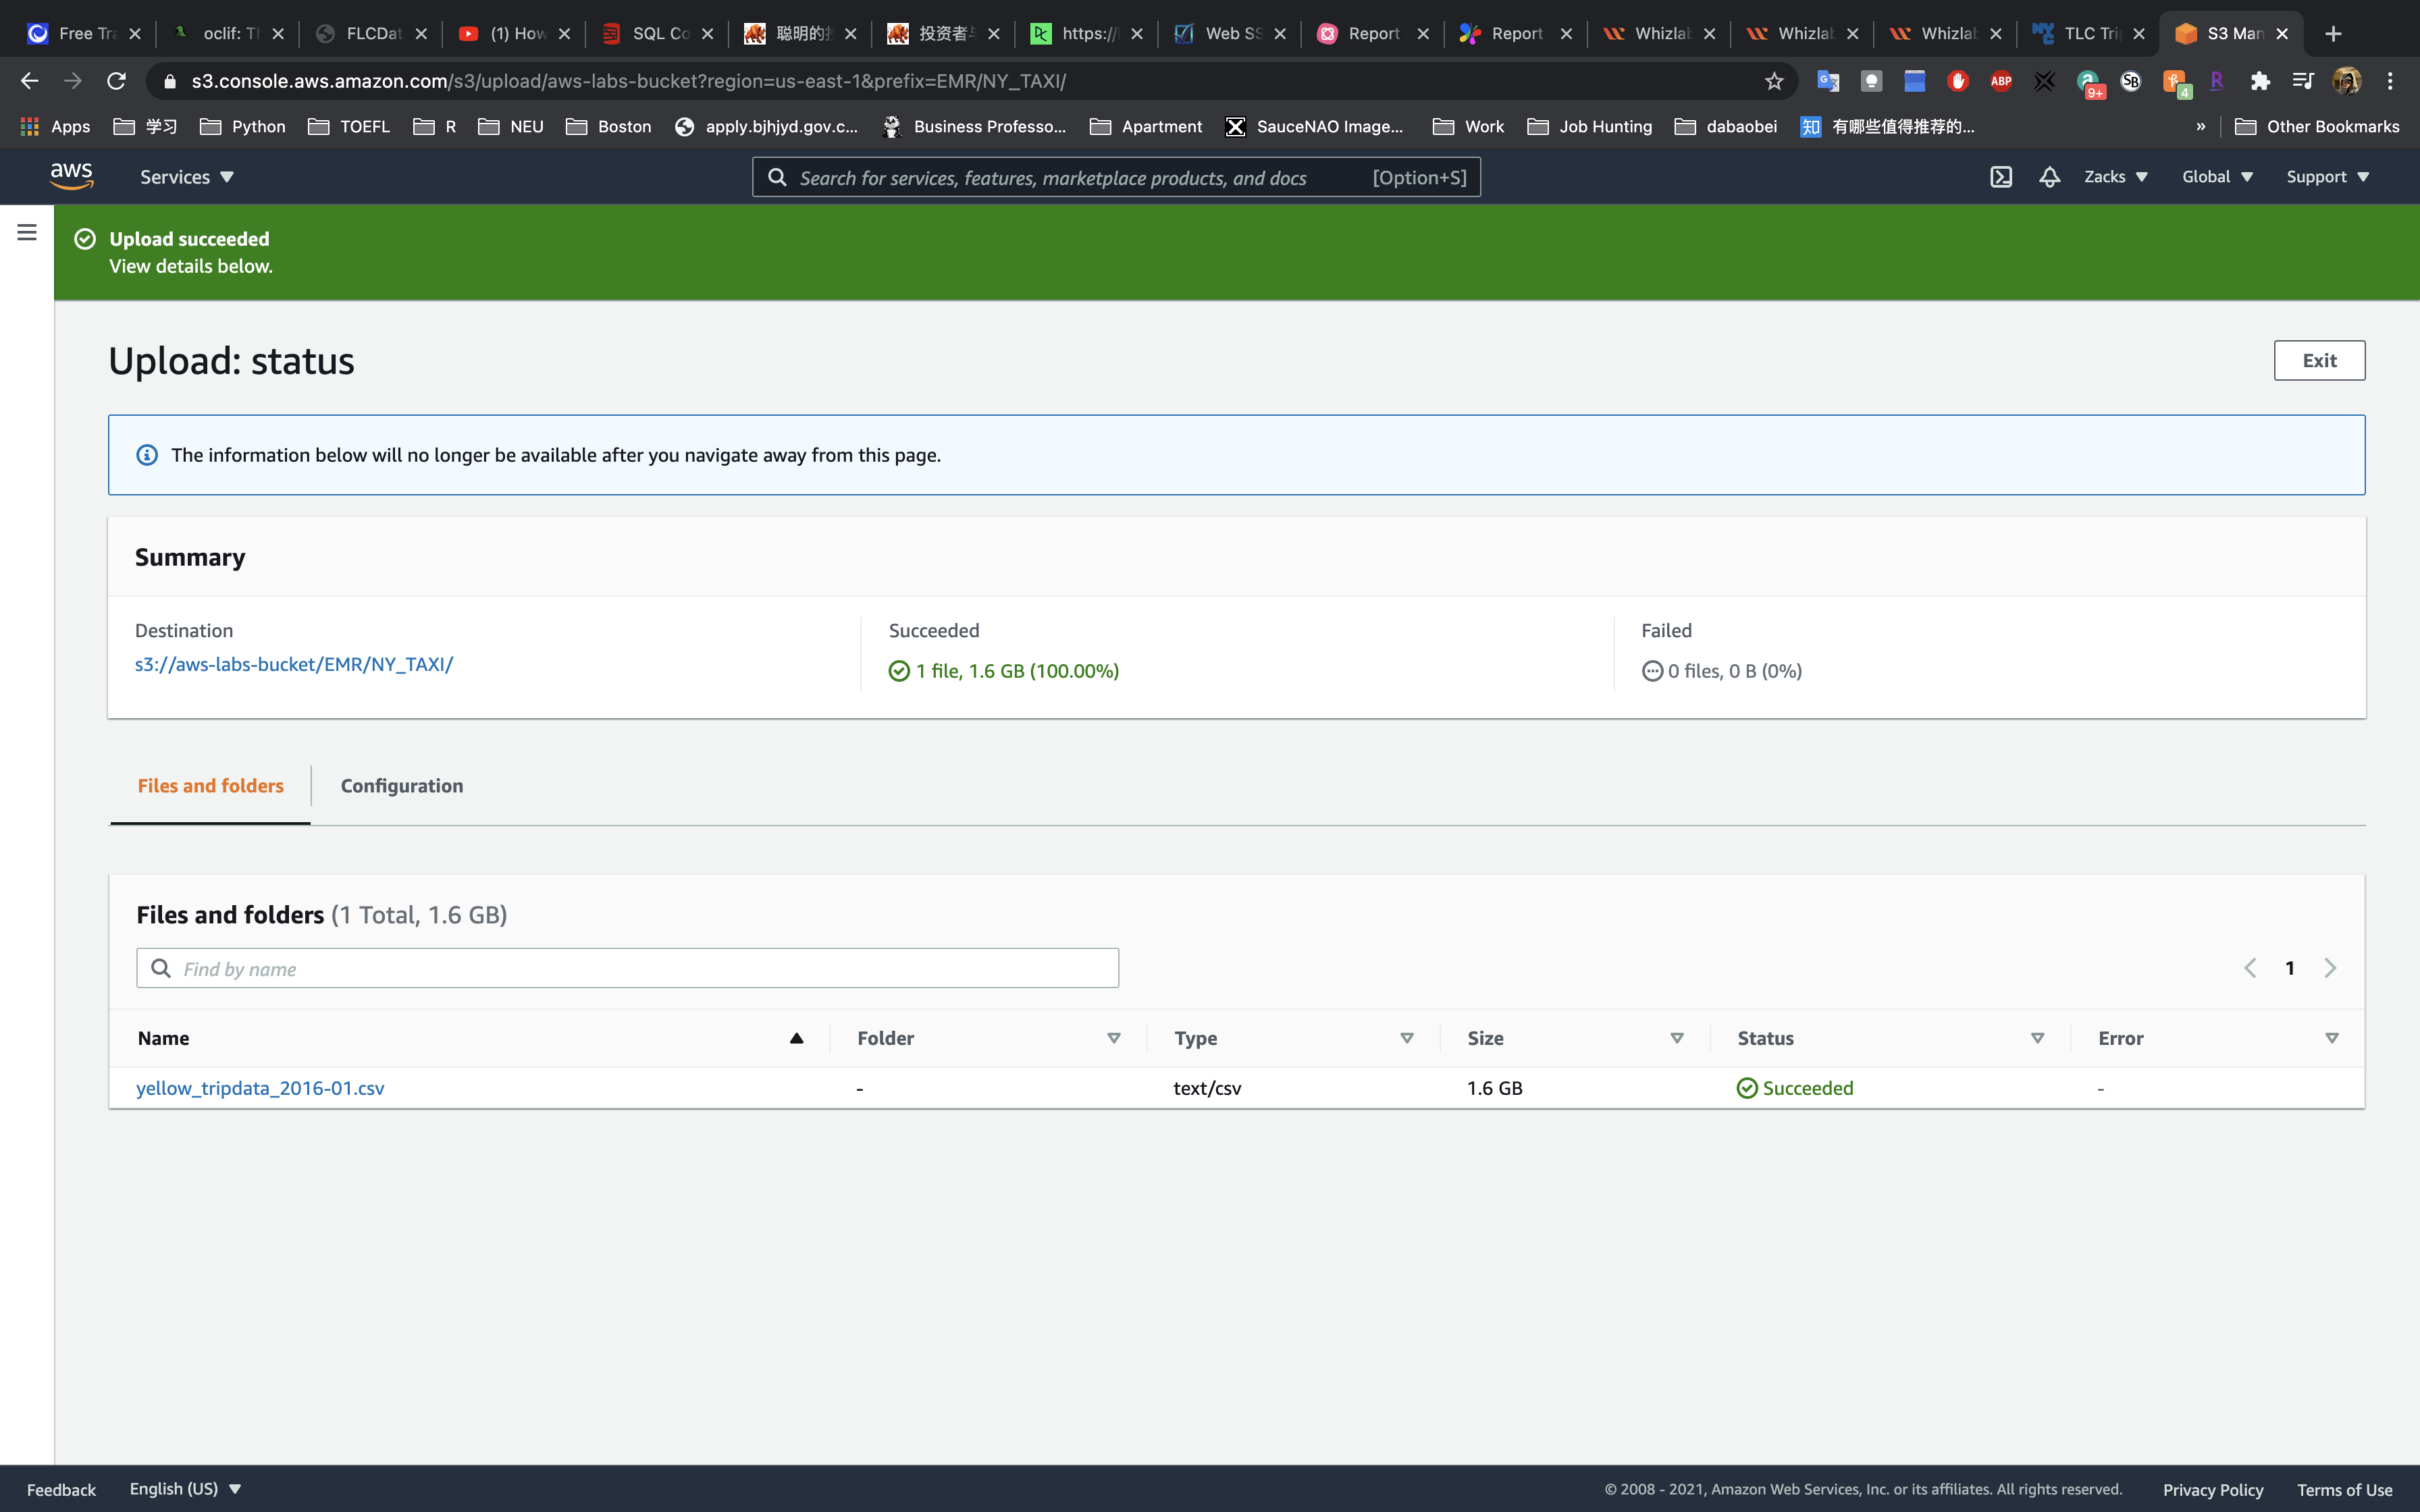
Upload data to your raw data folder
Click on your folder for the raw data.
You may need to stably upload the data through Chrome.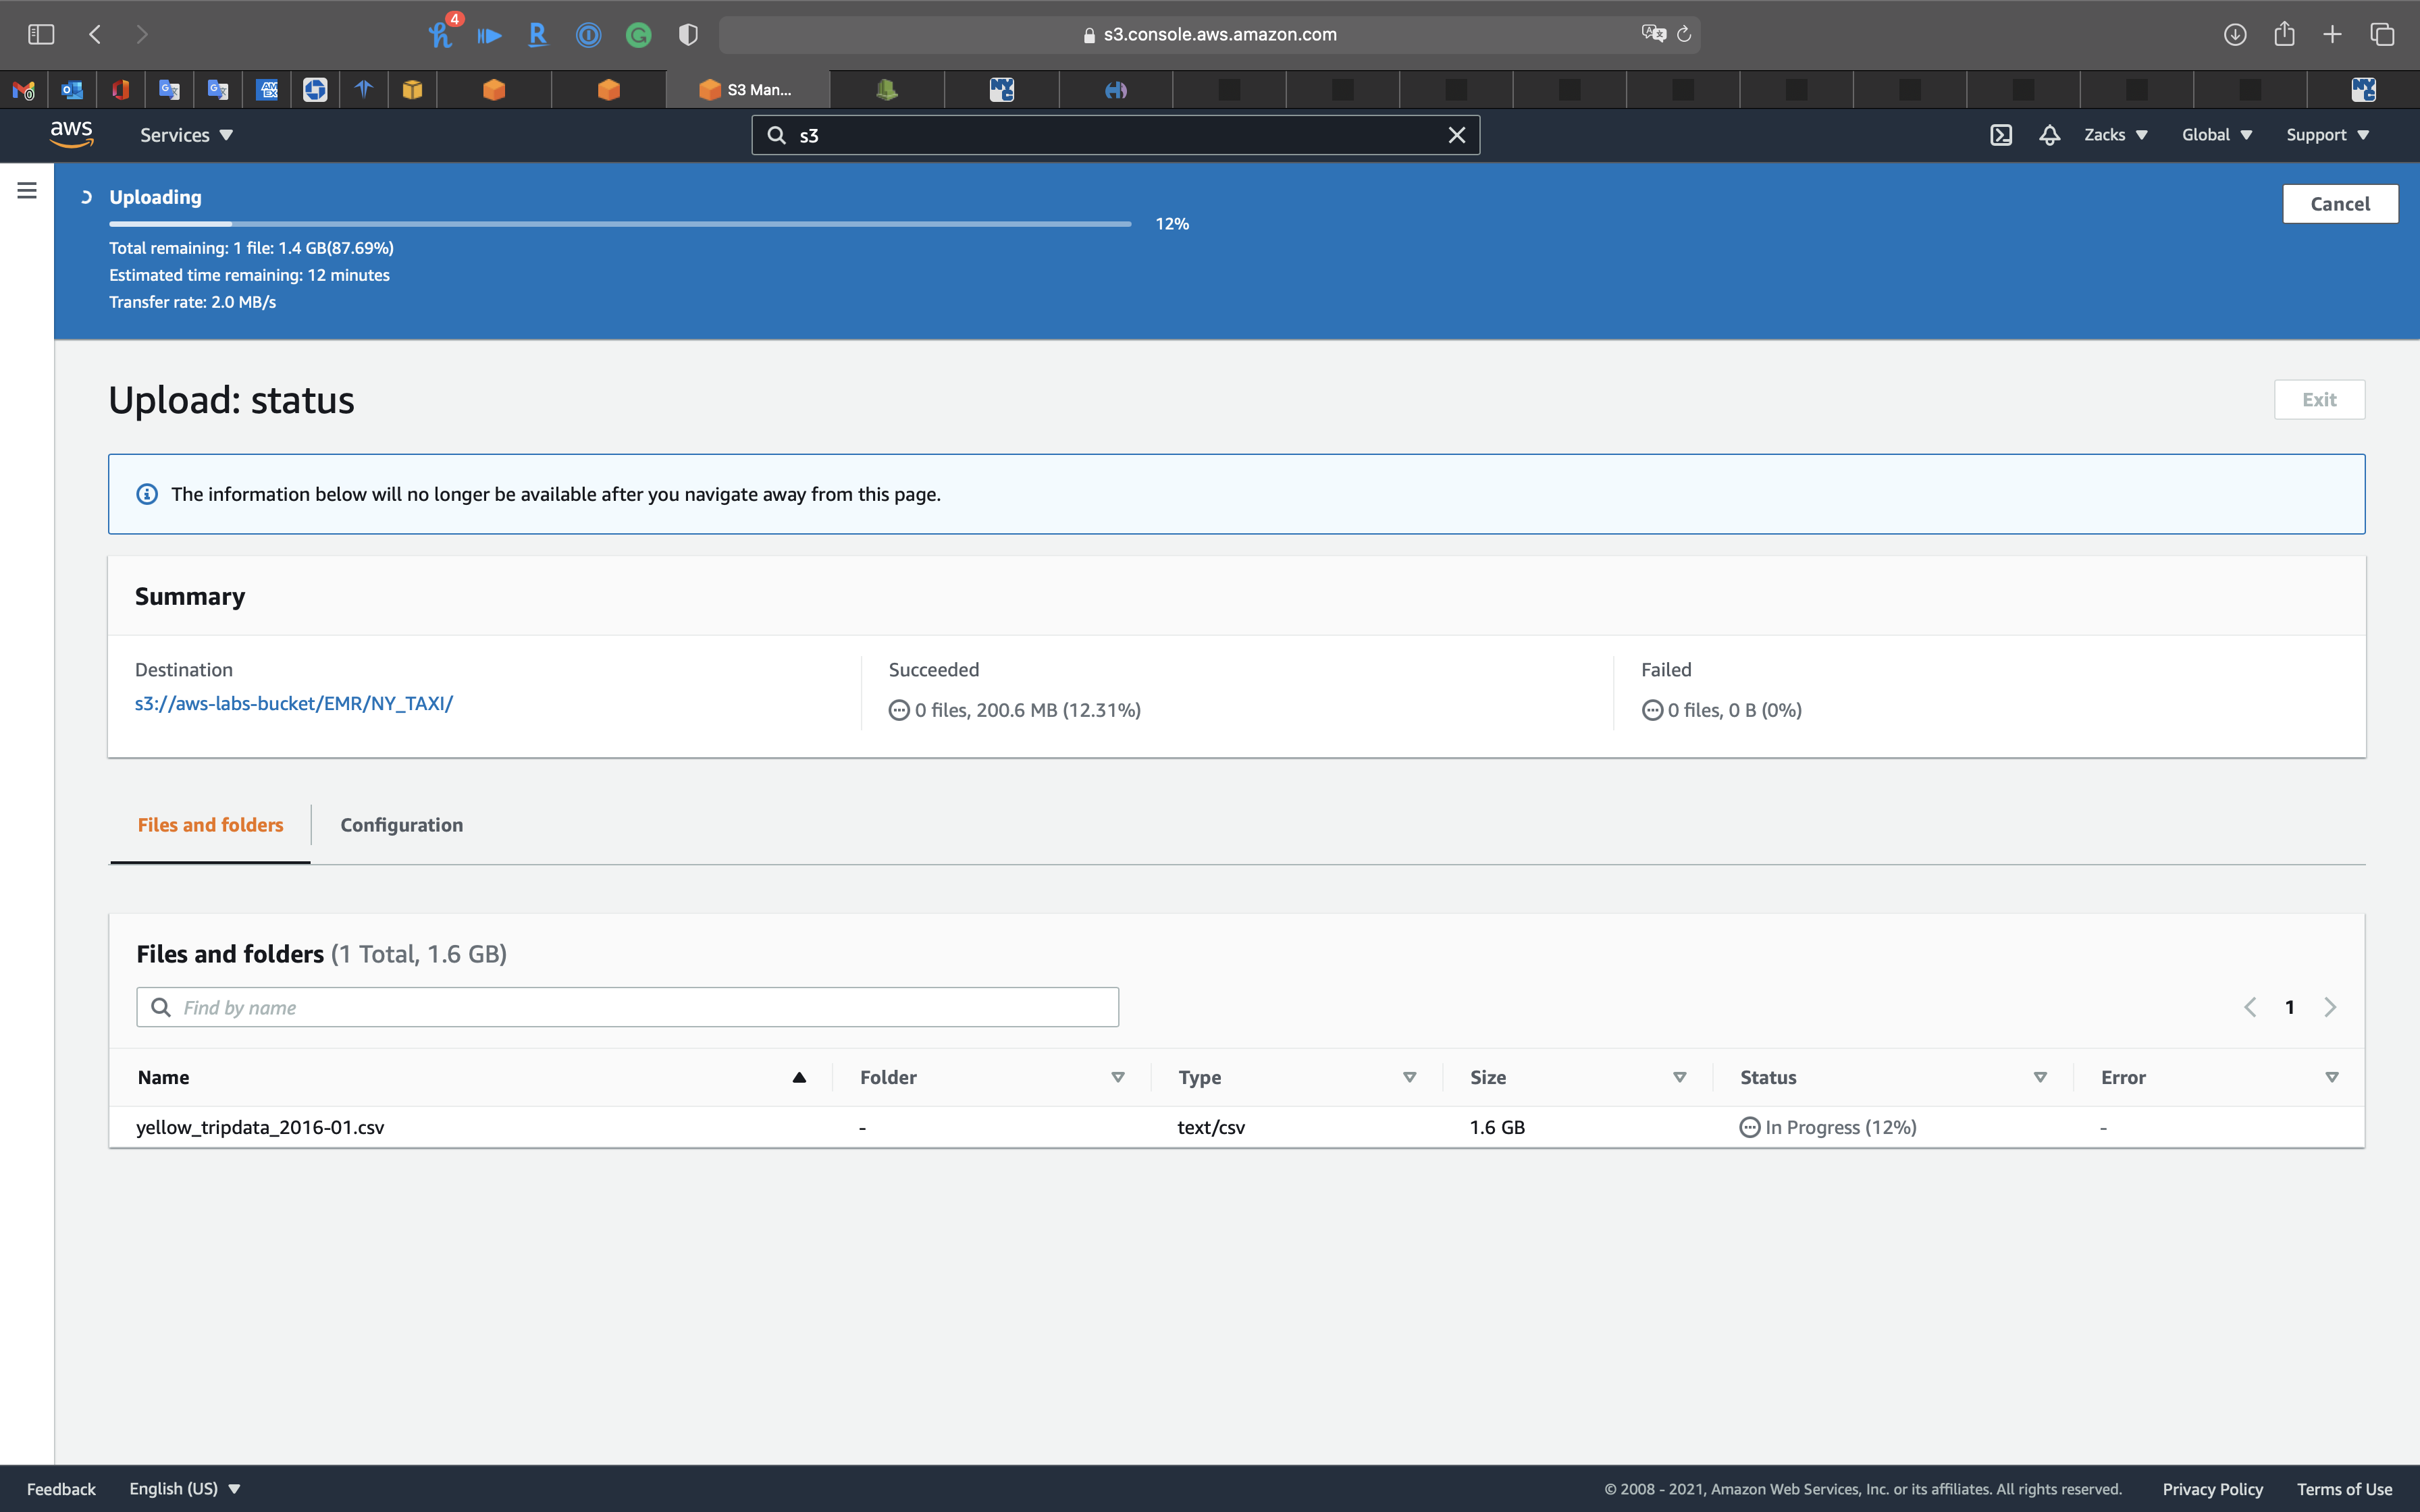
Glue Configuration
Create a Database for Raw Data Table & Transformed Data Table
Create a database for storing raw data and transformed data schemas.
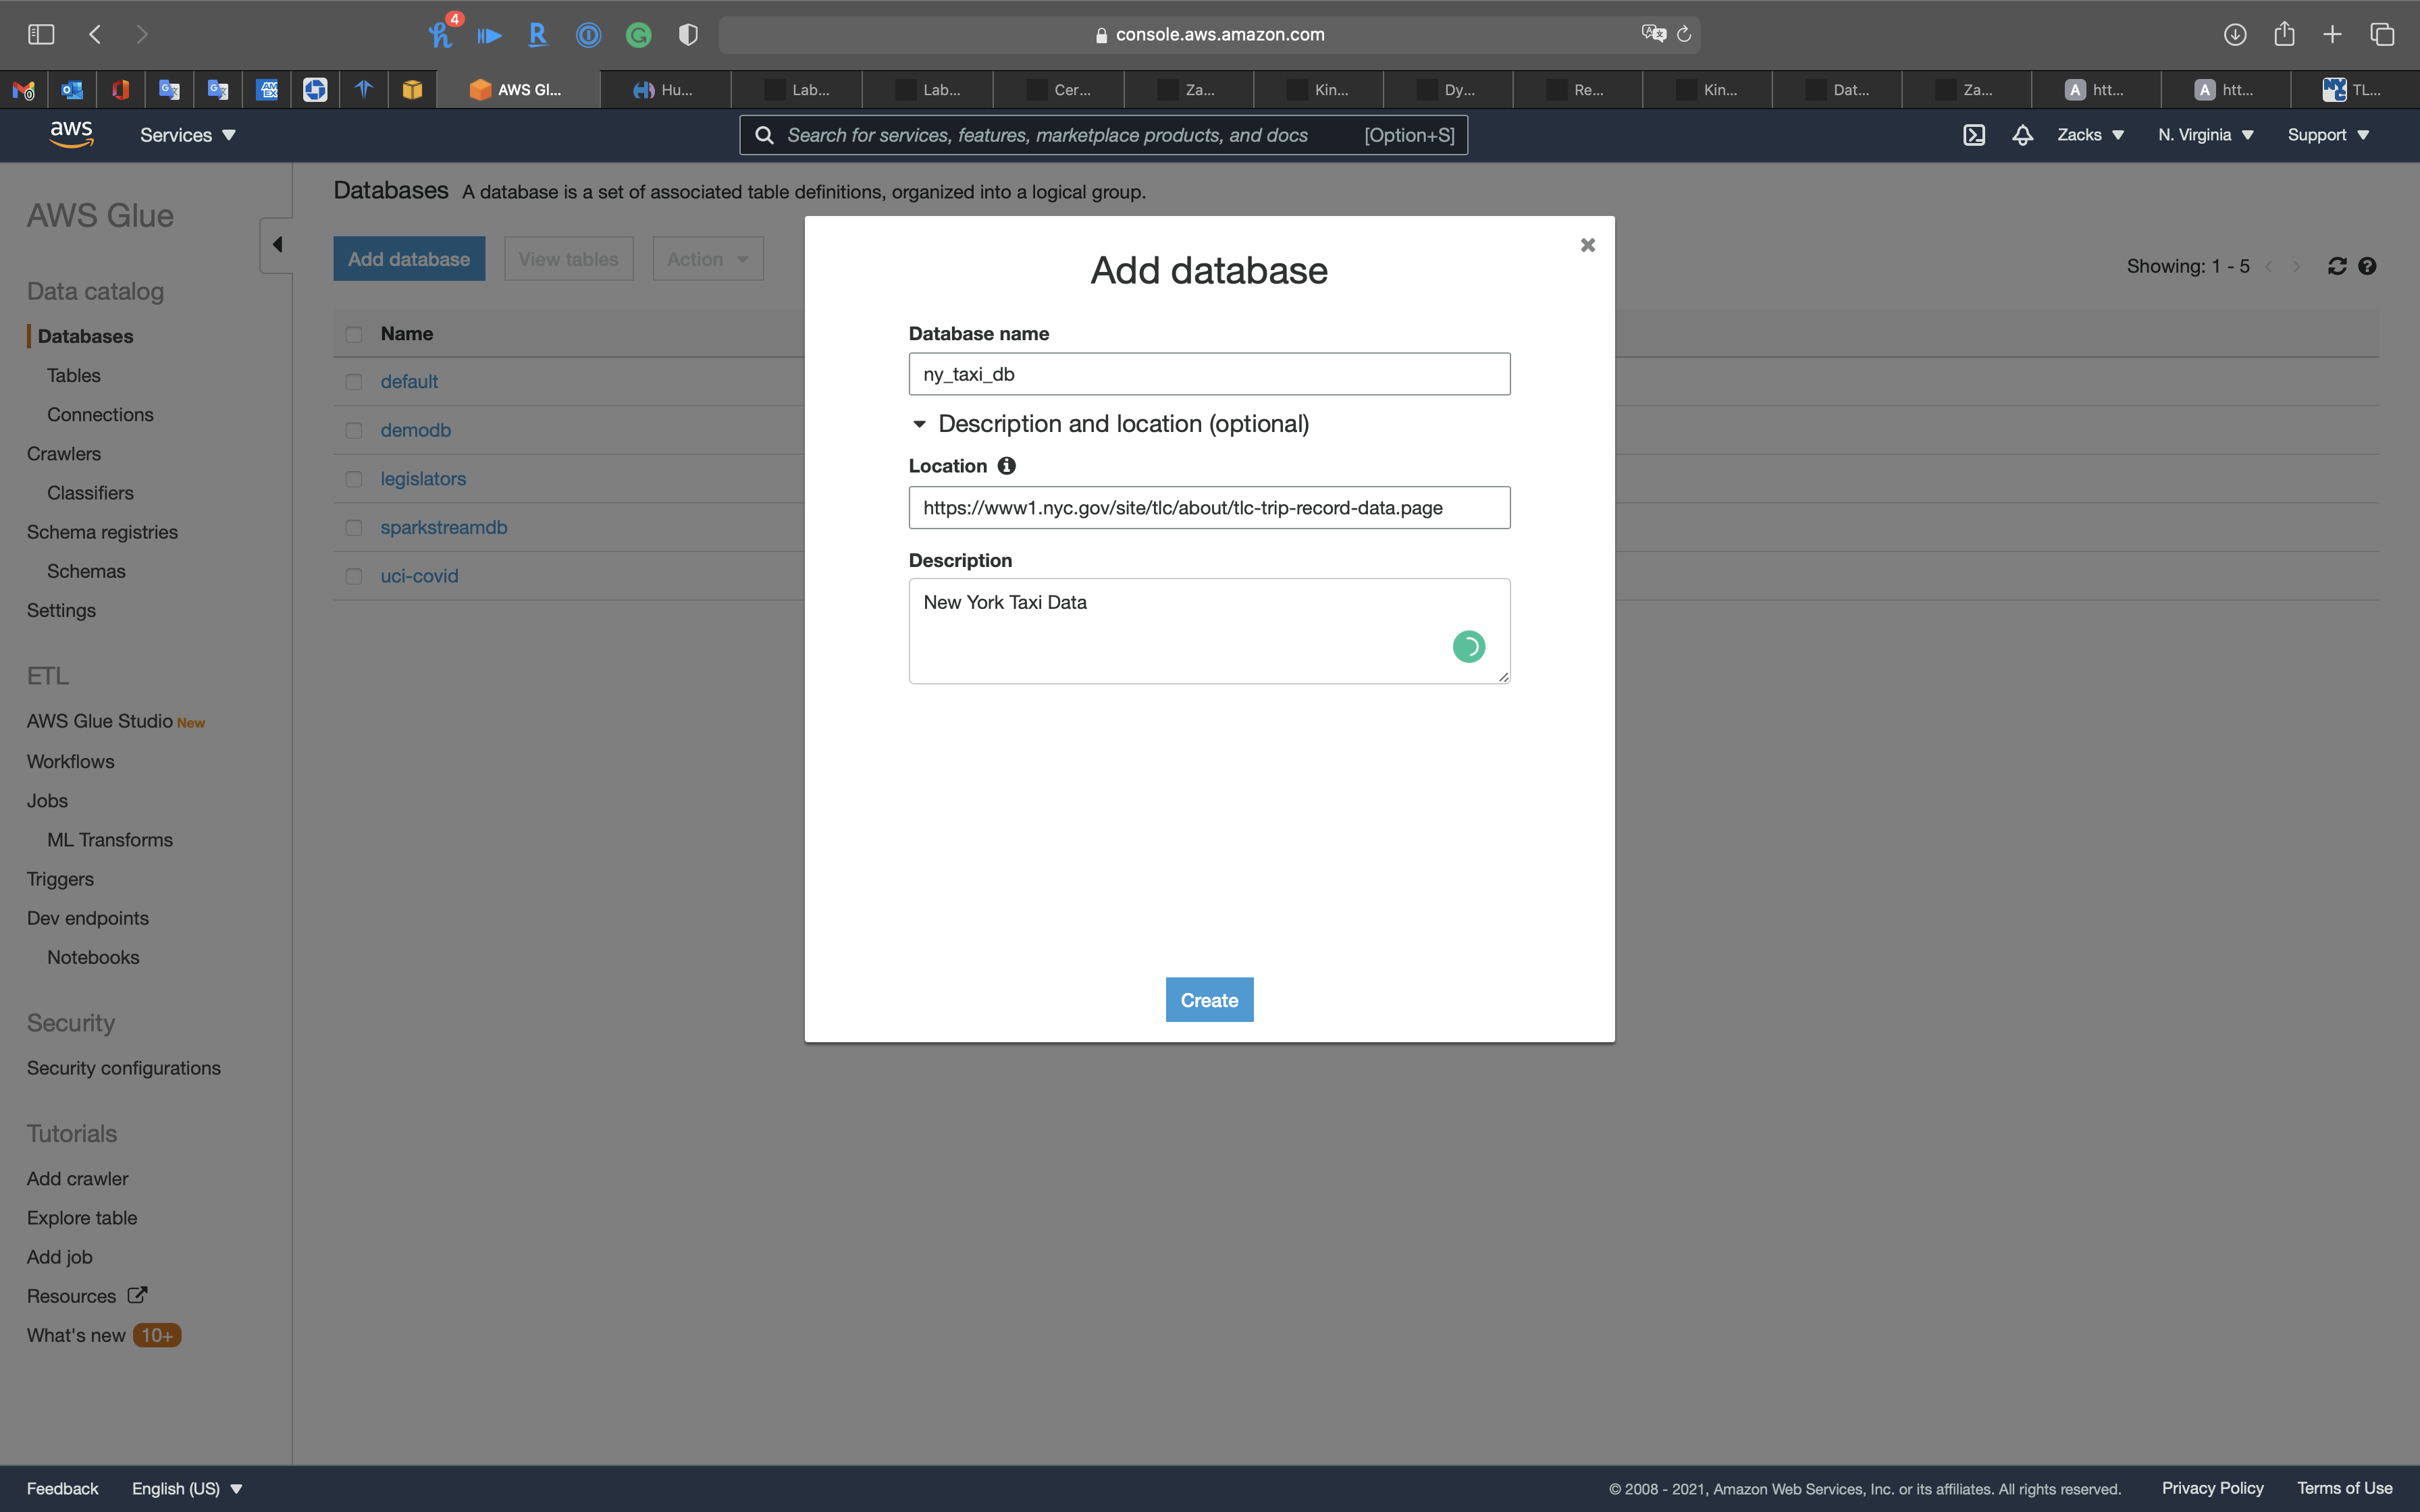
Click on Add databases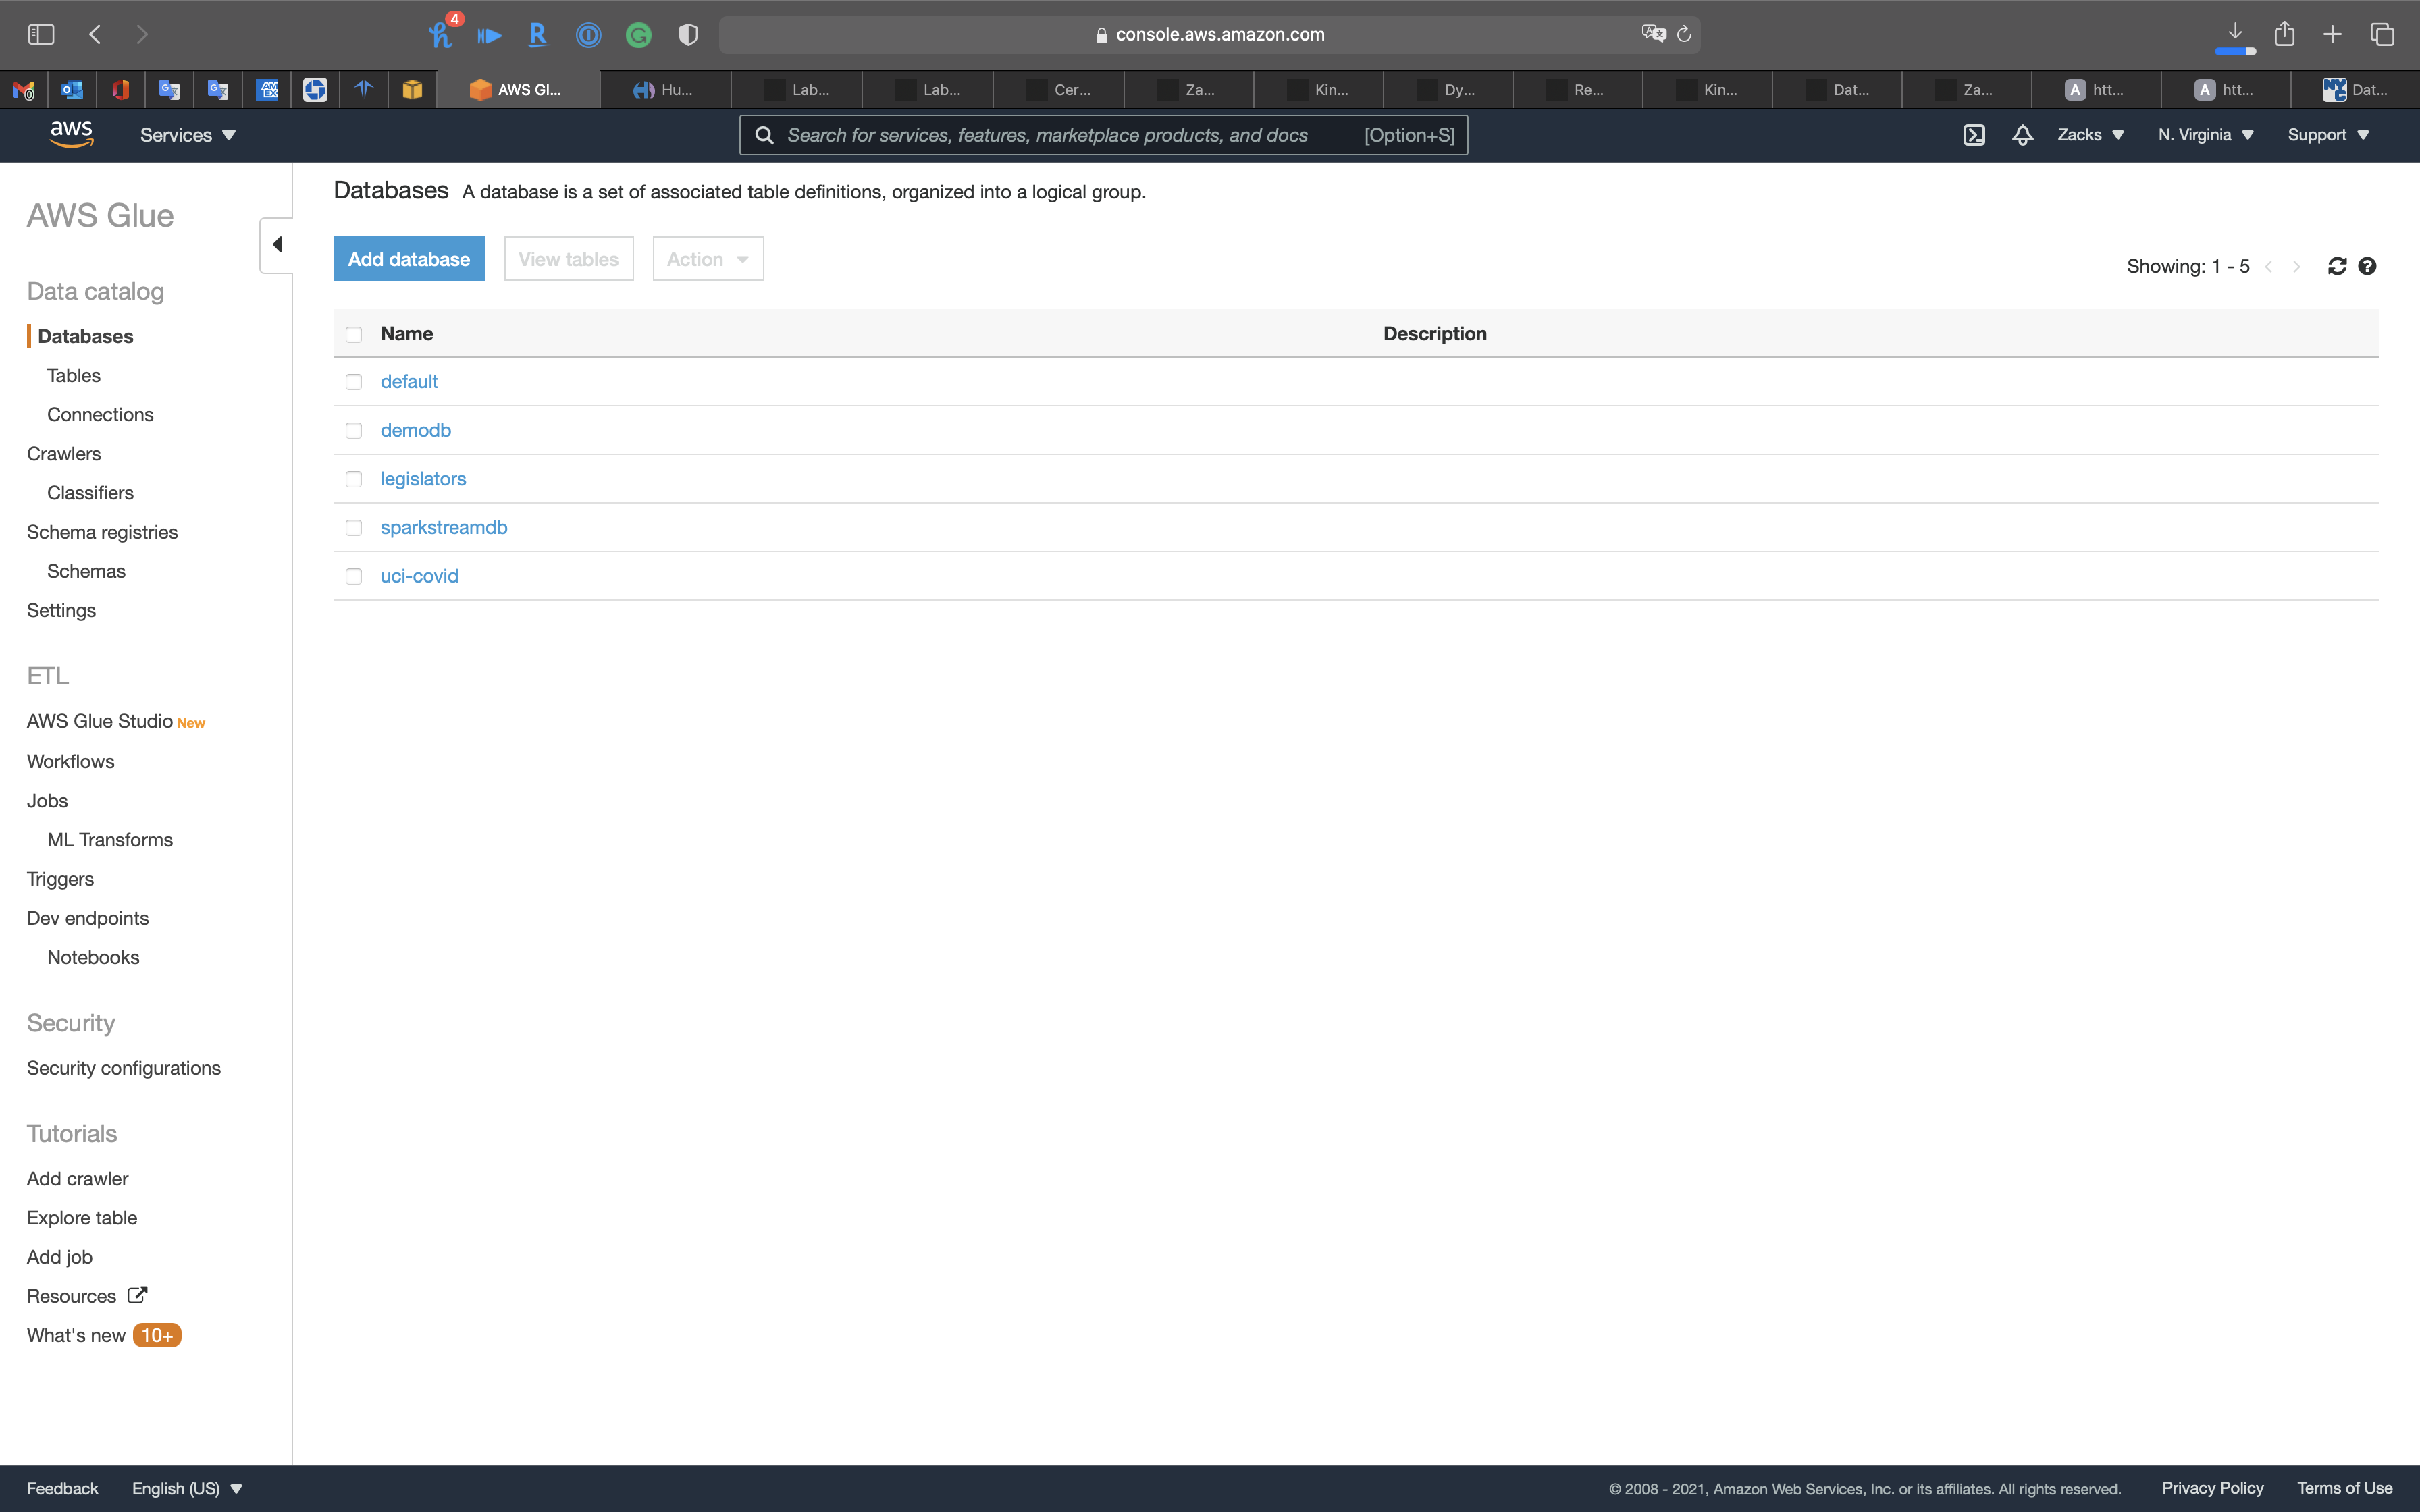
- Database name:
ny_taxi_db - Location:
https://www1.nyc.gov/site/tlc/about/tlc-trip-record-data.page - Description:
New York Taxi Data
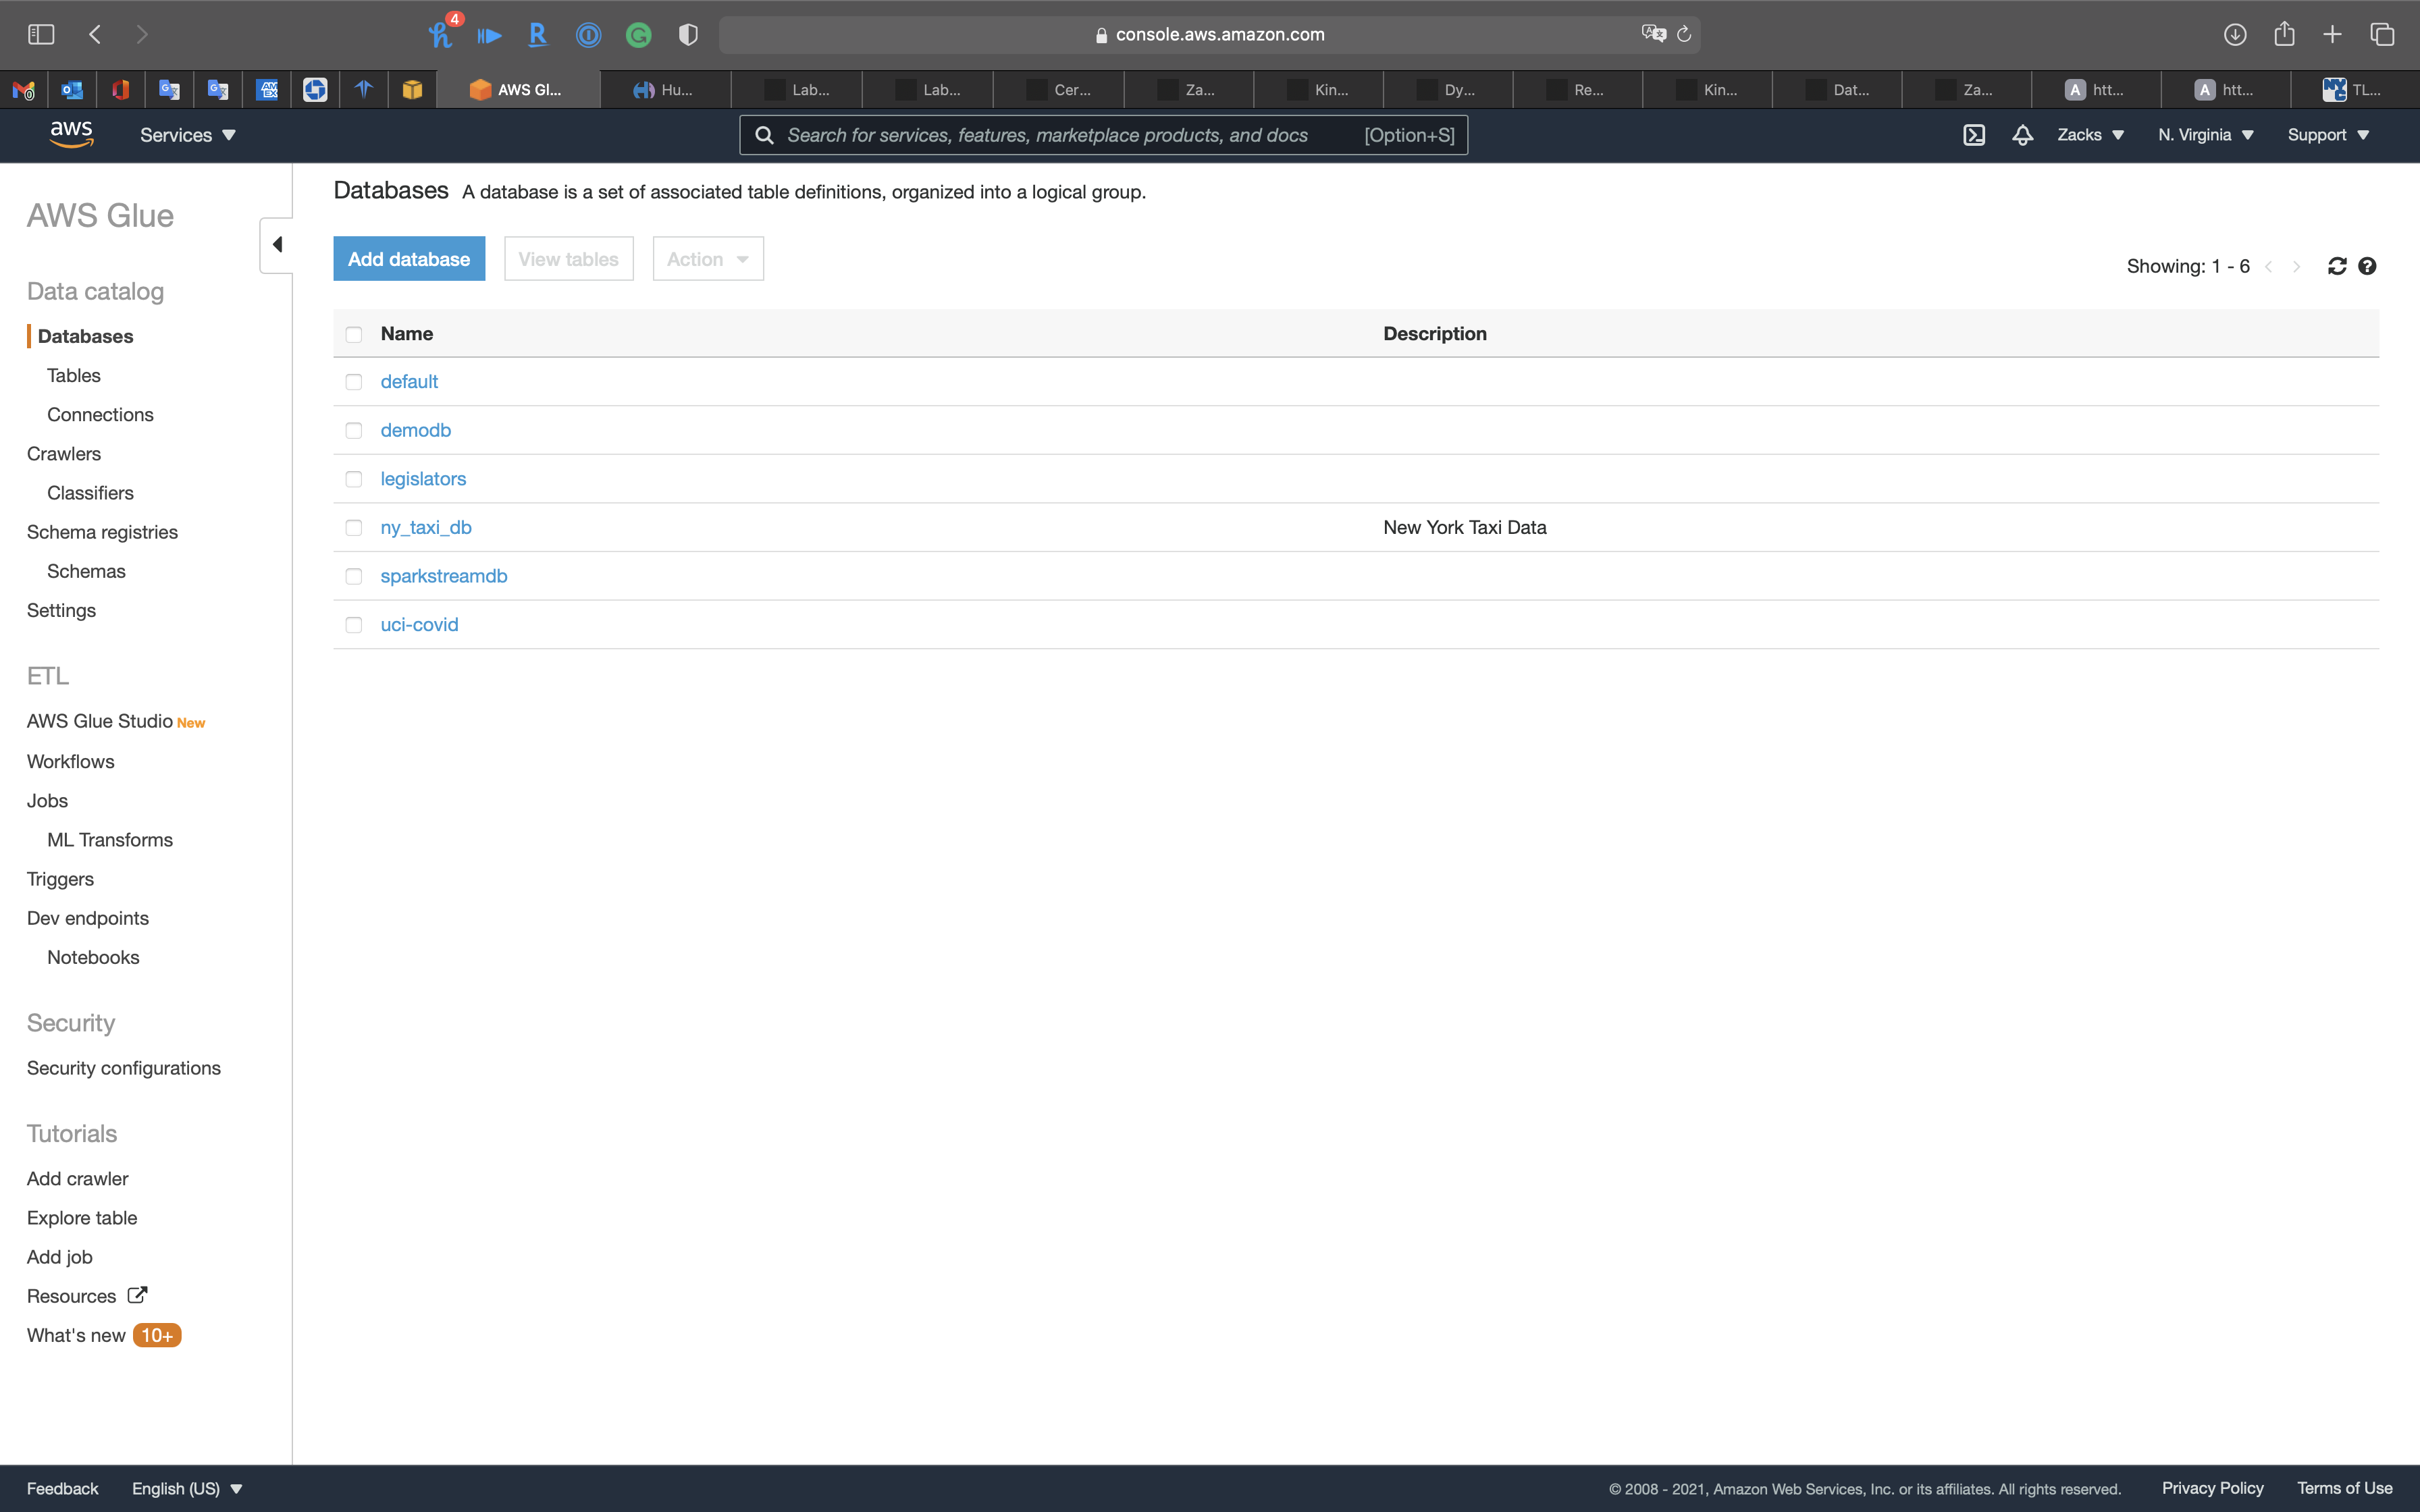
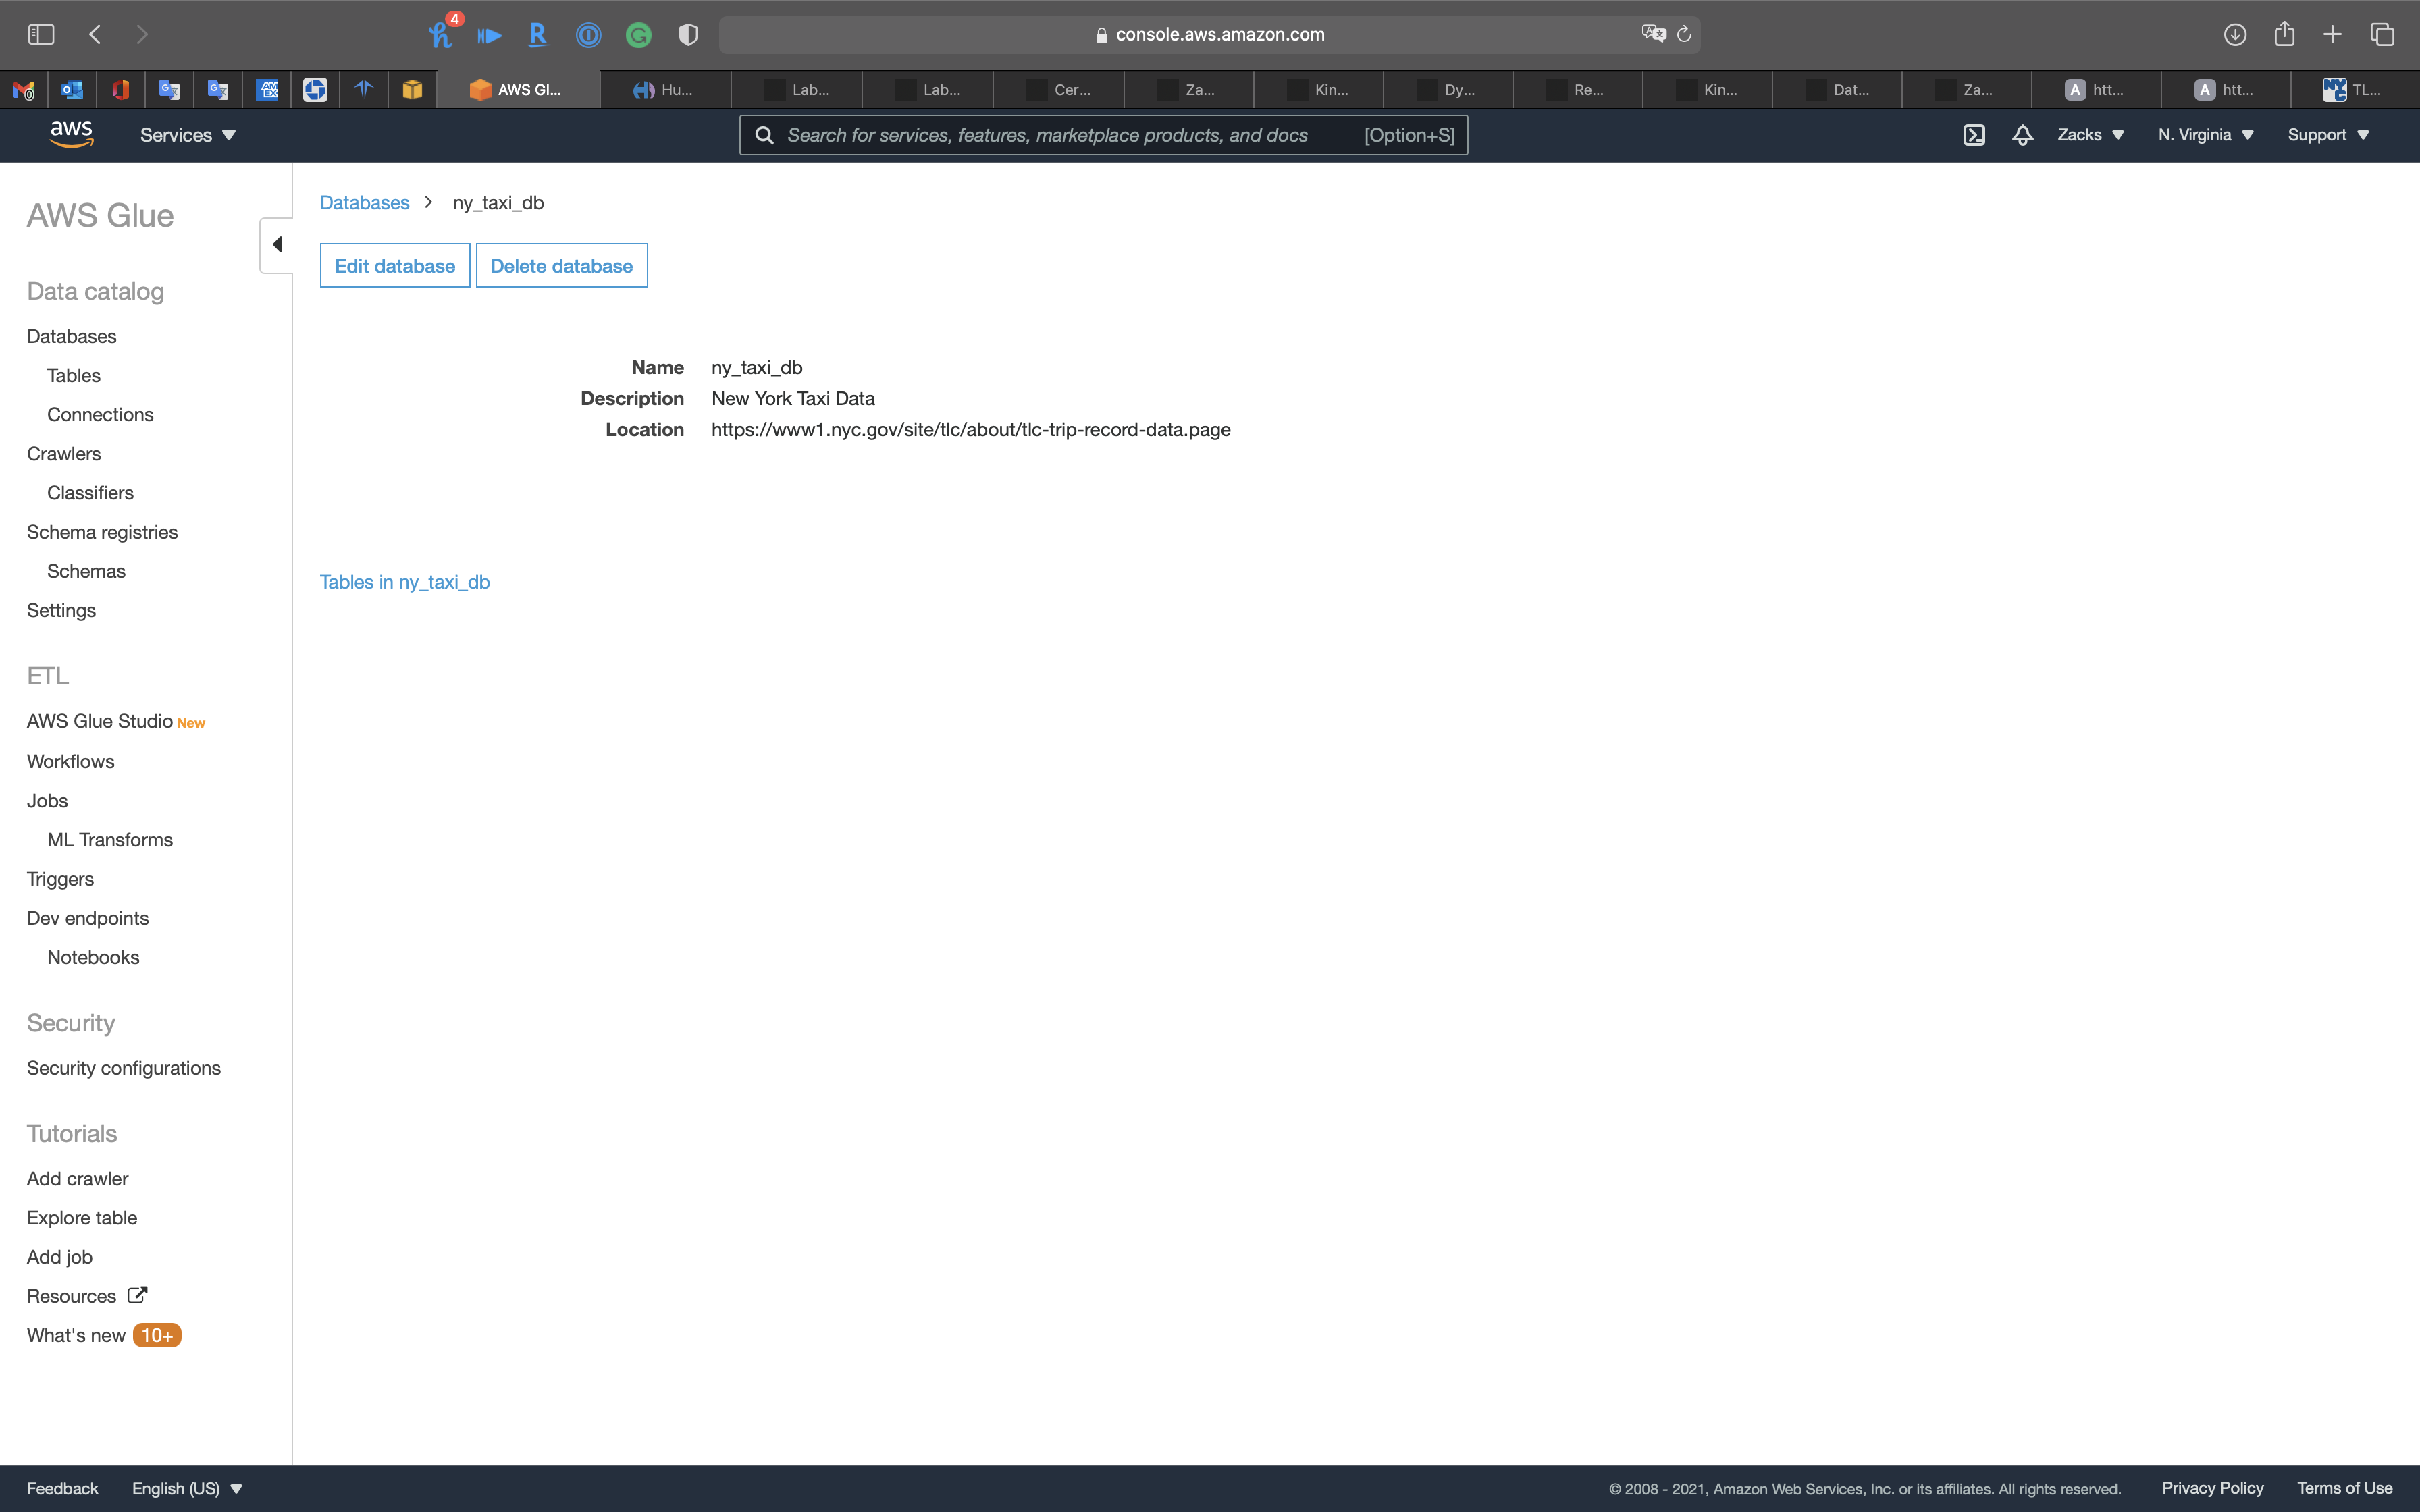
Click ny_taxi_db
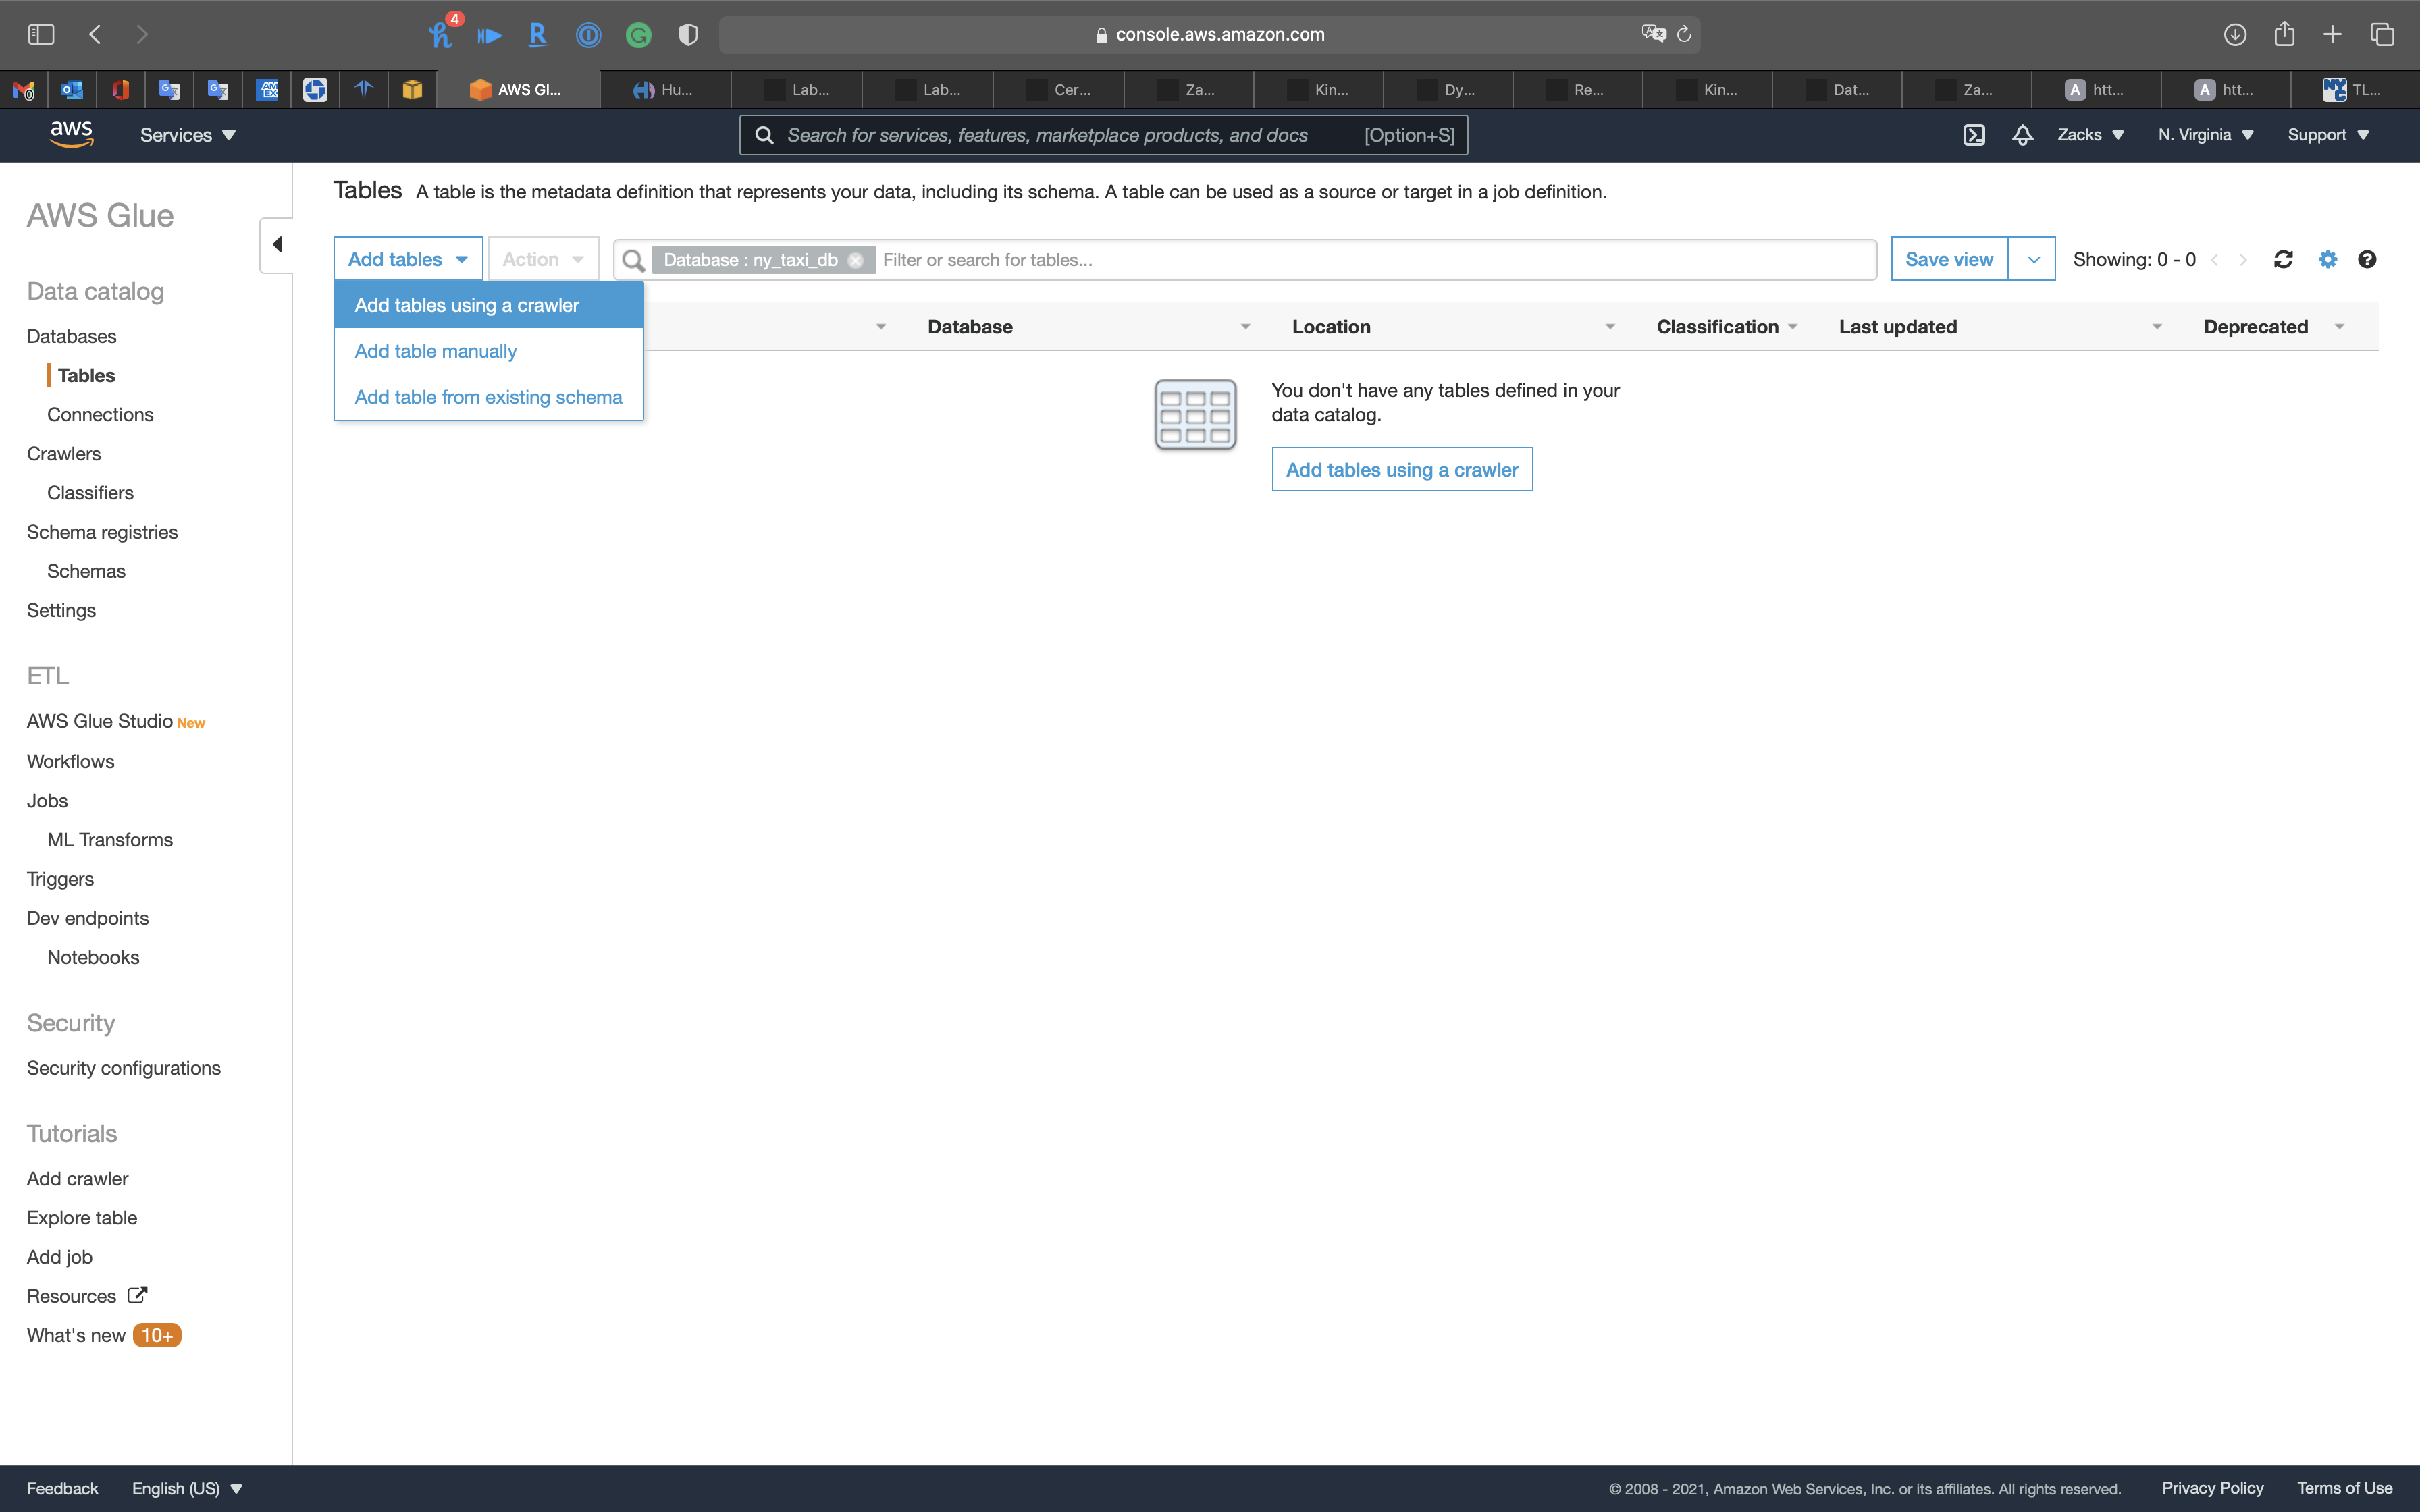
Click on Tables in ny_taxi_db
Click on Create tables using a crawler
Create Raw Data Table through Crawler
Use Crawler to craw the .csv metadata.
Crawler Info
- Crawler name:
ny_taxi_crawler
Click on Next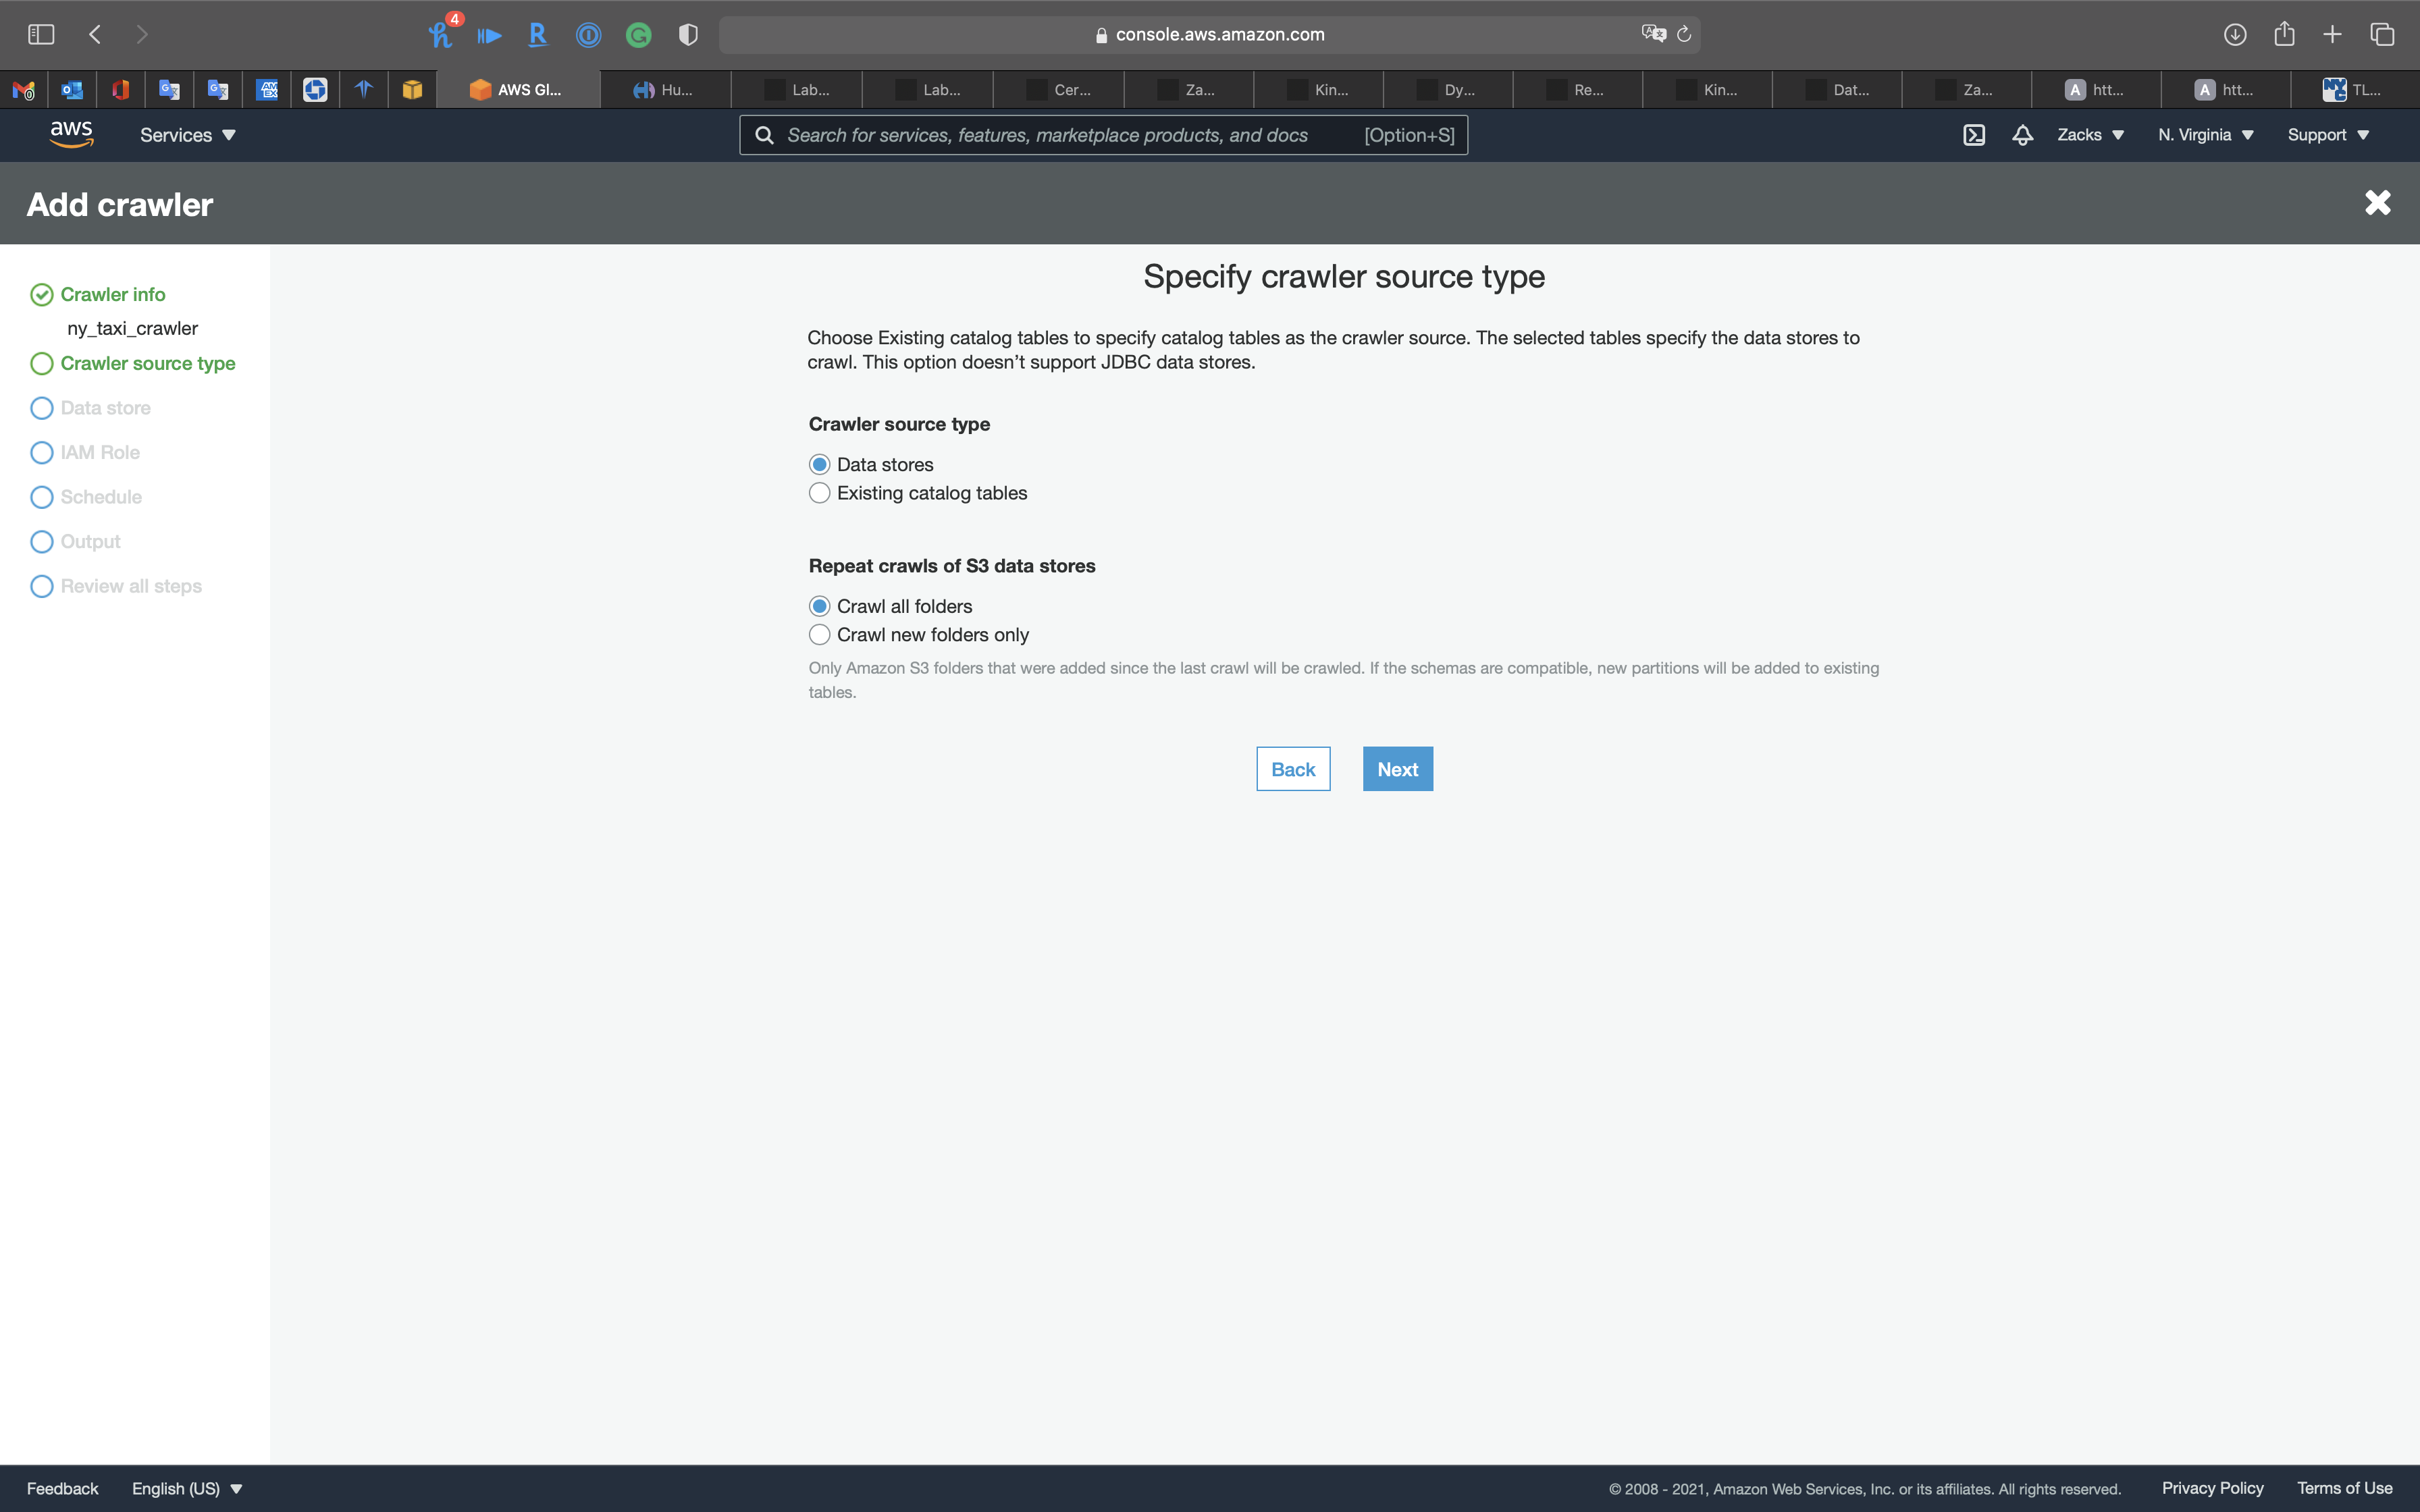
Crawler source type
Click on Next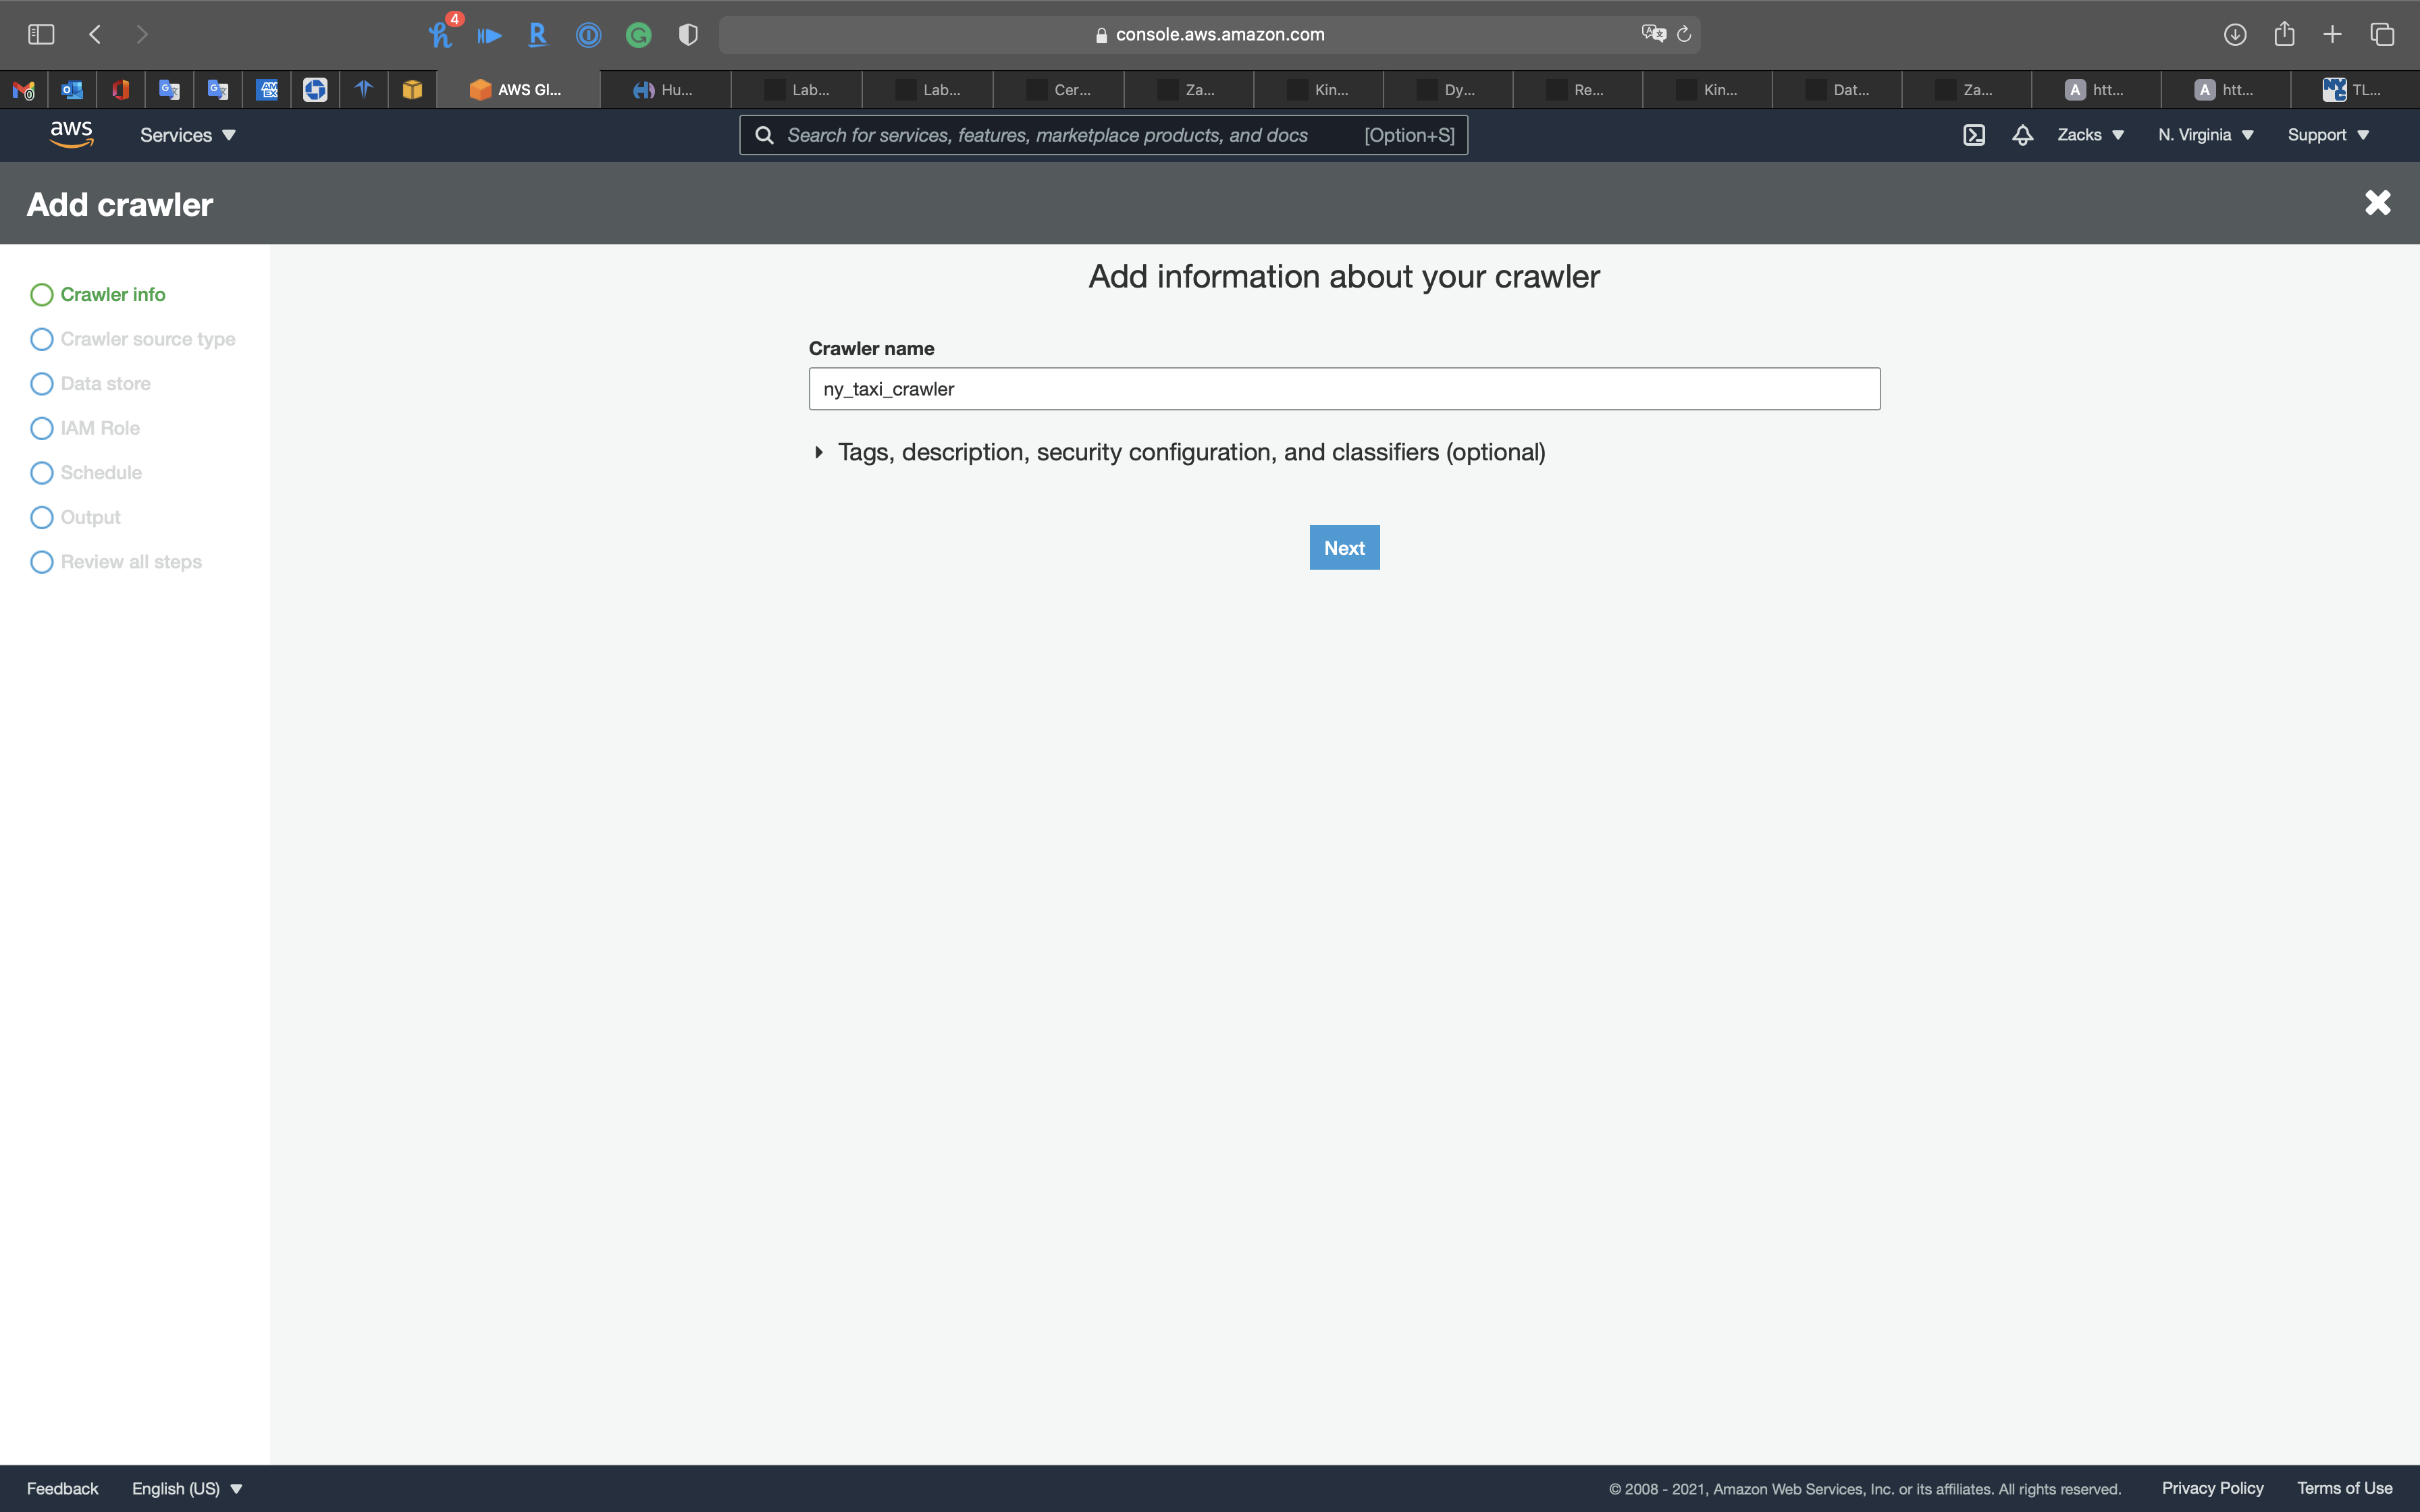
Data store
- Choose a data store:
S3 - Include path: your S3 bucket
Click on Next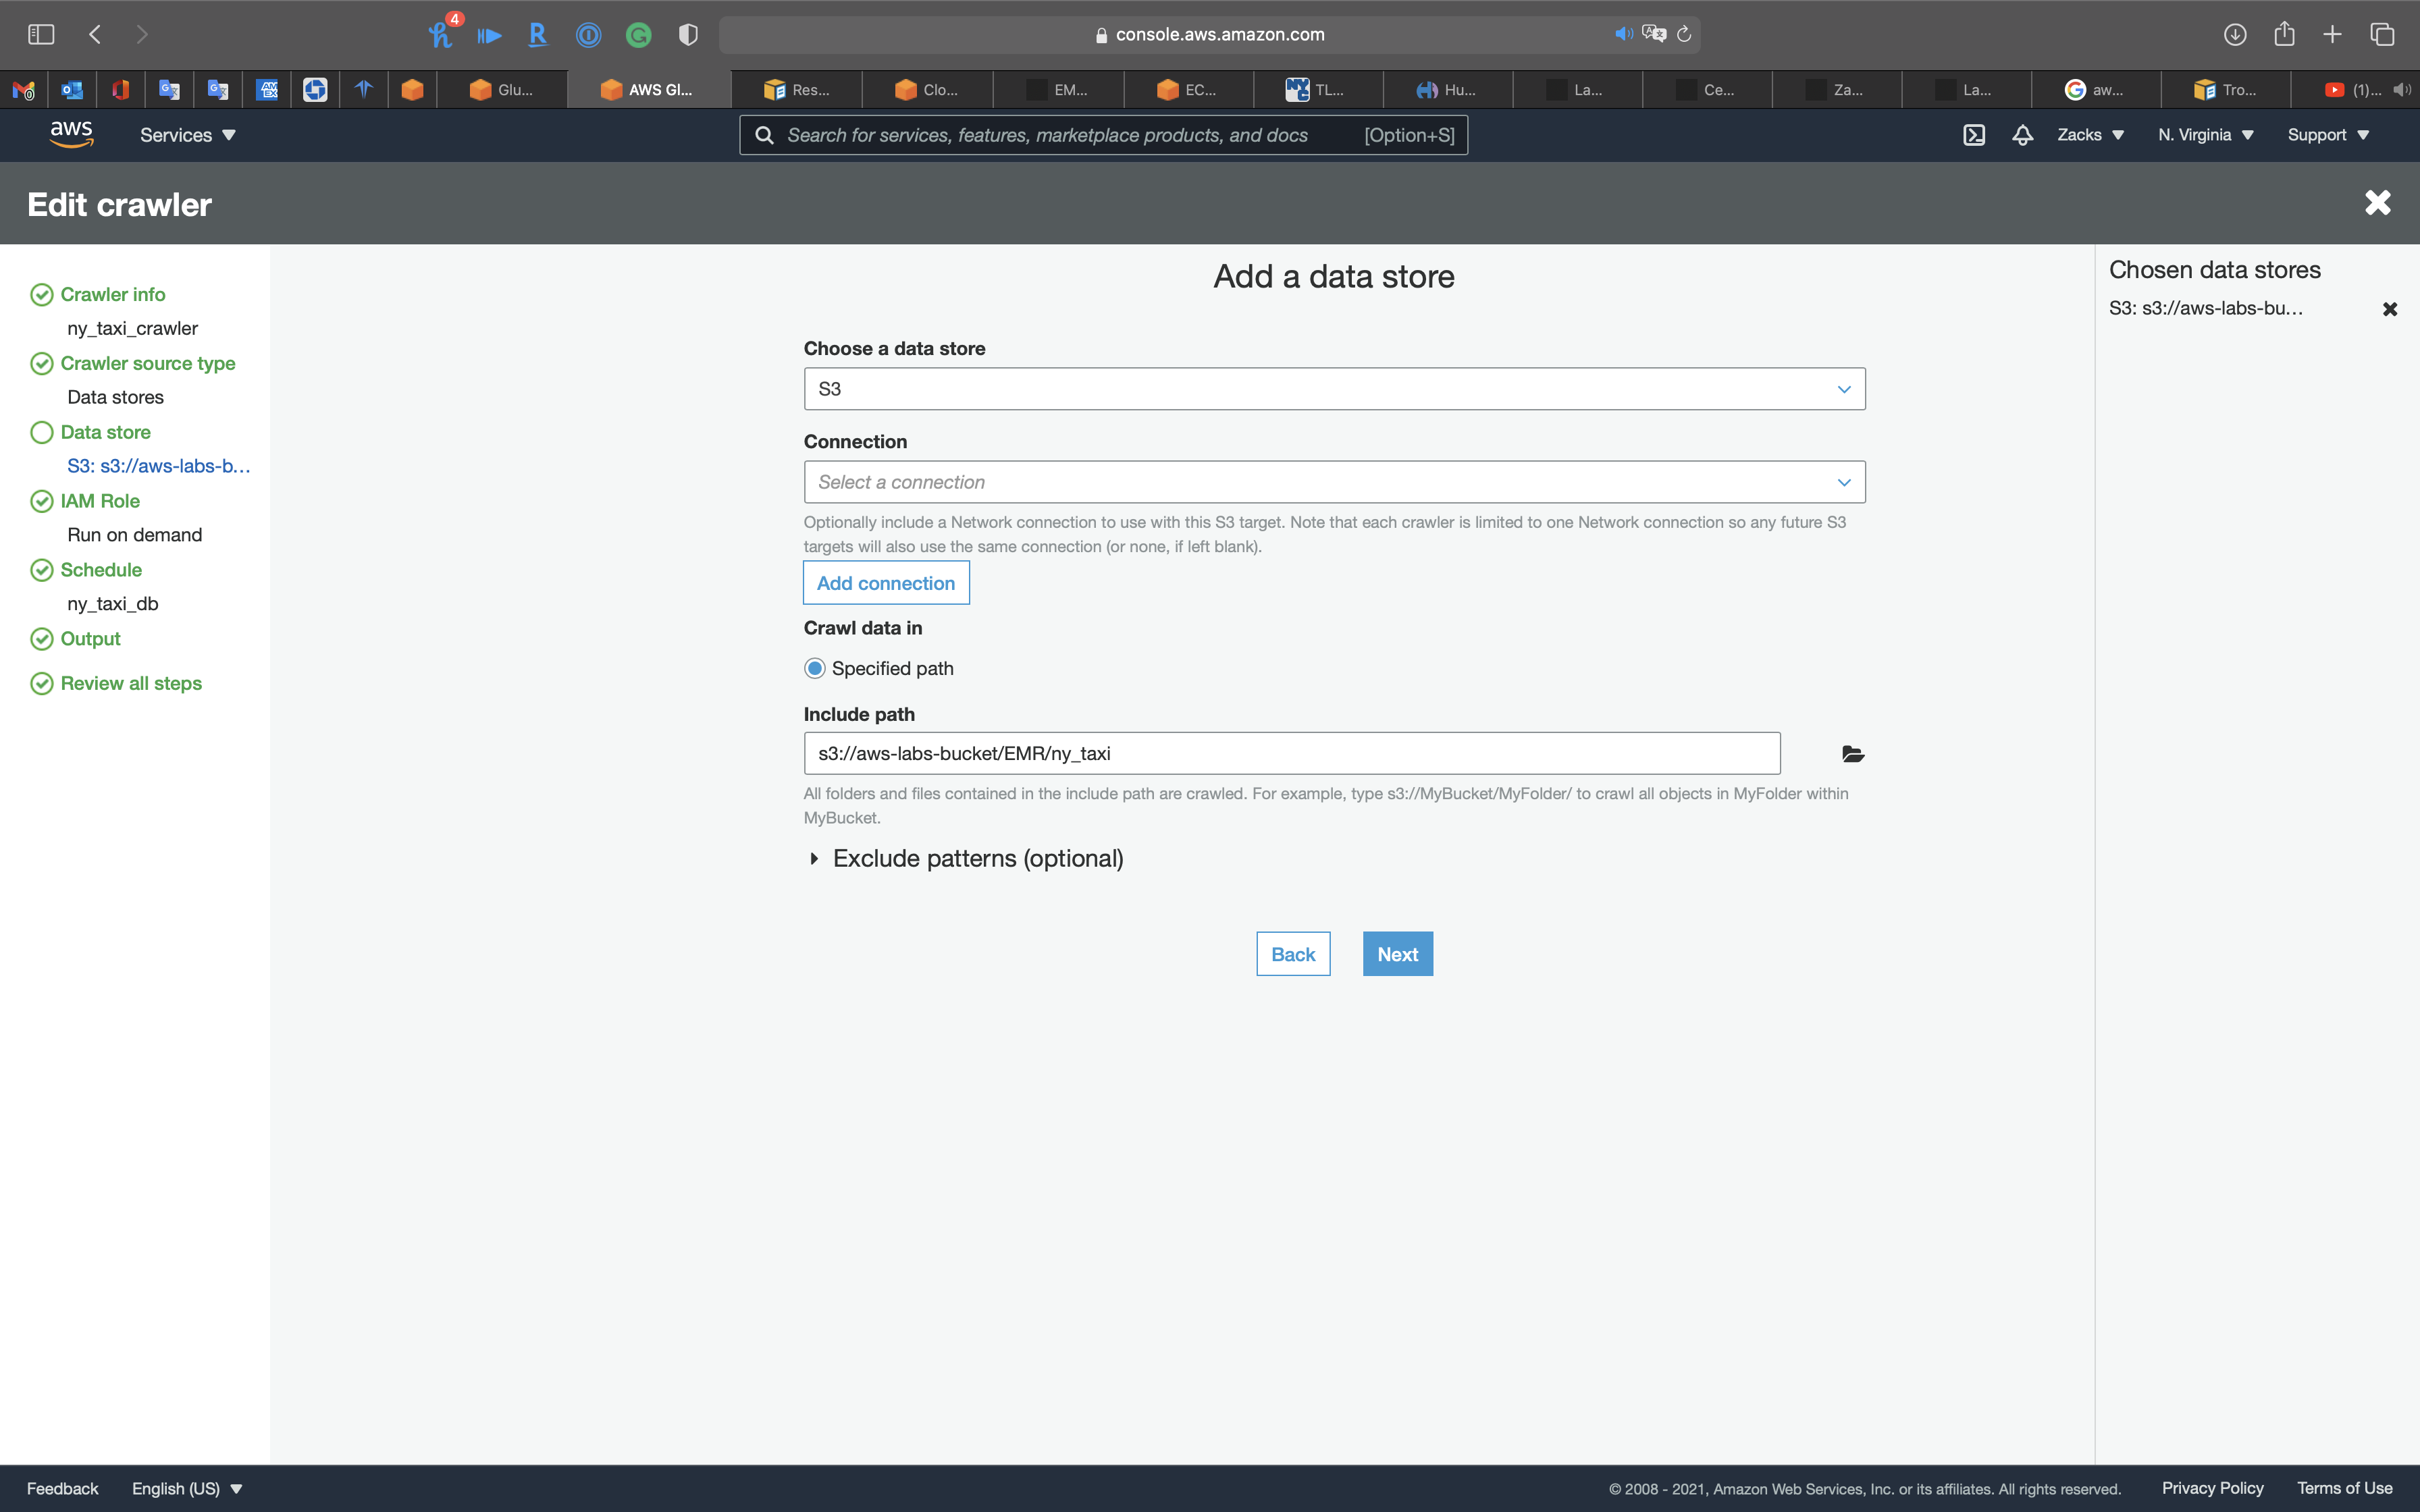
Click on Next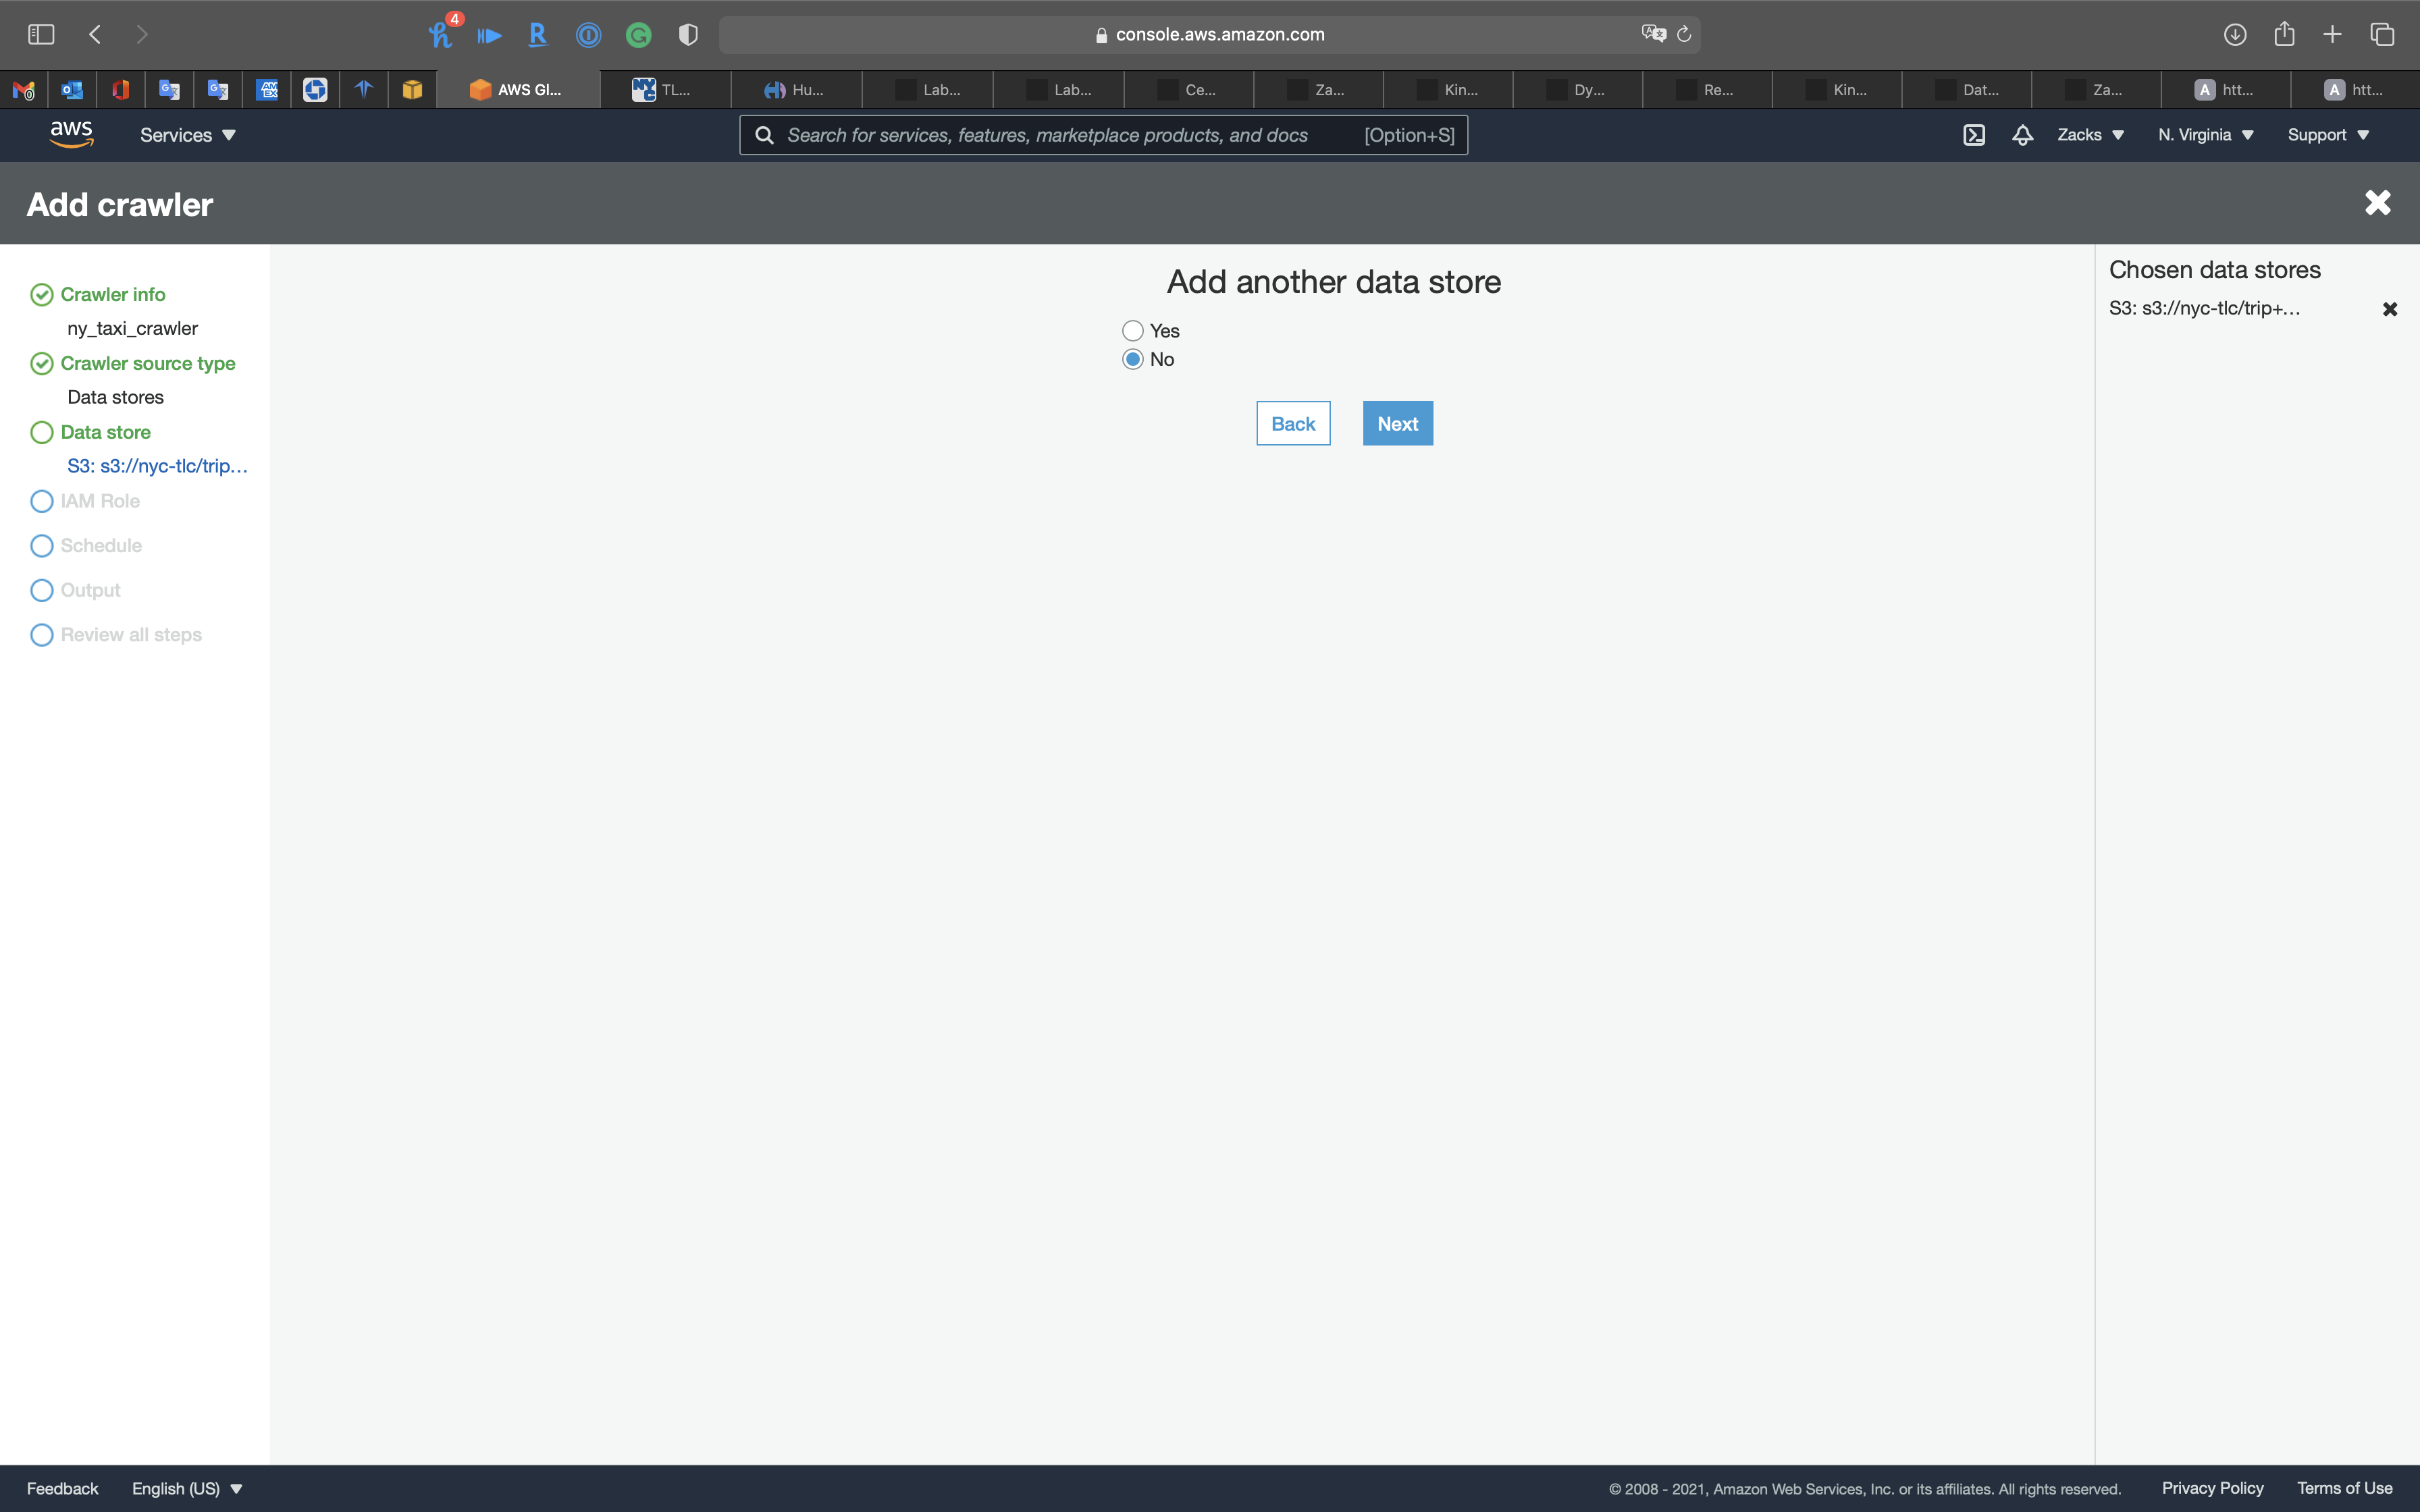
IAM Role
Create a new IAM Role or choose an existing IAM Role if you have.
Policies:
AmazonS3FullAccessAmazonKinesisFullAccessAWSGlueServiceRole
Click on Next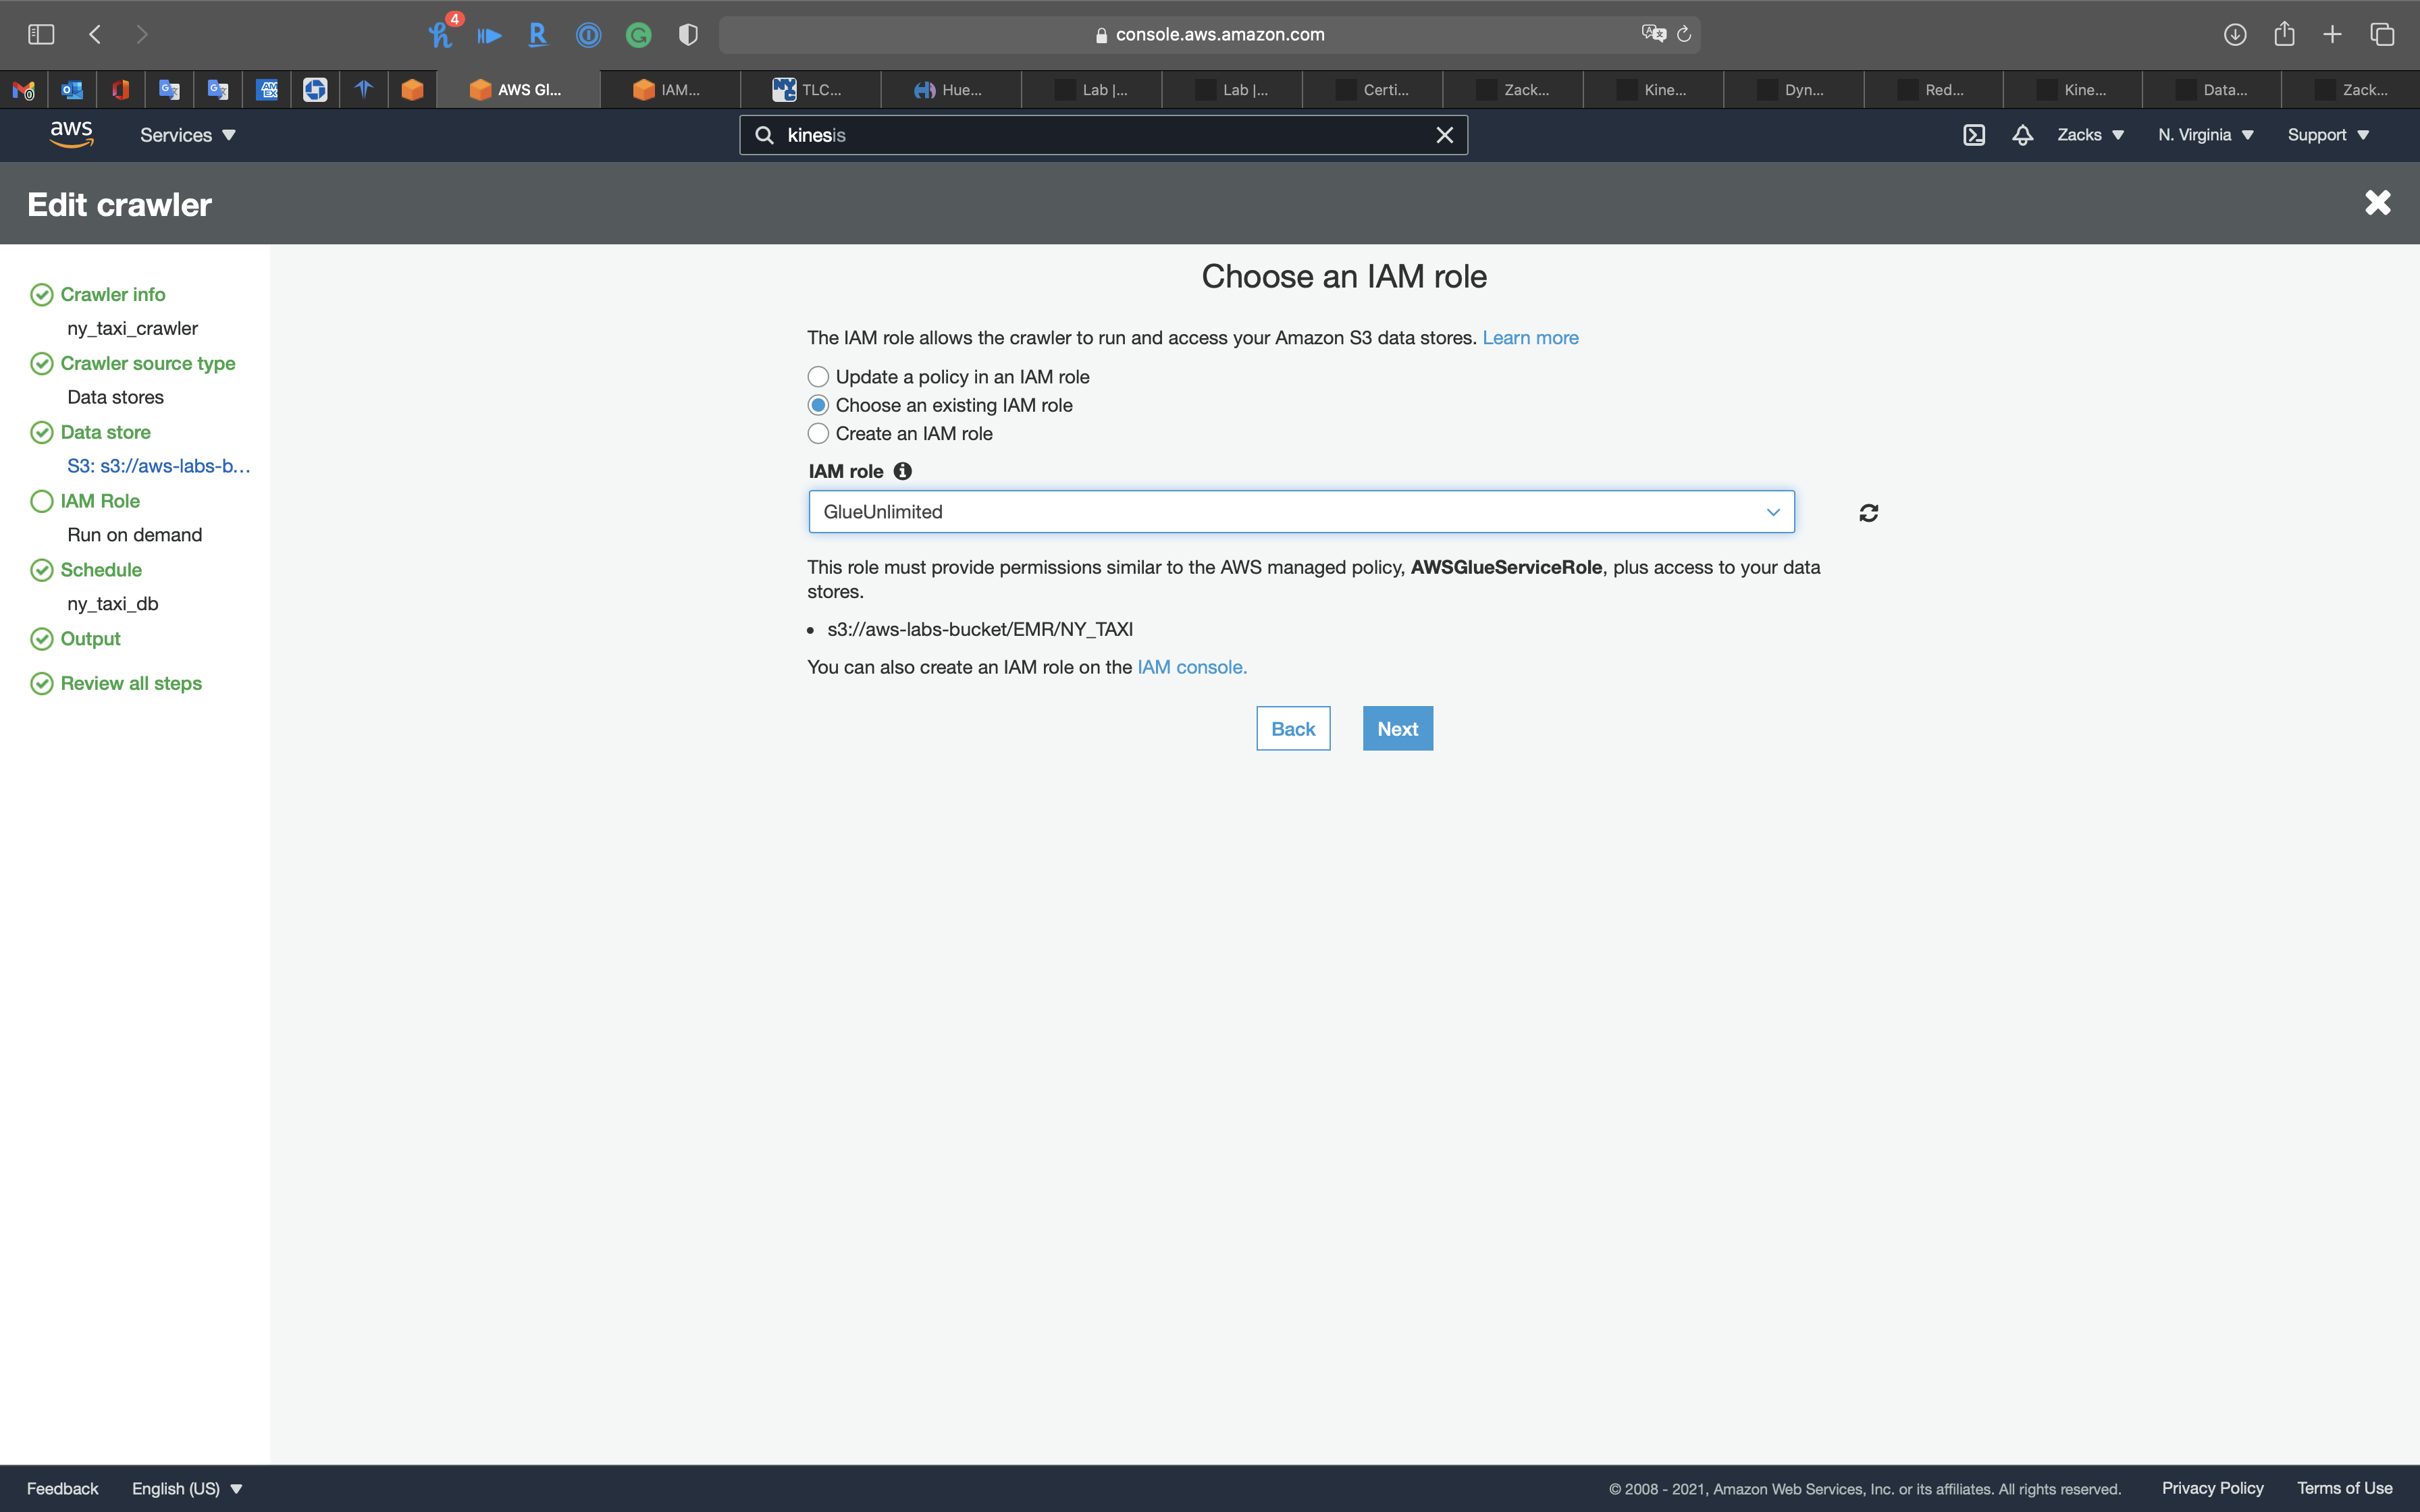
Schedule
- Frequency:
Run on demand
Click on Next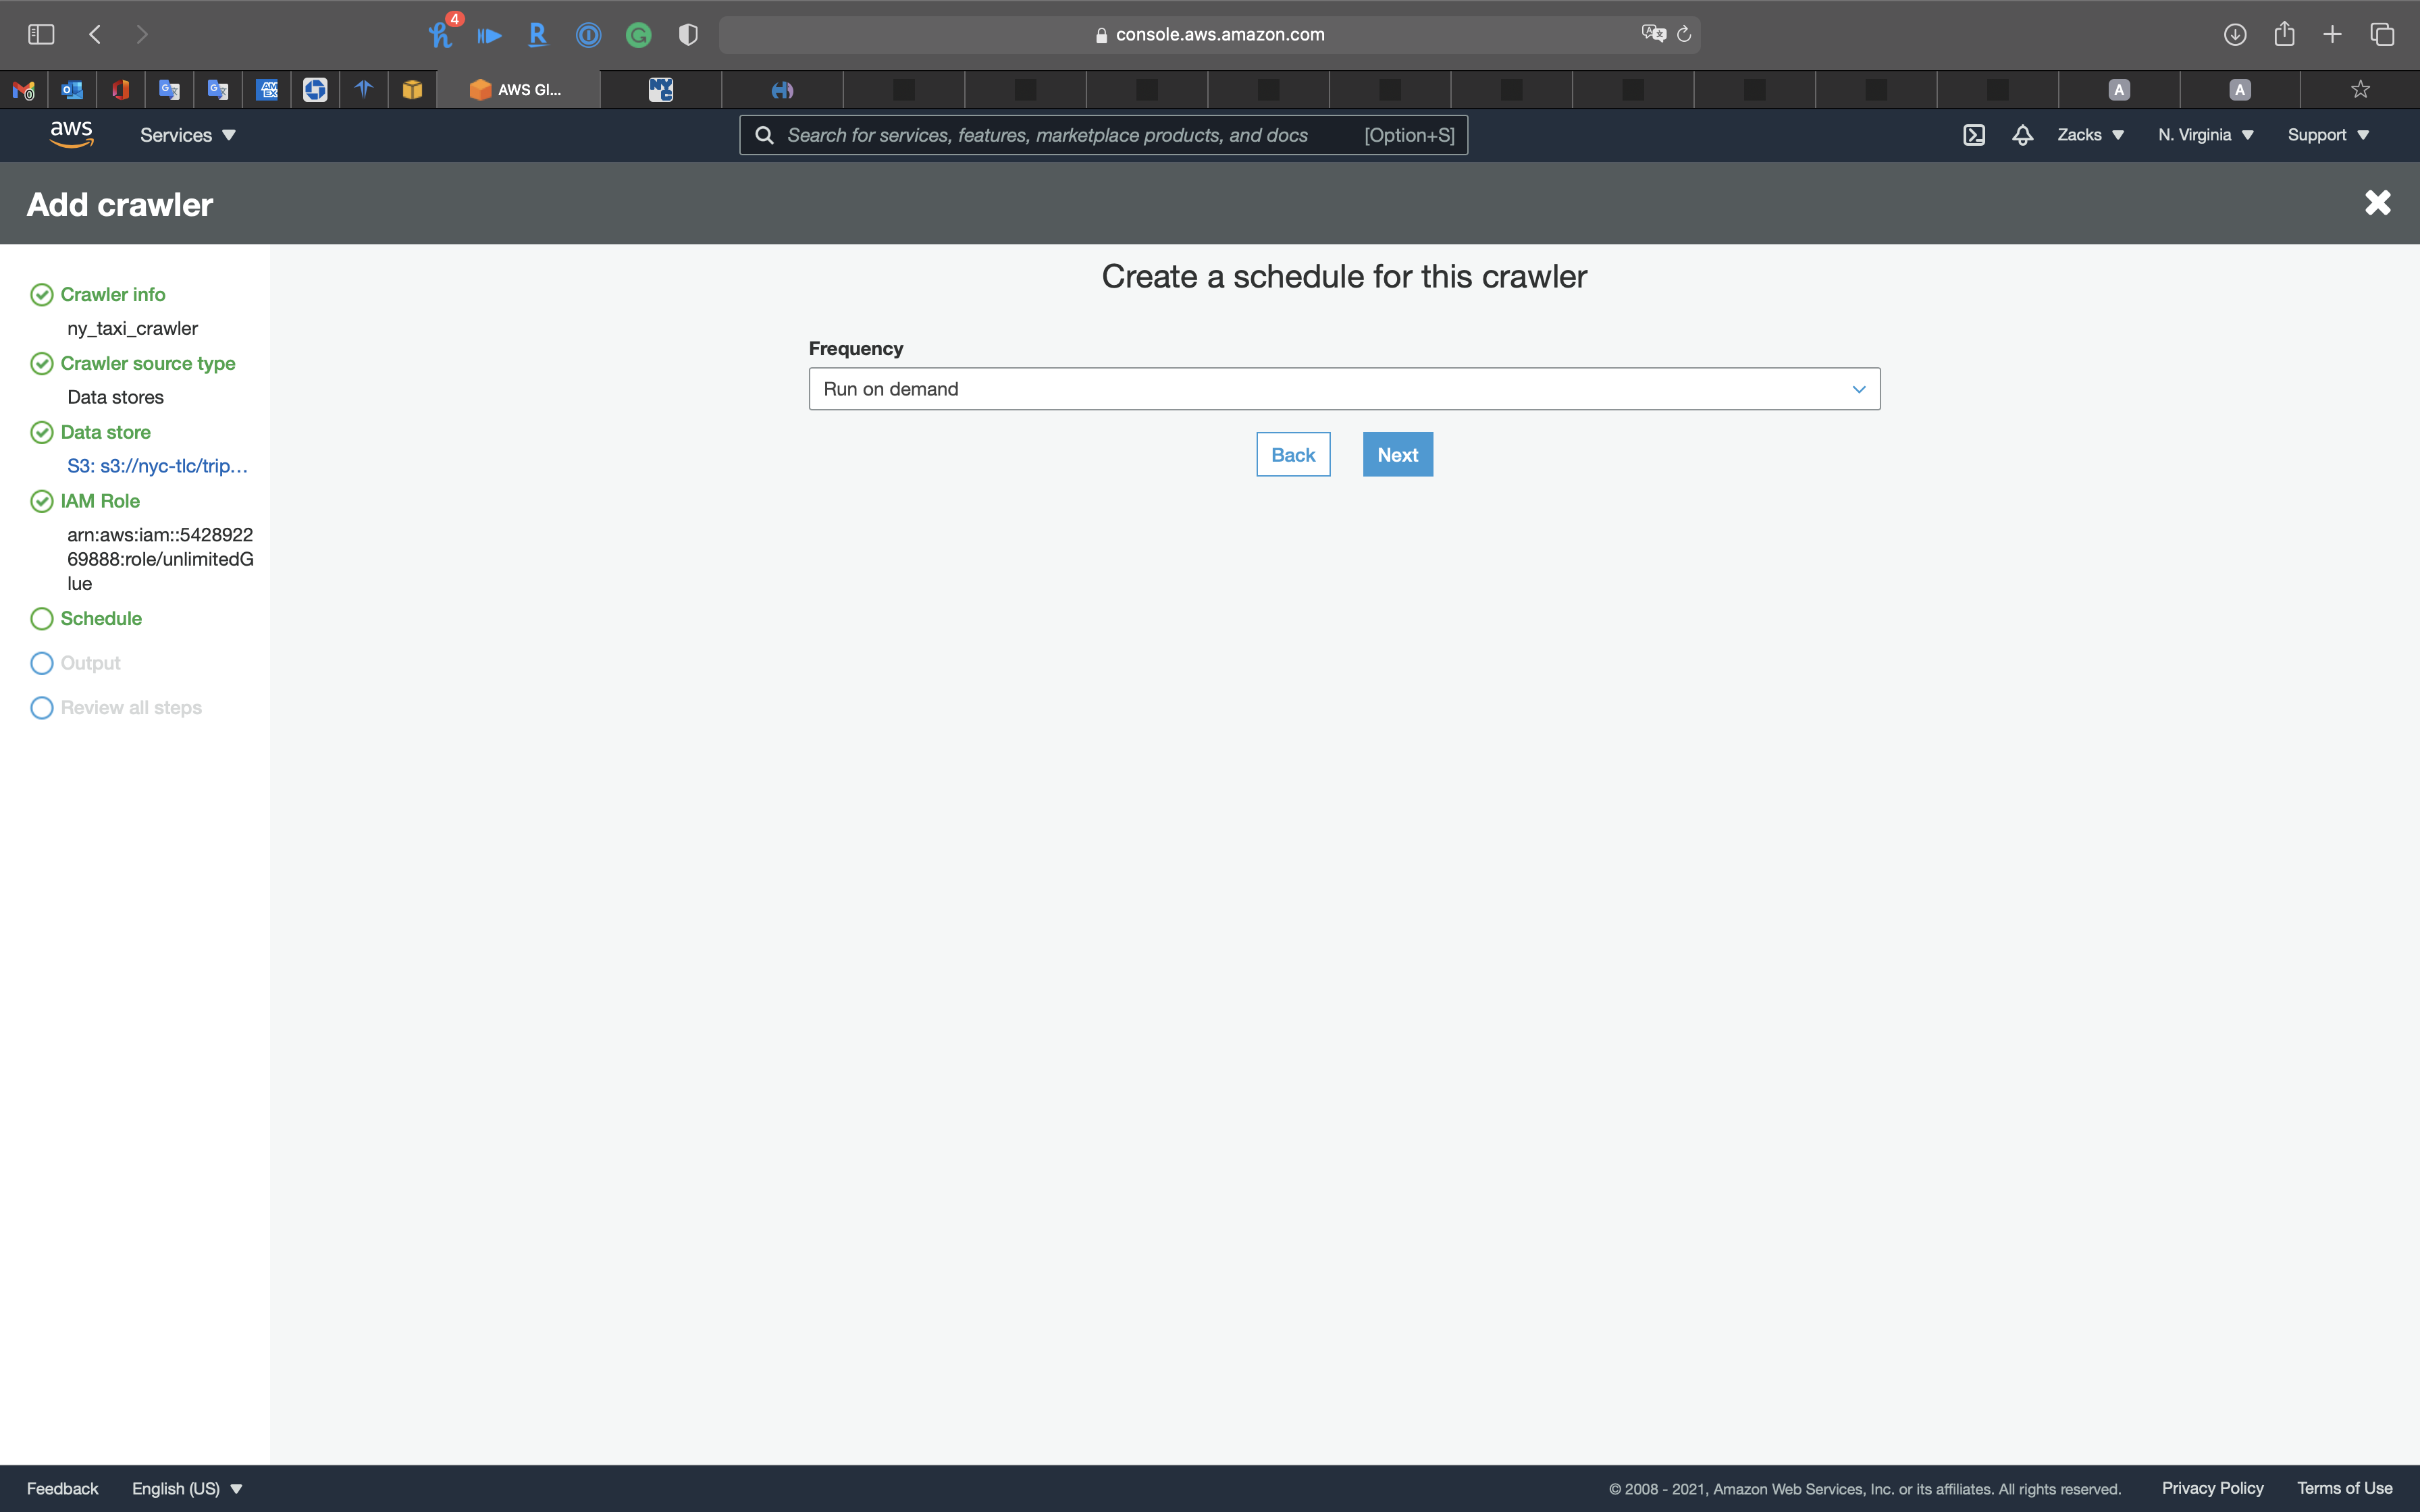
Output
- Database:
ny_taxi_db
Click on Next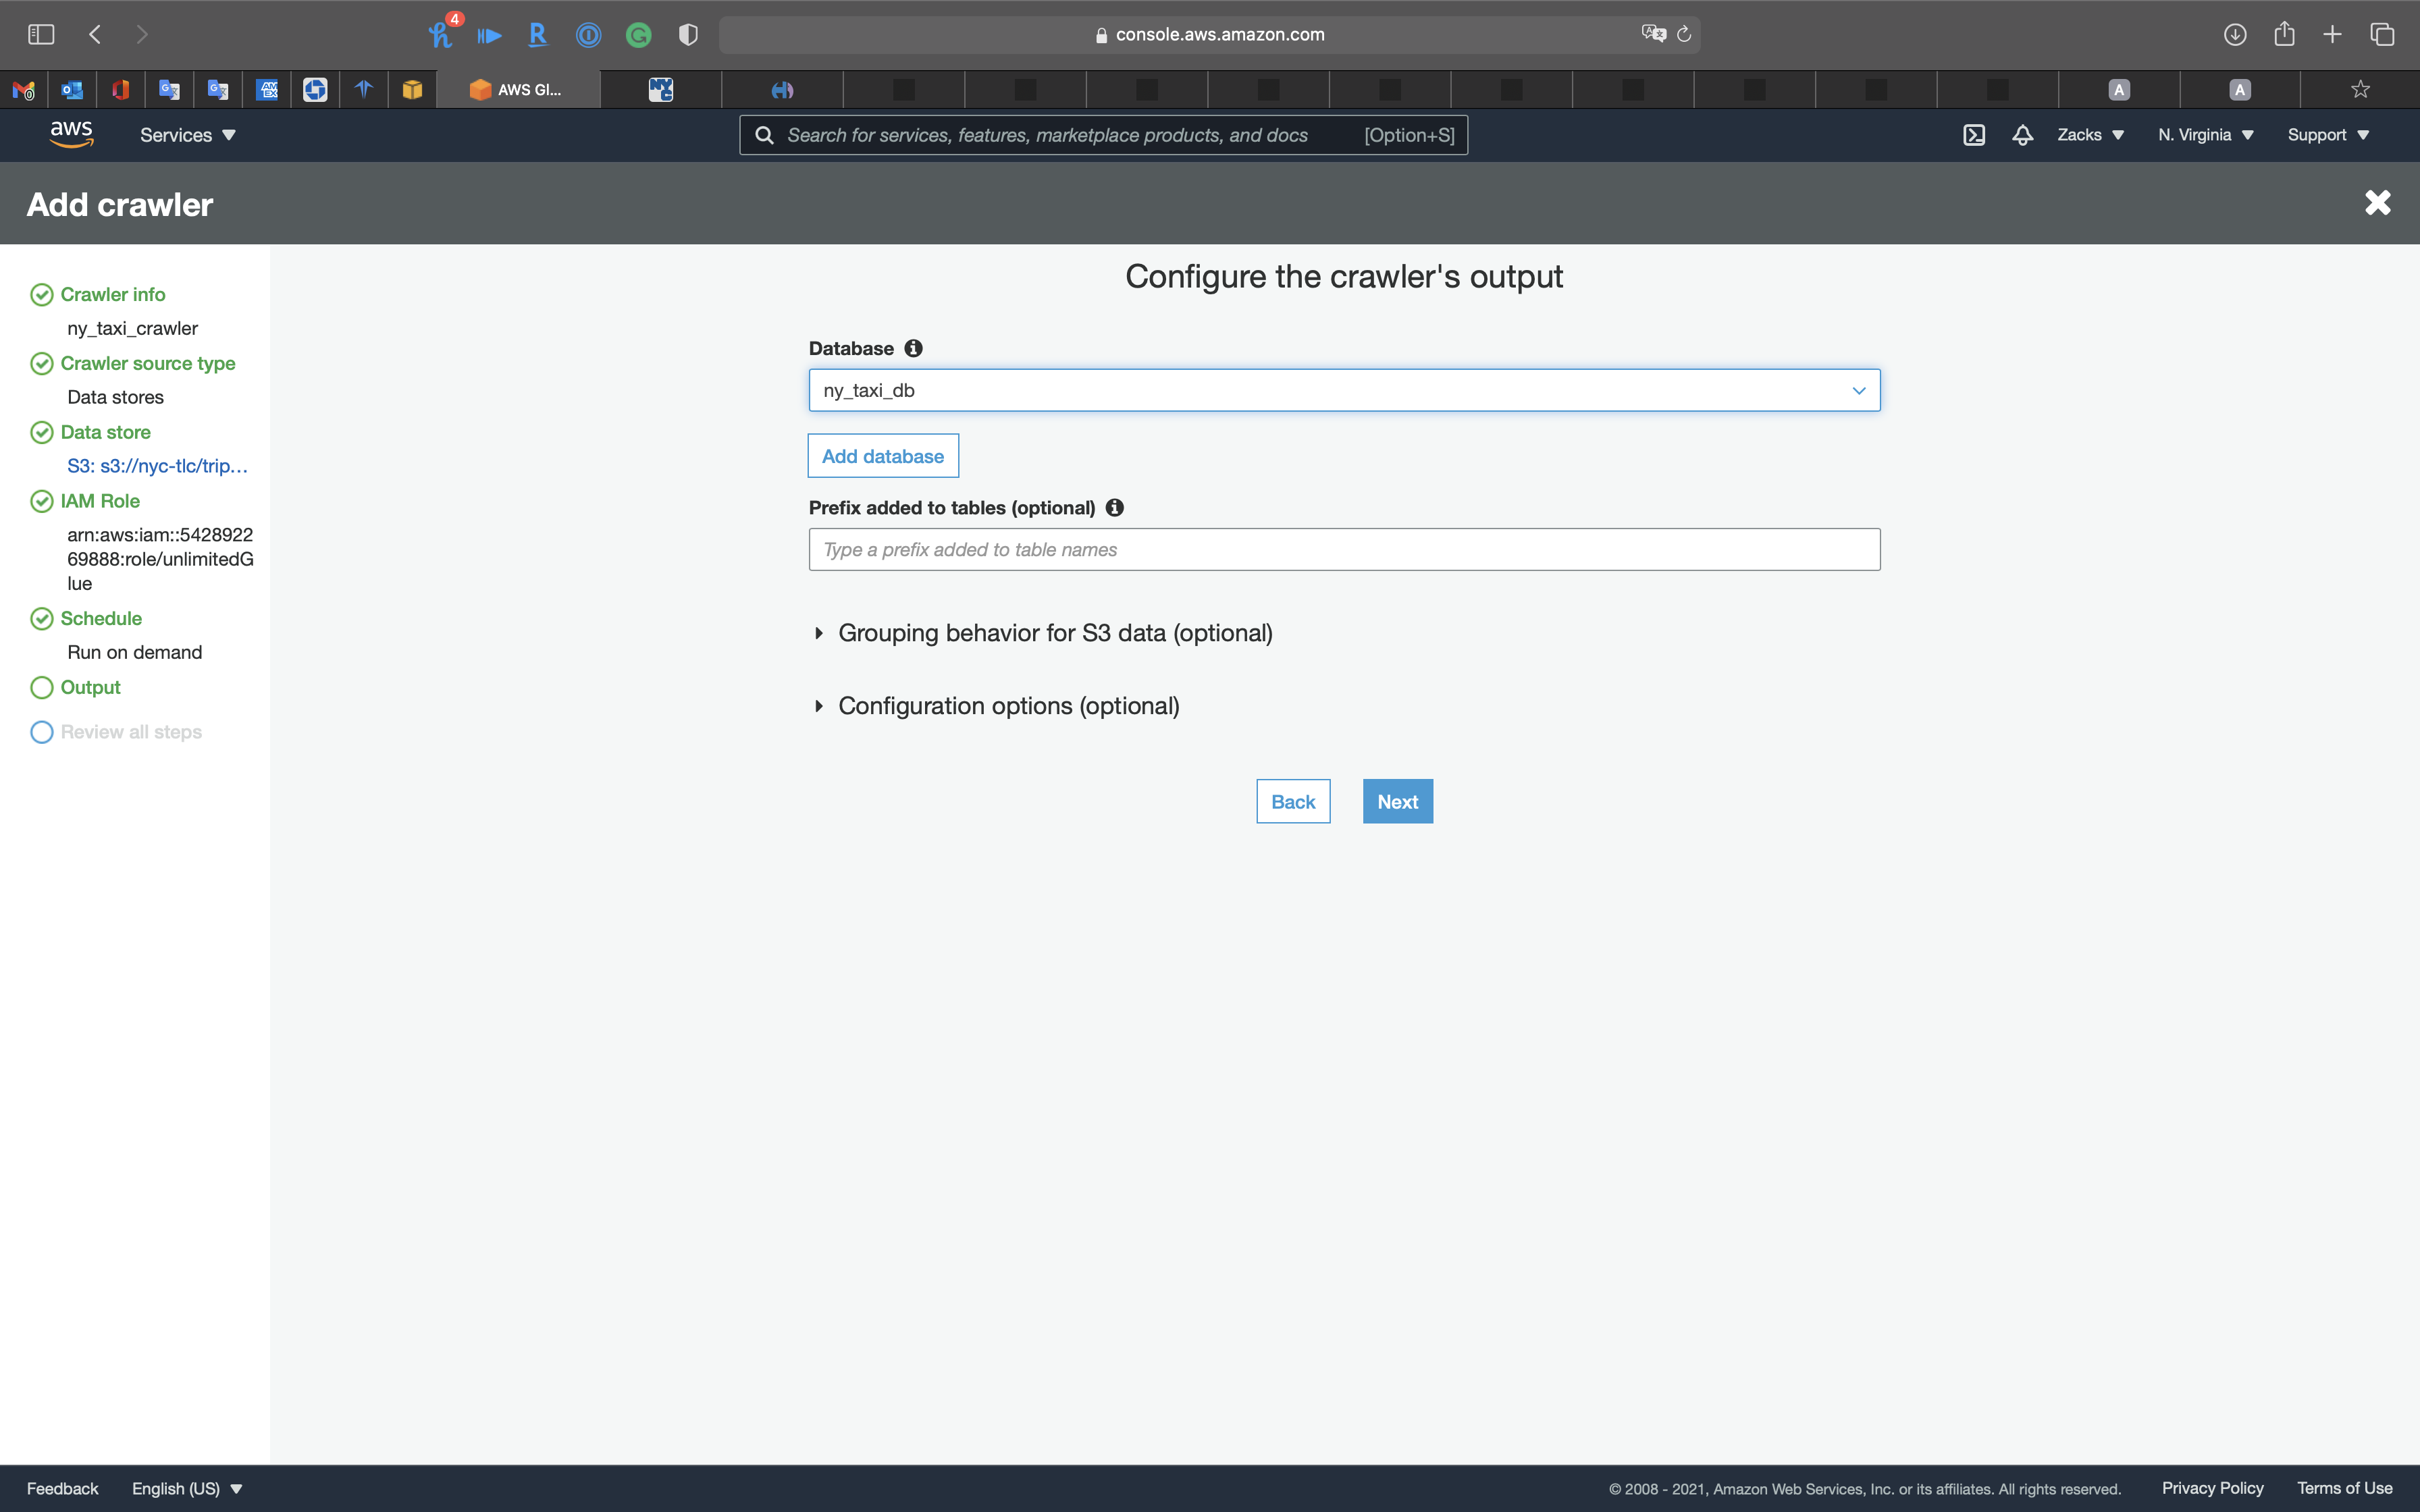
Review all steps
Click on Next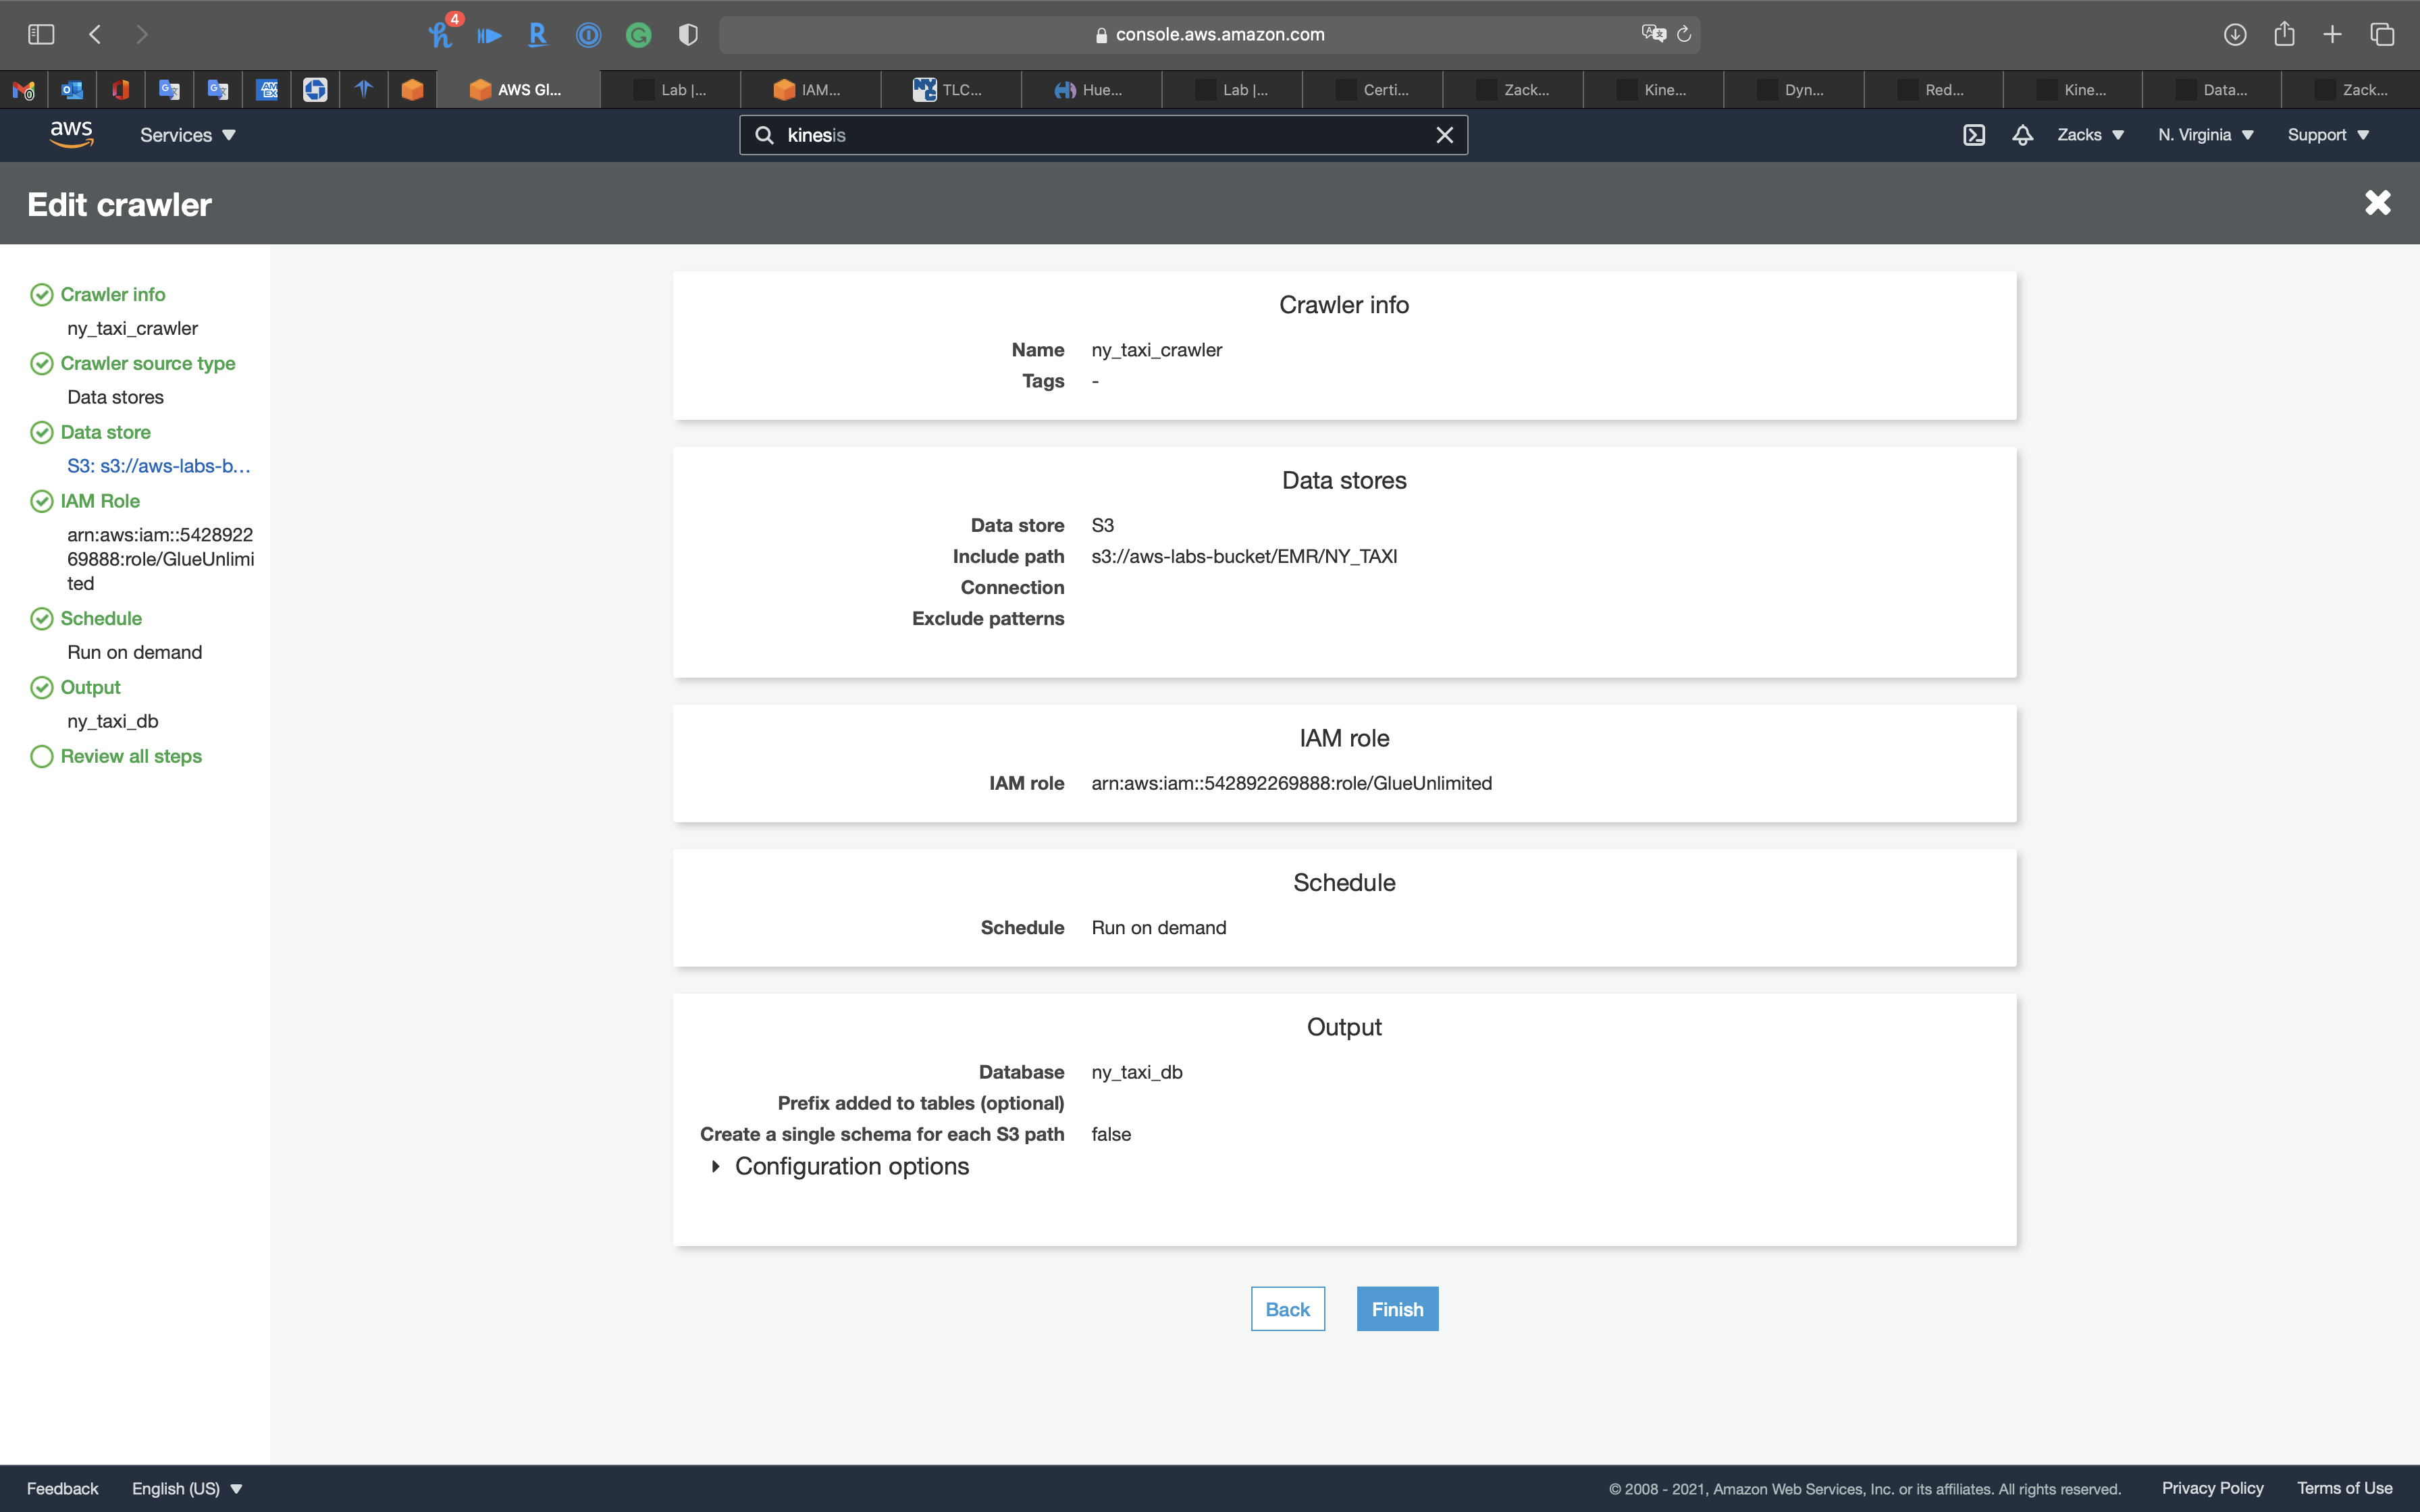
Select the Crawler, and click on Run crawler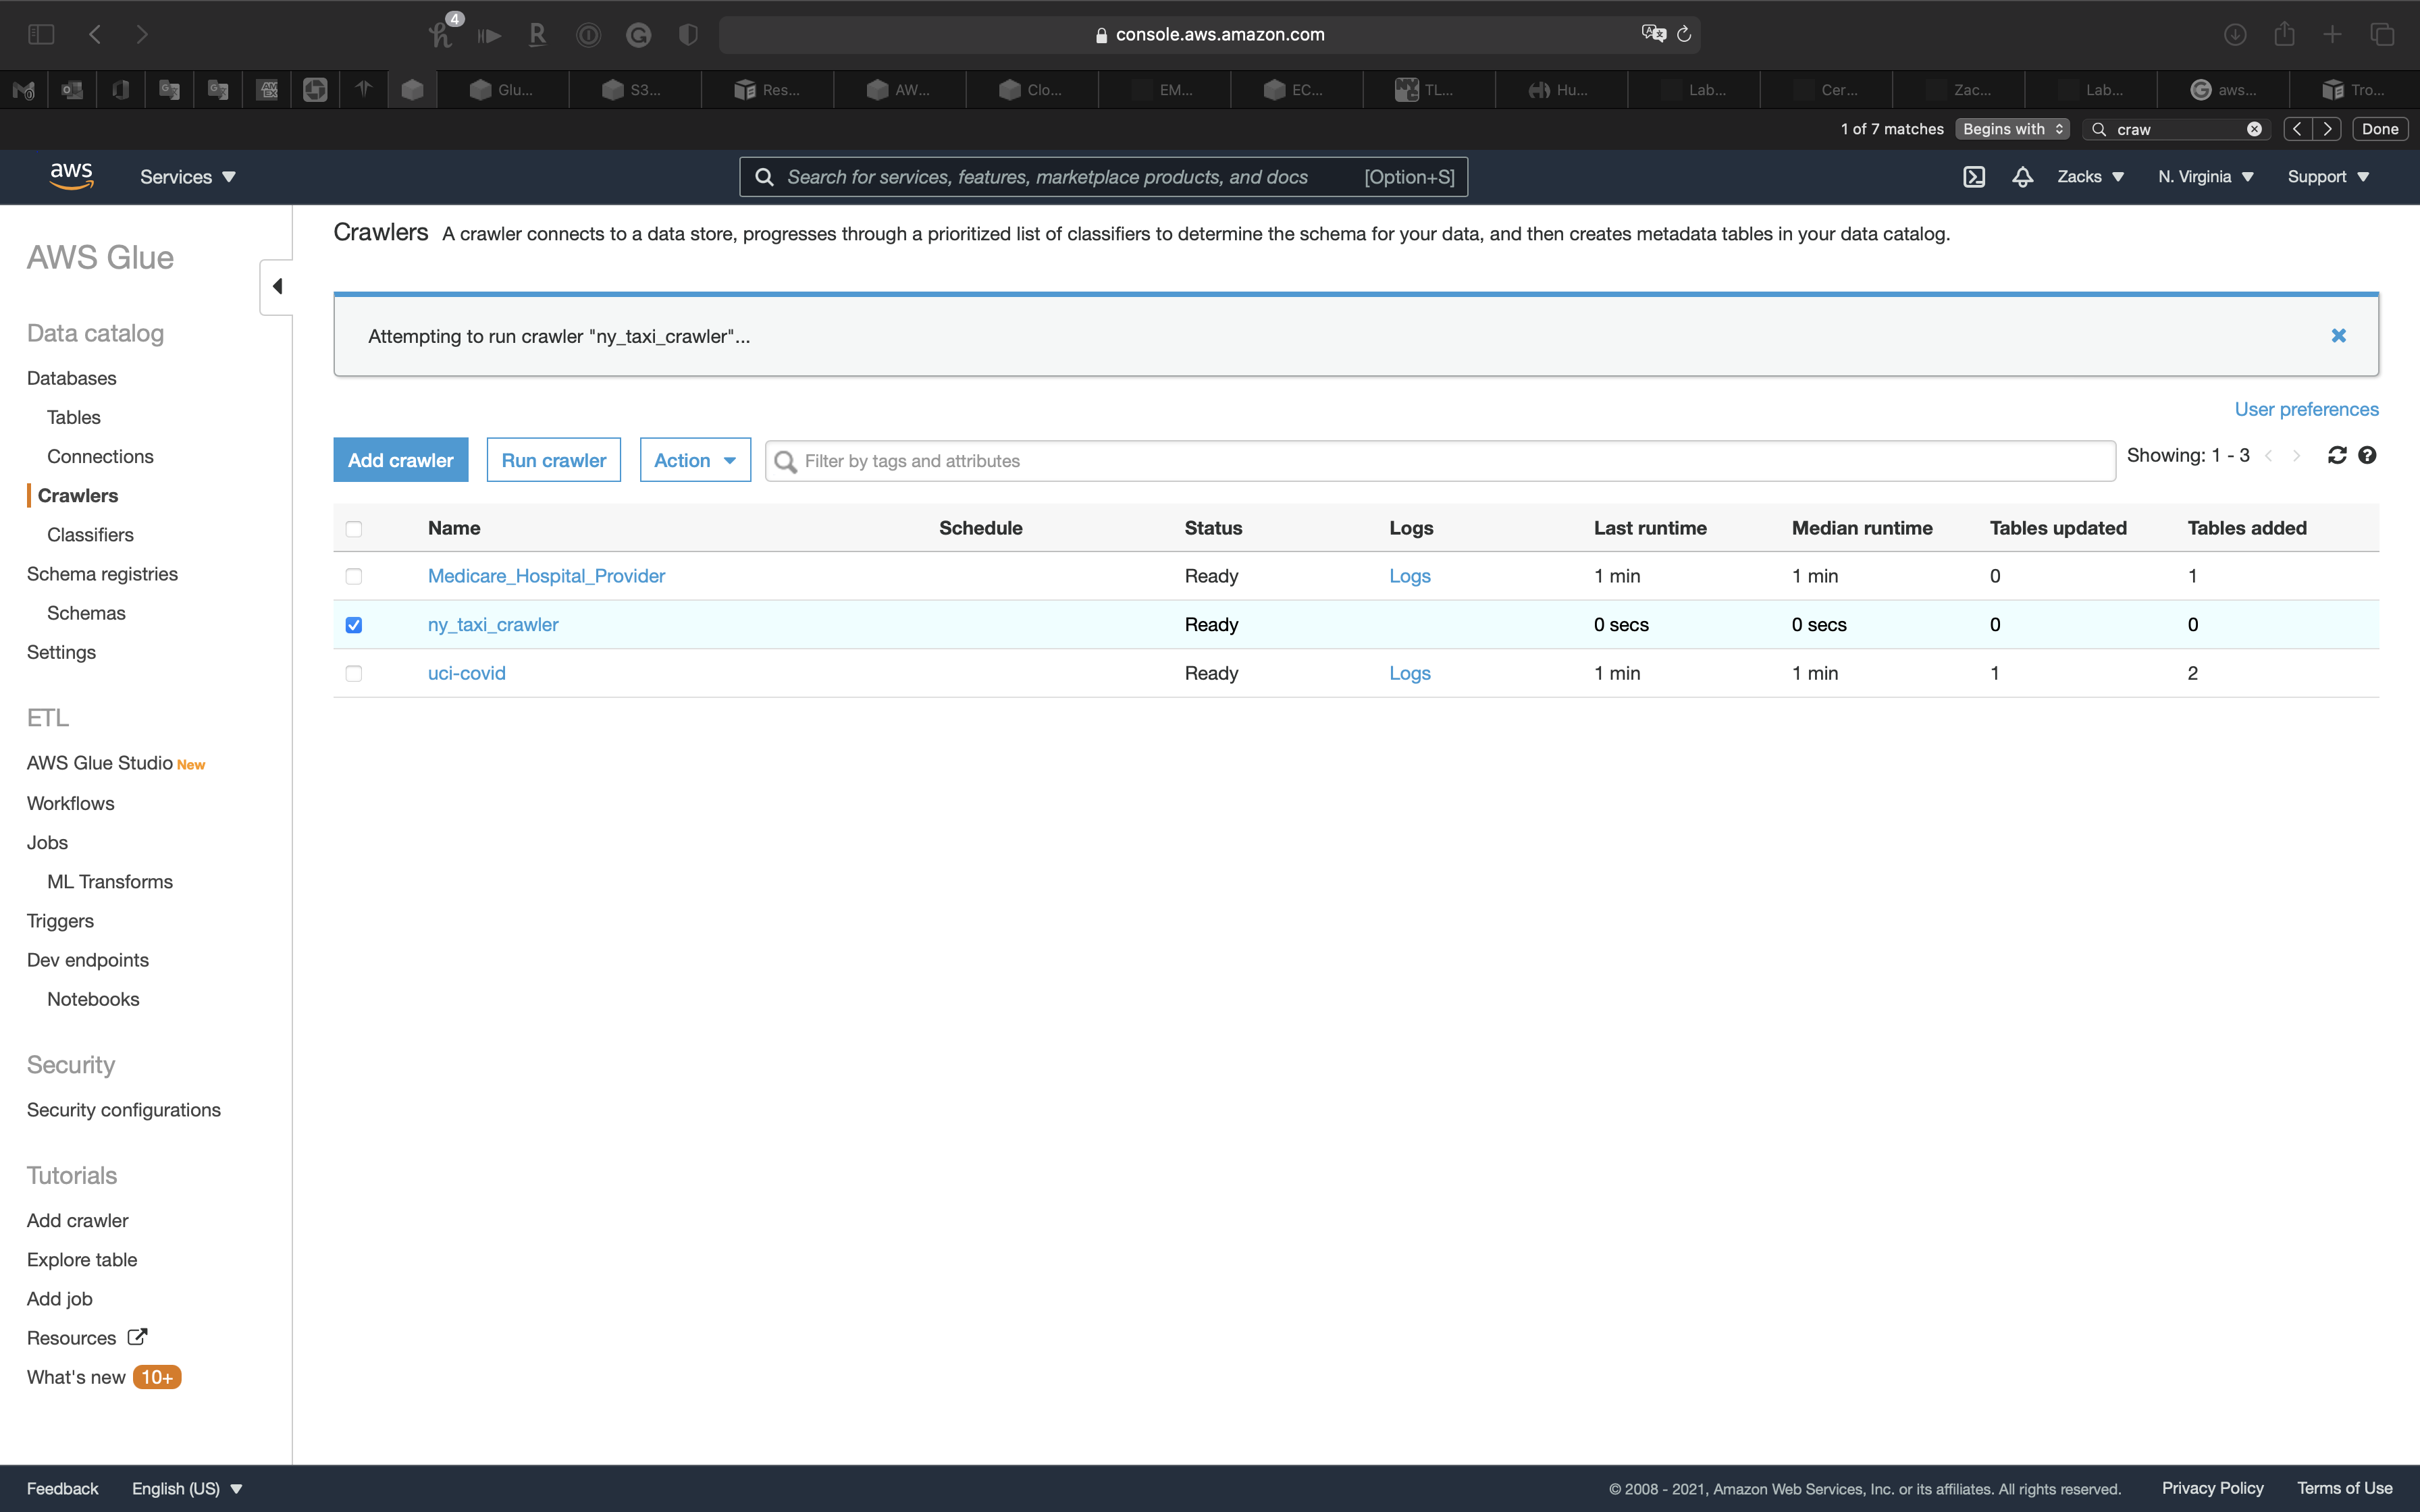
Review the table
Now you can see the table
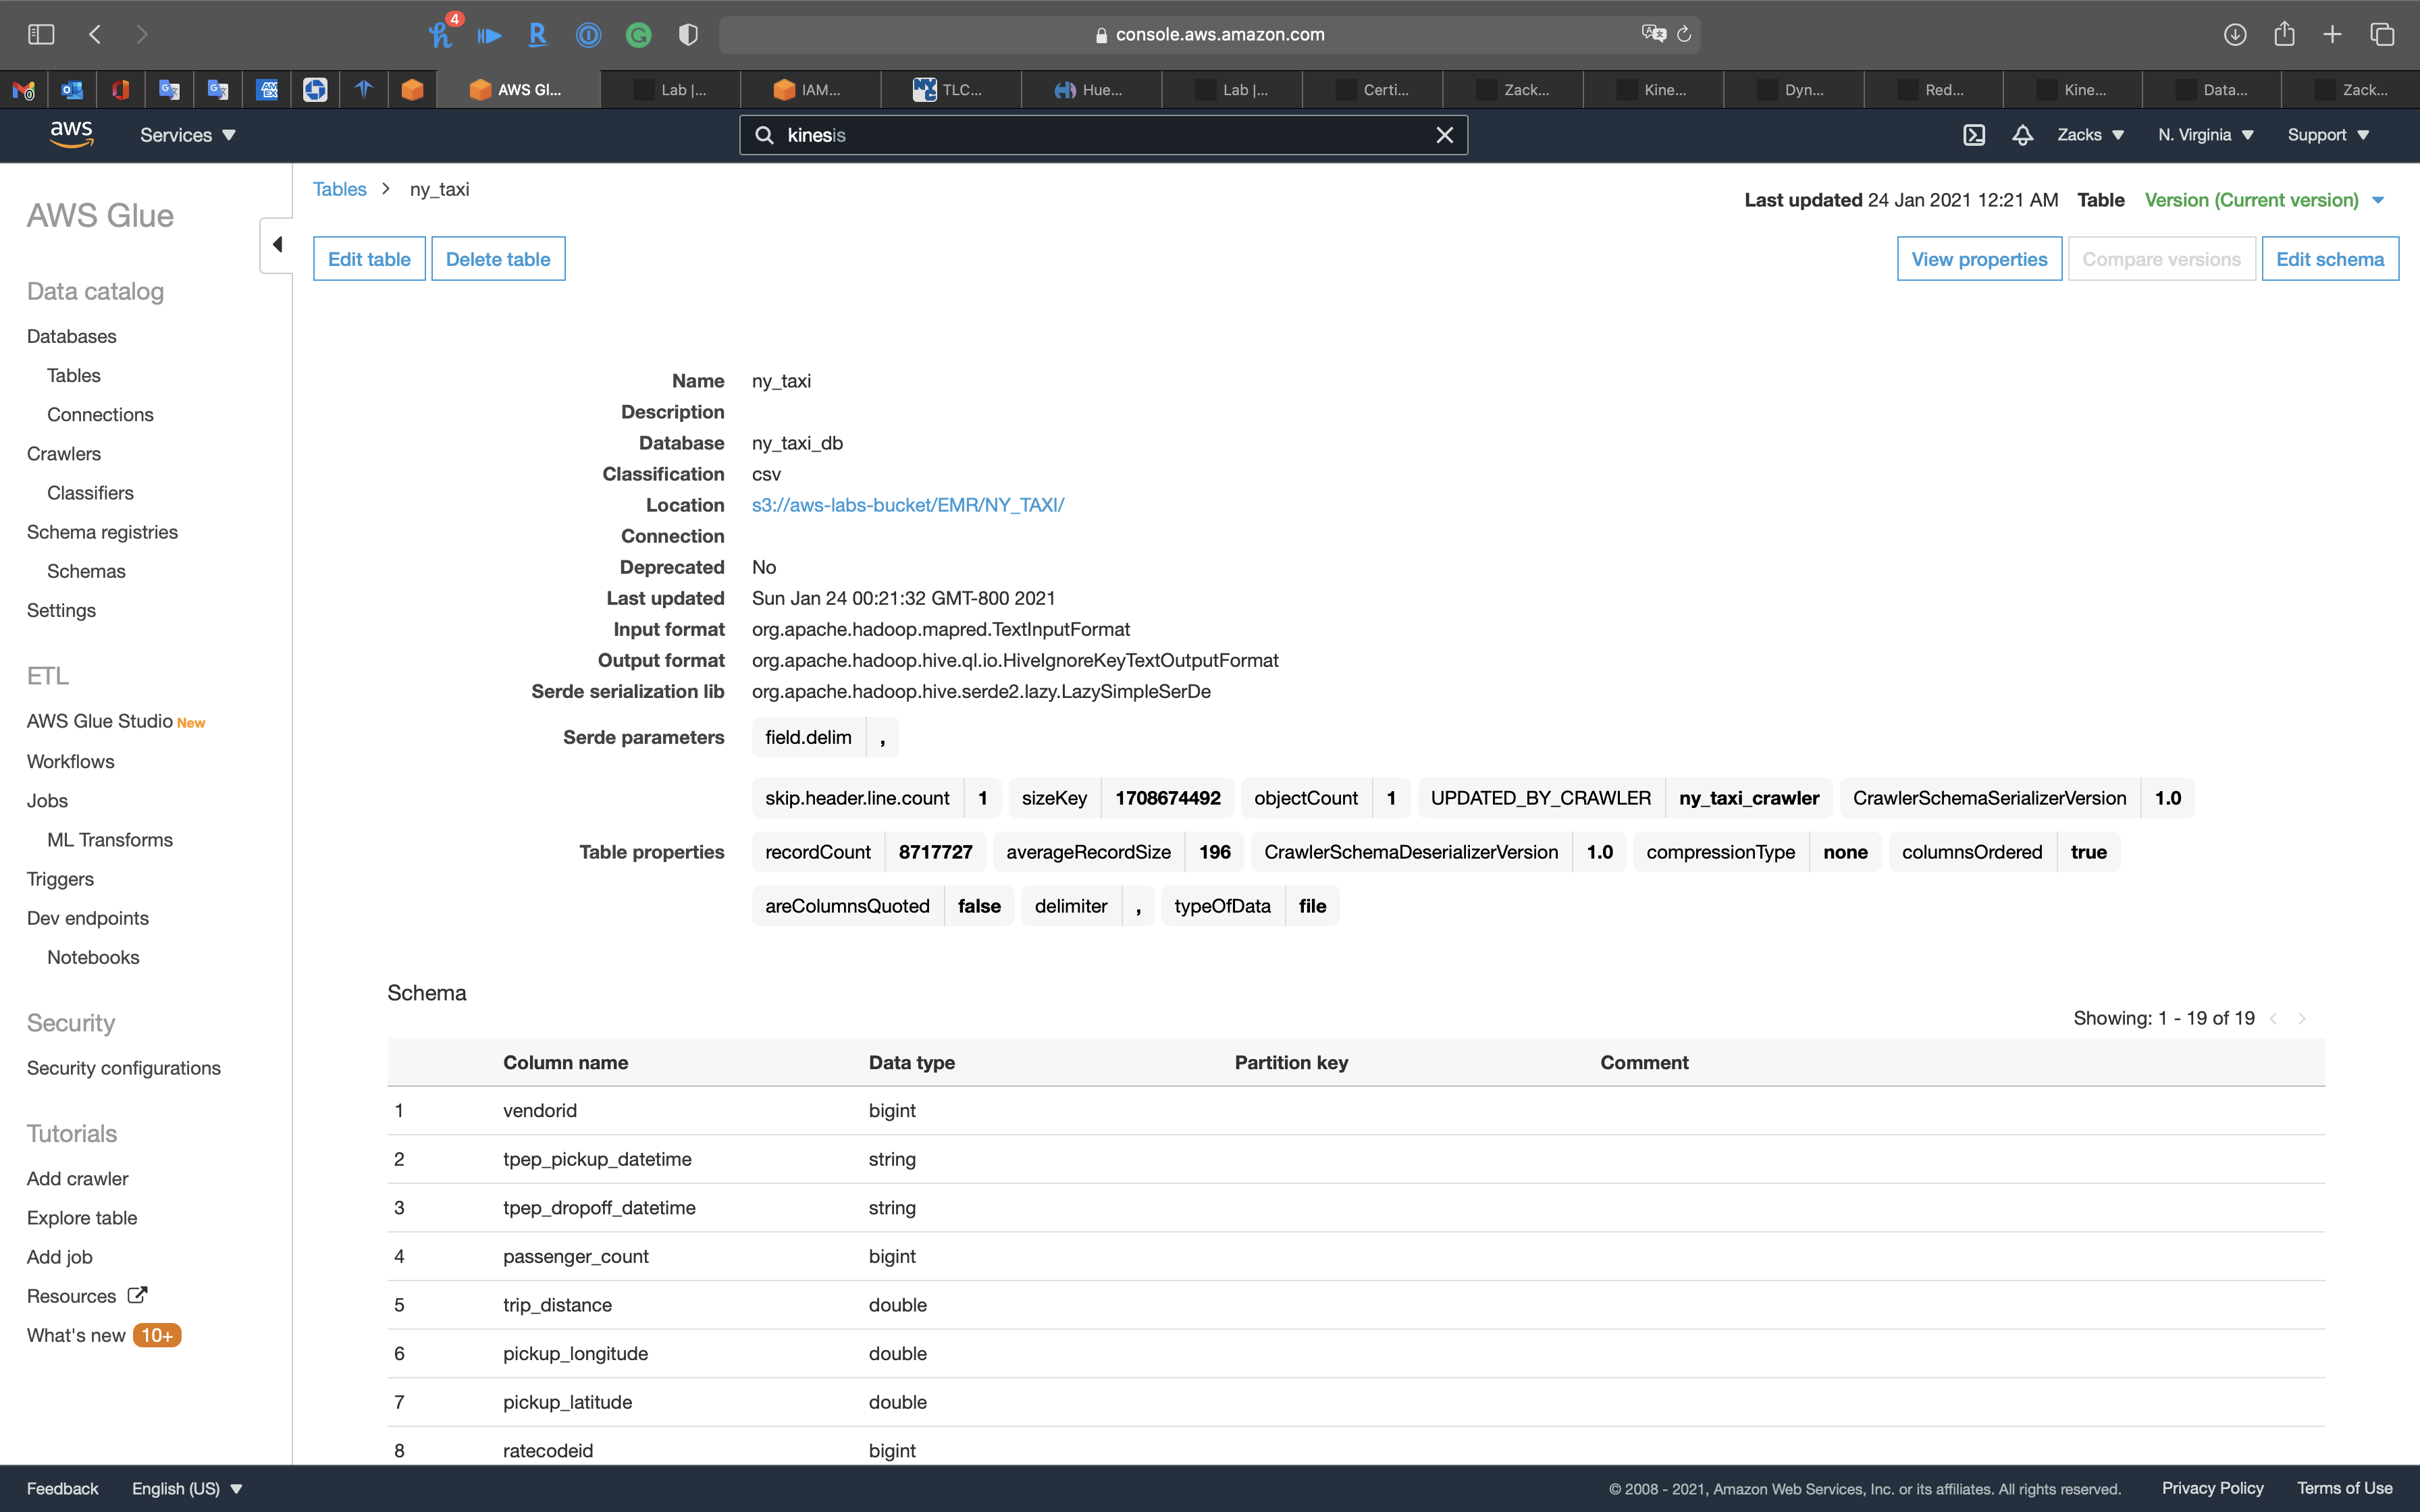
Click on ny_taxi table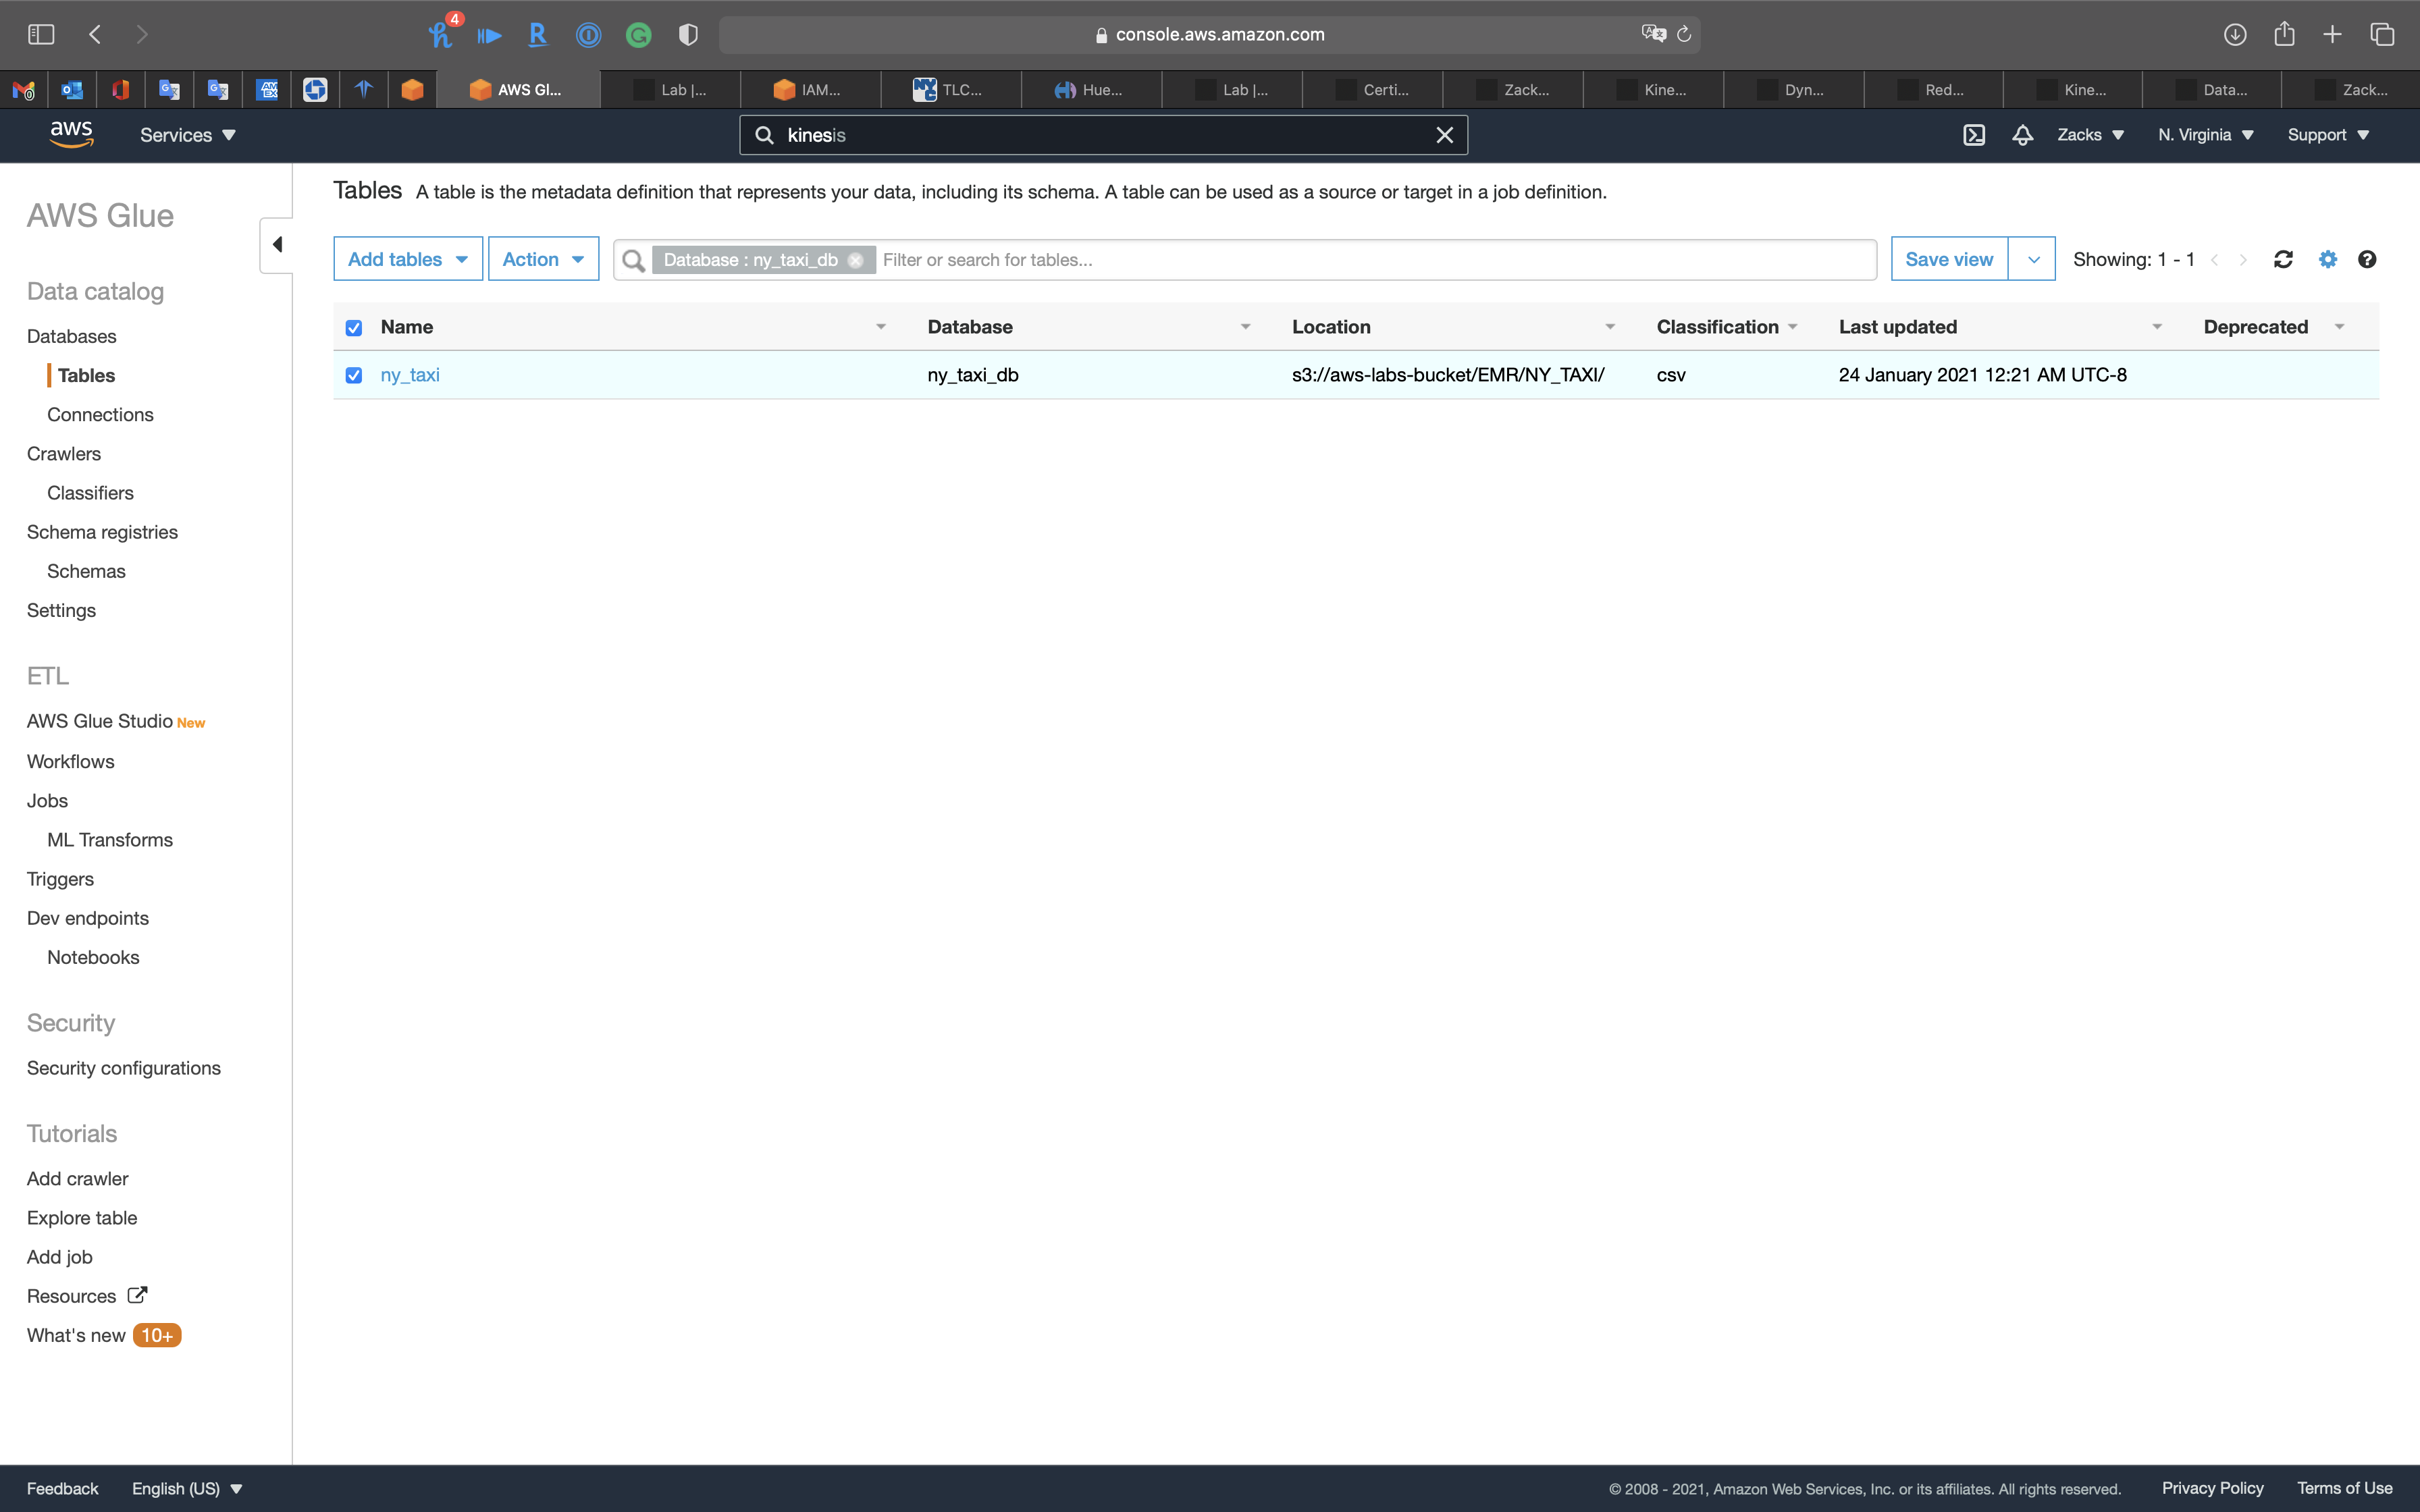
ETL - Jobs
At this step, AWS Glue transform the raw data from .csv to apache .parquet.
As we can see, the raw data has stream date format, which we need to change string to timestamp for time related query.
Services -> AWS Glue -> AWS Glue Studios
Click on Create and mange jobs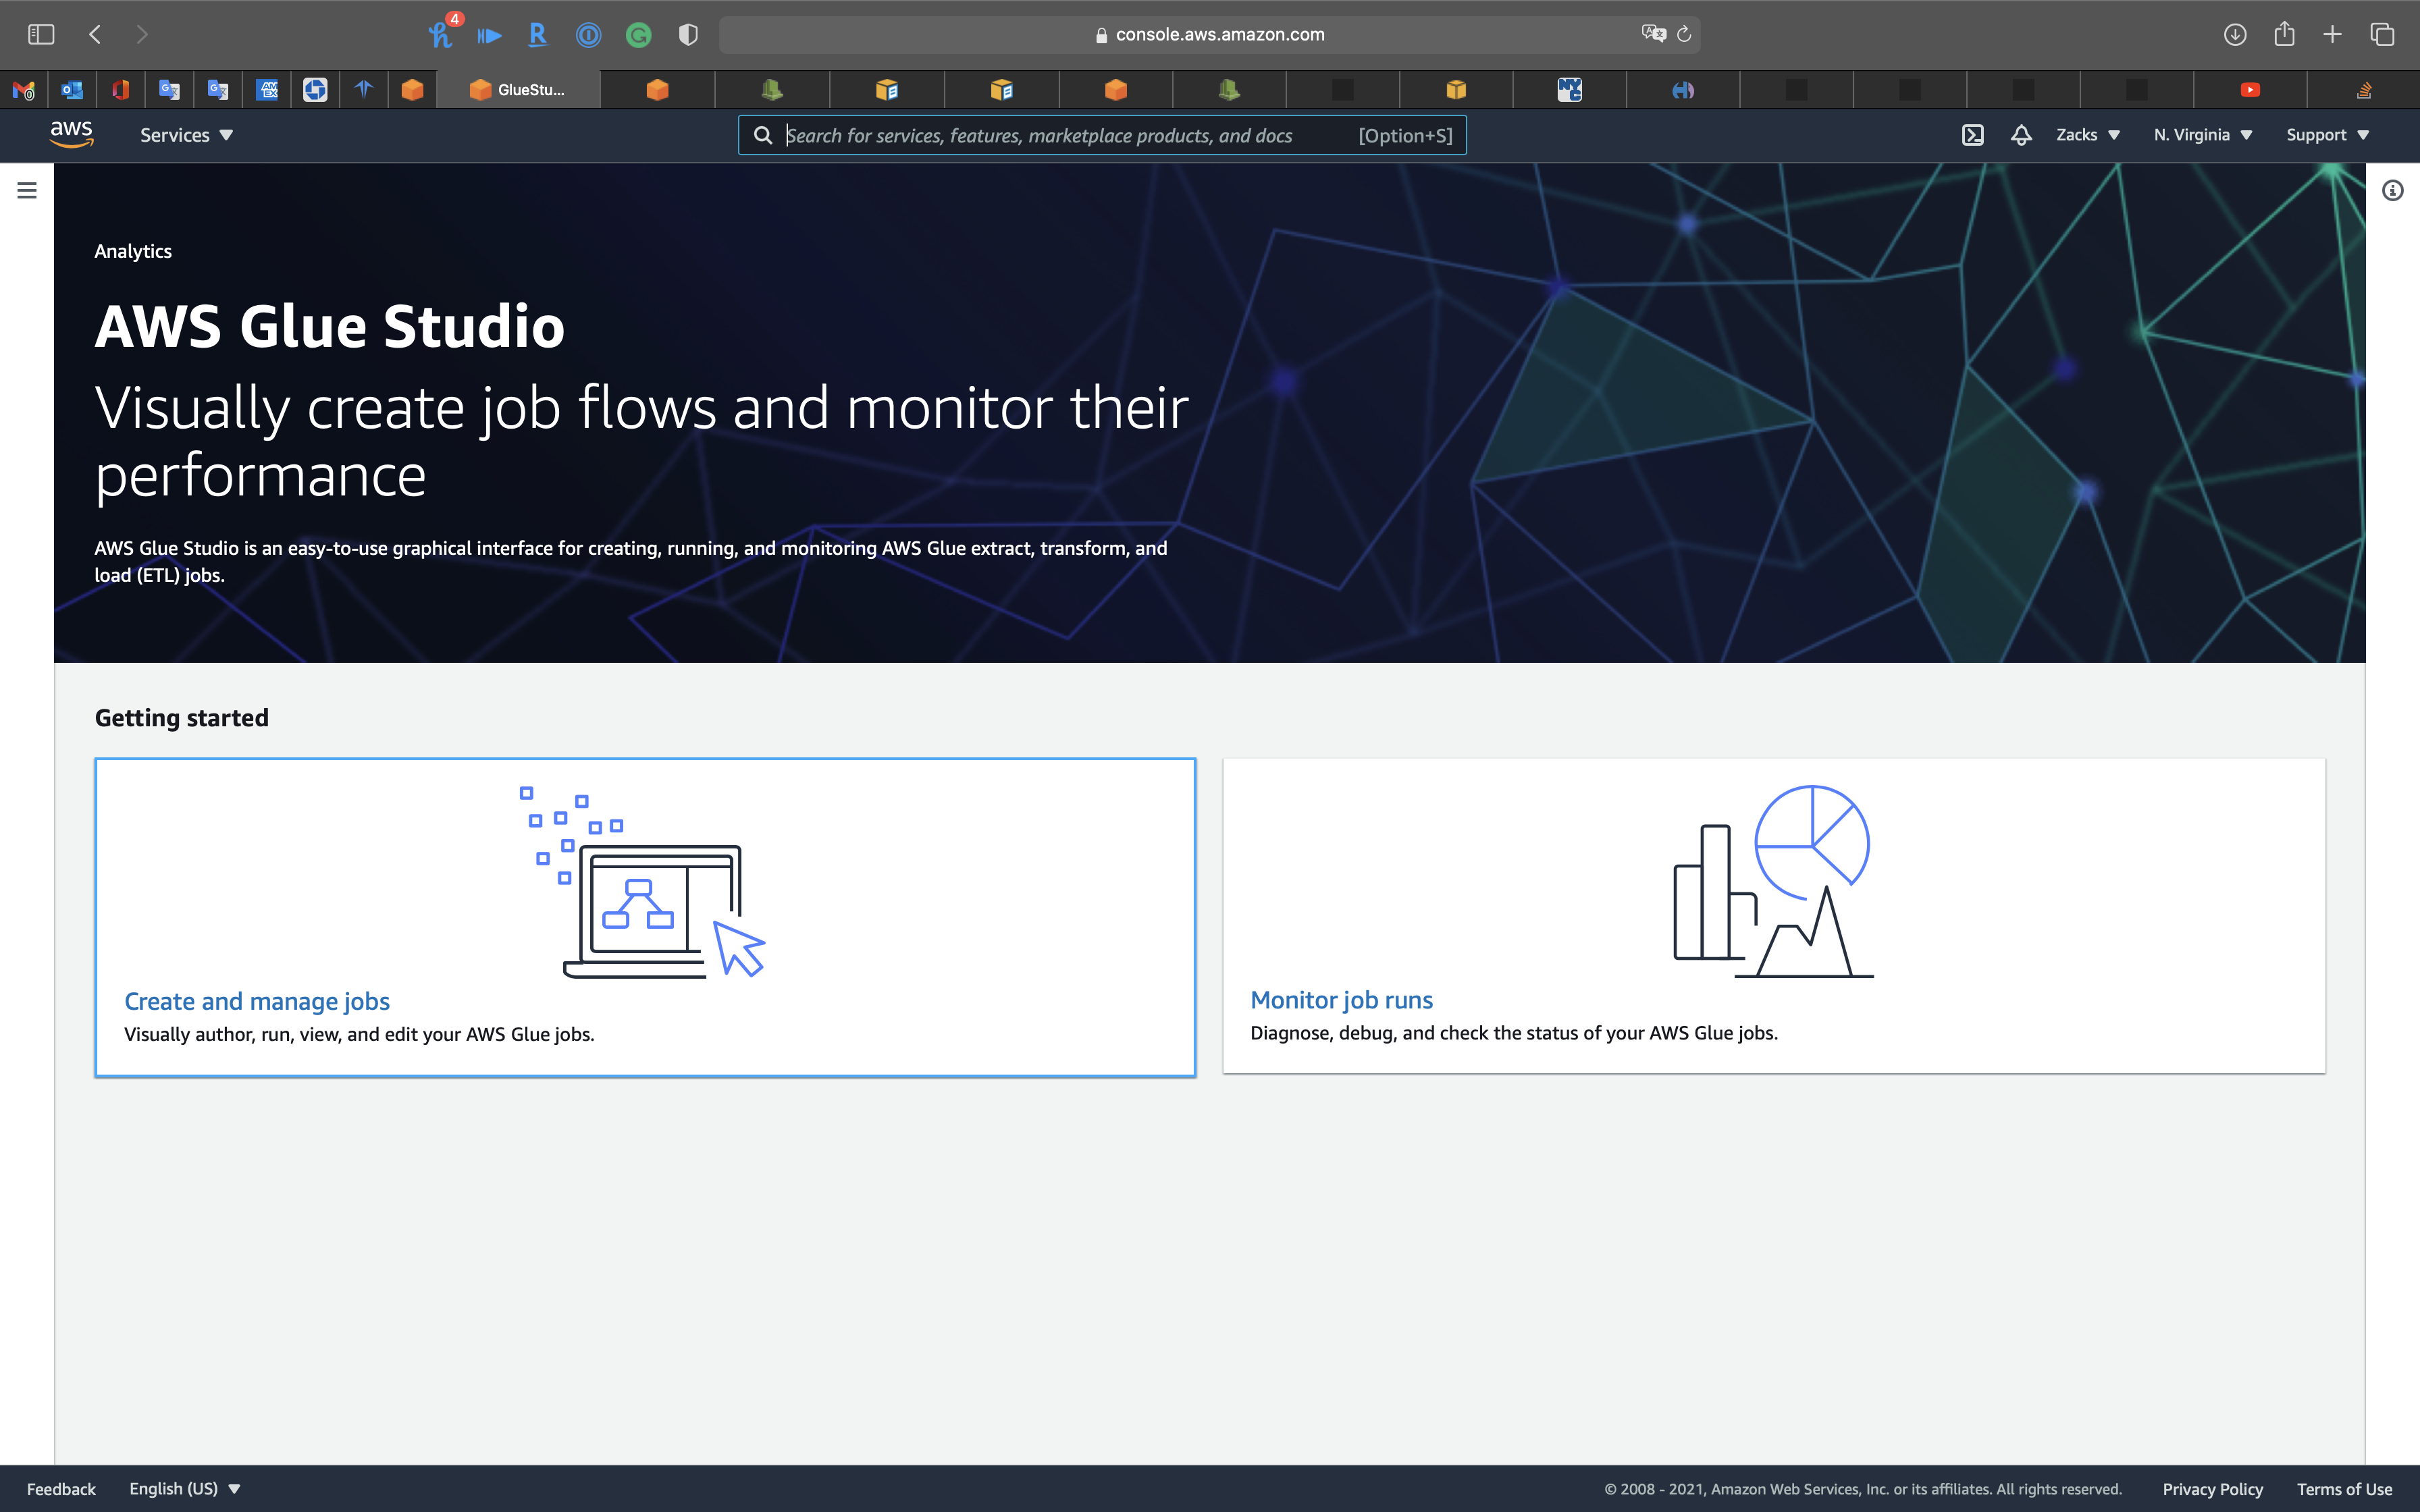
Create job
- Select
Source and target added to the graph
Click on Create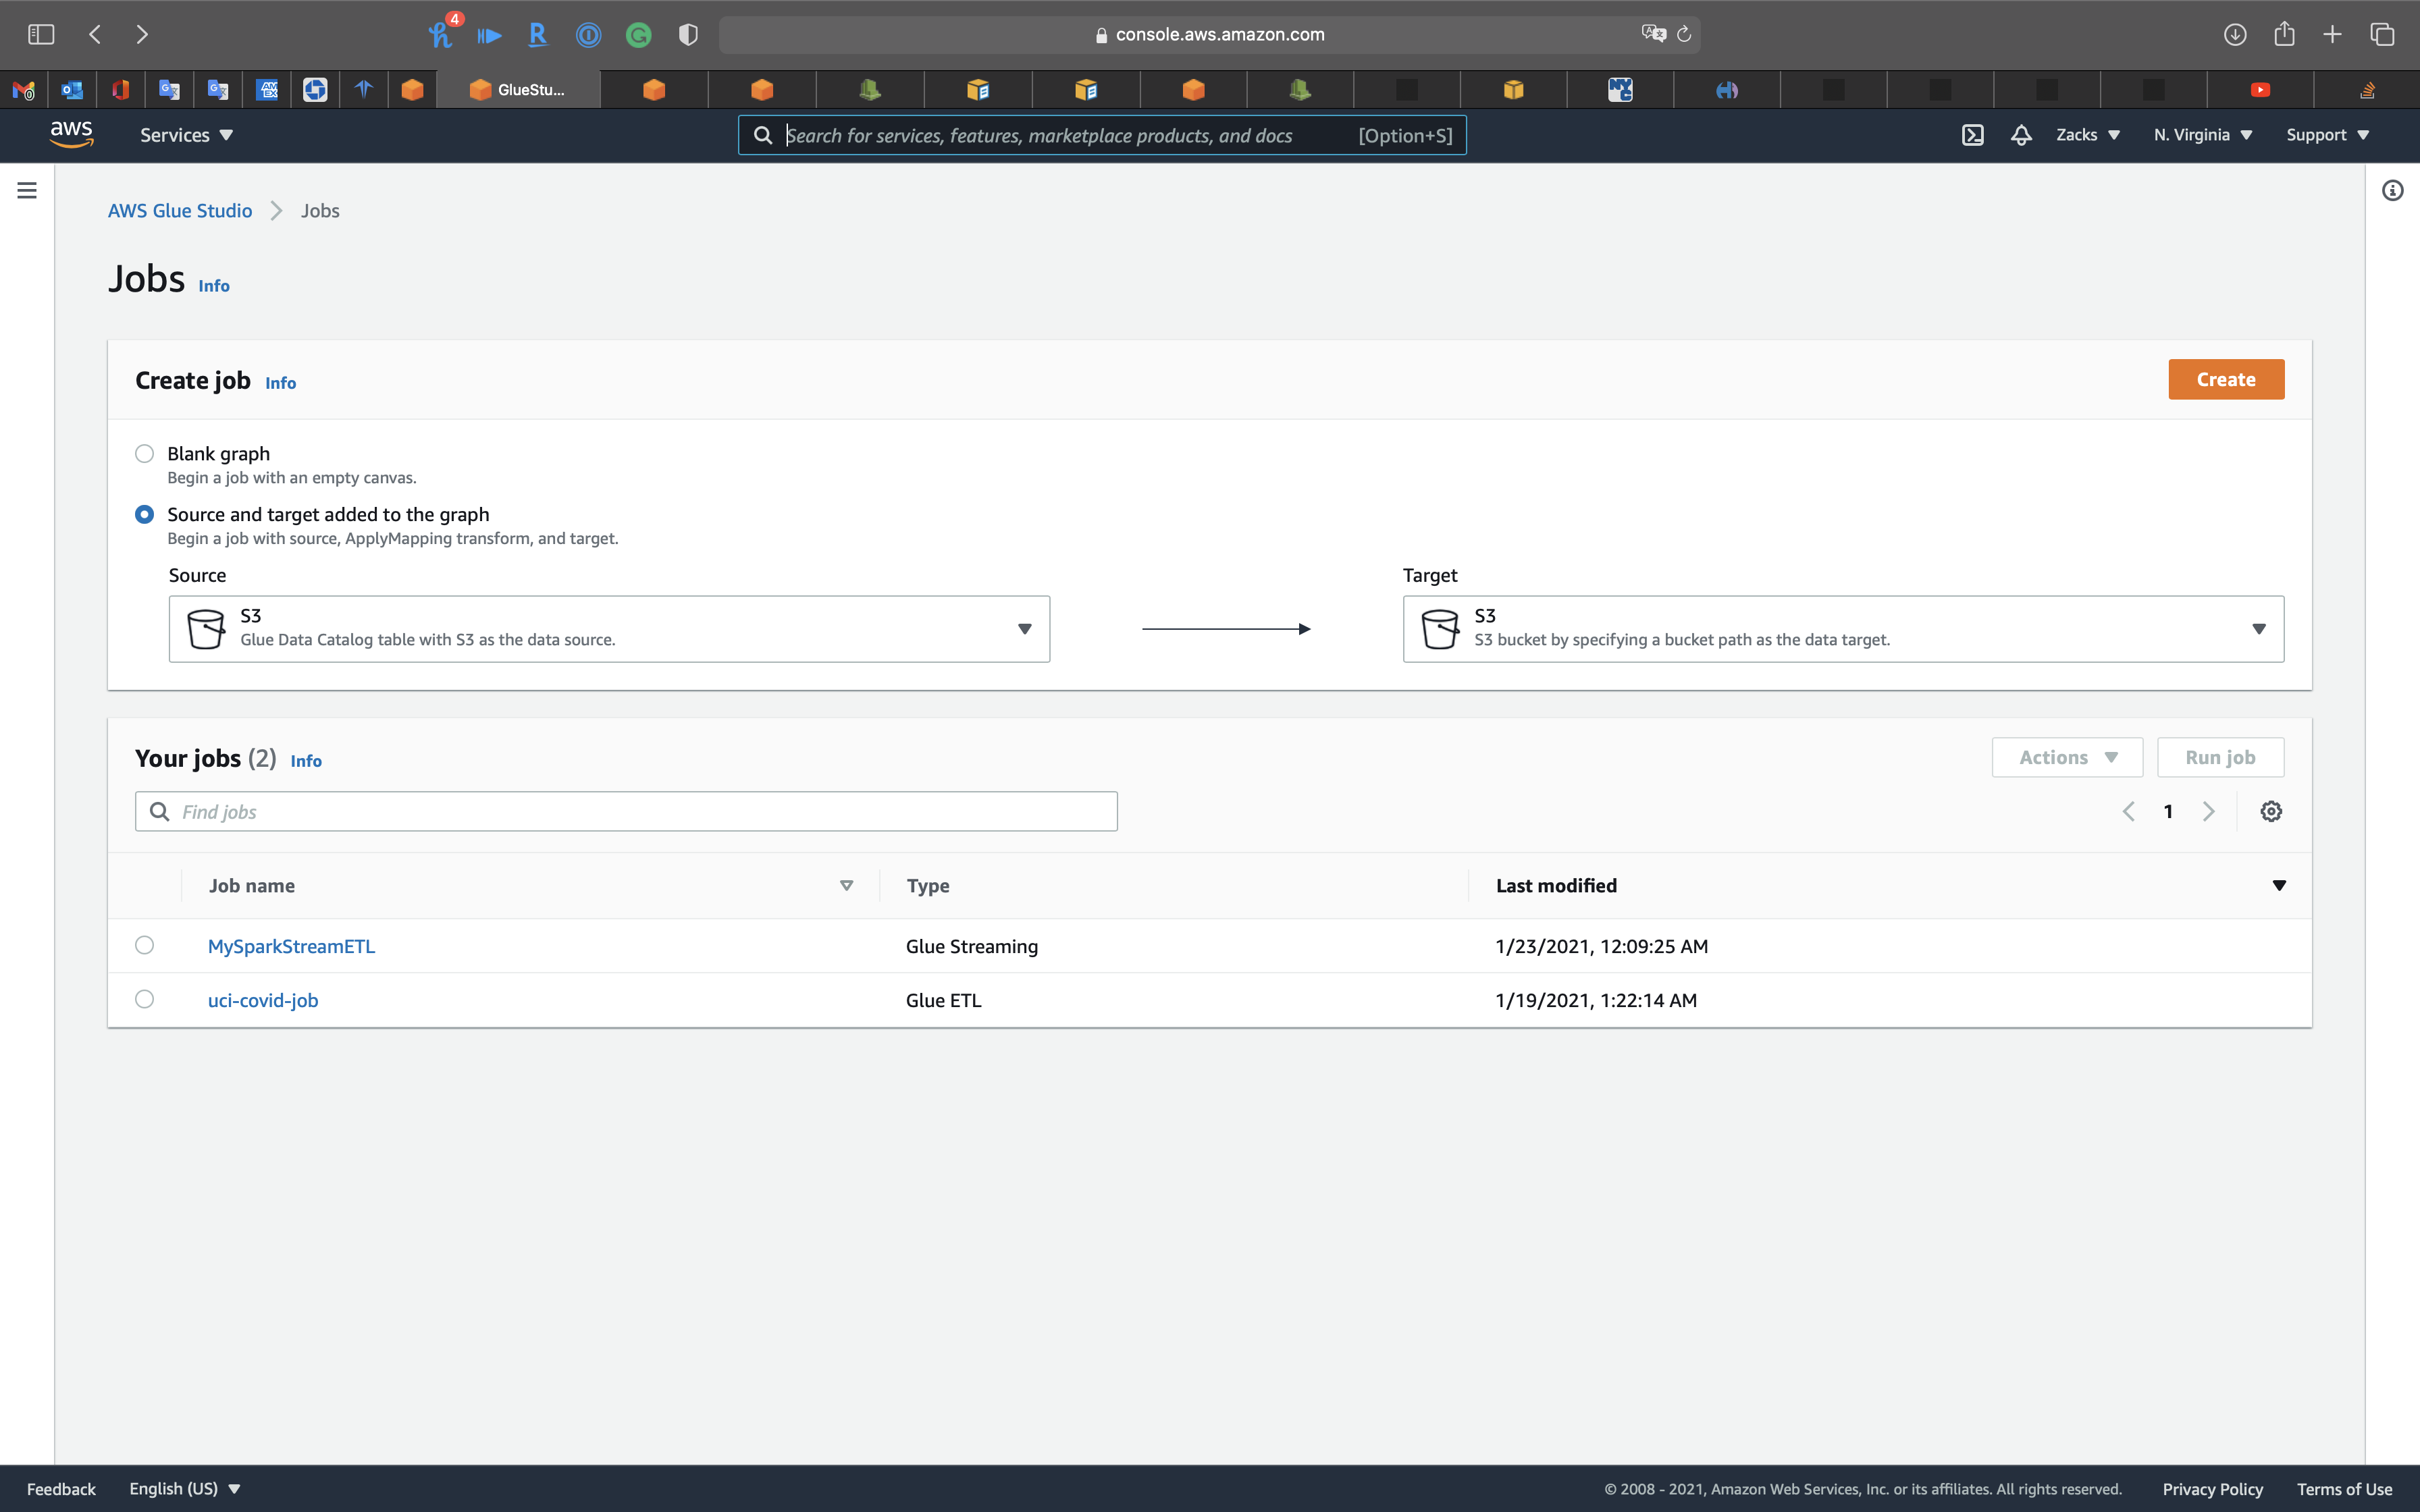
Click on Untitled job on the left and top page to edit the job name.
ny_taxi_etl_parquet
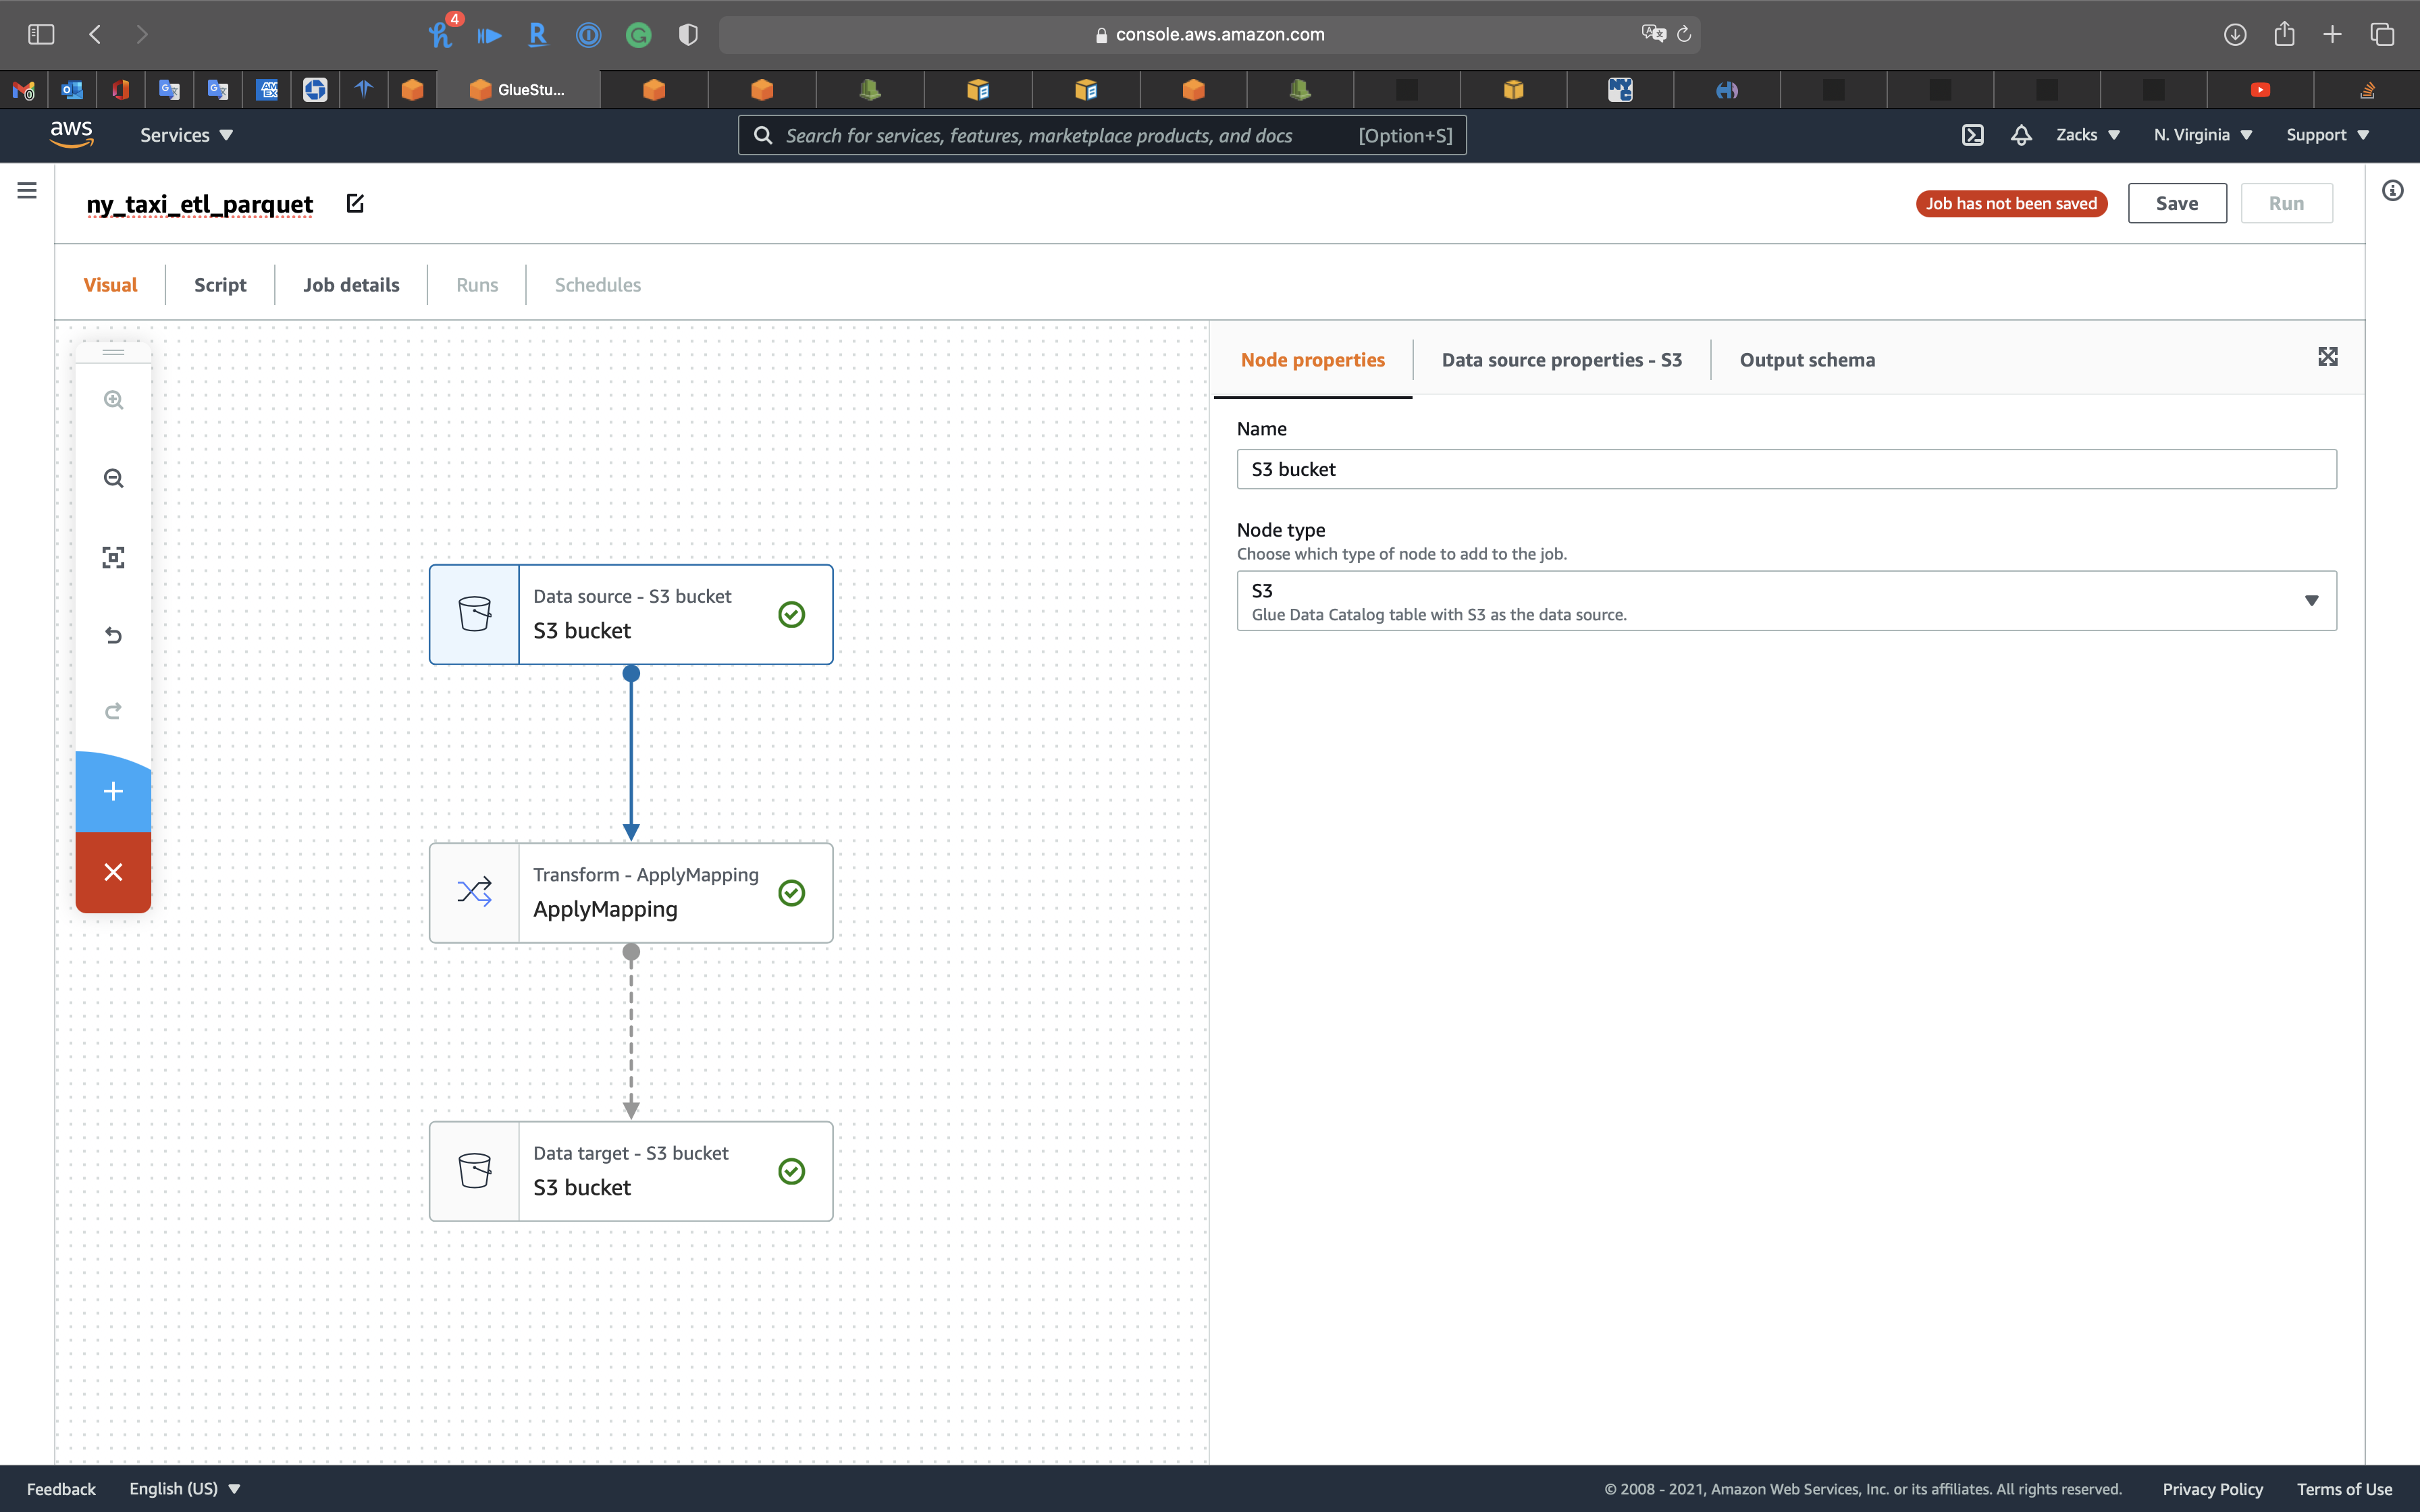
Click on the 1st node, S3 bucket icon, then choose your Database.
- Database:
ny_taxi_db - Table:
ny_taxi
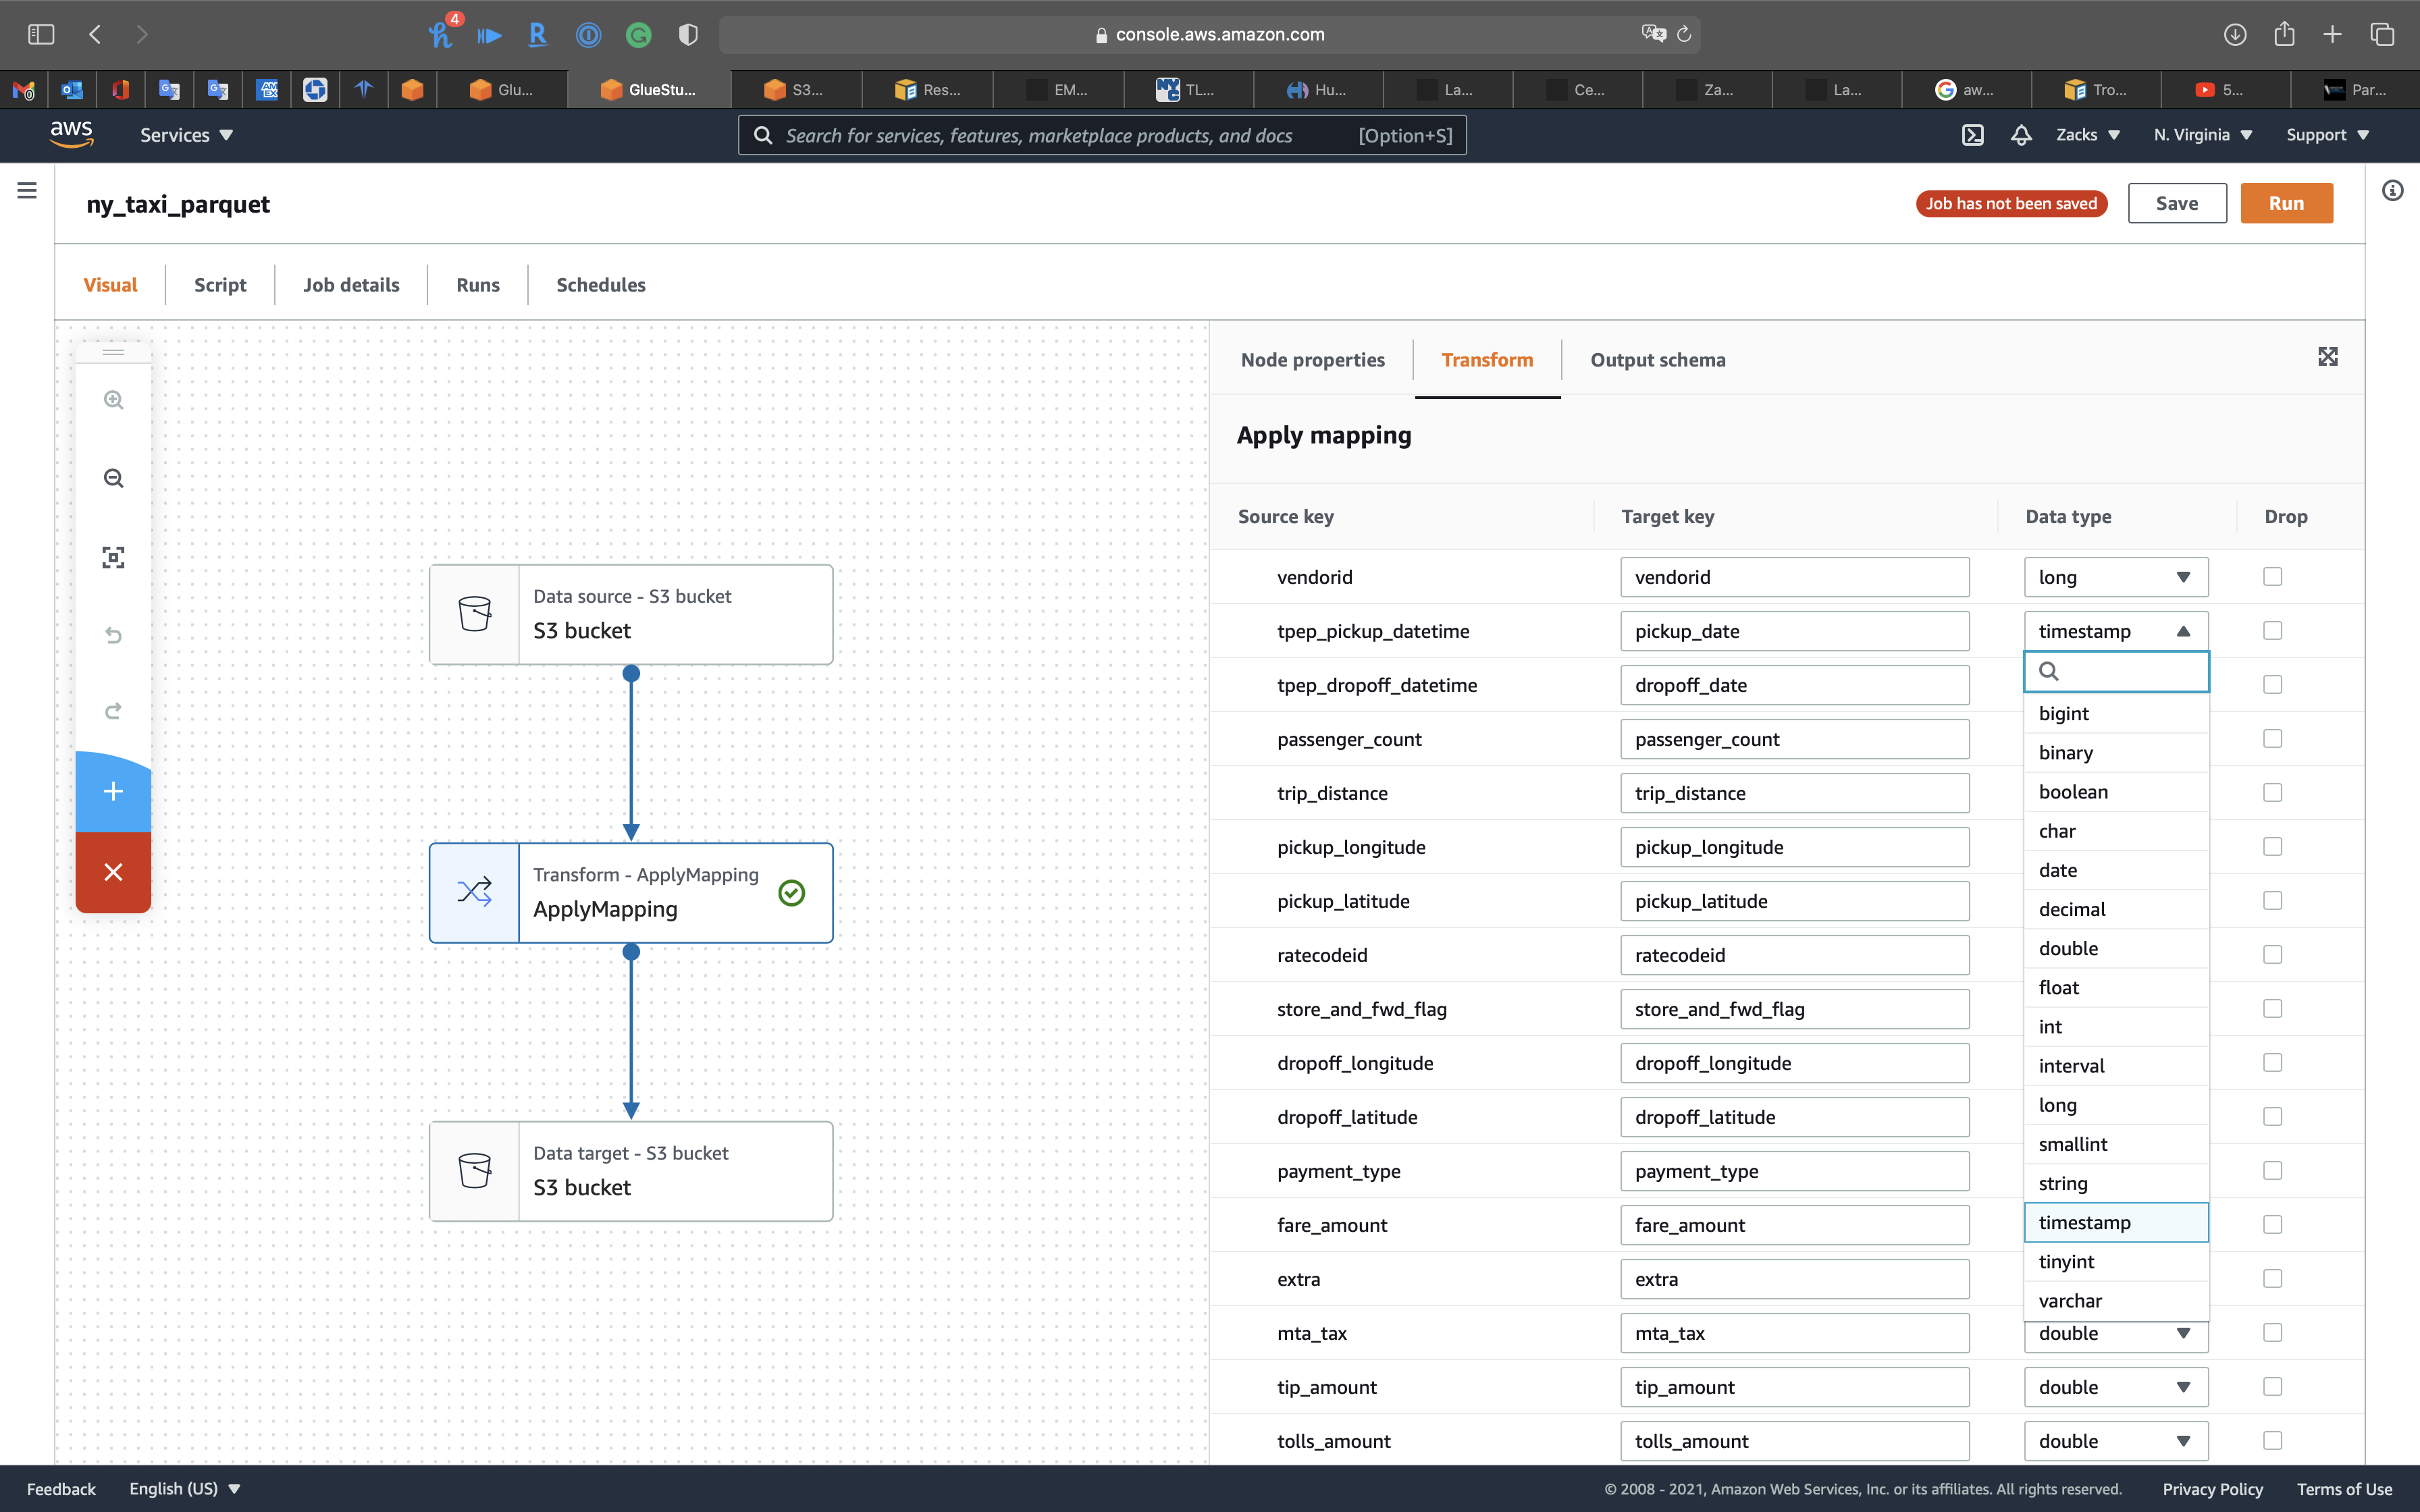
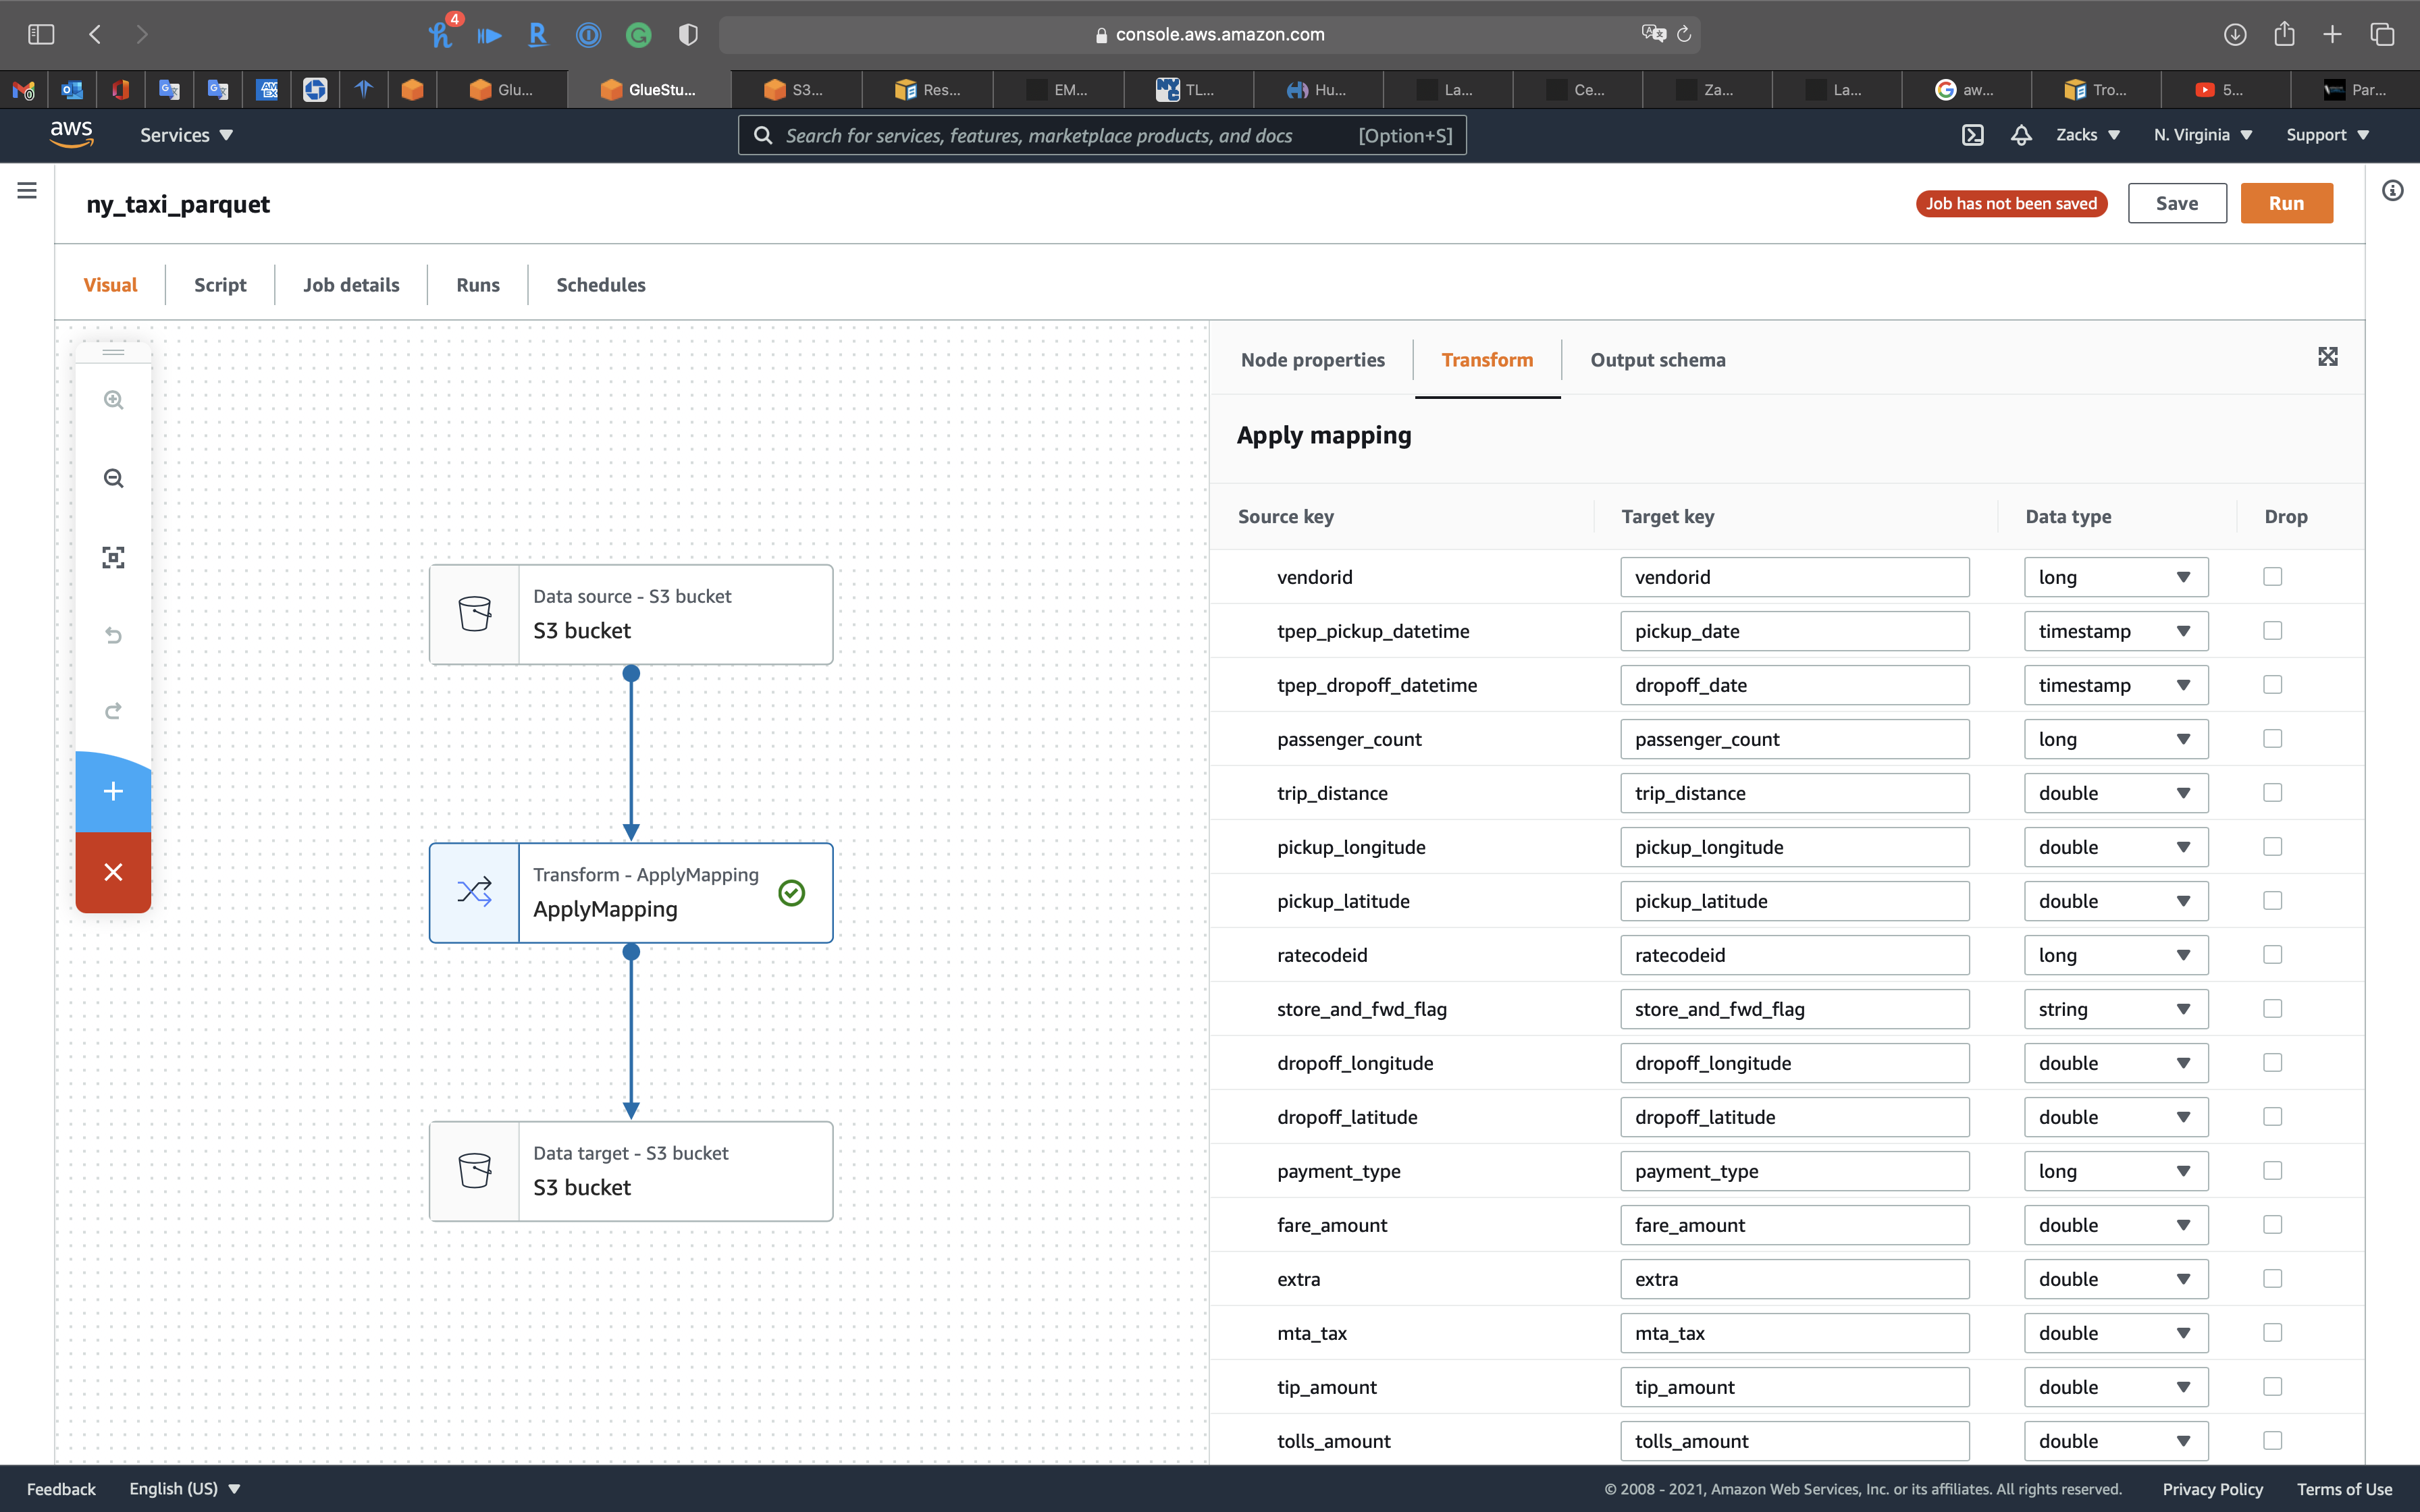
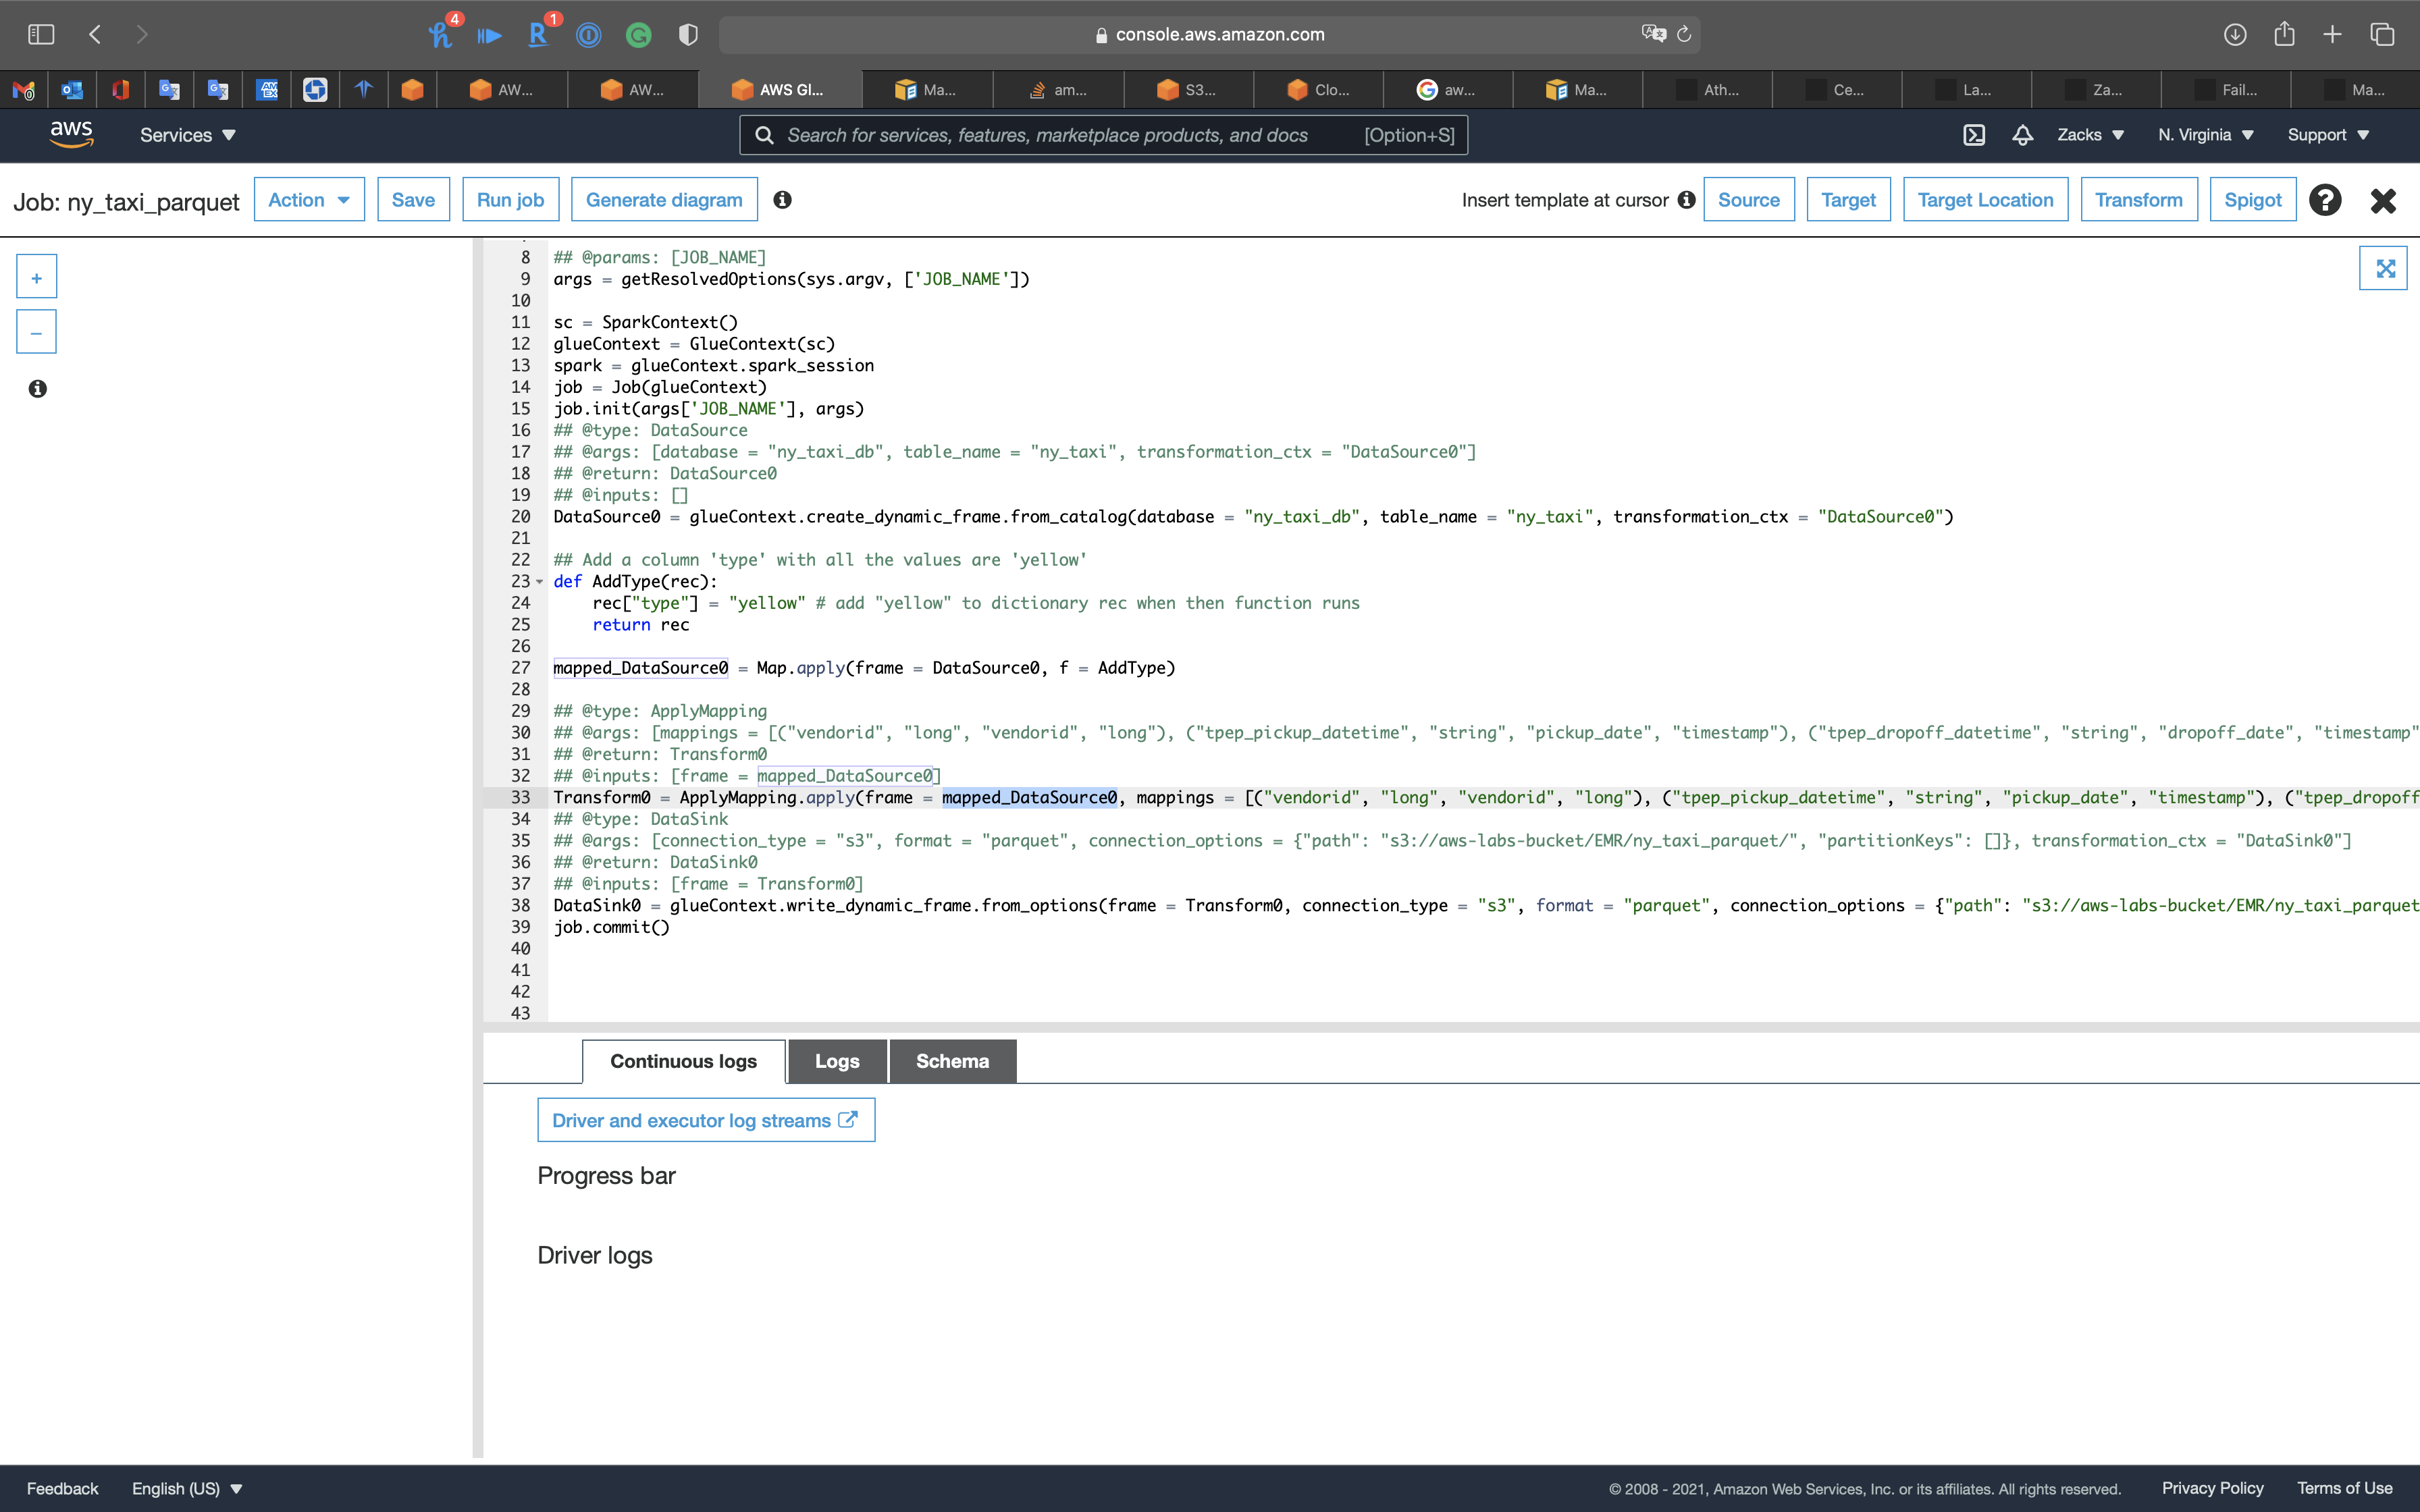
Click on the 2nd node, Transform - ApplyMapping icon, then change tpep_pickup_datetime and tpep_dropoff_datetime to pickup_date and dropoff_date. Modify their Data type to timestamp.
Click on the 3rd node, S3 bucket icon, then set the followings:
- Format:
Parquet - Compression Type:
None - S3 Target Location: choose your S3 bucket
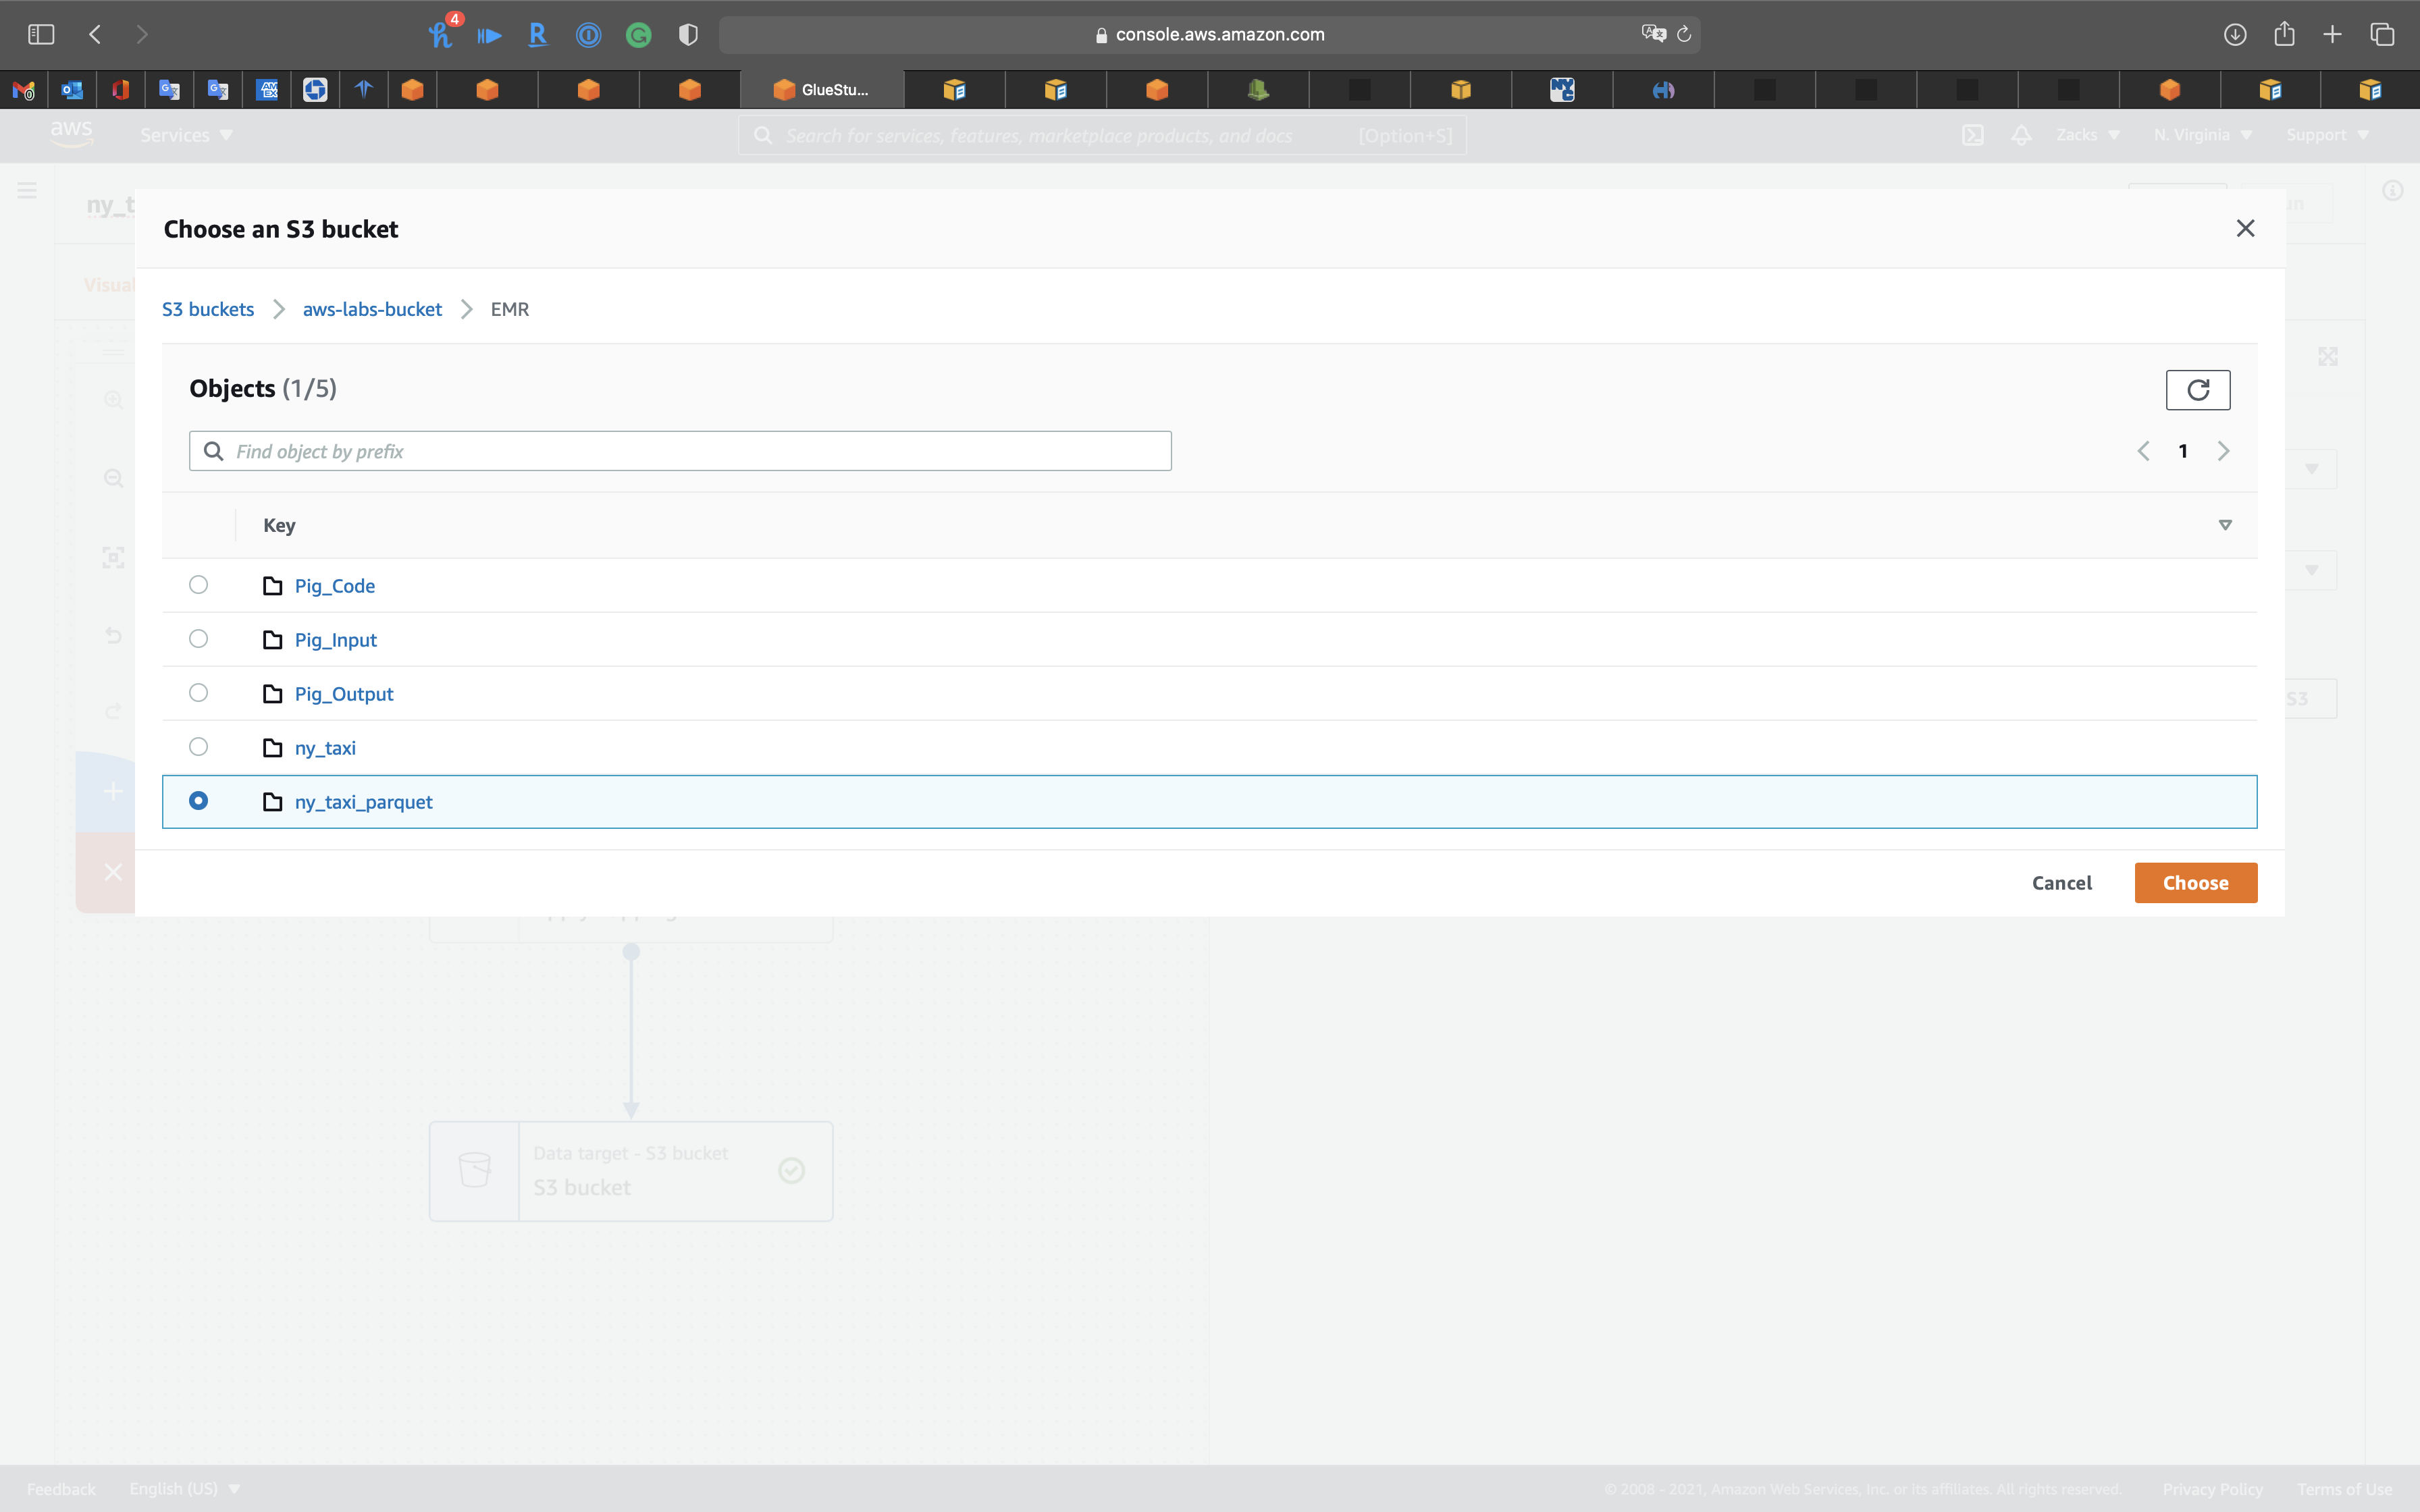
Select your bucket then click on Choose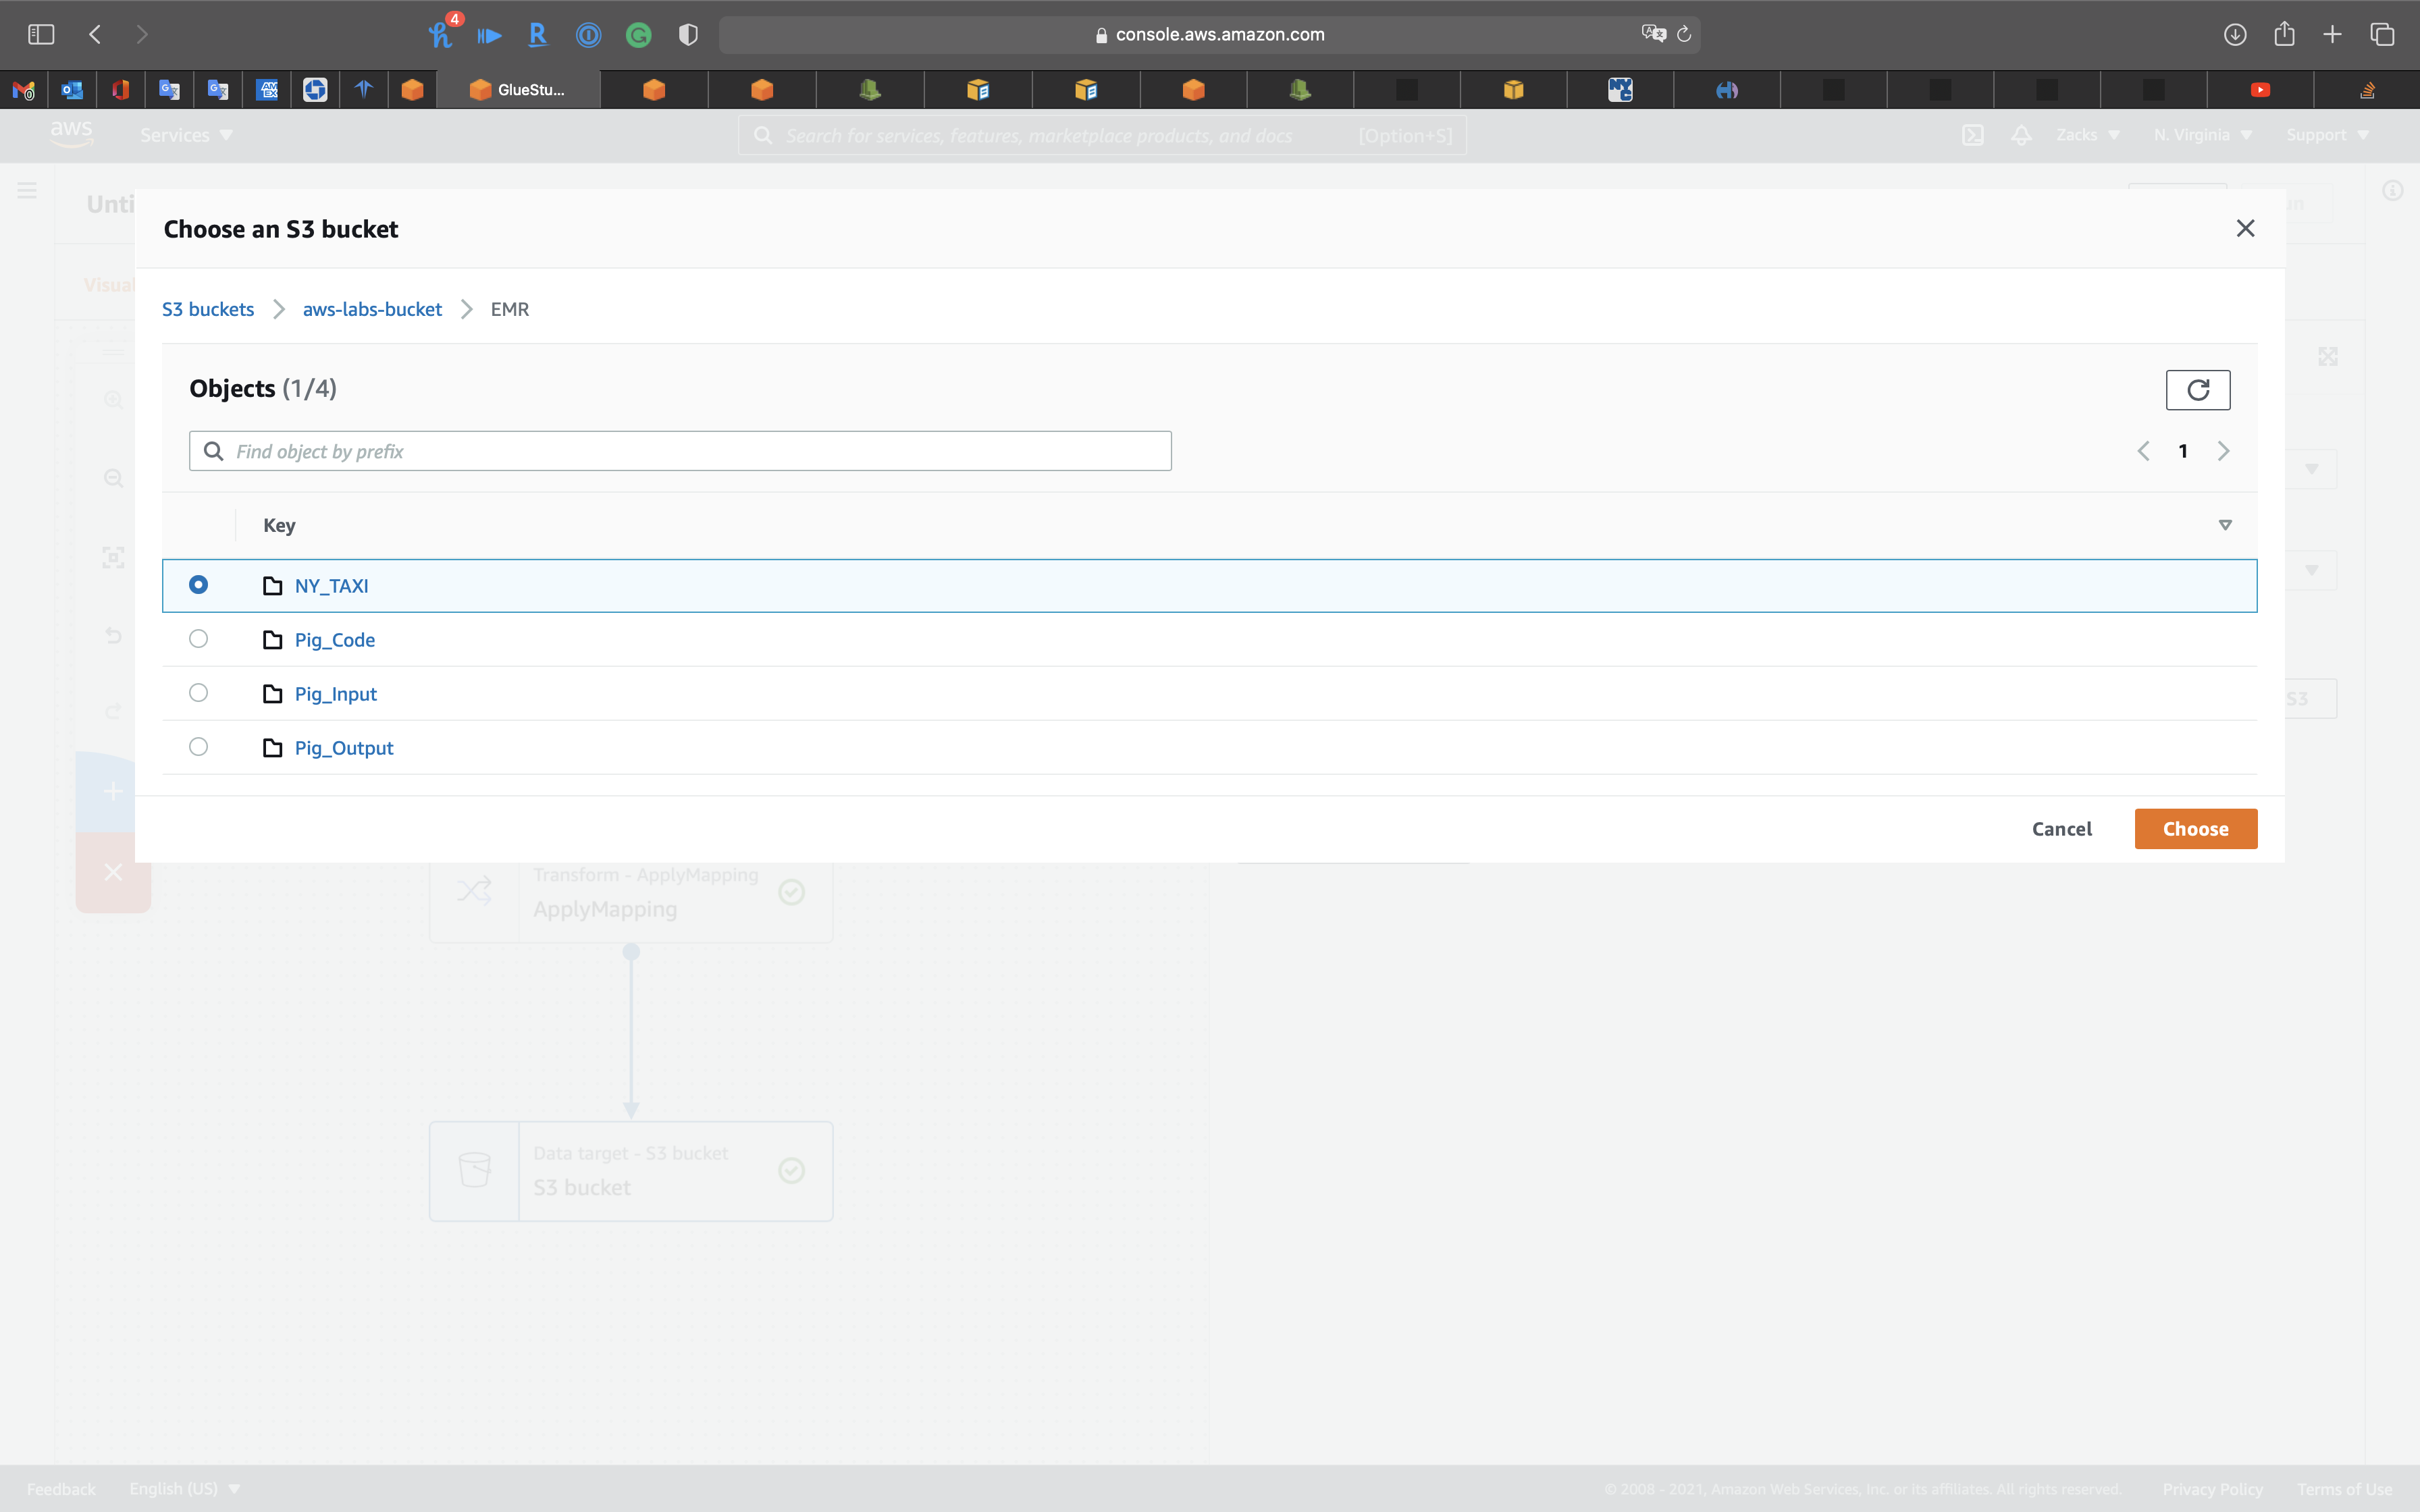
Click on Job details tab.
- IAM Role:
GlueUnlimited - Bookmarks:
Disable
Click on Save on the right and top page.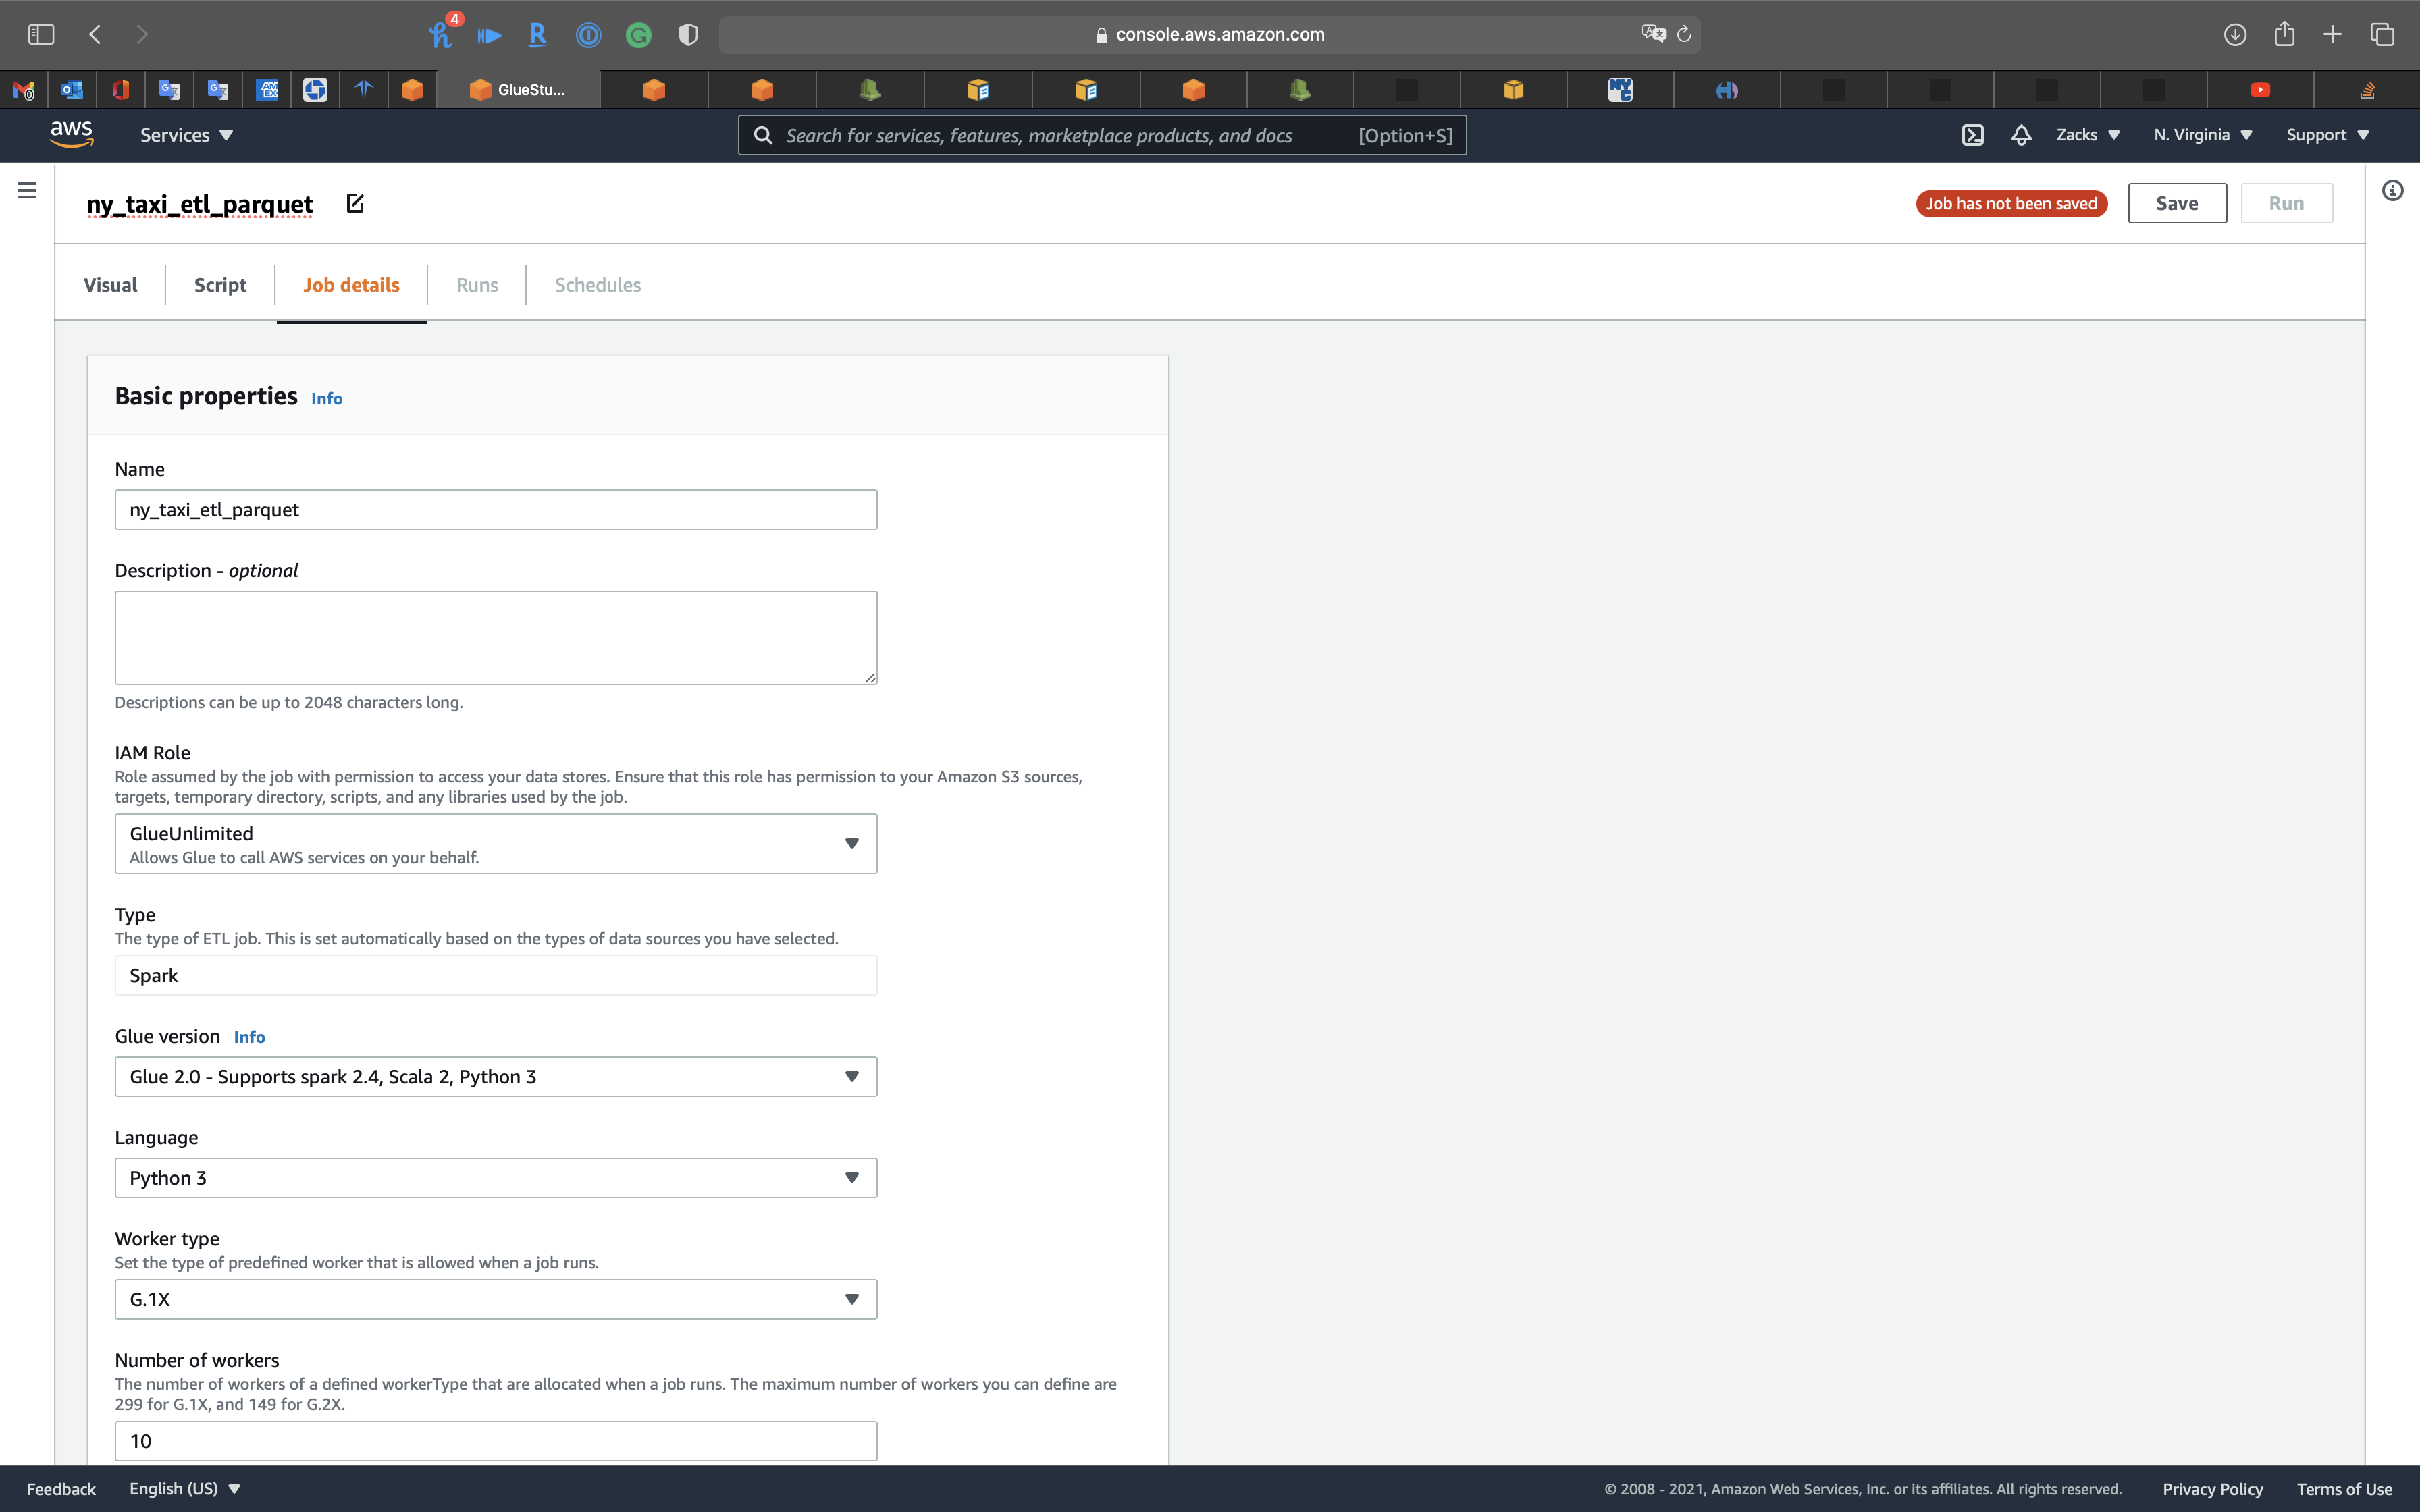
Services -> Glue -> Jobs
Select ny_taxi_parquet_ver and click on Action -> Edit script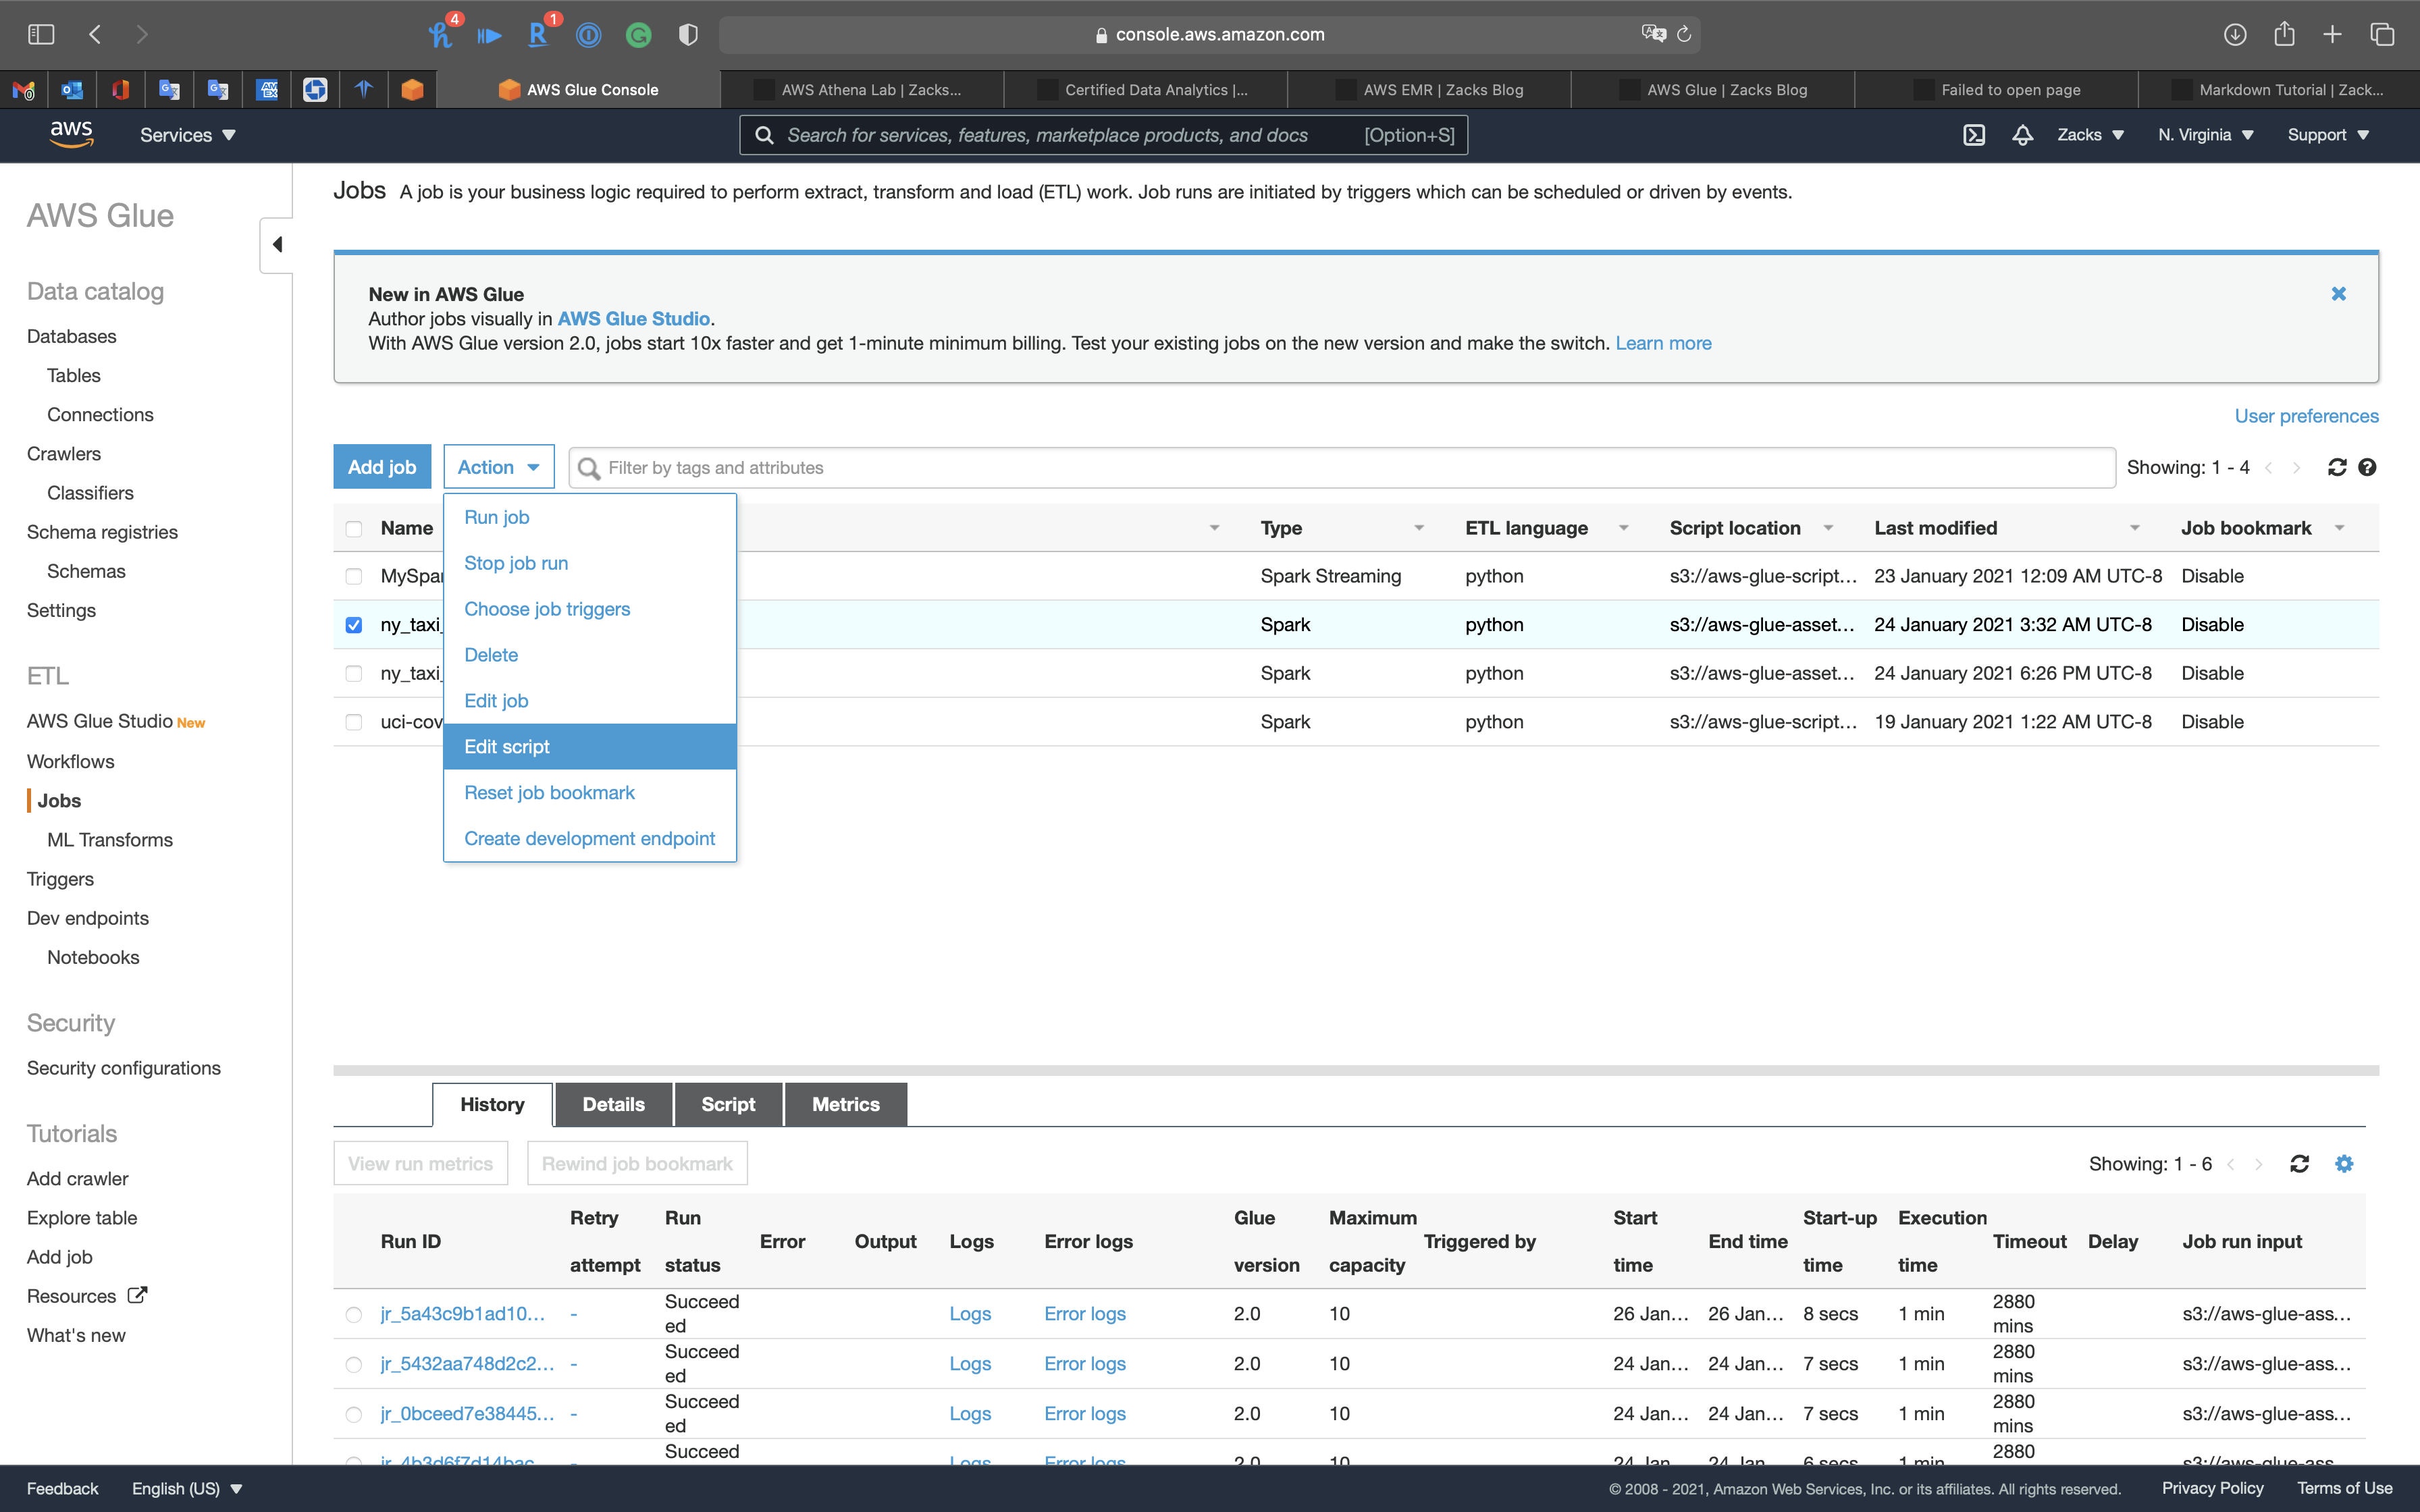
Add a column type with all the values are yellow to .parquet files
Add the following code under line 20
1 | ## Add a column 'type' with all the values are 'yellow' |
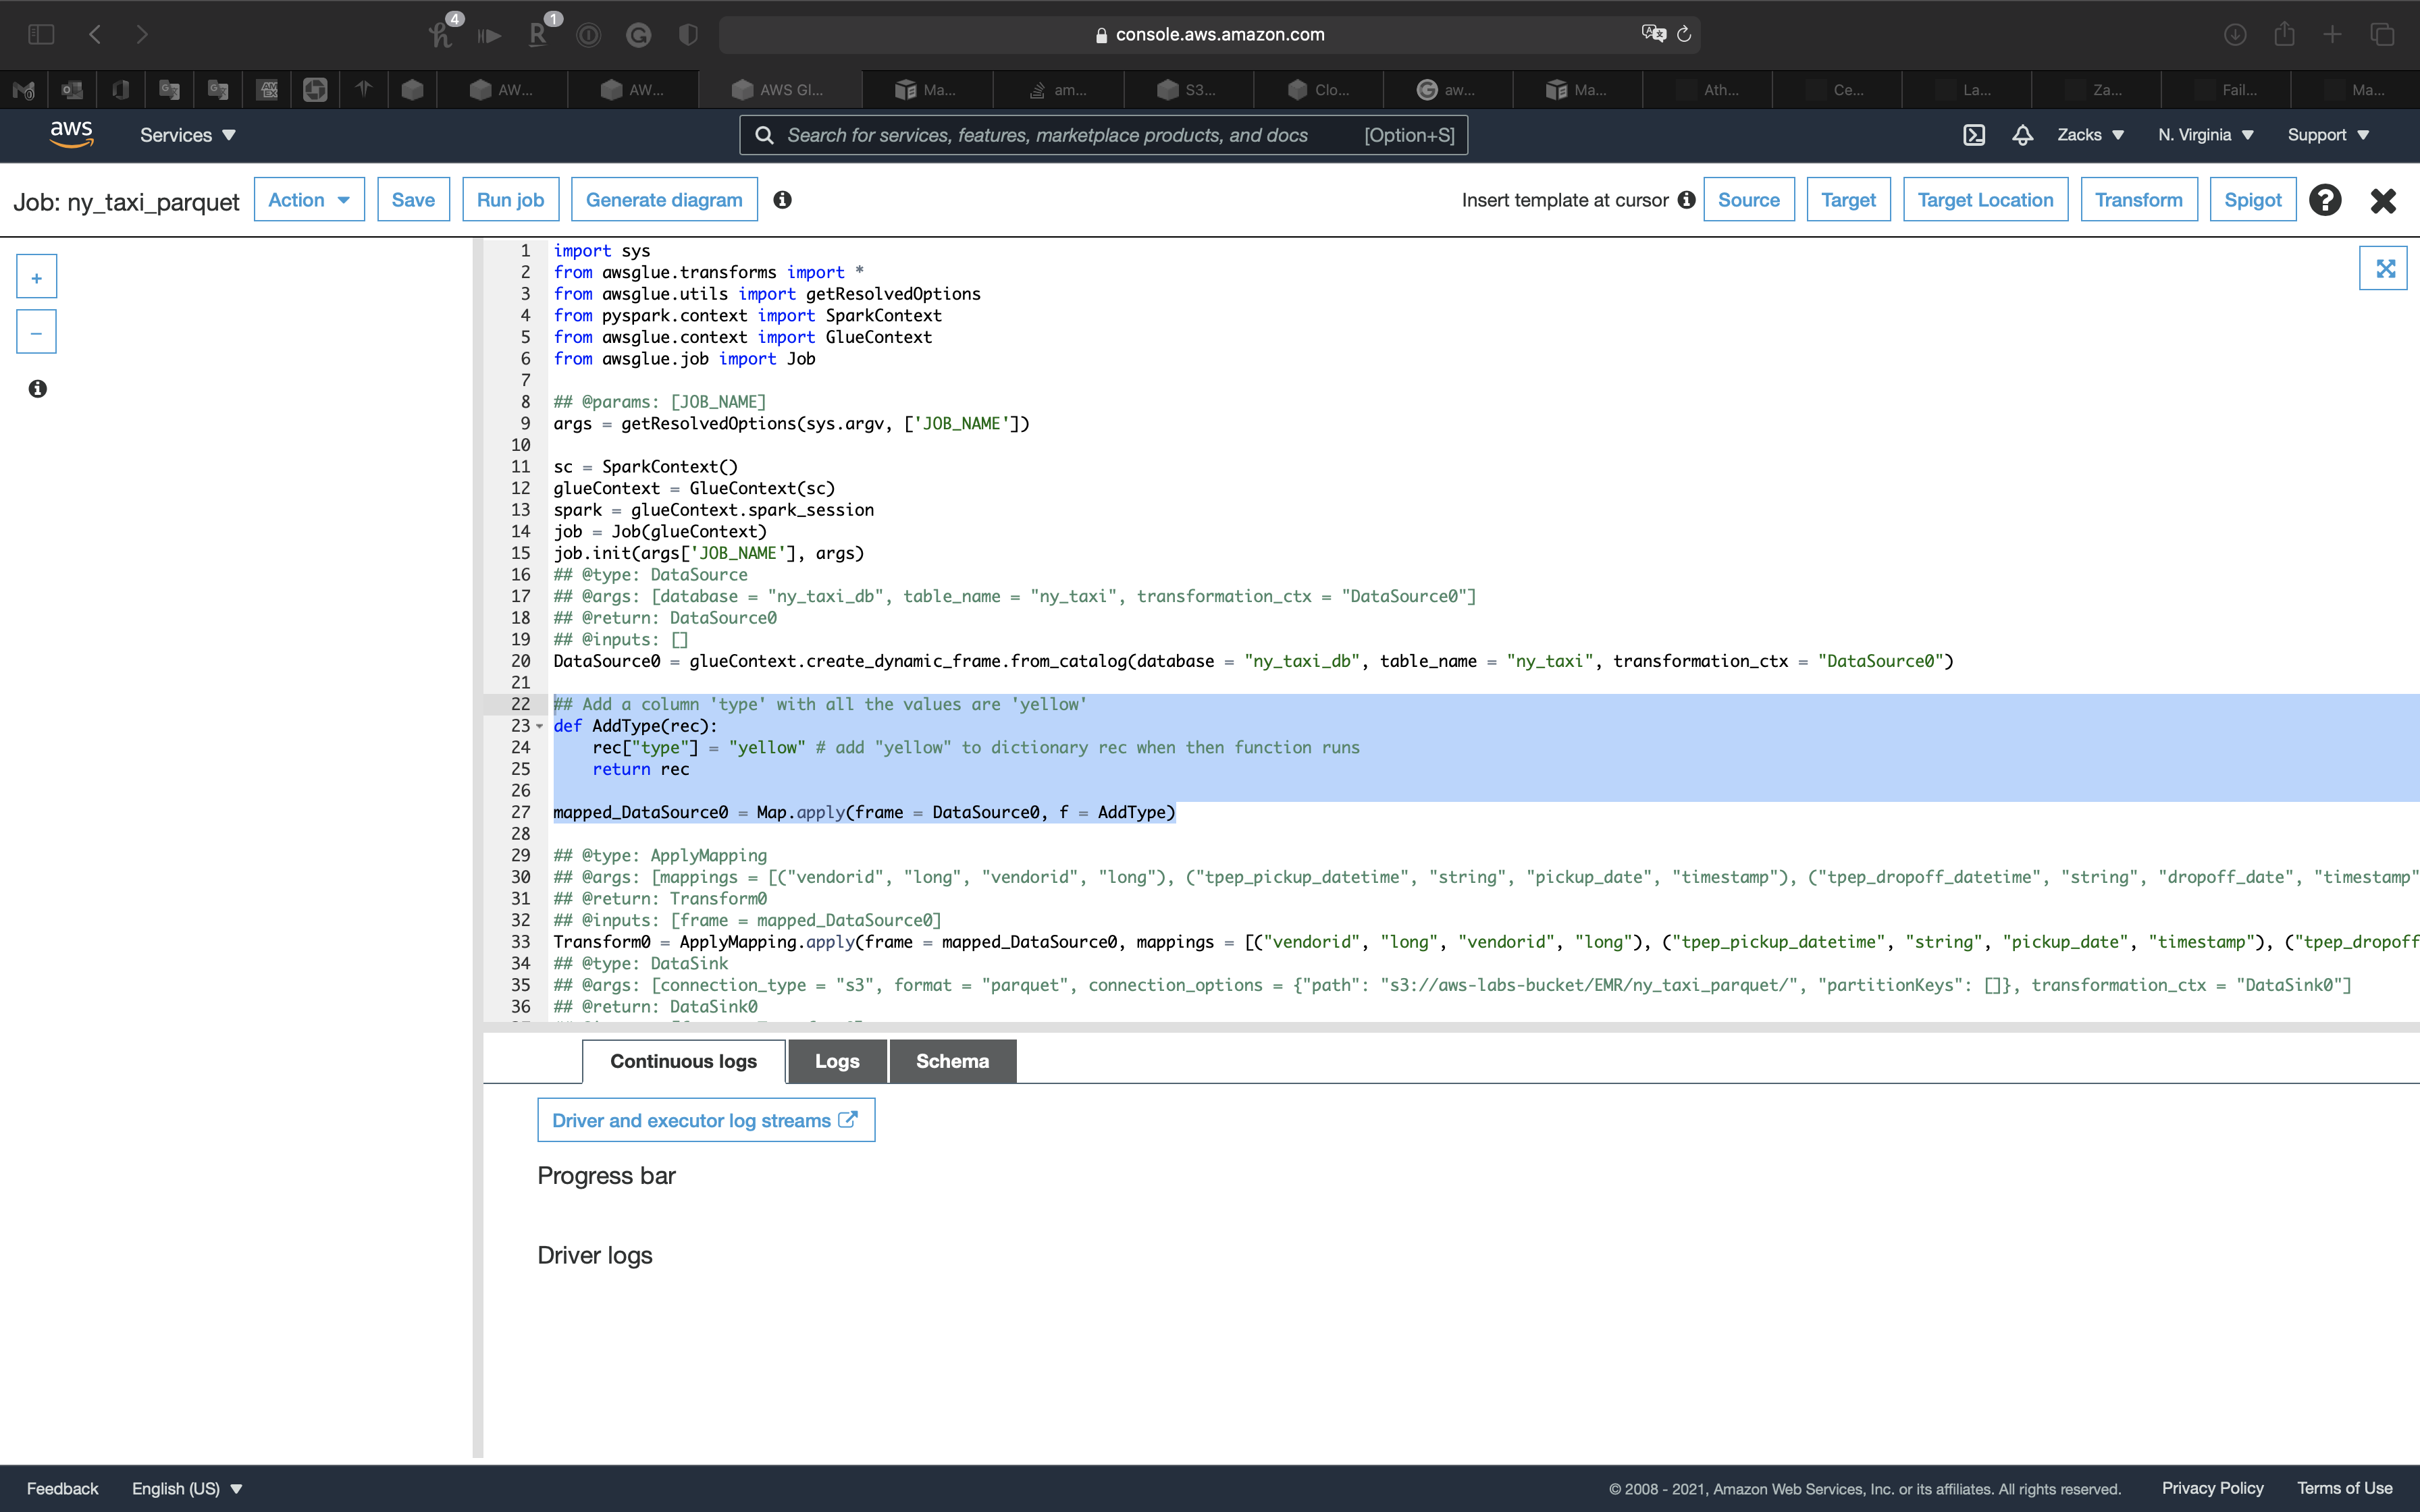
Add the following code to the end of Transform0 = ApplyMapping.apply()
1 | , ("type", "string", "type", "string") |
The complete code should be the following code. (Scroll right)
1 | Transform0 = ApplyMapping.apply(frame = mapped_DataSource0, mappings = [("vendorid", "long", "vendorid", "long"), ("tpep_pickup_datetime", "string", "pickup_date", "timestamp"), ("tpep_dropoff_datetime", "string", "dropoff_date", "timestamp"), ("passenger_count", "long", "passenger_count", "long"), ("trip_distance", "double", "trip_distance", "double"), ("pickup_longitude", "double", "pickup_longitude", "double"), ("pickup_latitude", "double", "pickup_latitude", "double"), ("ratecodeid", "long", "ratecodeid", "long"), ("store_and_fwd_flag", "string", "store_and_fwd_flag", "string"), ("dropoff_longitude", "double", "dropoff_longitude", "double"), ("dropoff_latitude", "double", "dropoff_latitude", "double"), ("payment_type", "long", "payment_type", "long"), ("fare_amount", "double", "fare_amount", "double"), ("extra", "double", "extra", "double"), ("mta_tax", "double", "mta_tax", "double"), ("tip_amount", "double", "tip_amount", "double"), ("tolls_amount", "double", "tolls_amount", "double"), ("improvement_surcharge", "double", "improvement_surcharge", "double"), ("total_amount", "double", "total_amount", "double"), ("type", "string", "type", "string")], transformation_ctx = "Transform0") |
Modify Transform0 = ApplyMapping.apply(frame = DataSource0, to Transform0 = ApplyMapping.apply(frame = mapped_DataSource0,
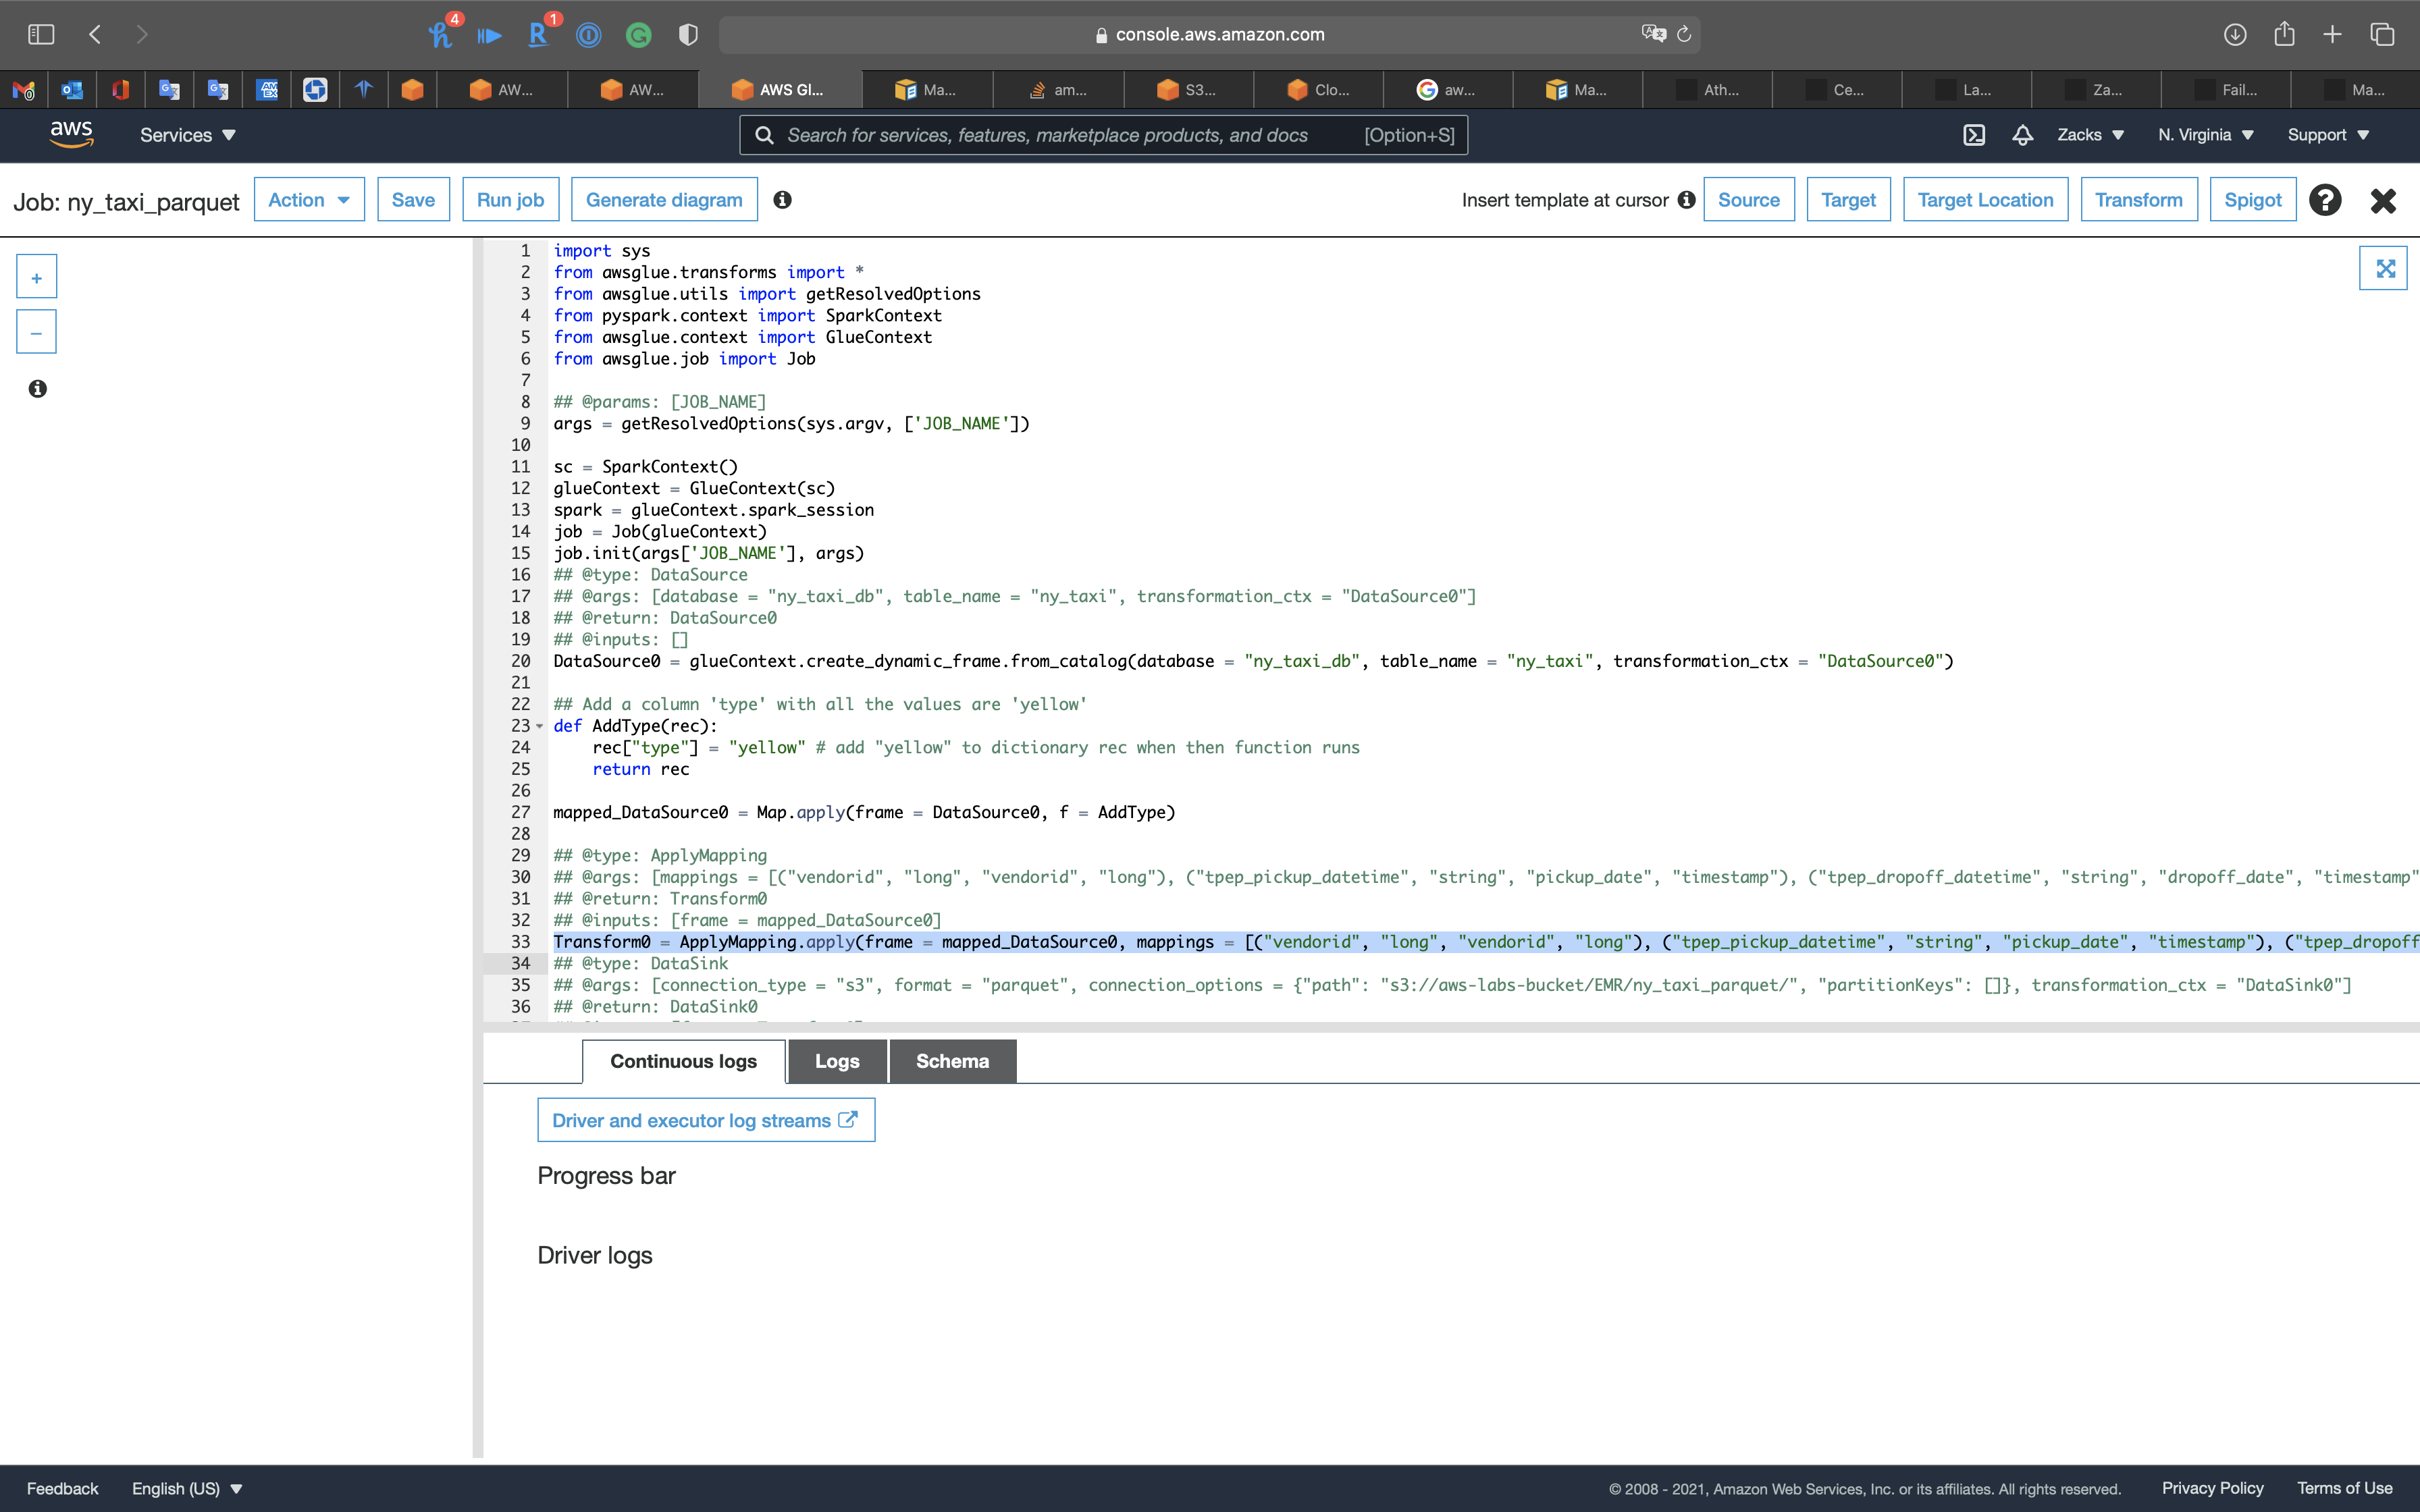
Click on X on the right of the page.
Then select ny_taxi_parquet, click on Action -> Run job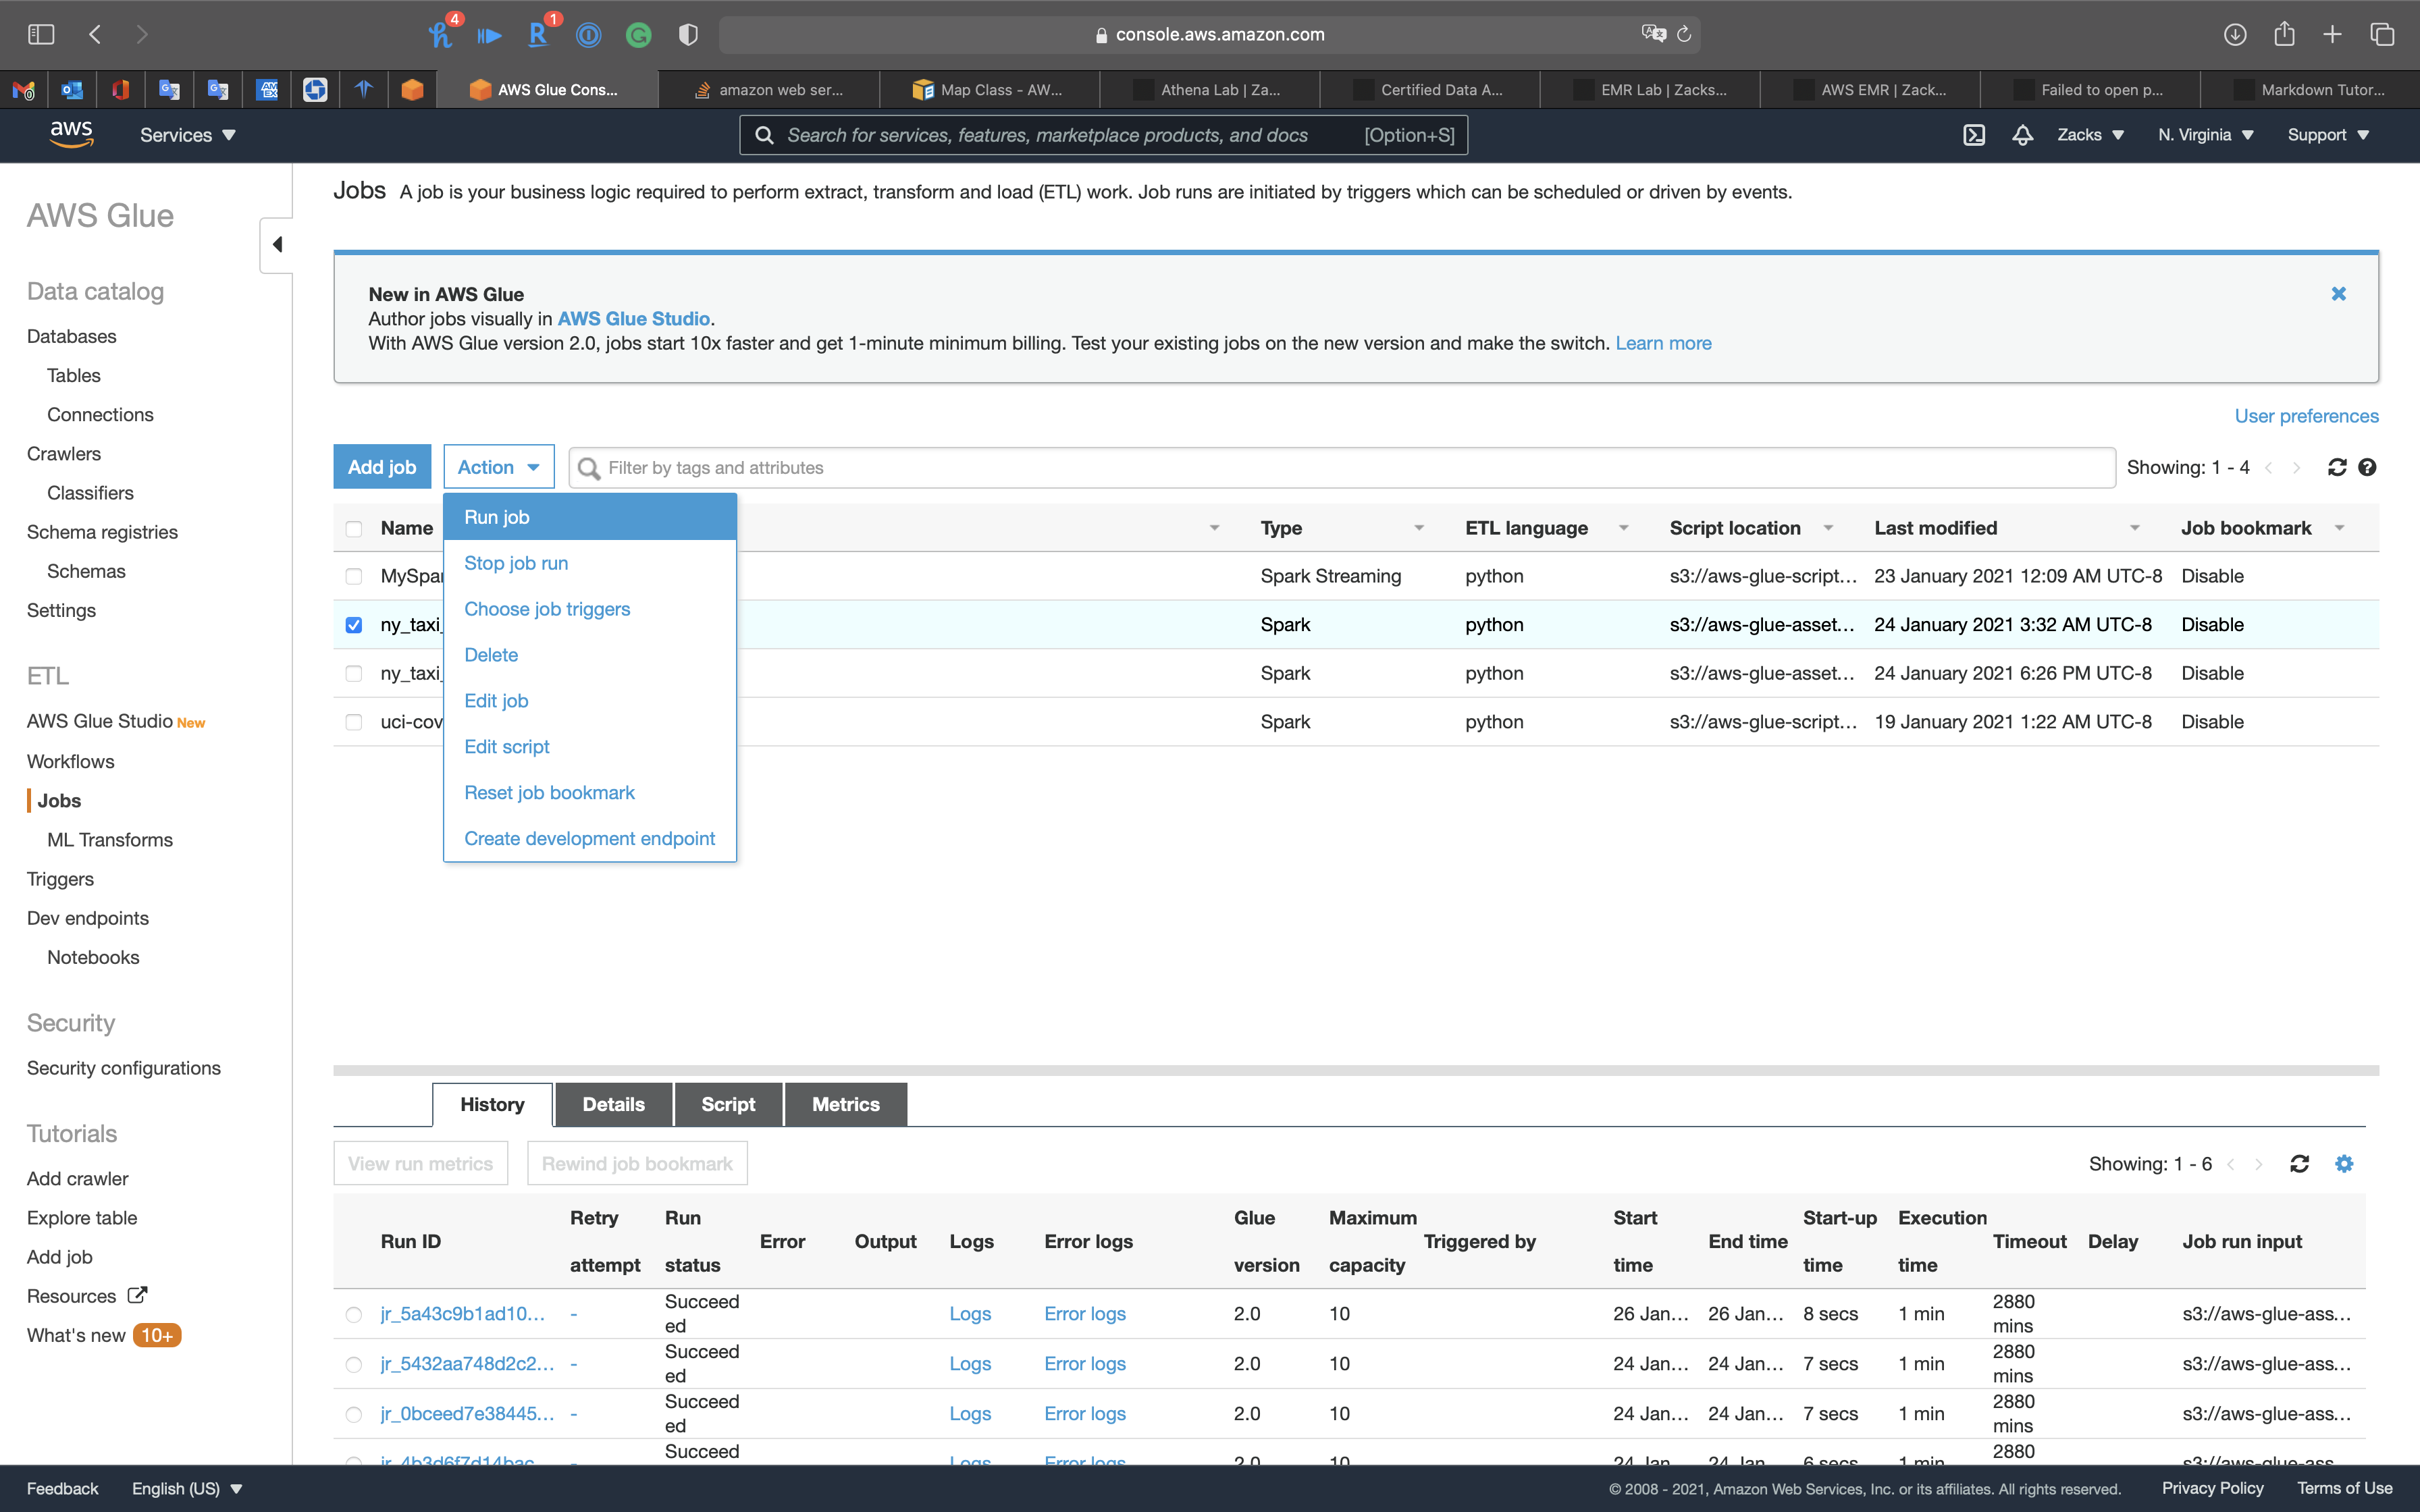
Click on Run job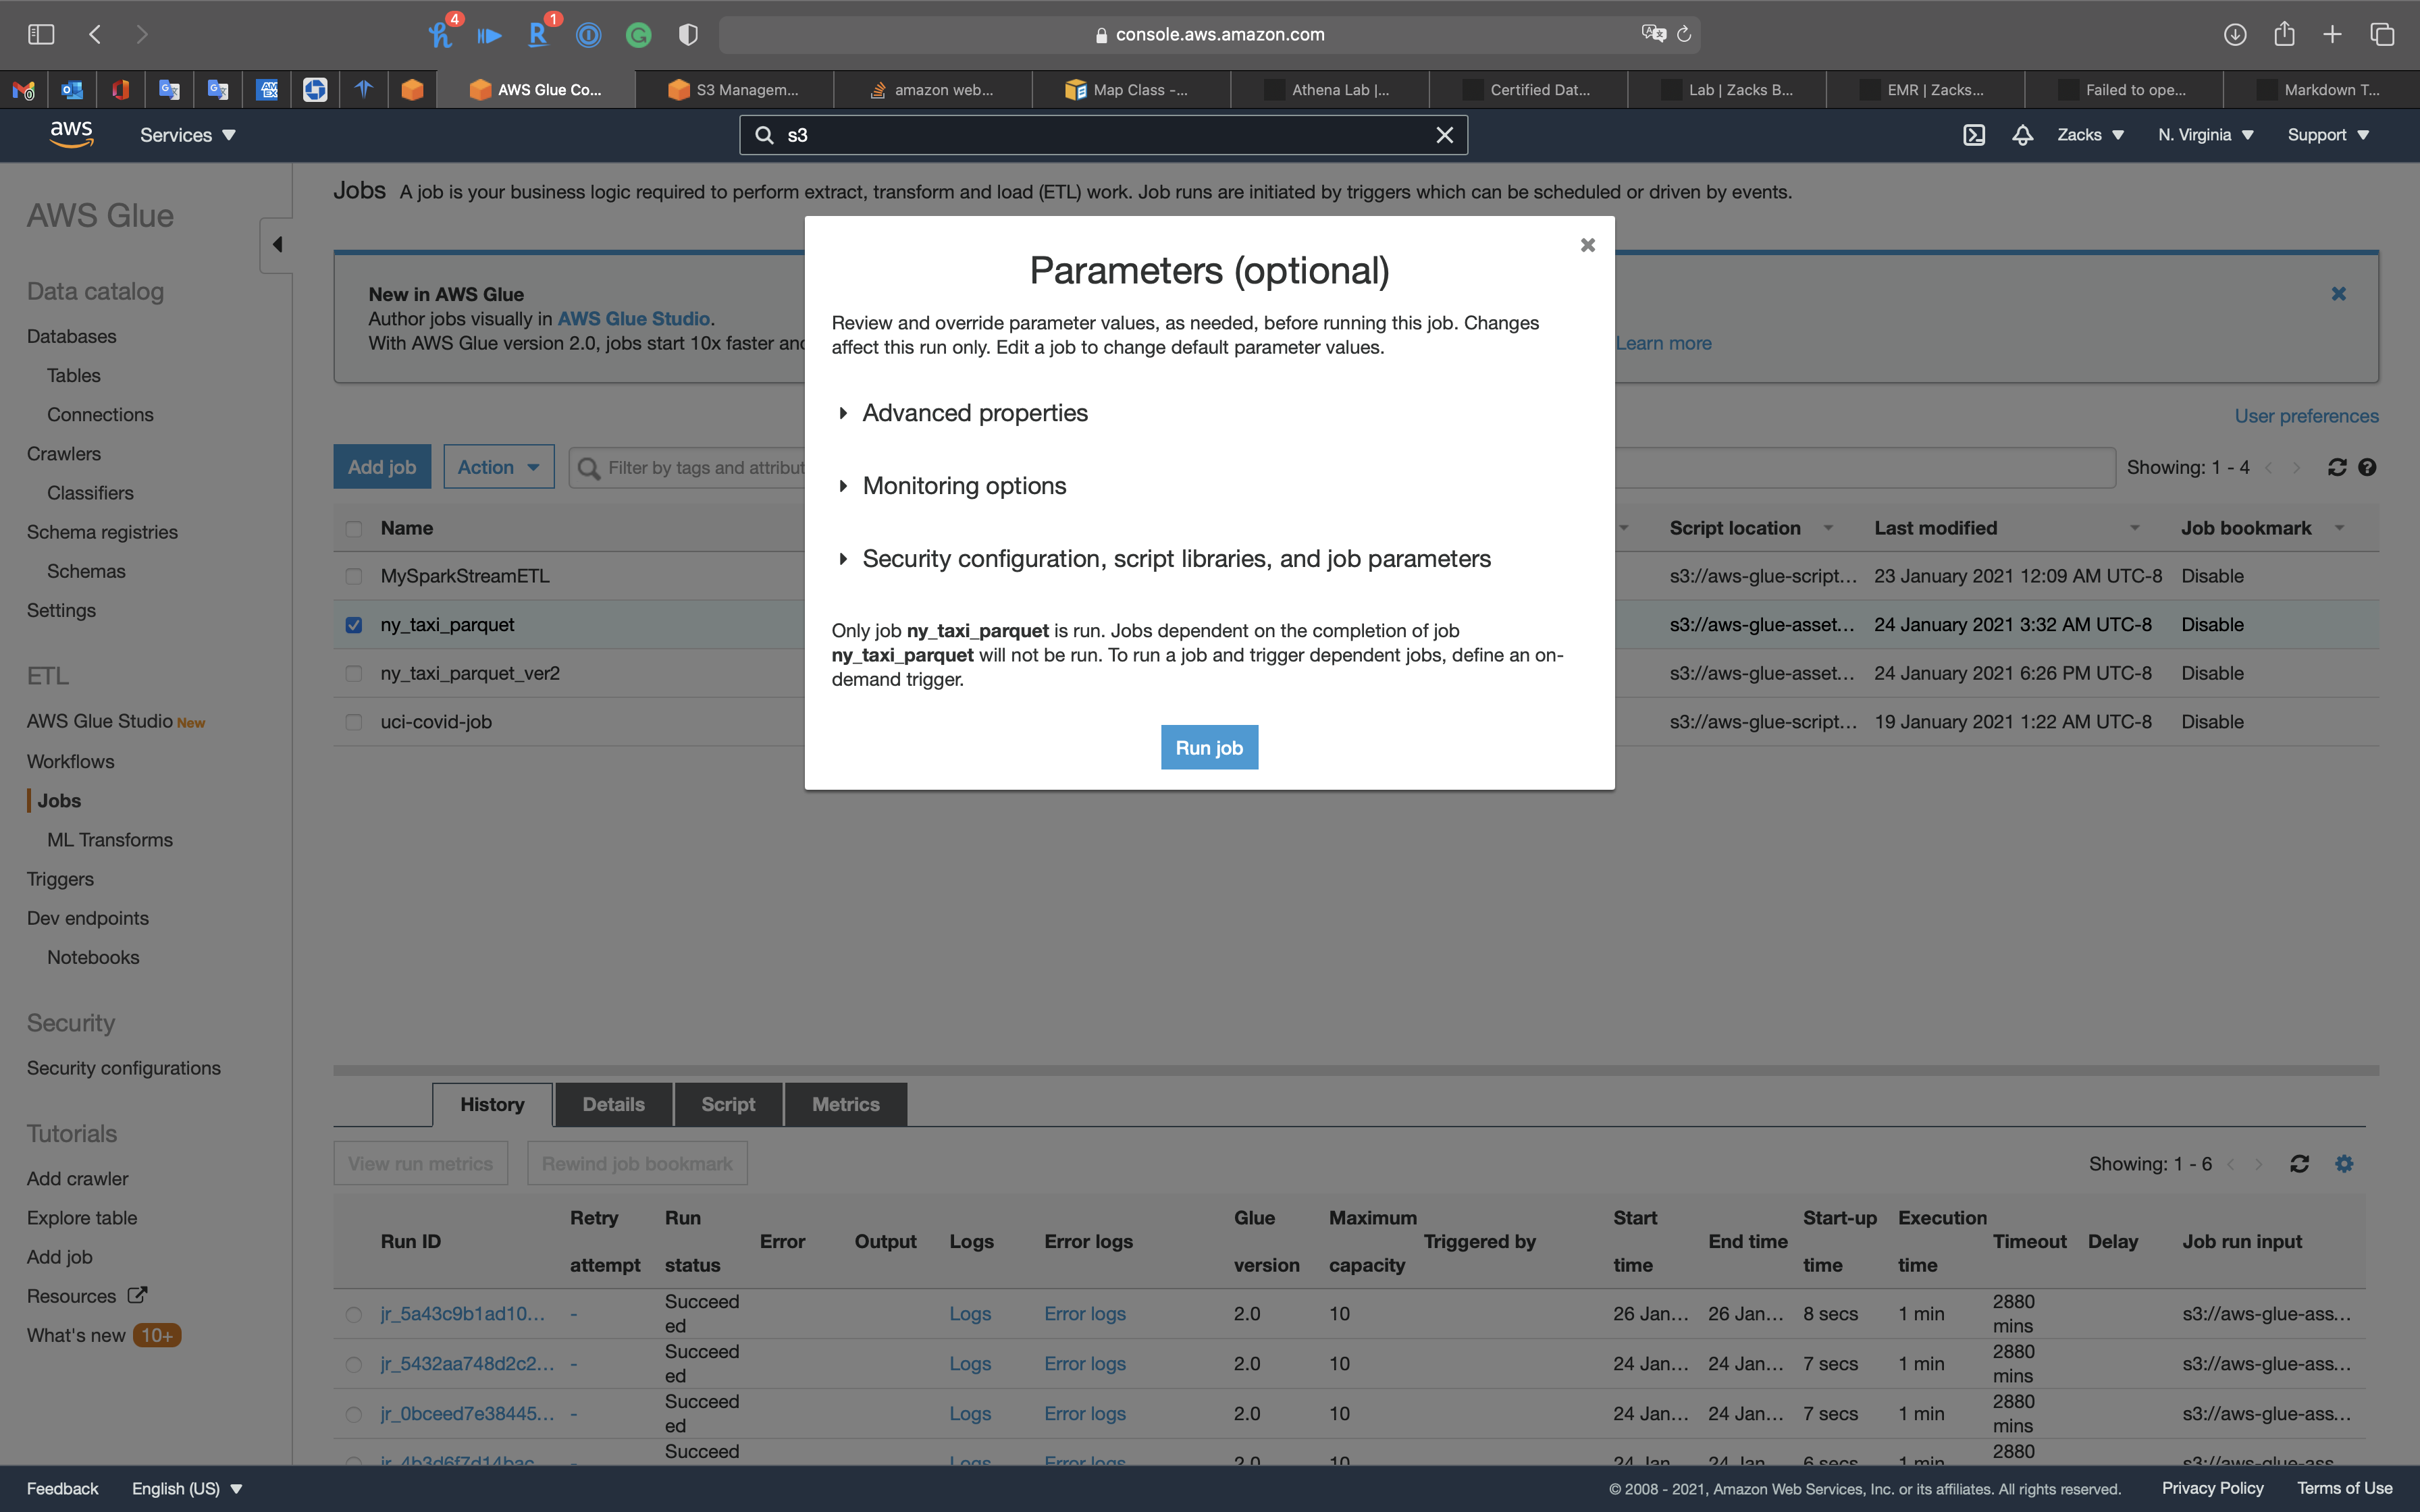
Select ny_taxi_parquet to see the History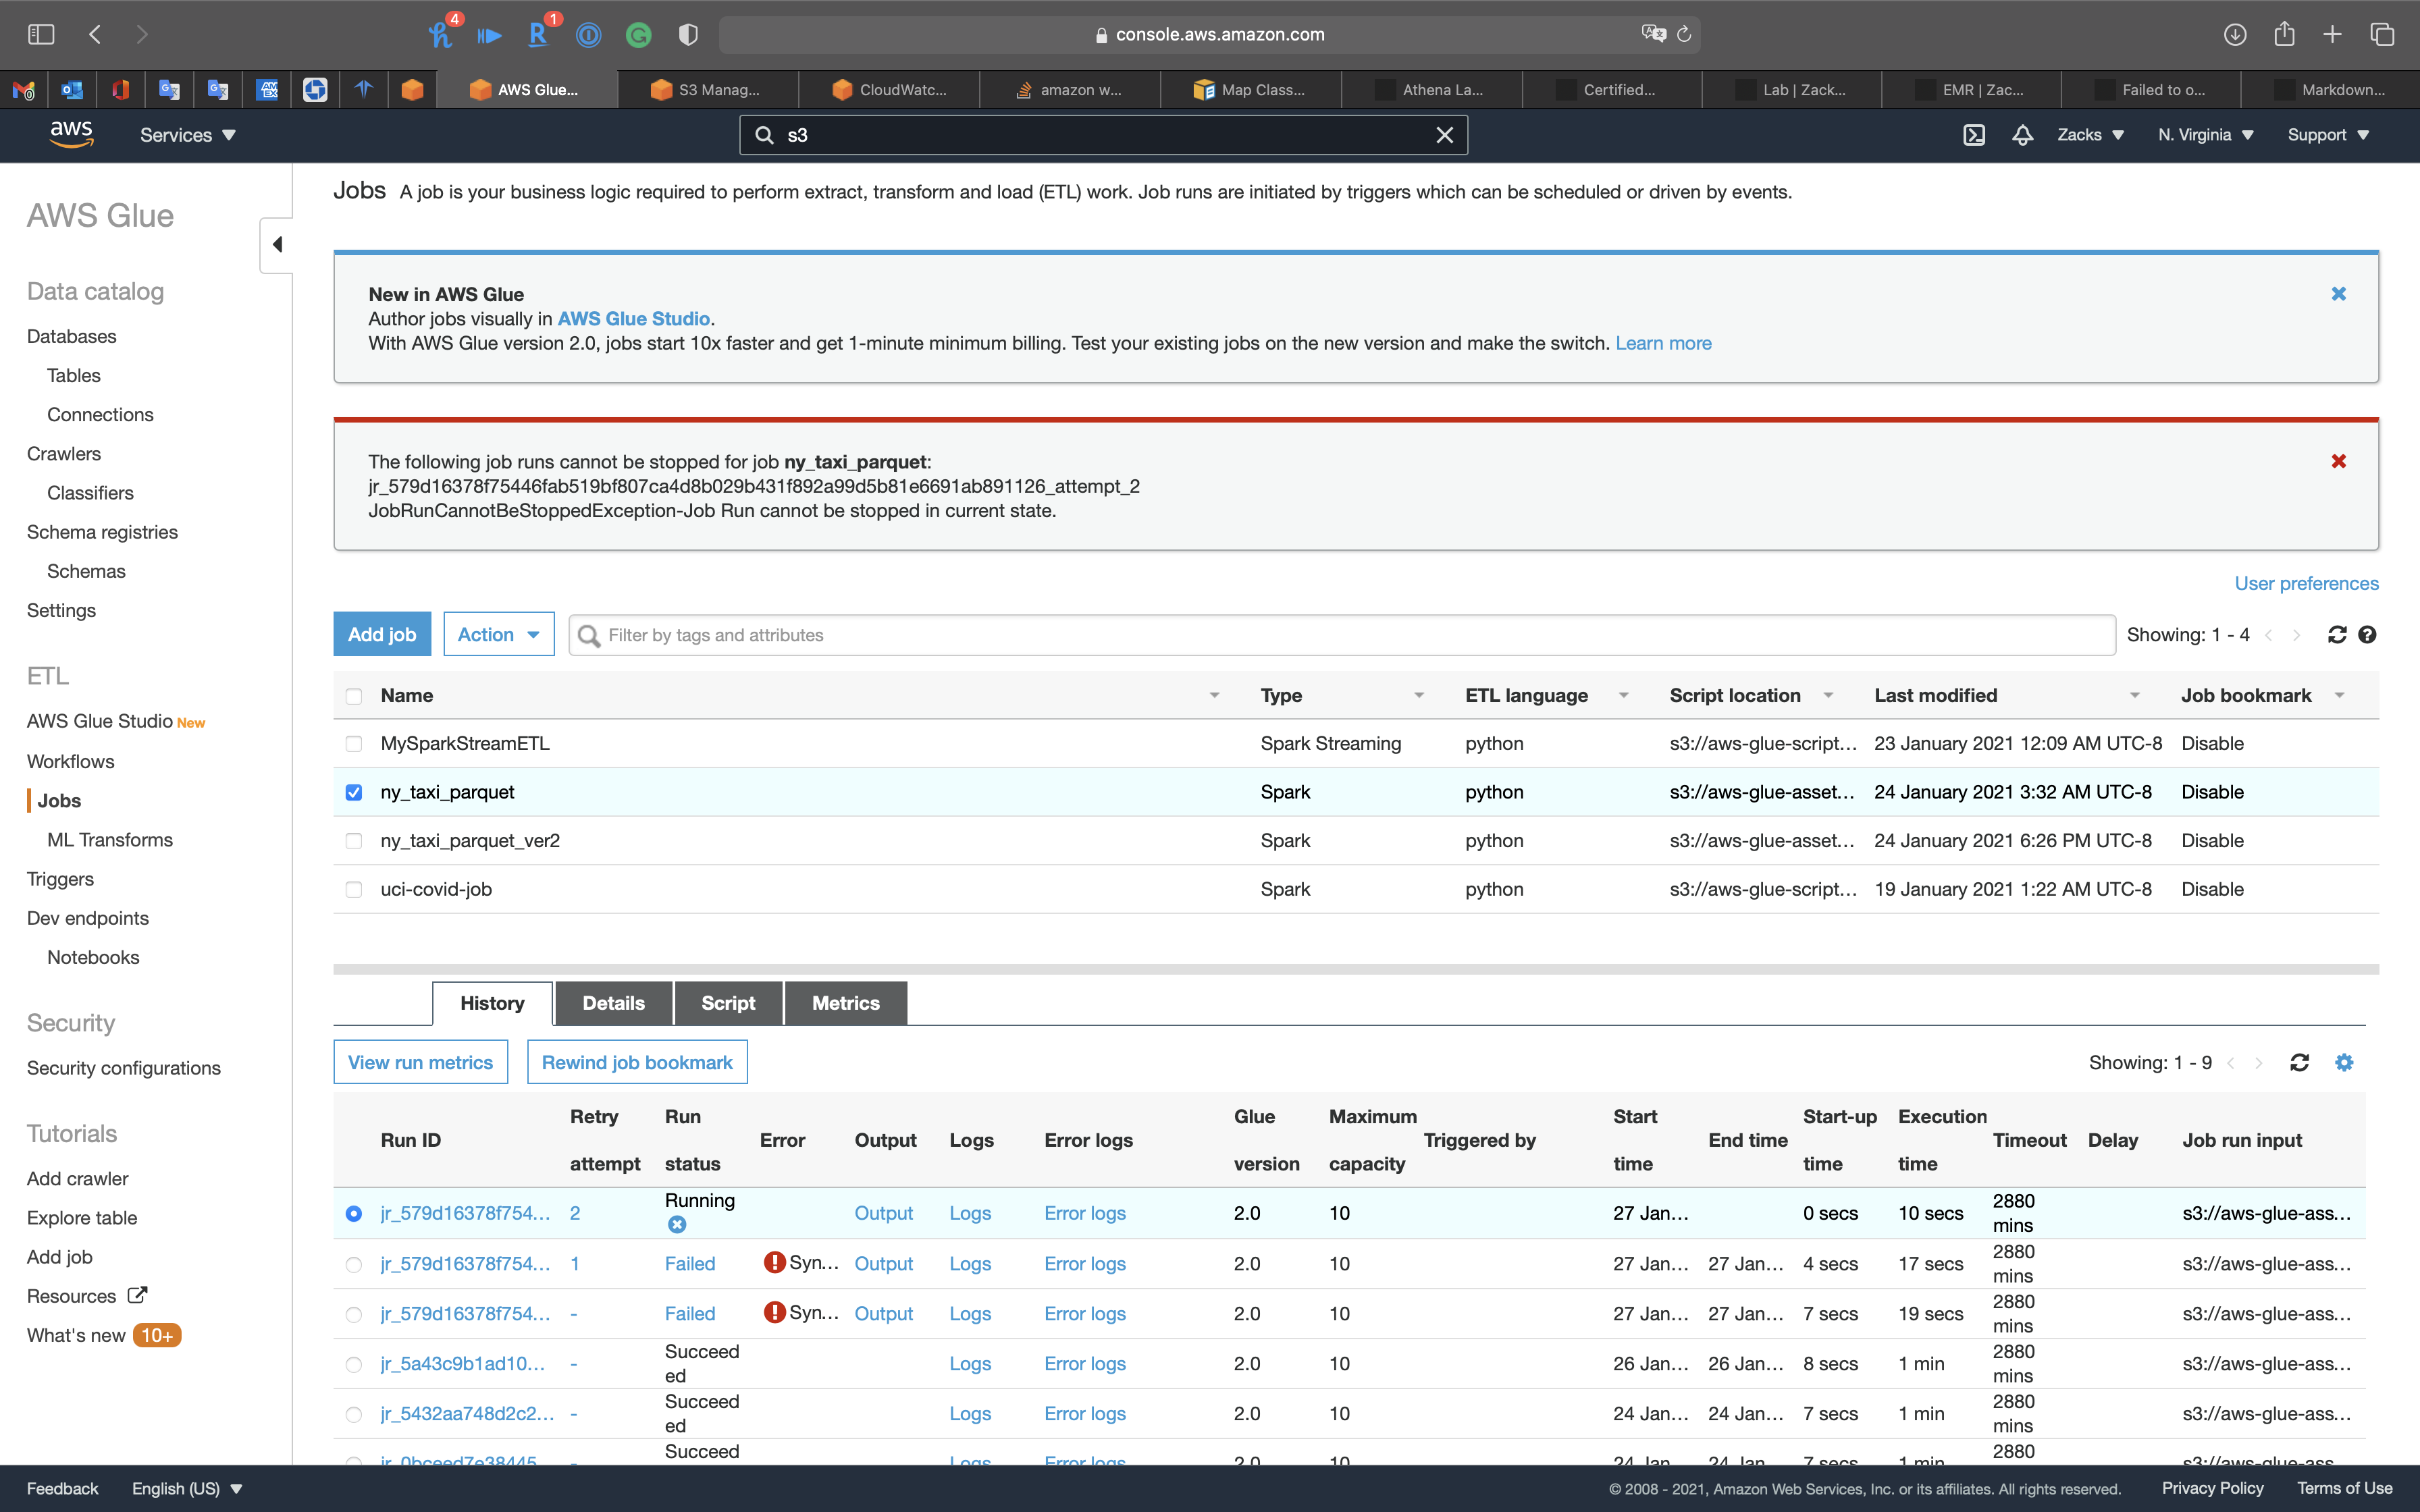
We can also check the S3 bucket.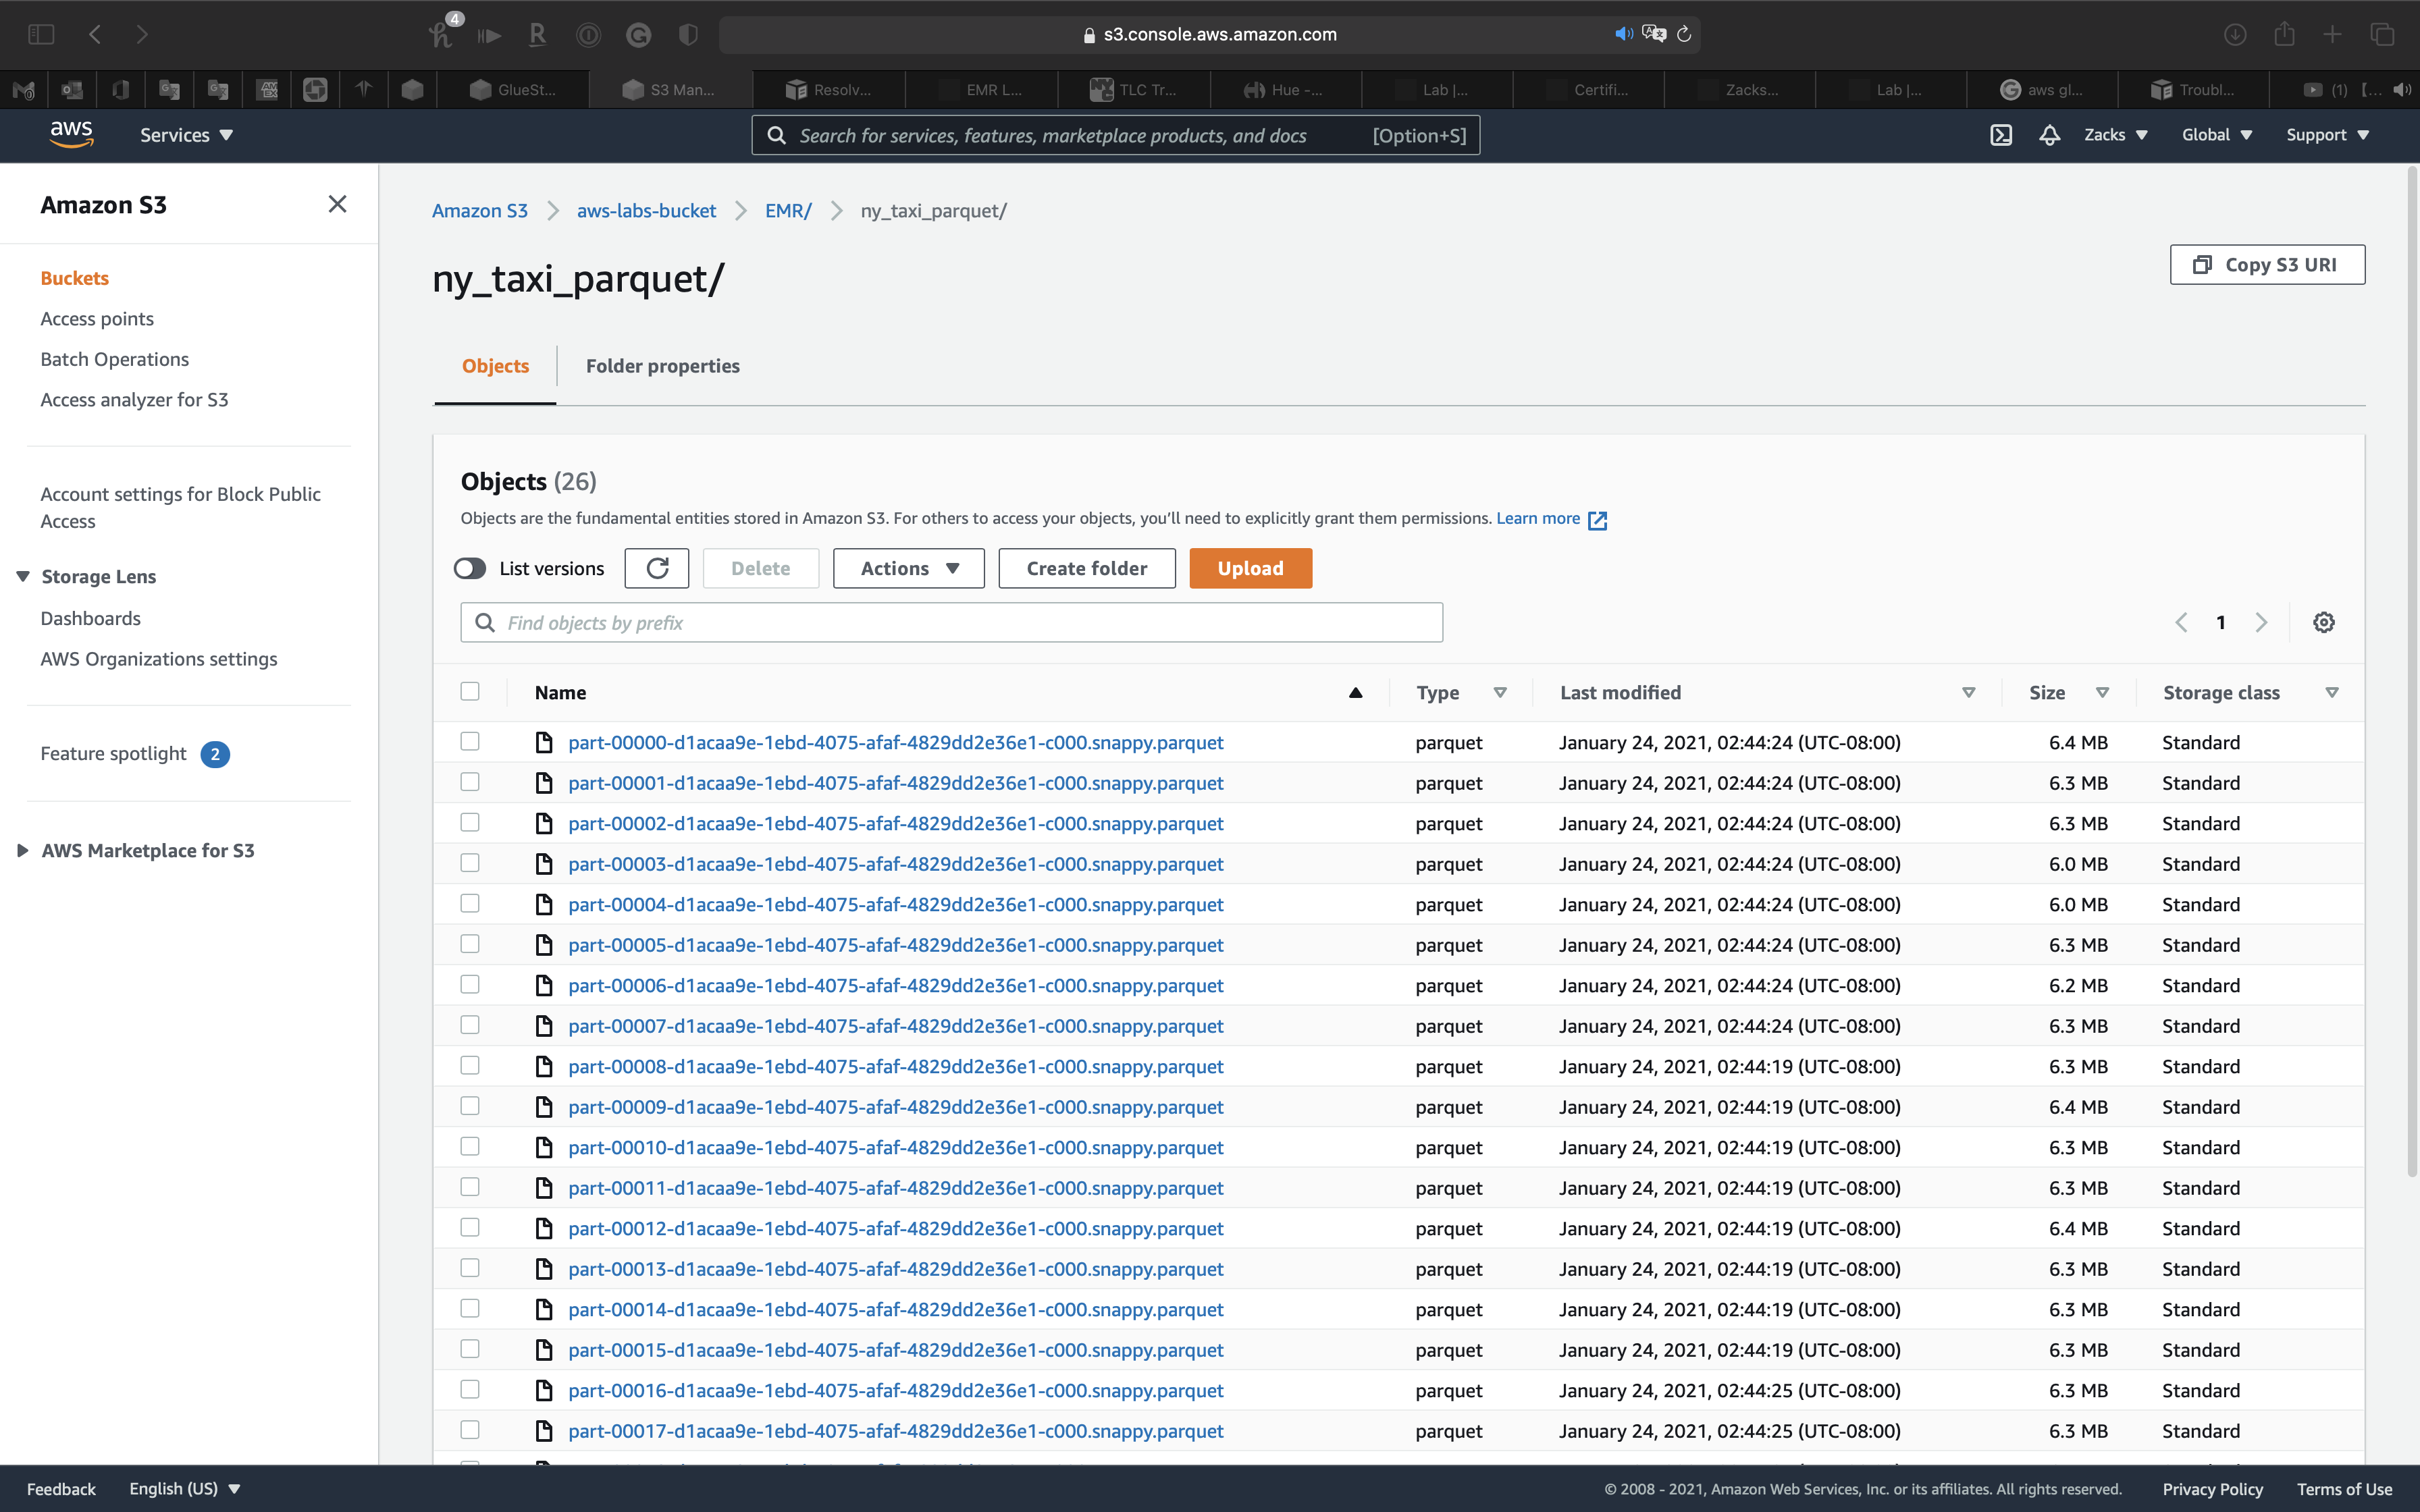
Create Transformed Data Table through Crawler
Use Crawler to craw the .parquet files metadata.
Services -> Glue -> Databases
Click on ny_taxi_db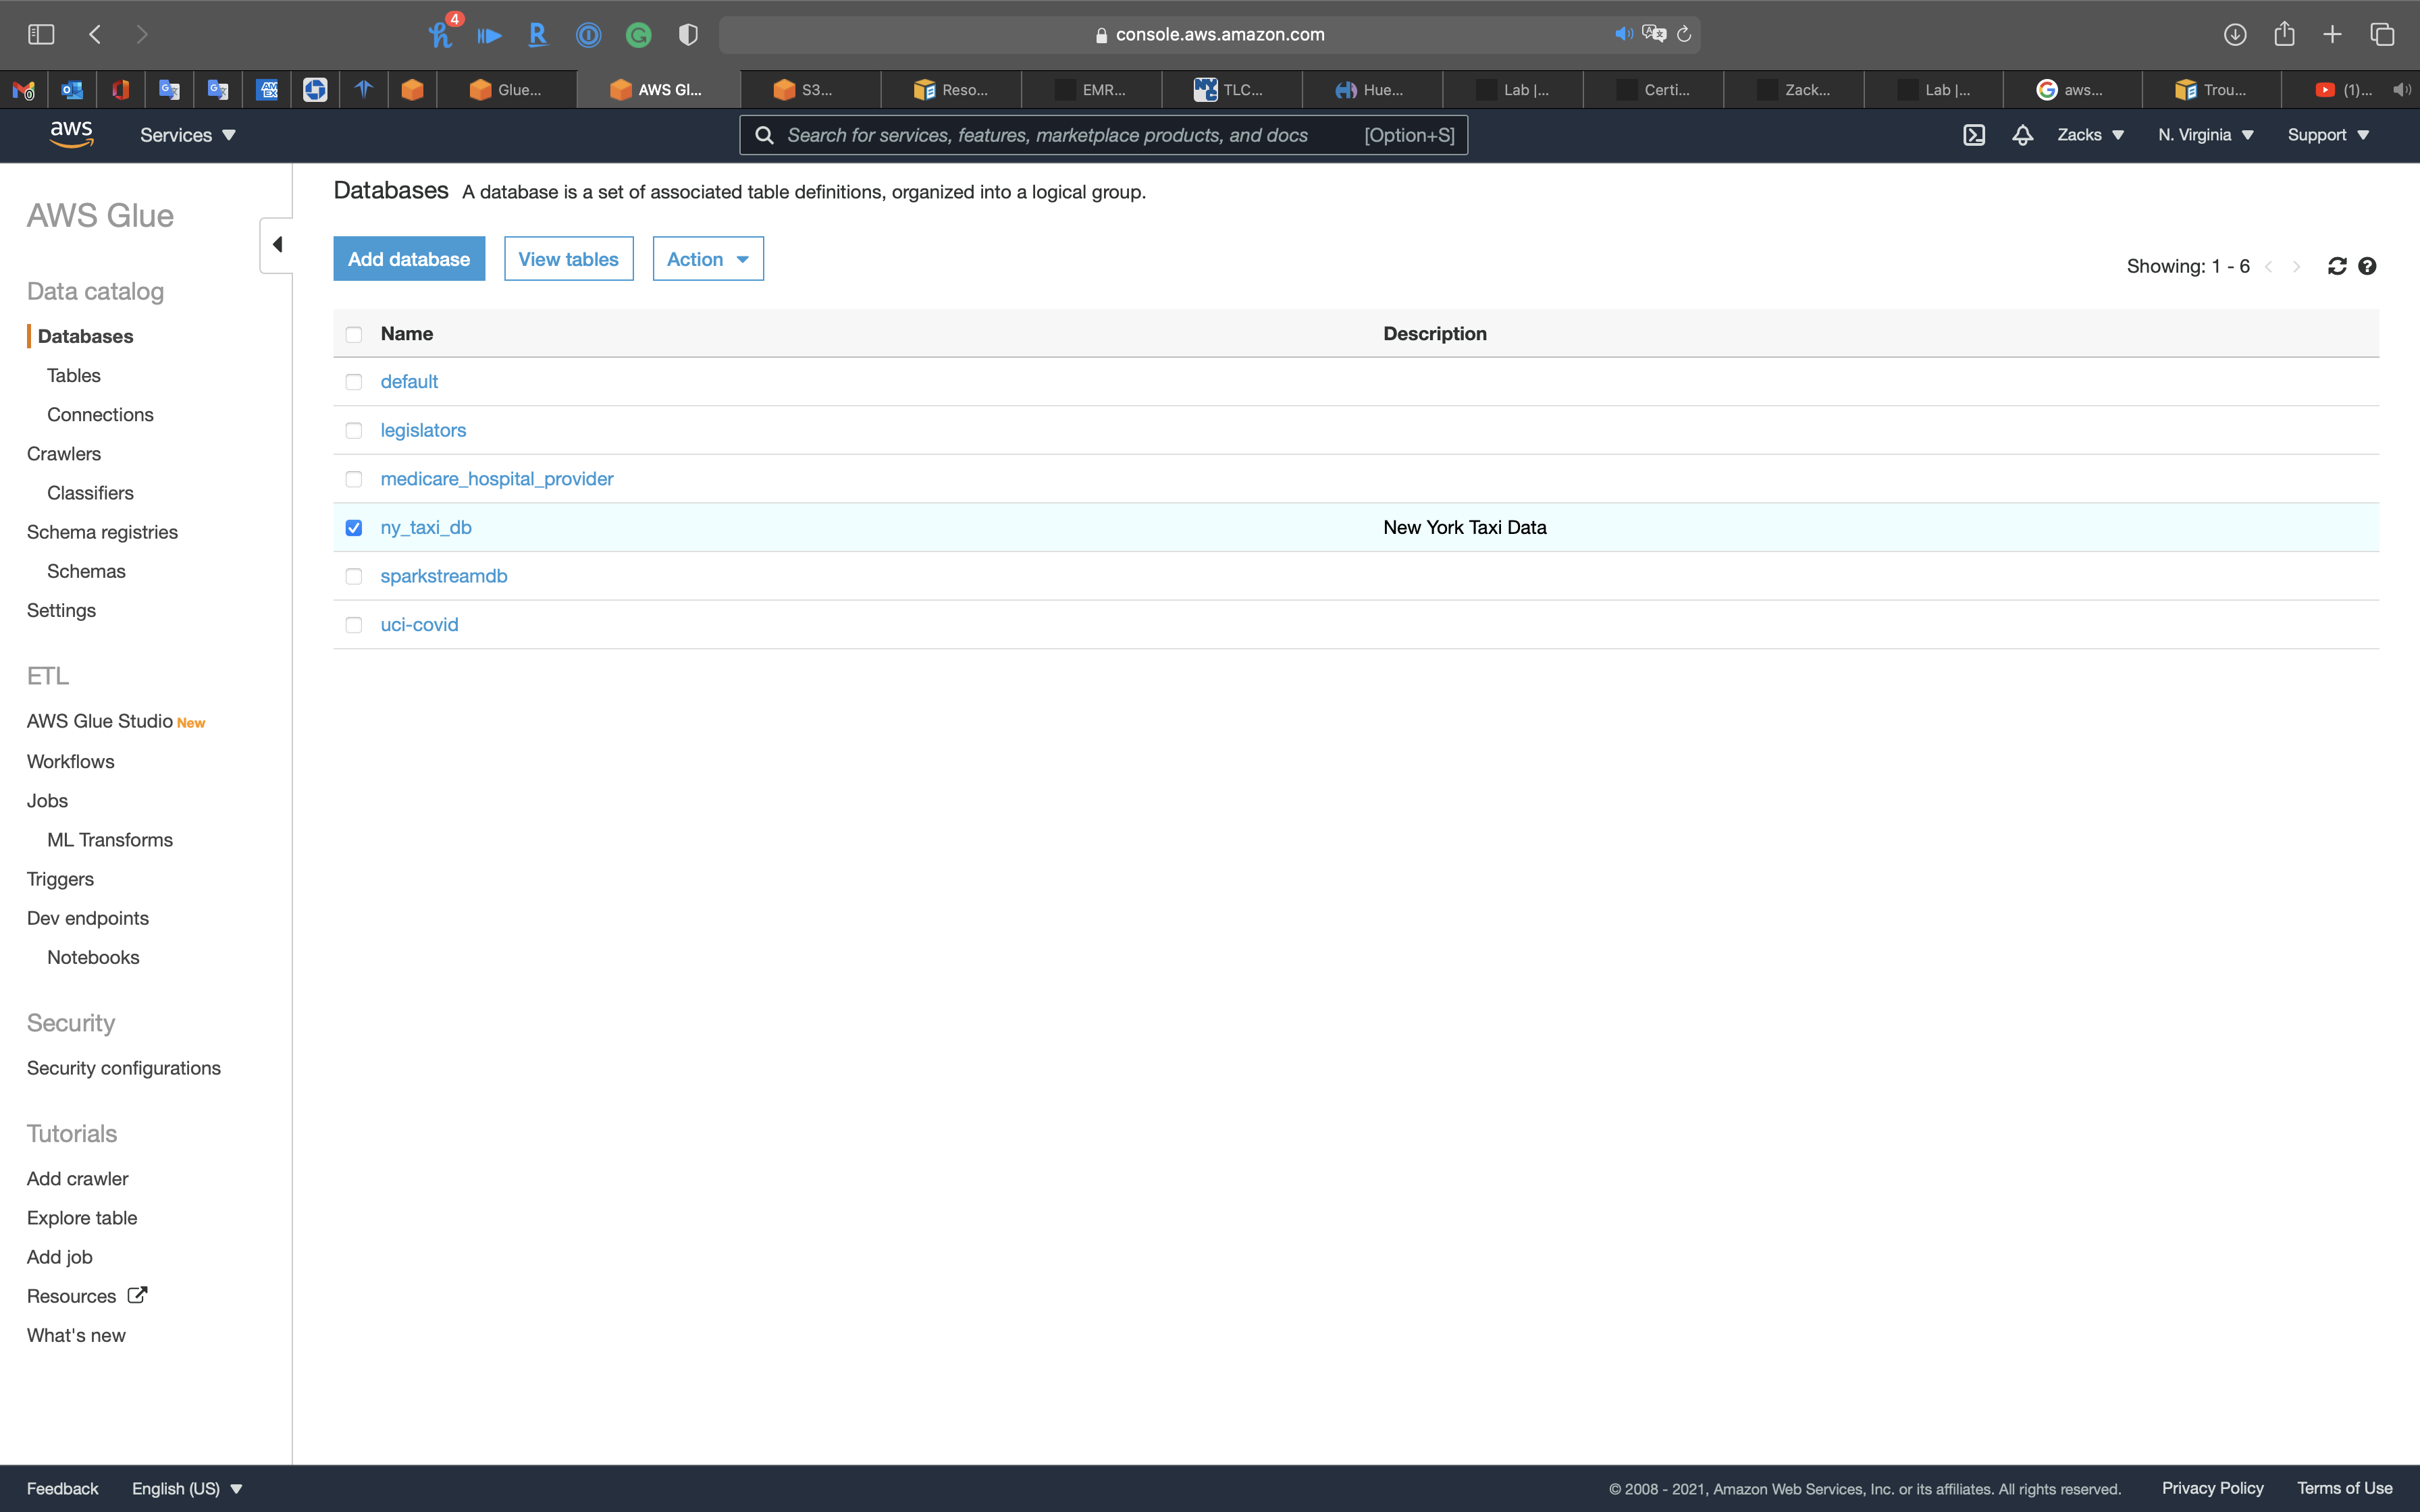
Click on Add tables -> add tables using a crawler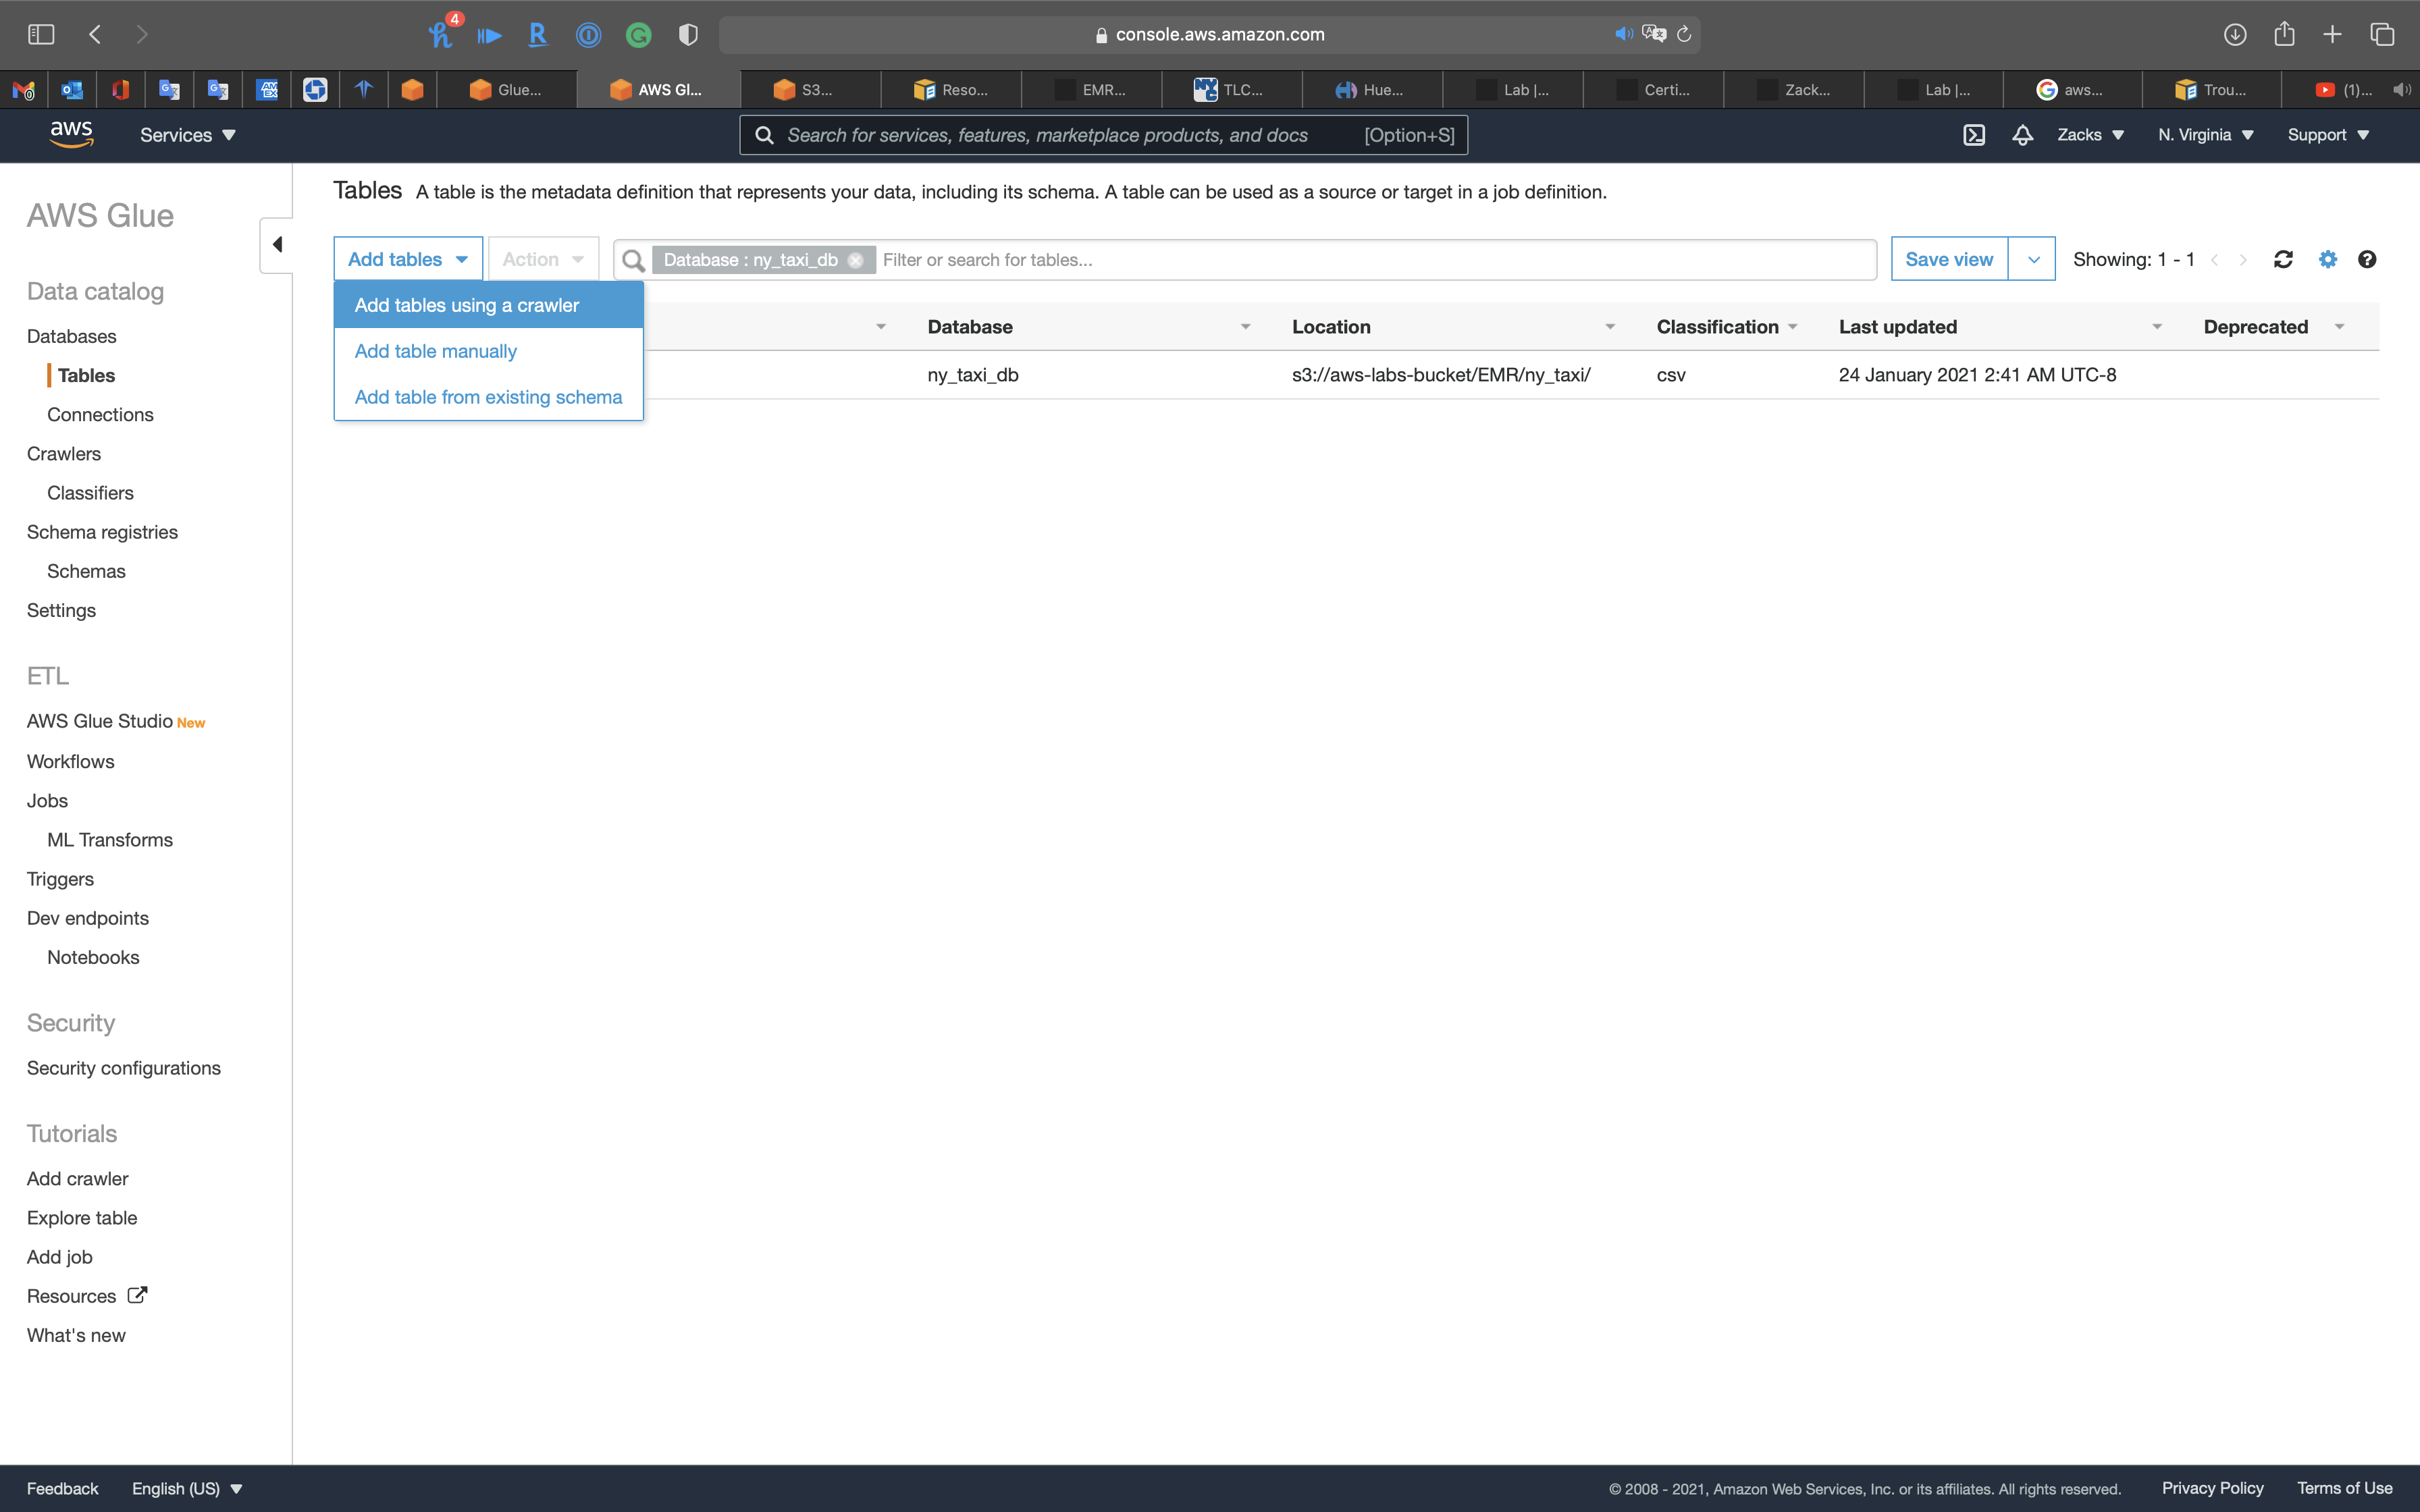
Crawler Info
- Crawler name:
ny_taxi_parquet_crawler
Click on Next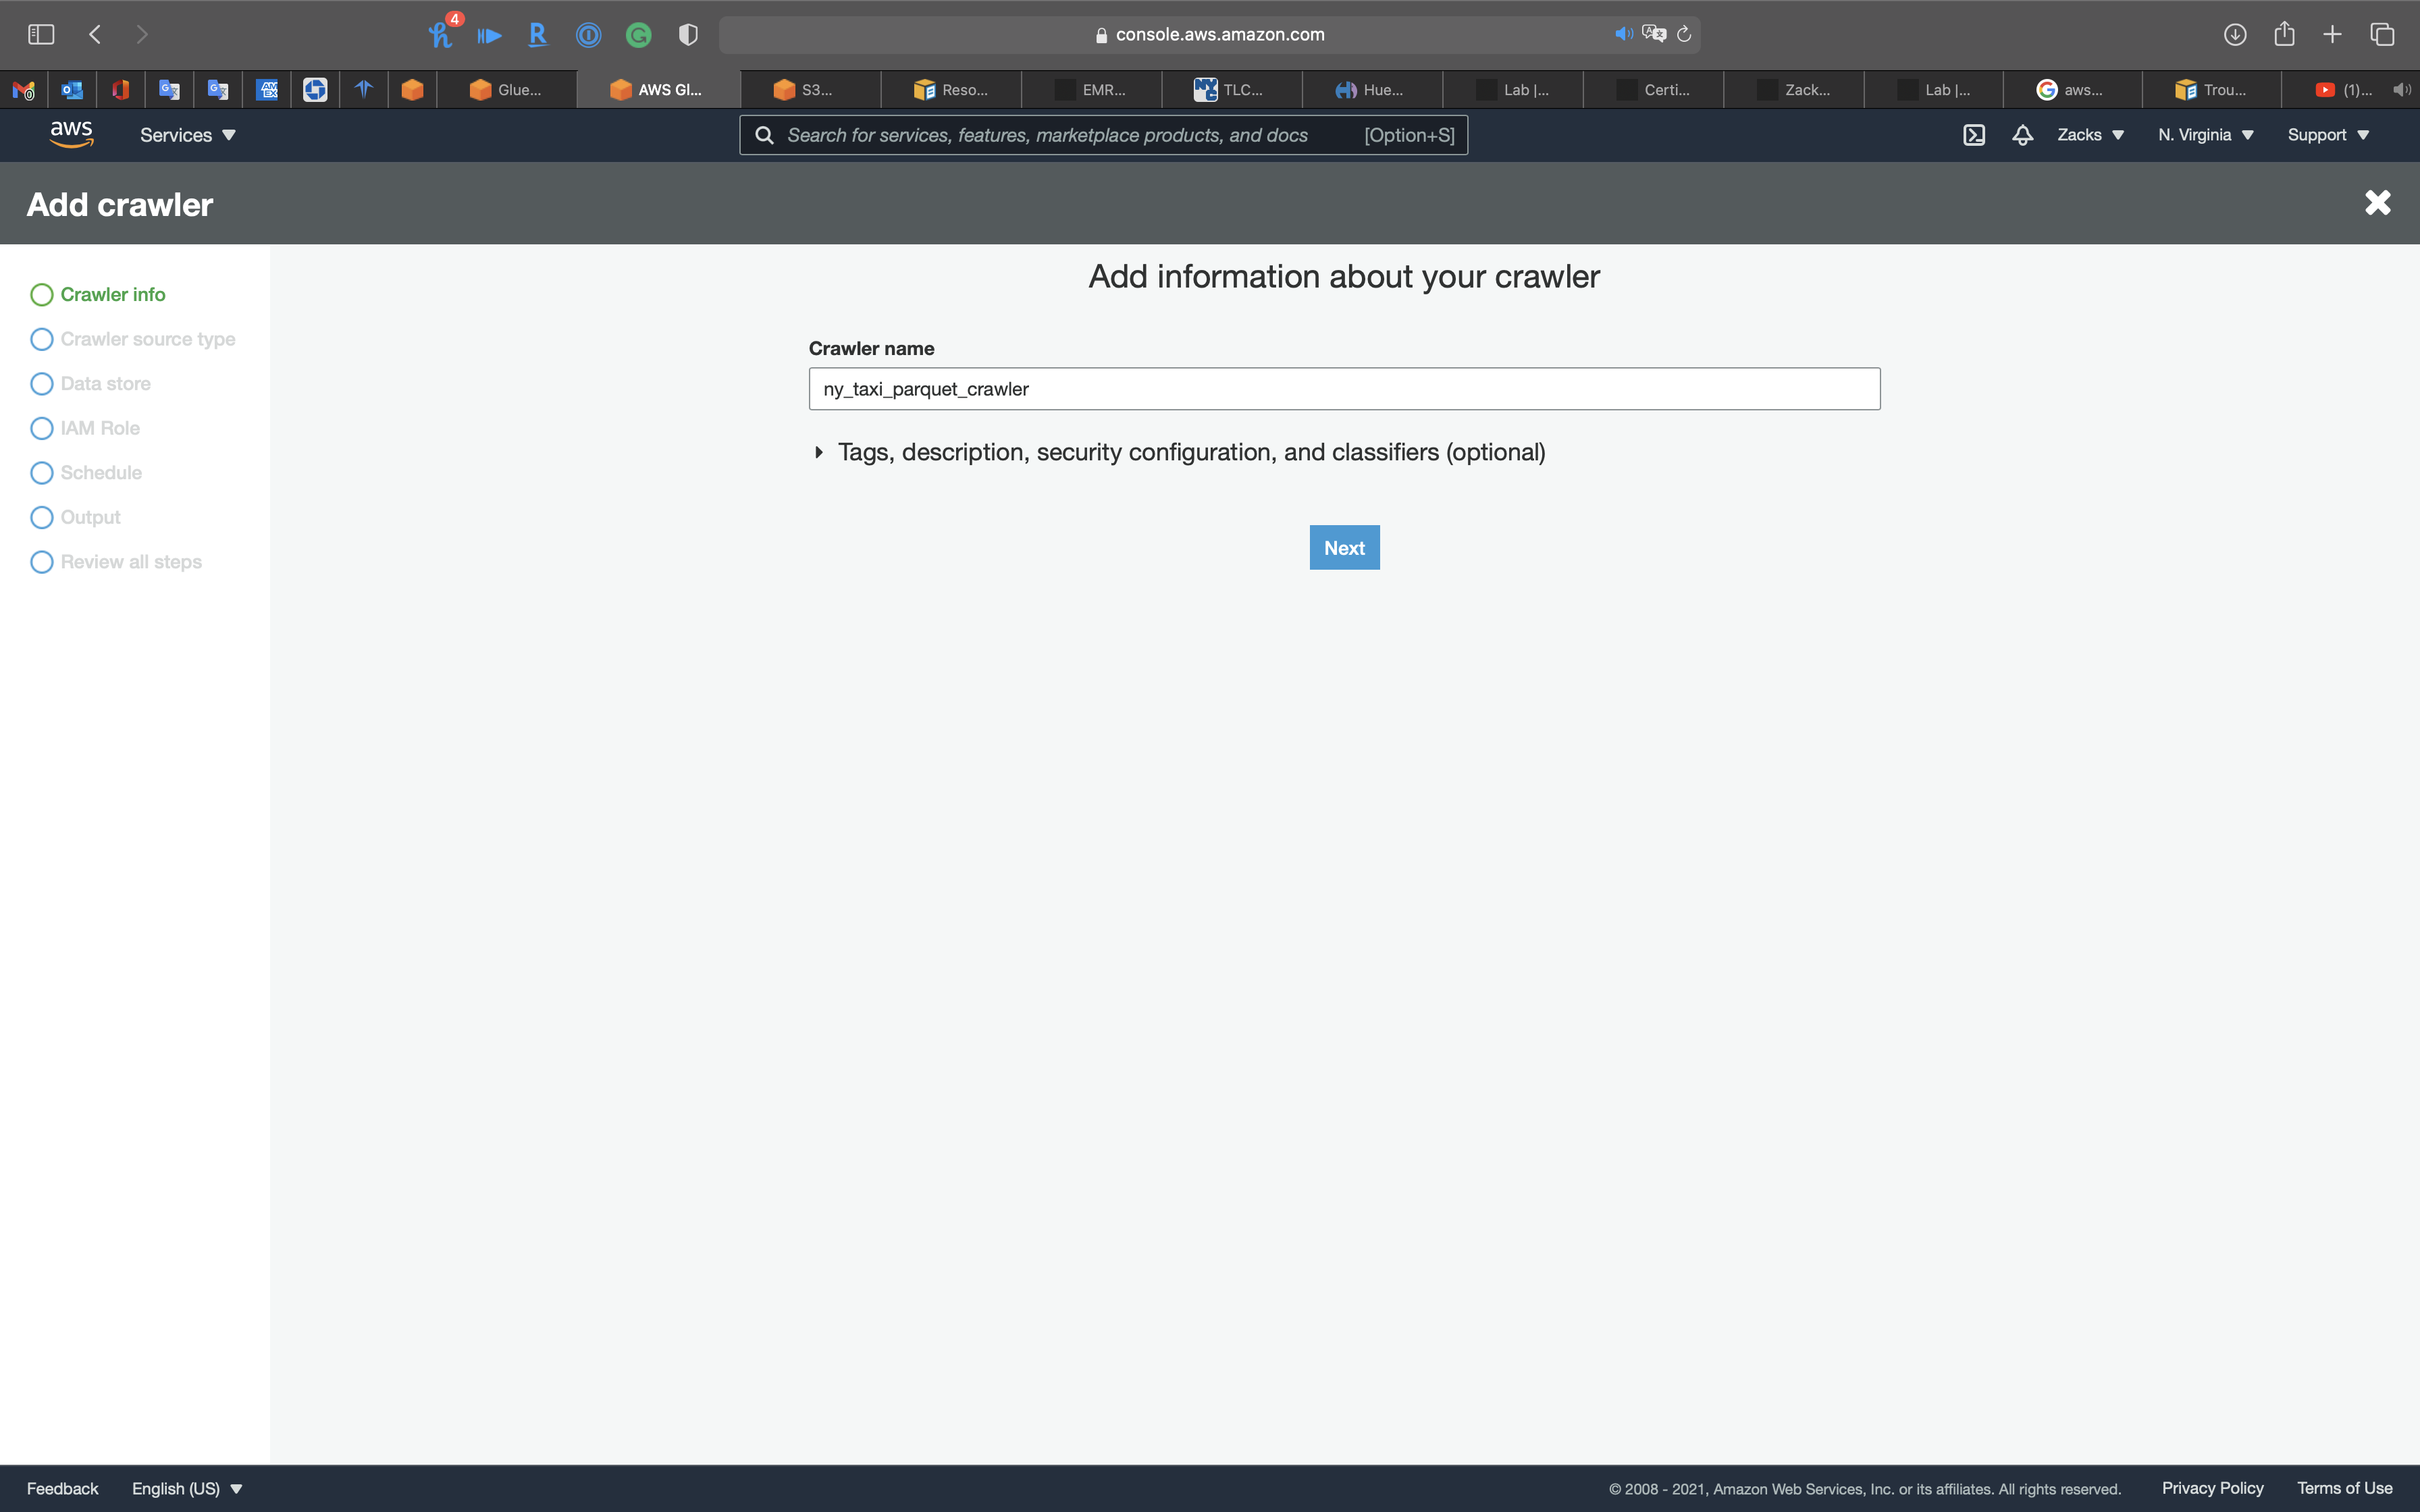
Crawler source type
Click on Next
Data store
- Choose a data store:
S3 - Include path: your S3 bucket
Click on Next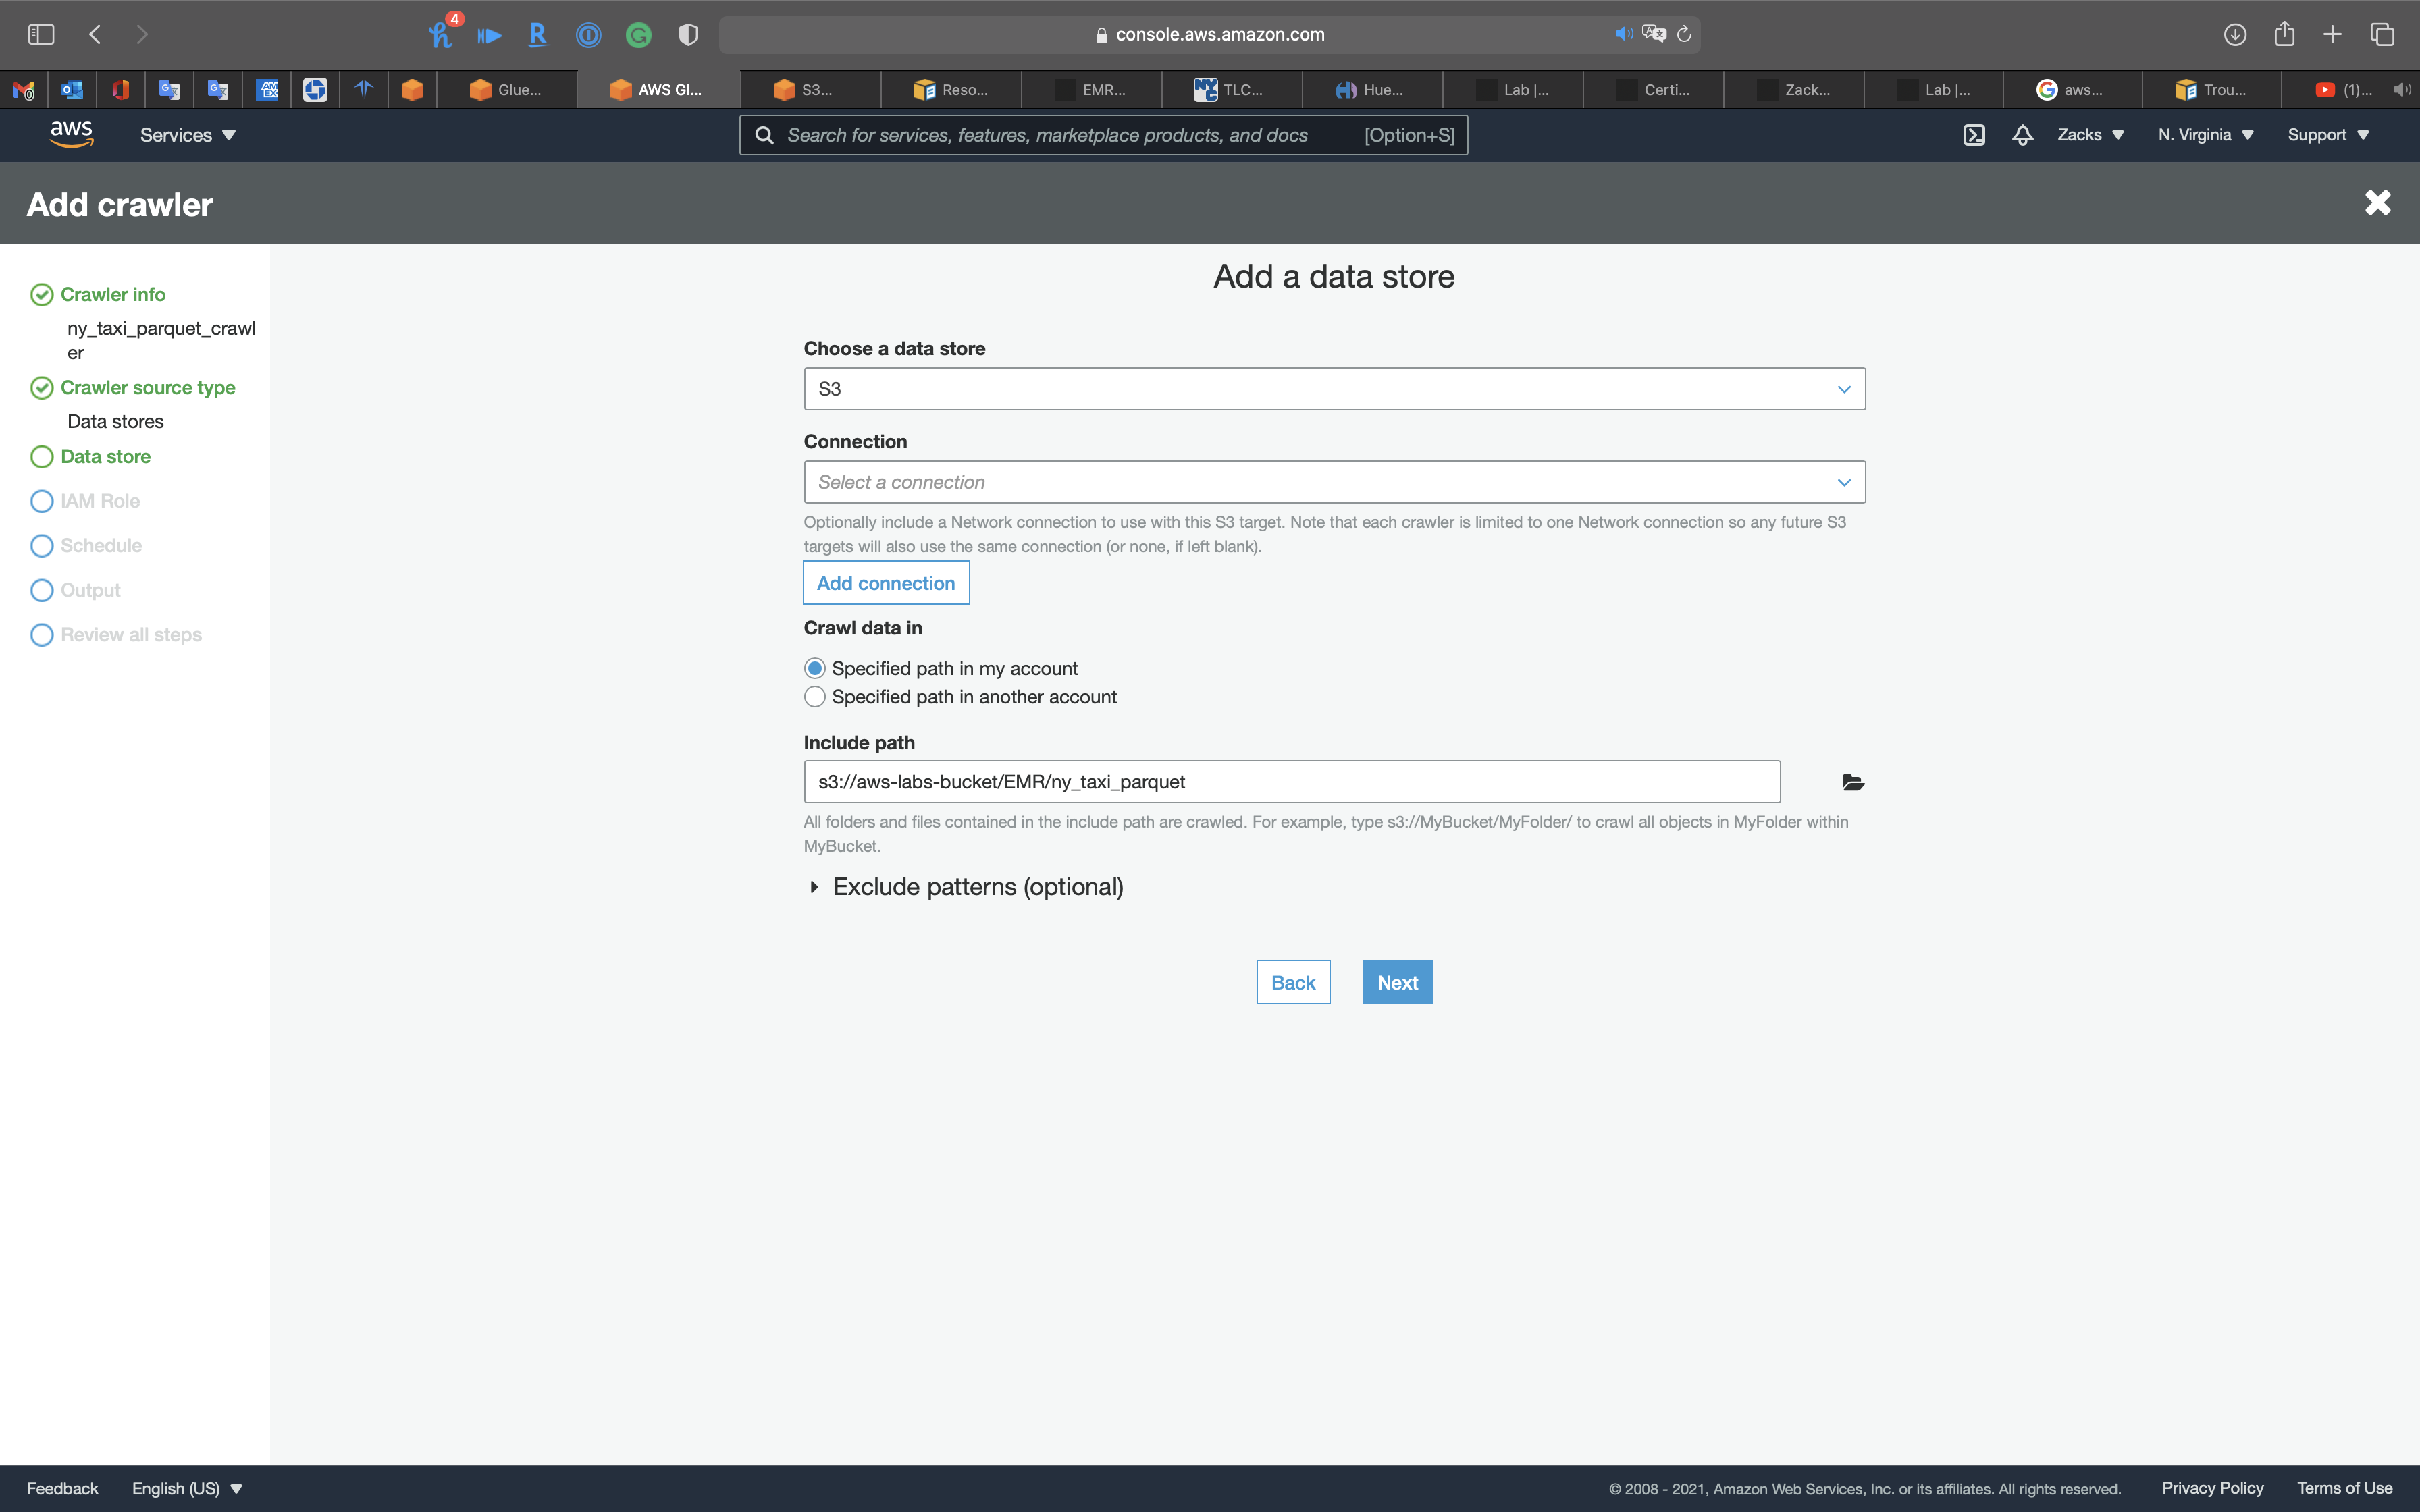
IAM Role
Create a new IAM Role or choose an existing IAM Role if you have.
Policies:
AmazonS3FullAccessAmazonKinesisFullAccessAWSGlueServiceRole
Click on Next
Schedule
- Frequency:
Run on demand
Click on Next
Output
- Database:
ny_taxi_db
Click on Next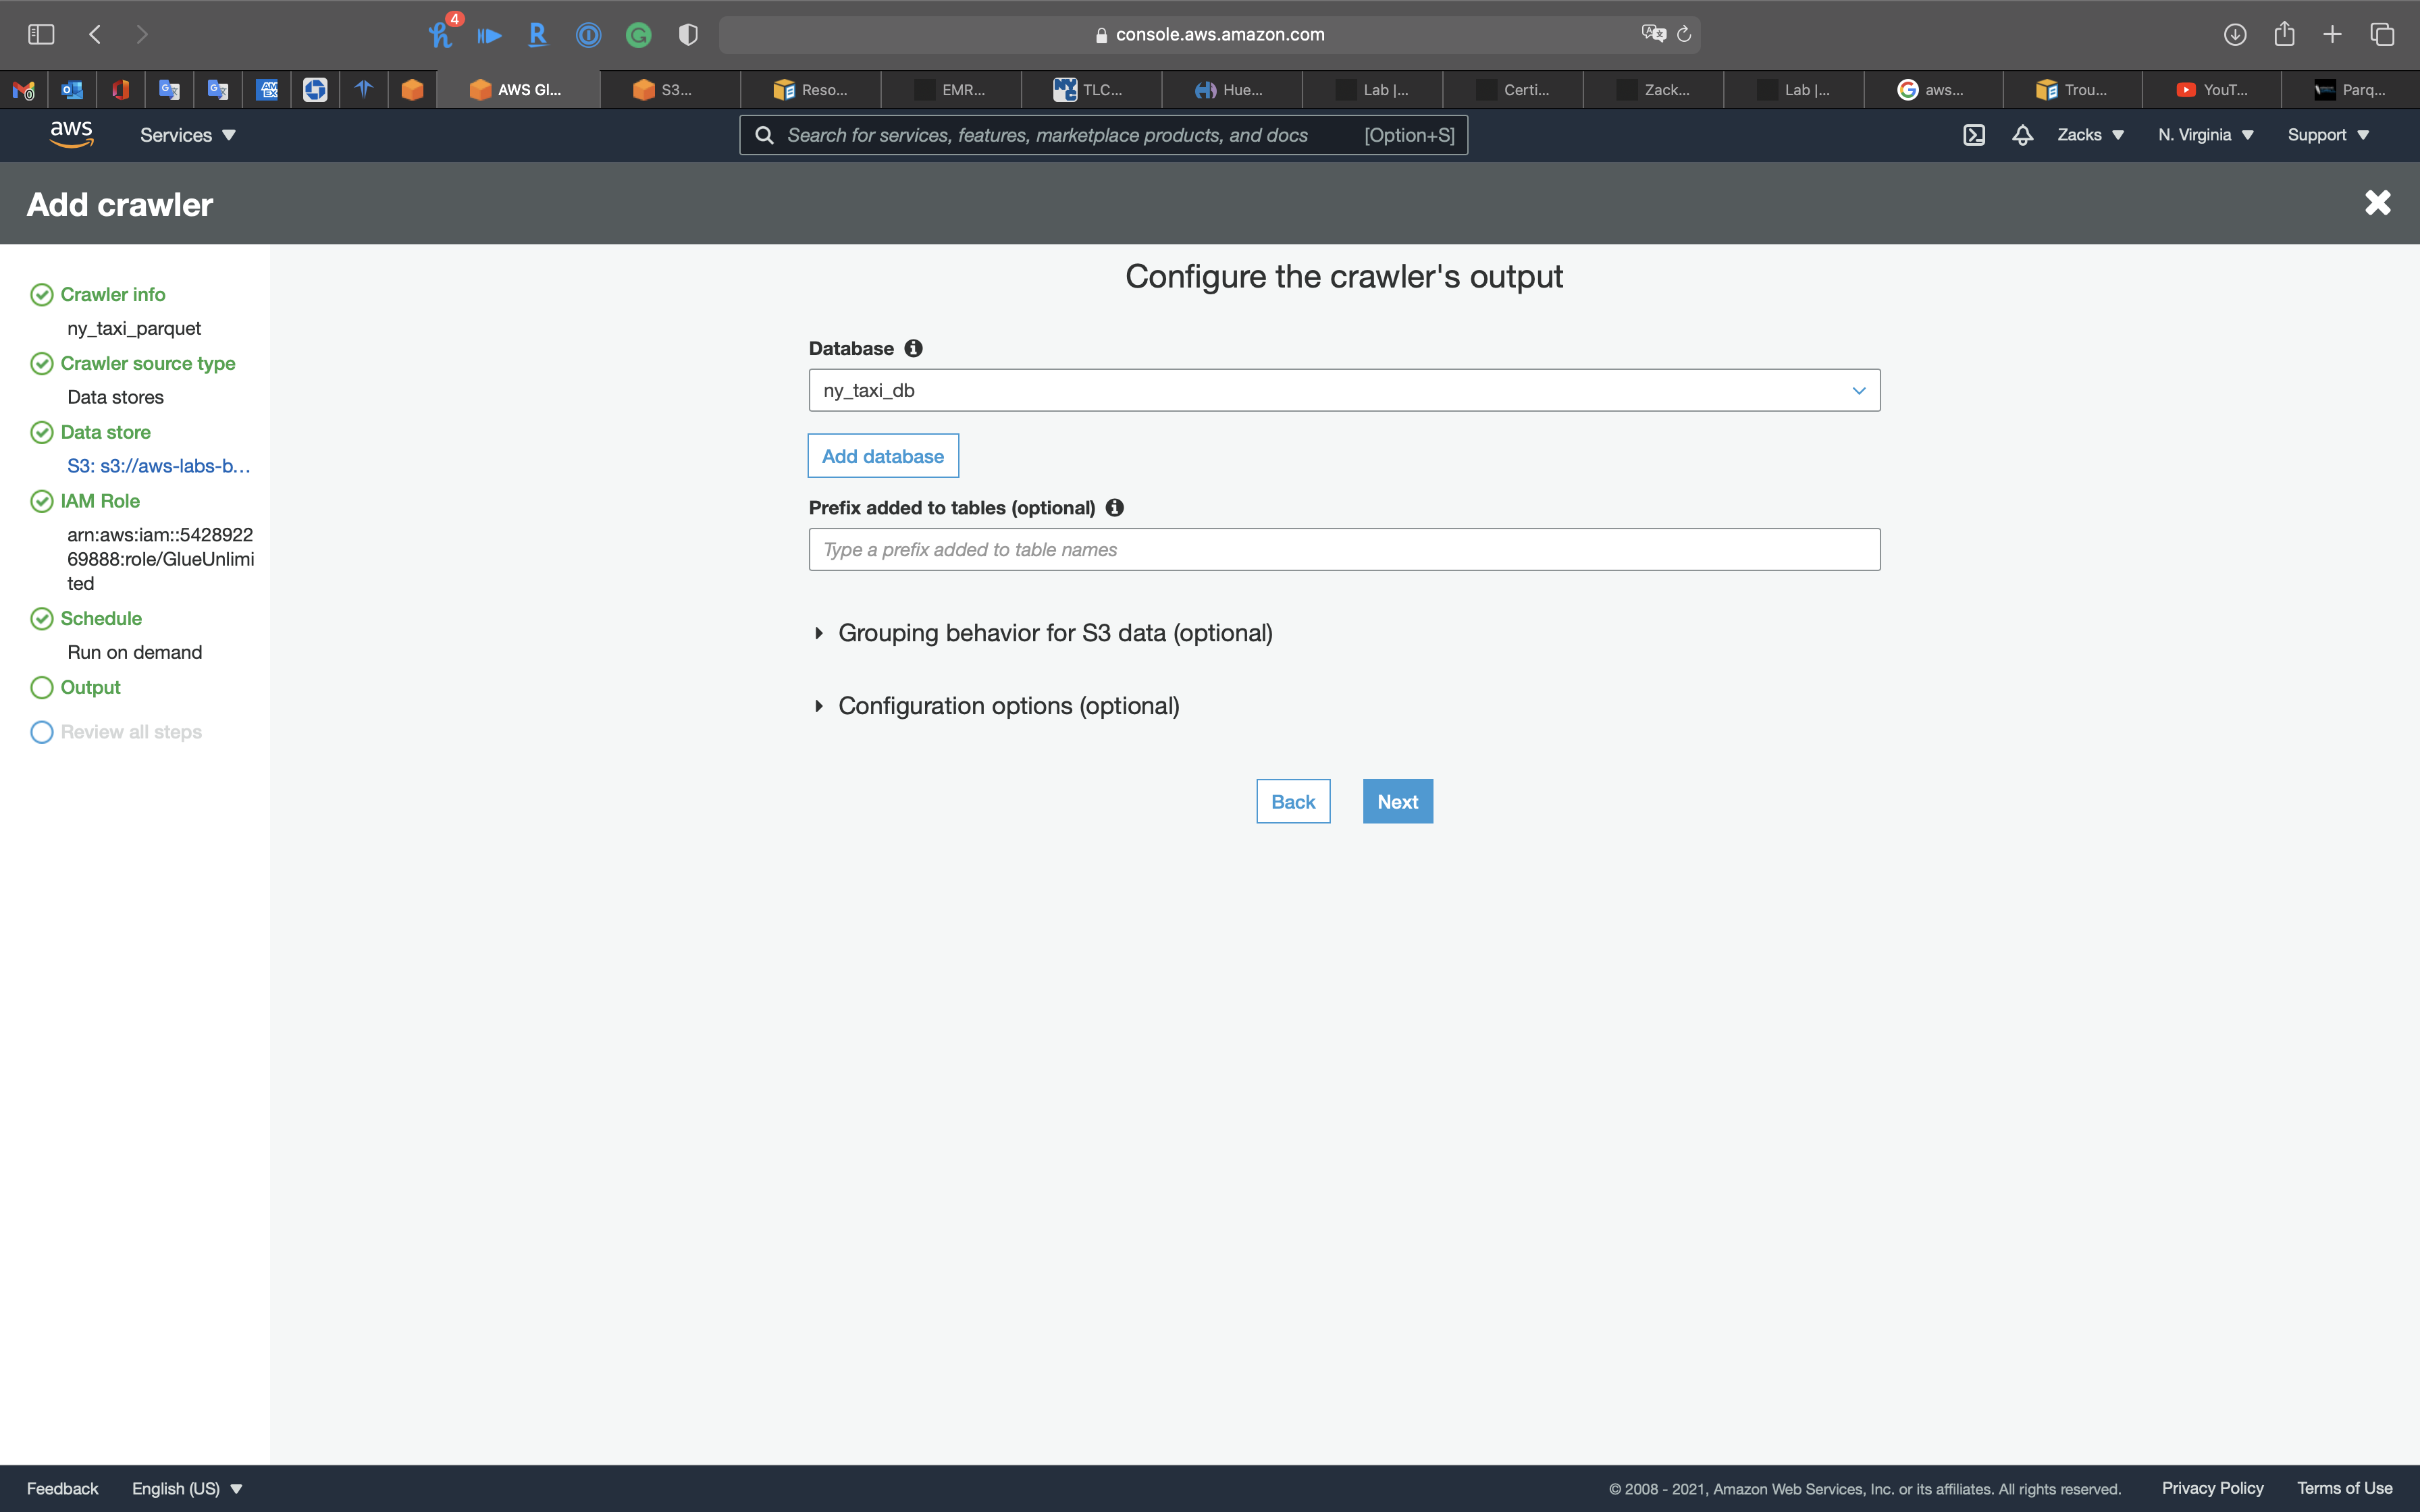
Review all steps
Click on Next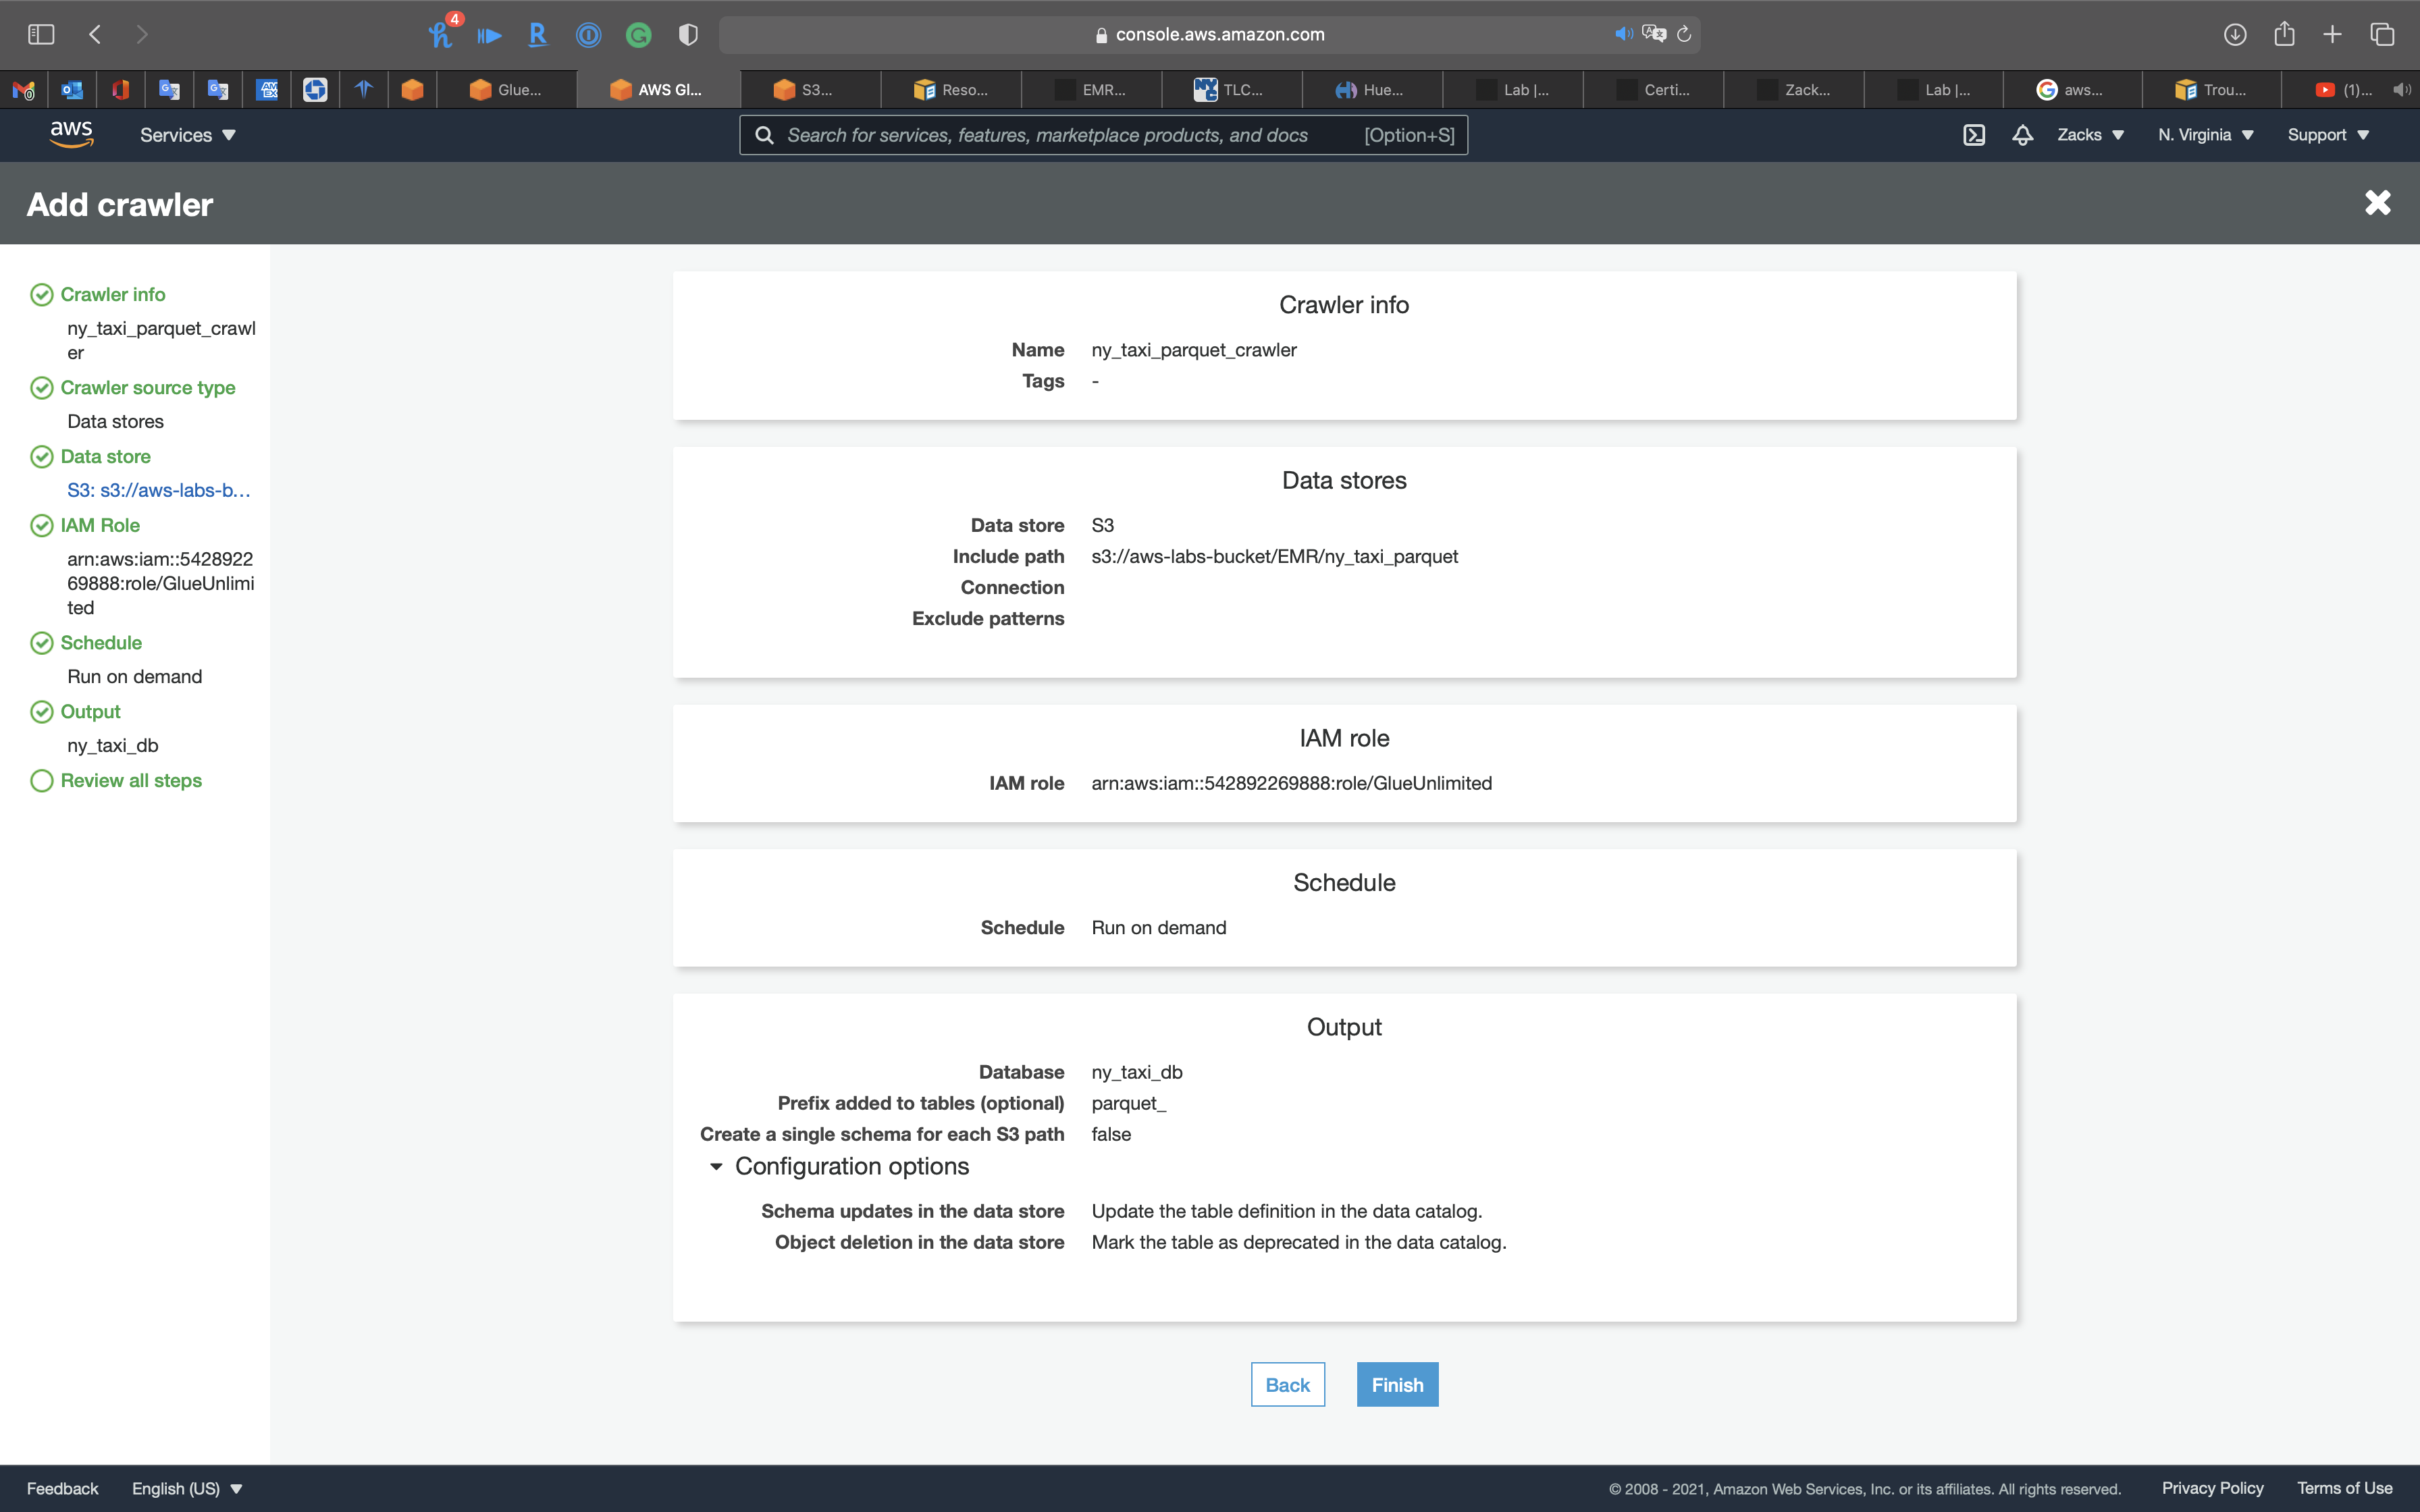
Select the Crawler, and click on Run crawler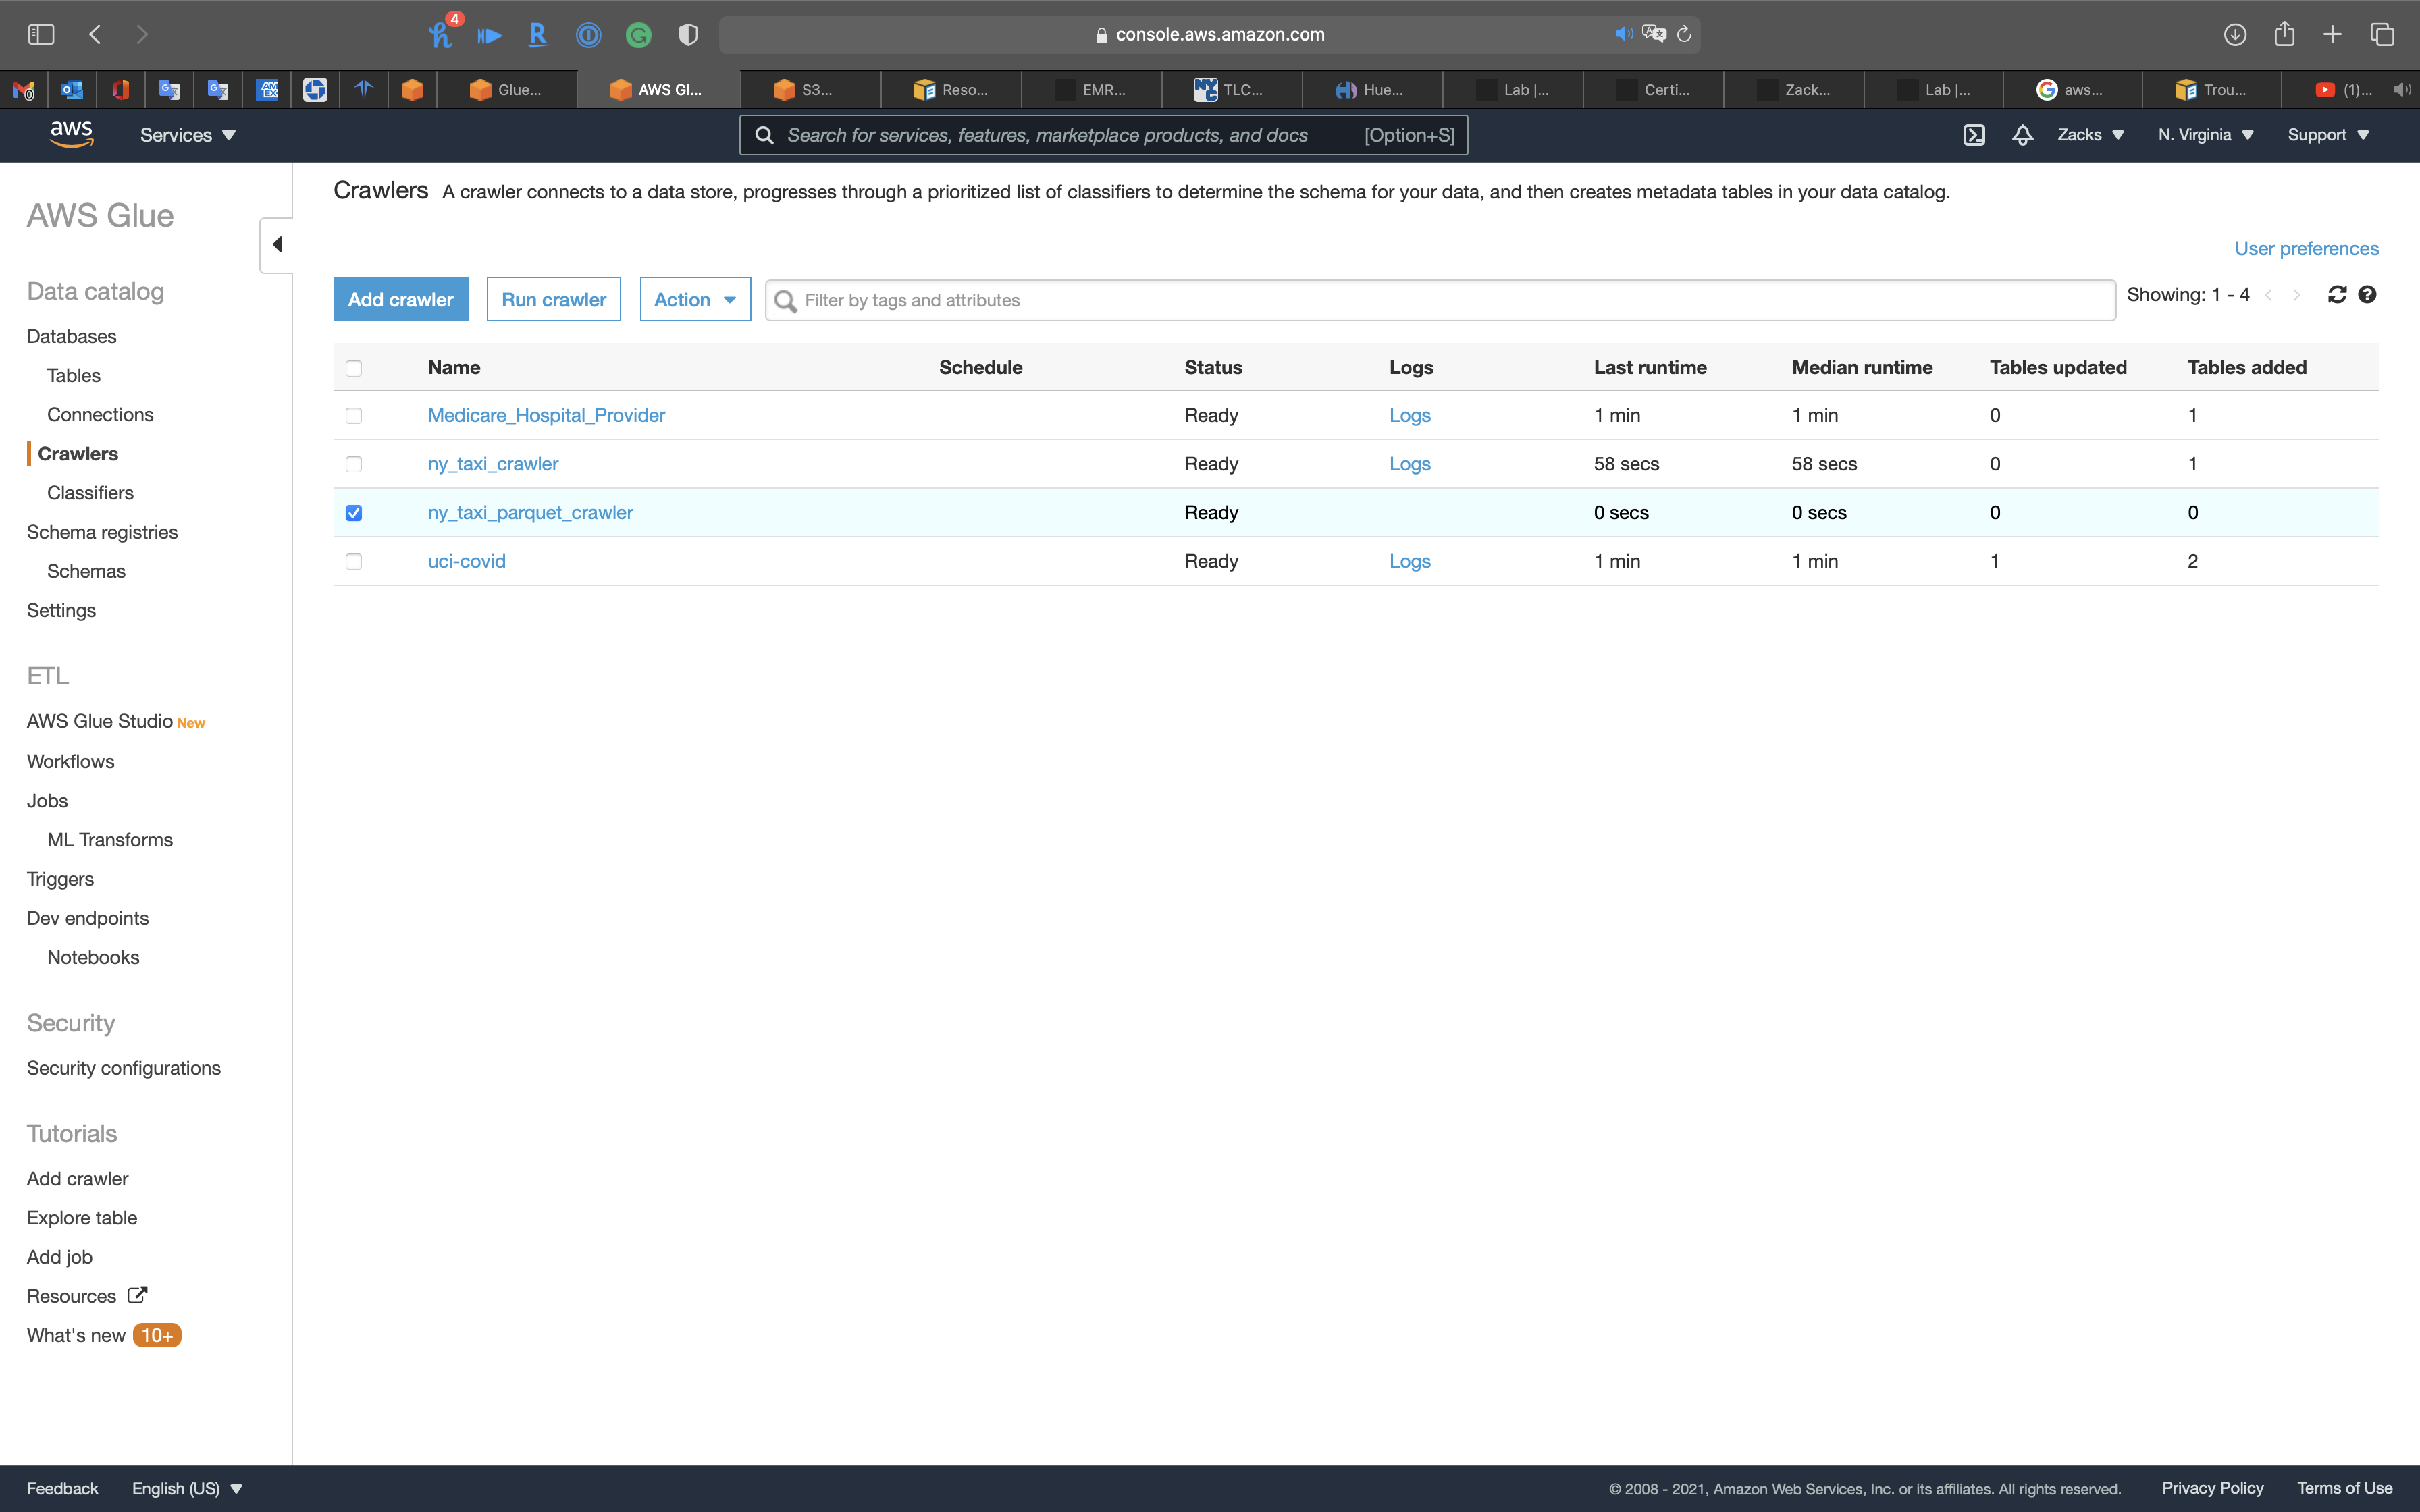
Review the table
Now you can see the table
Click on ny_taxi_parquet table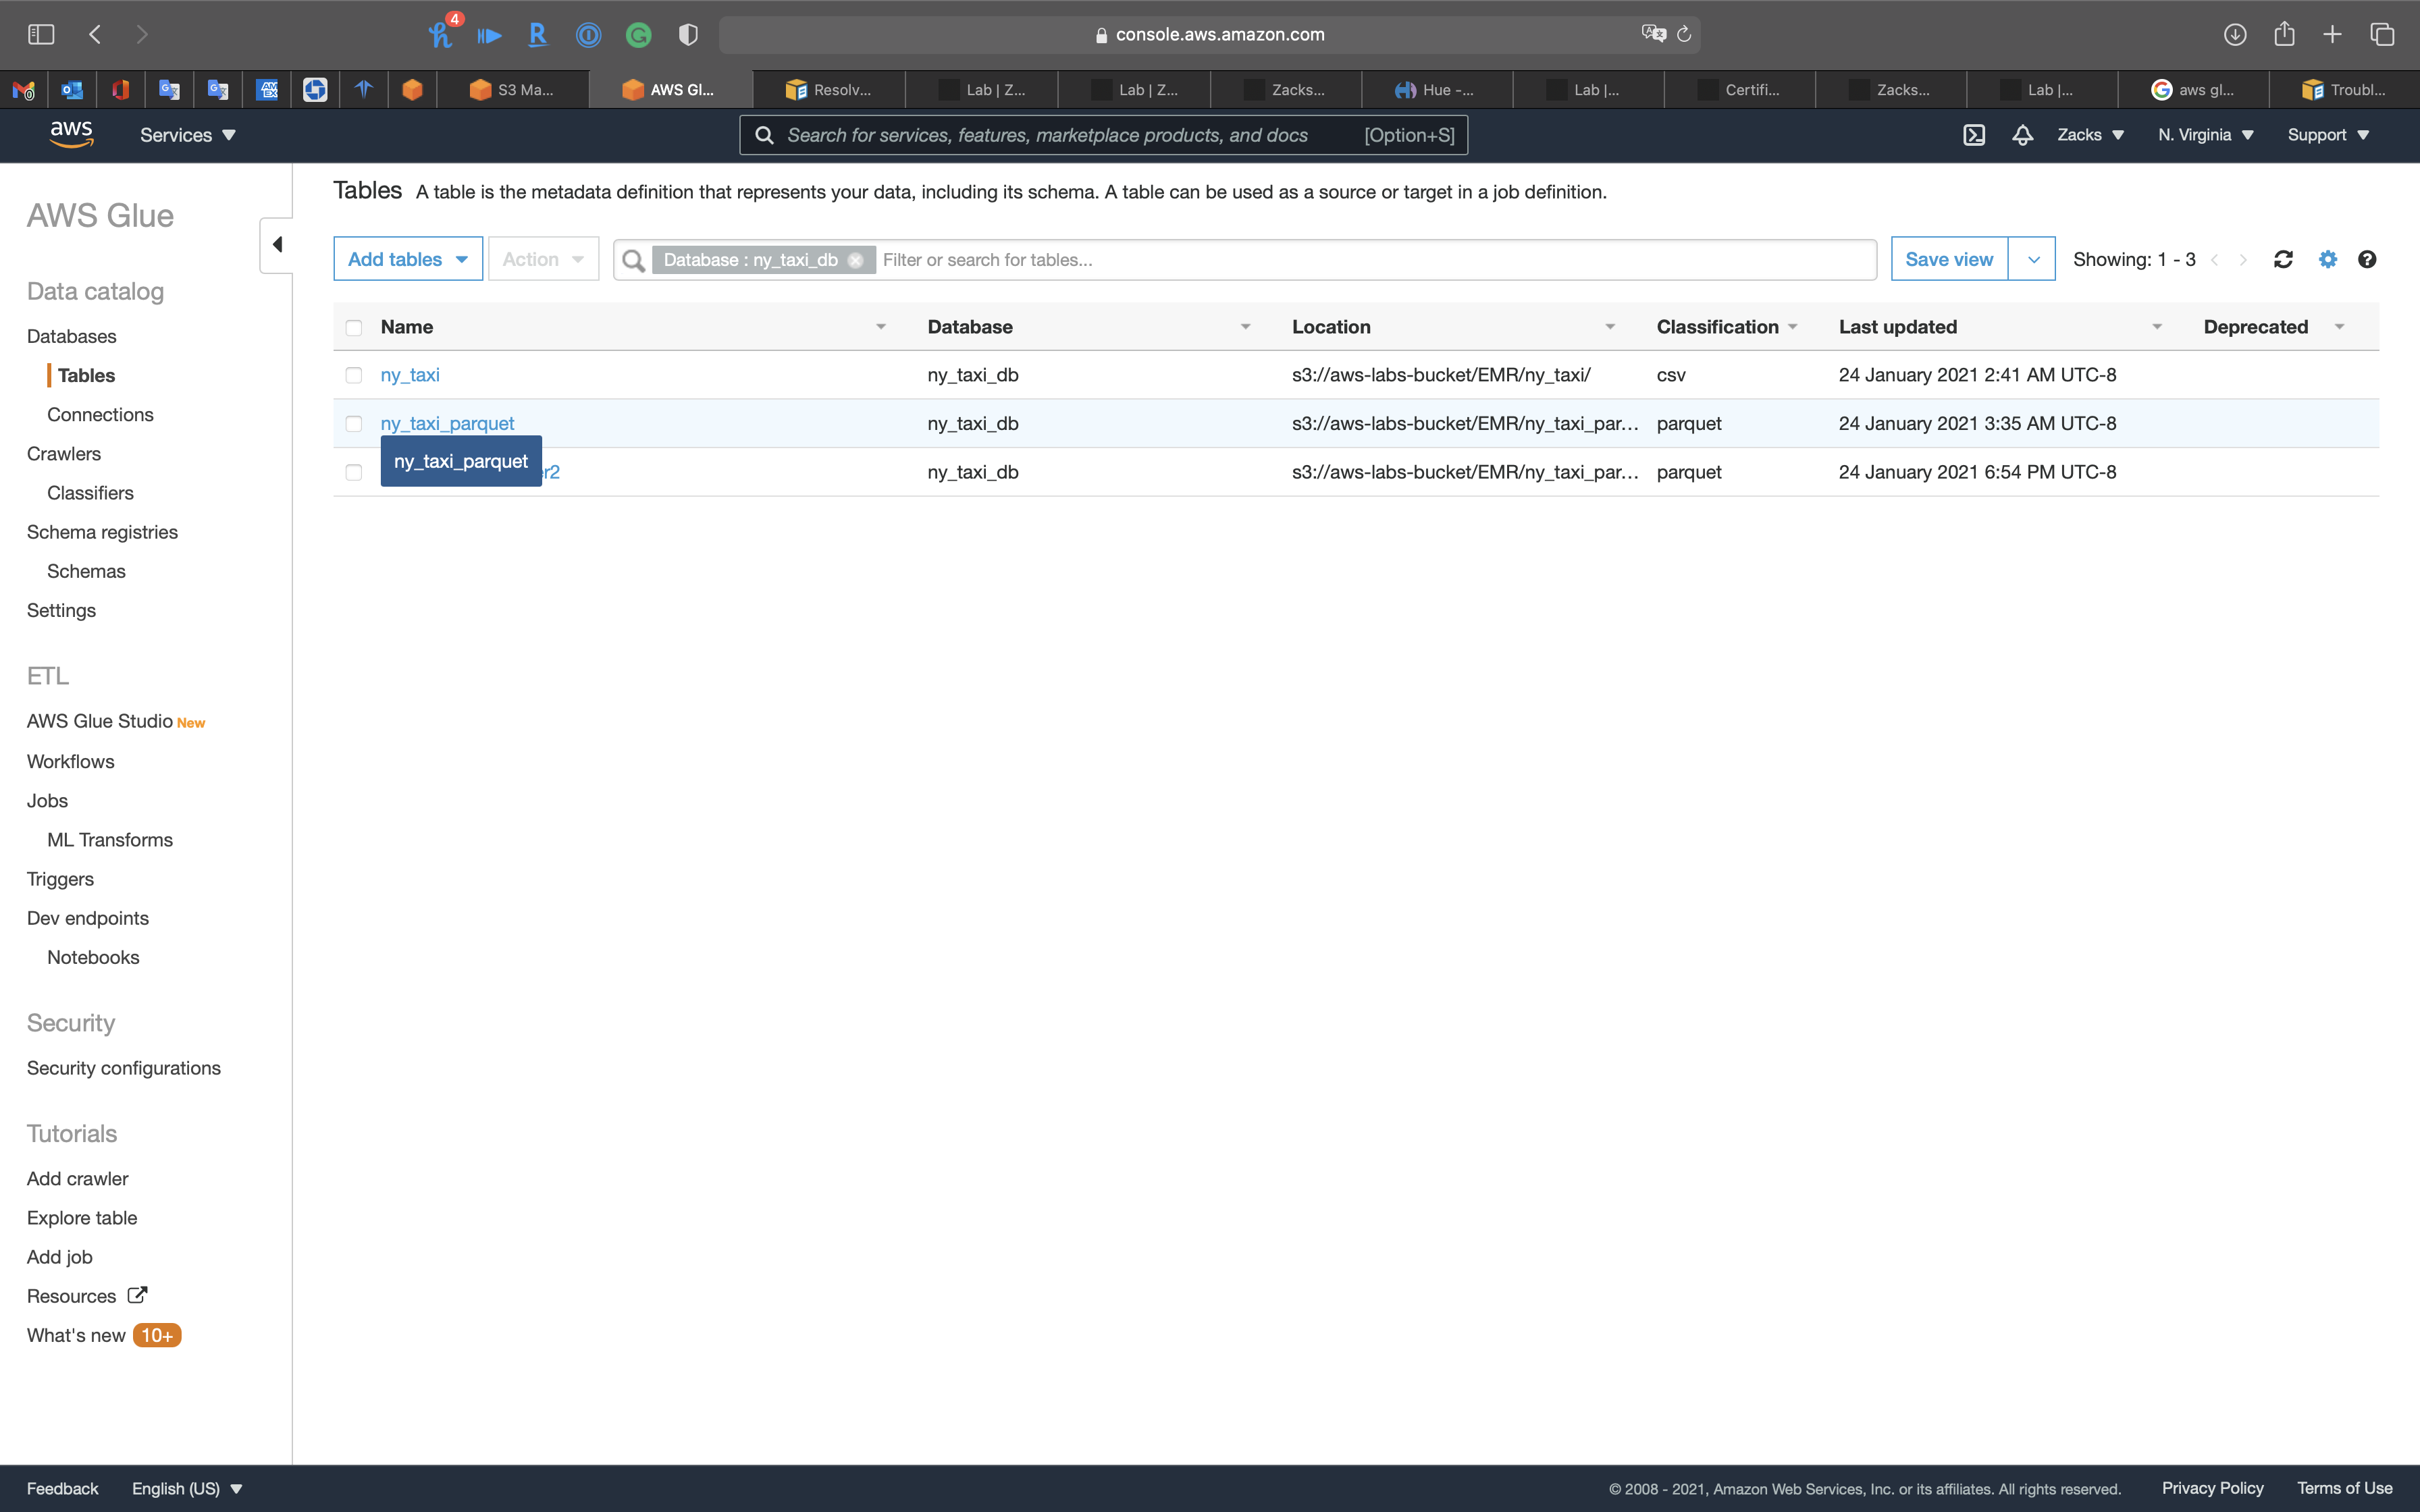
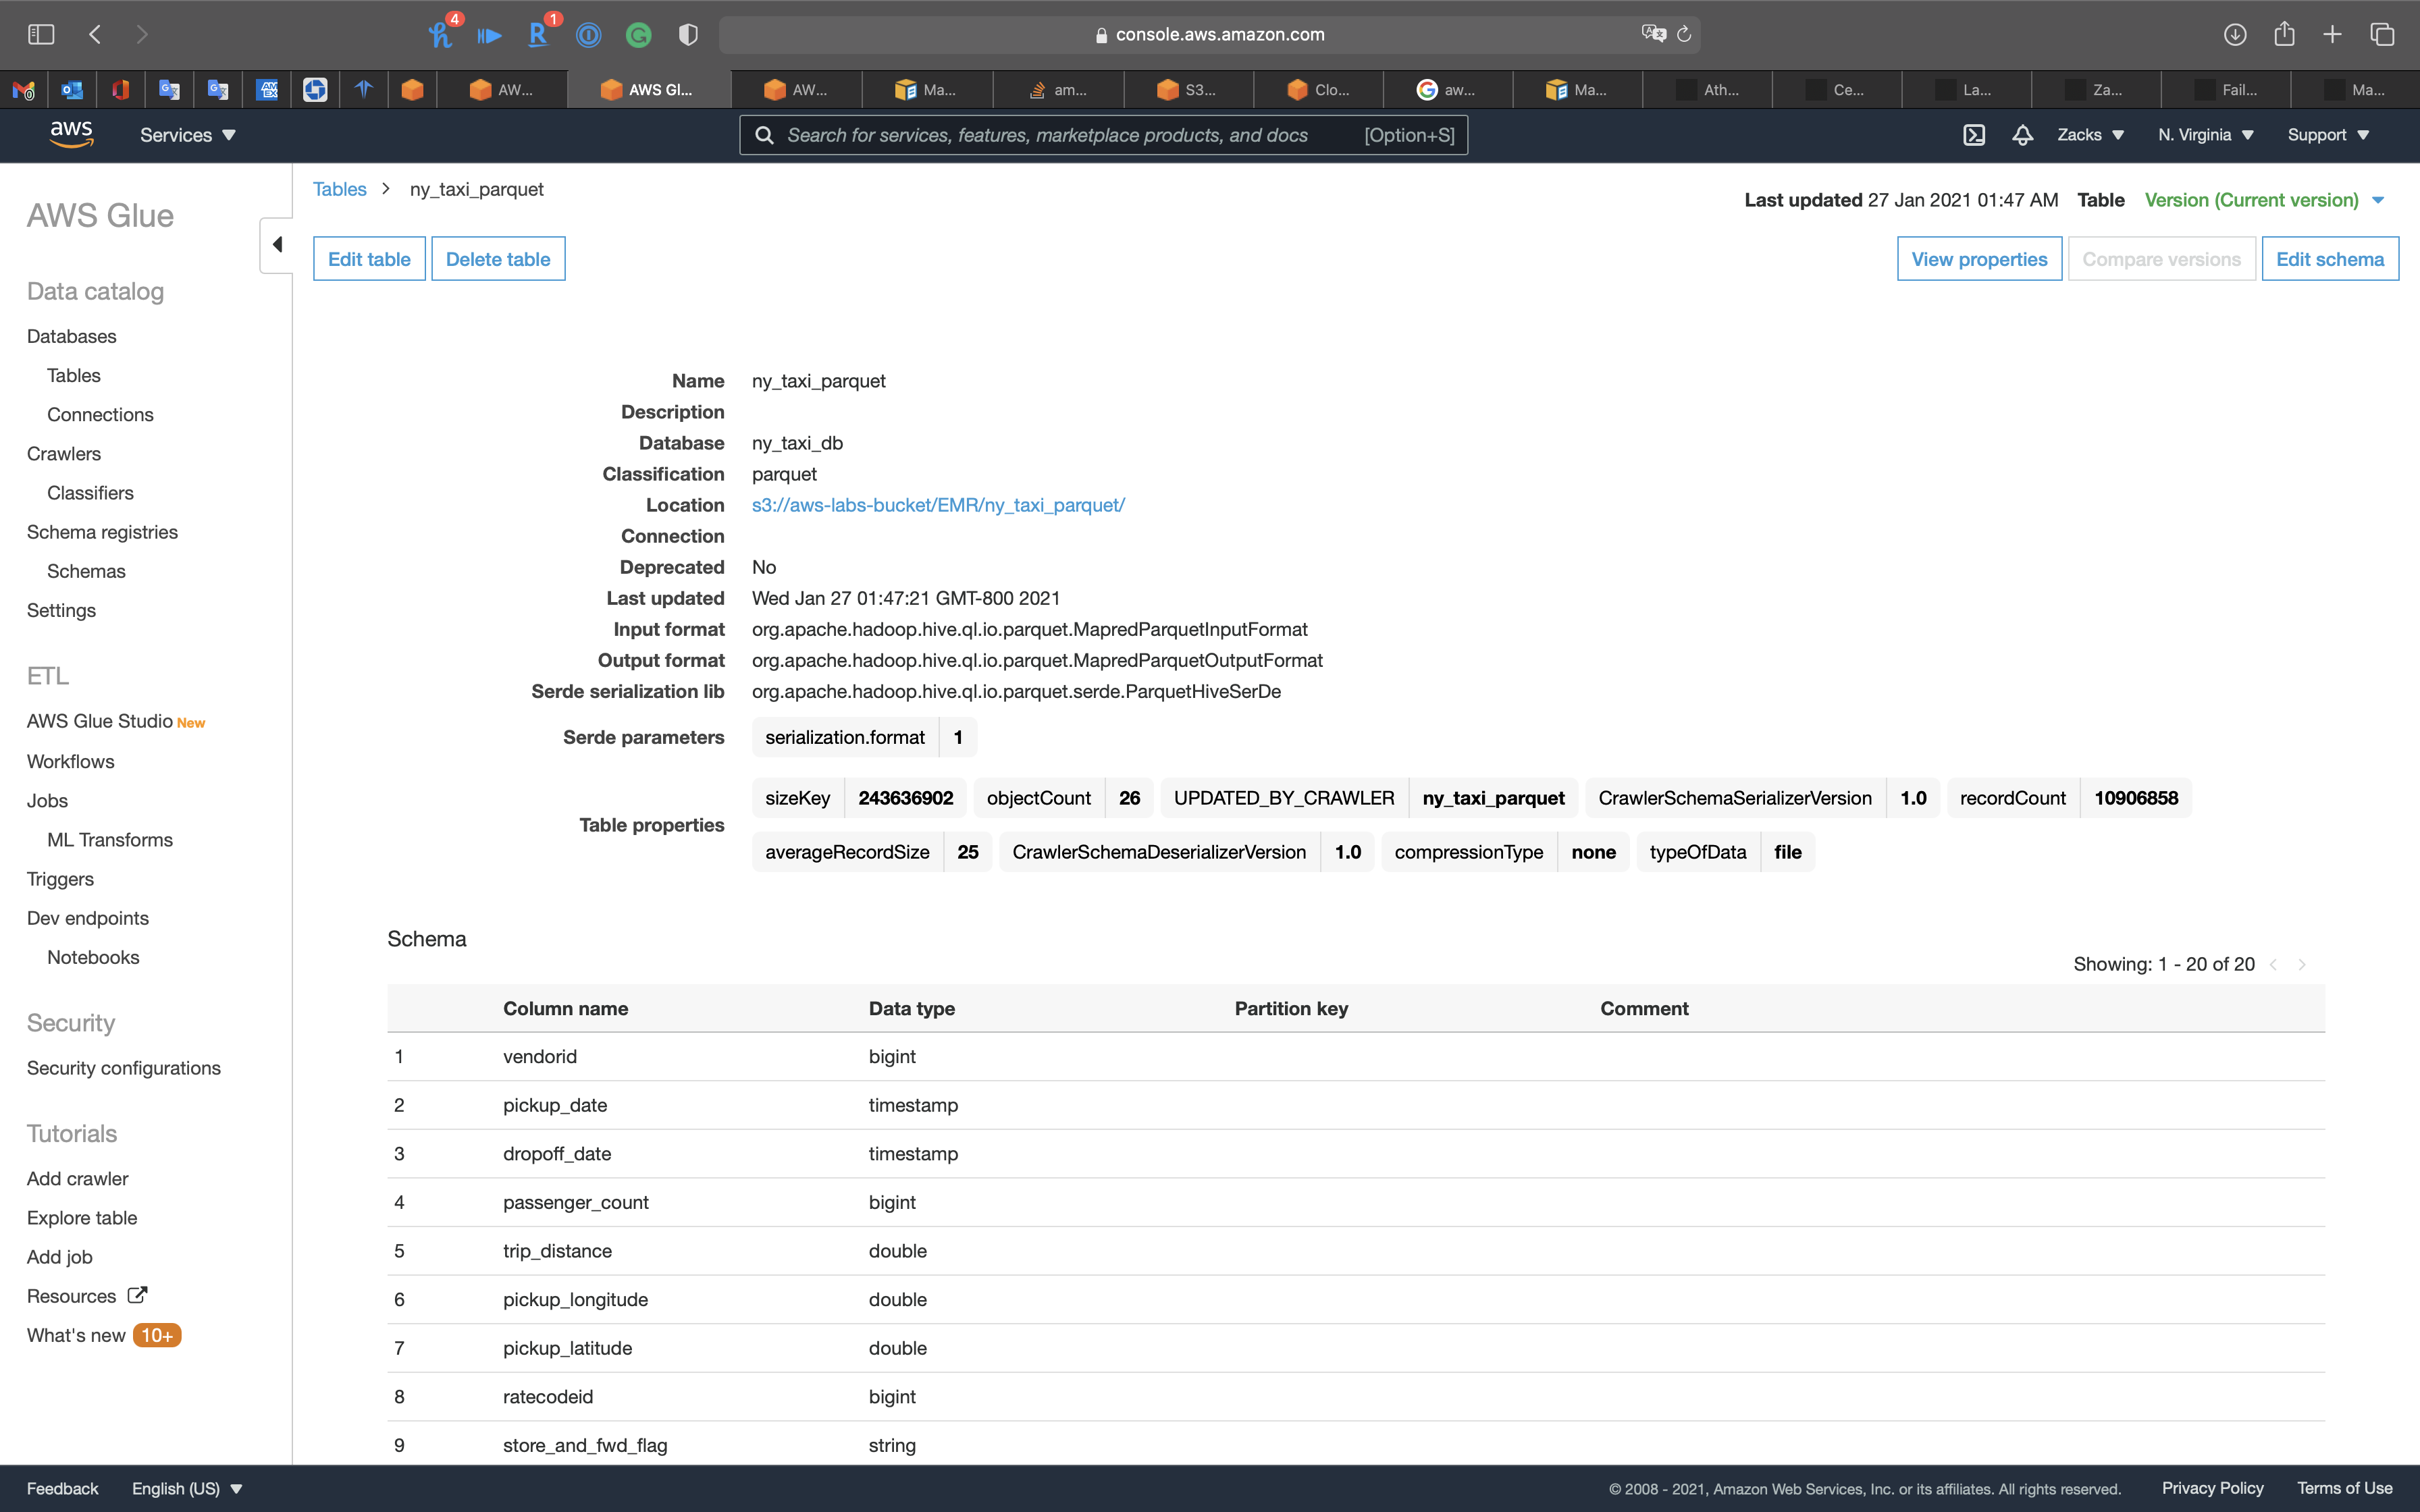
Notice we have the pickup_date and dropoff_date columns, and they are timestamp data type.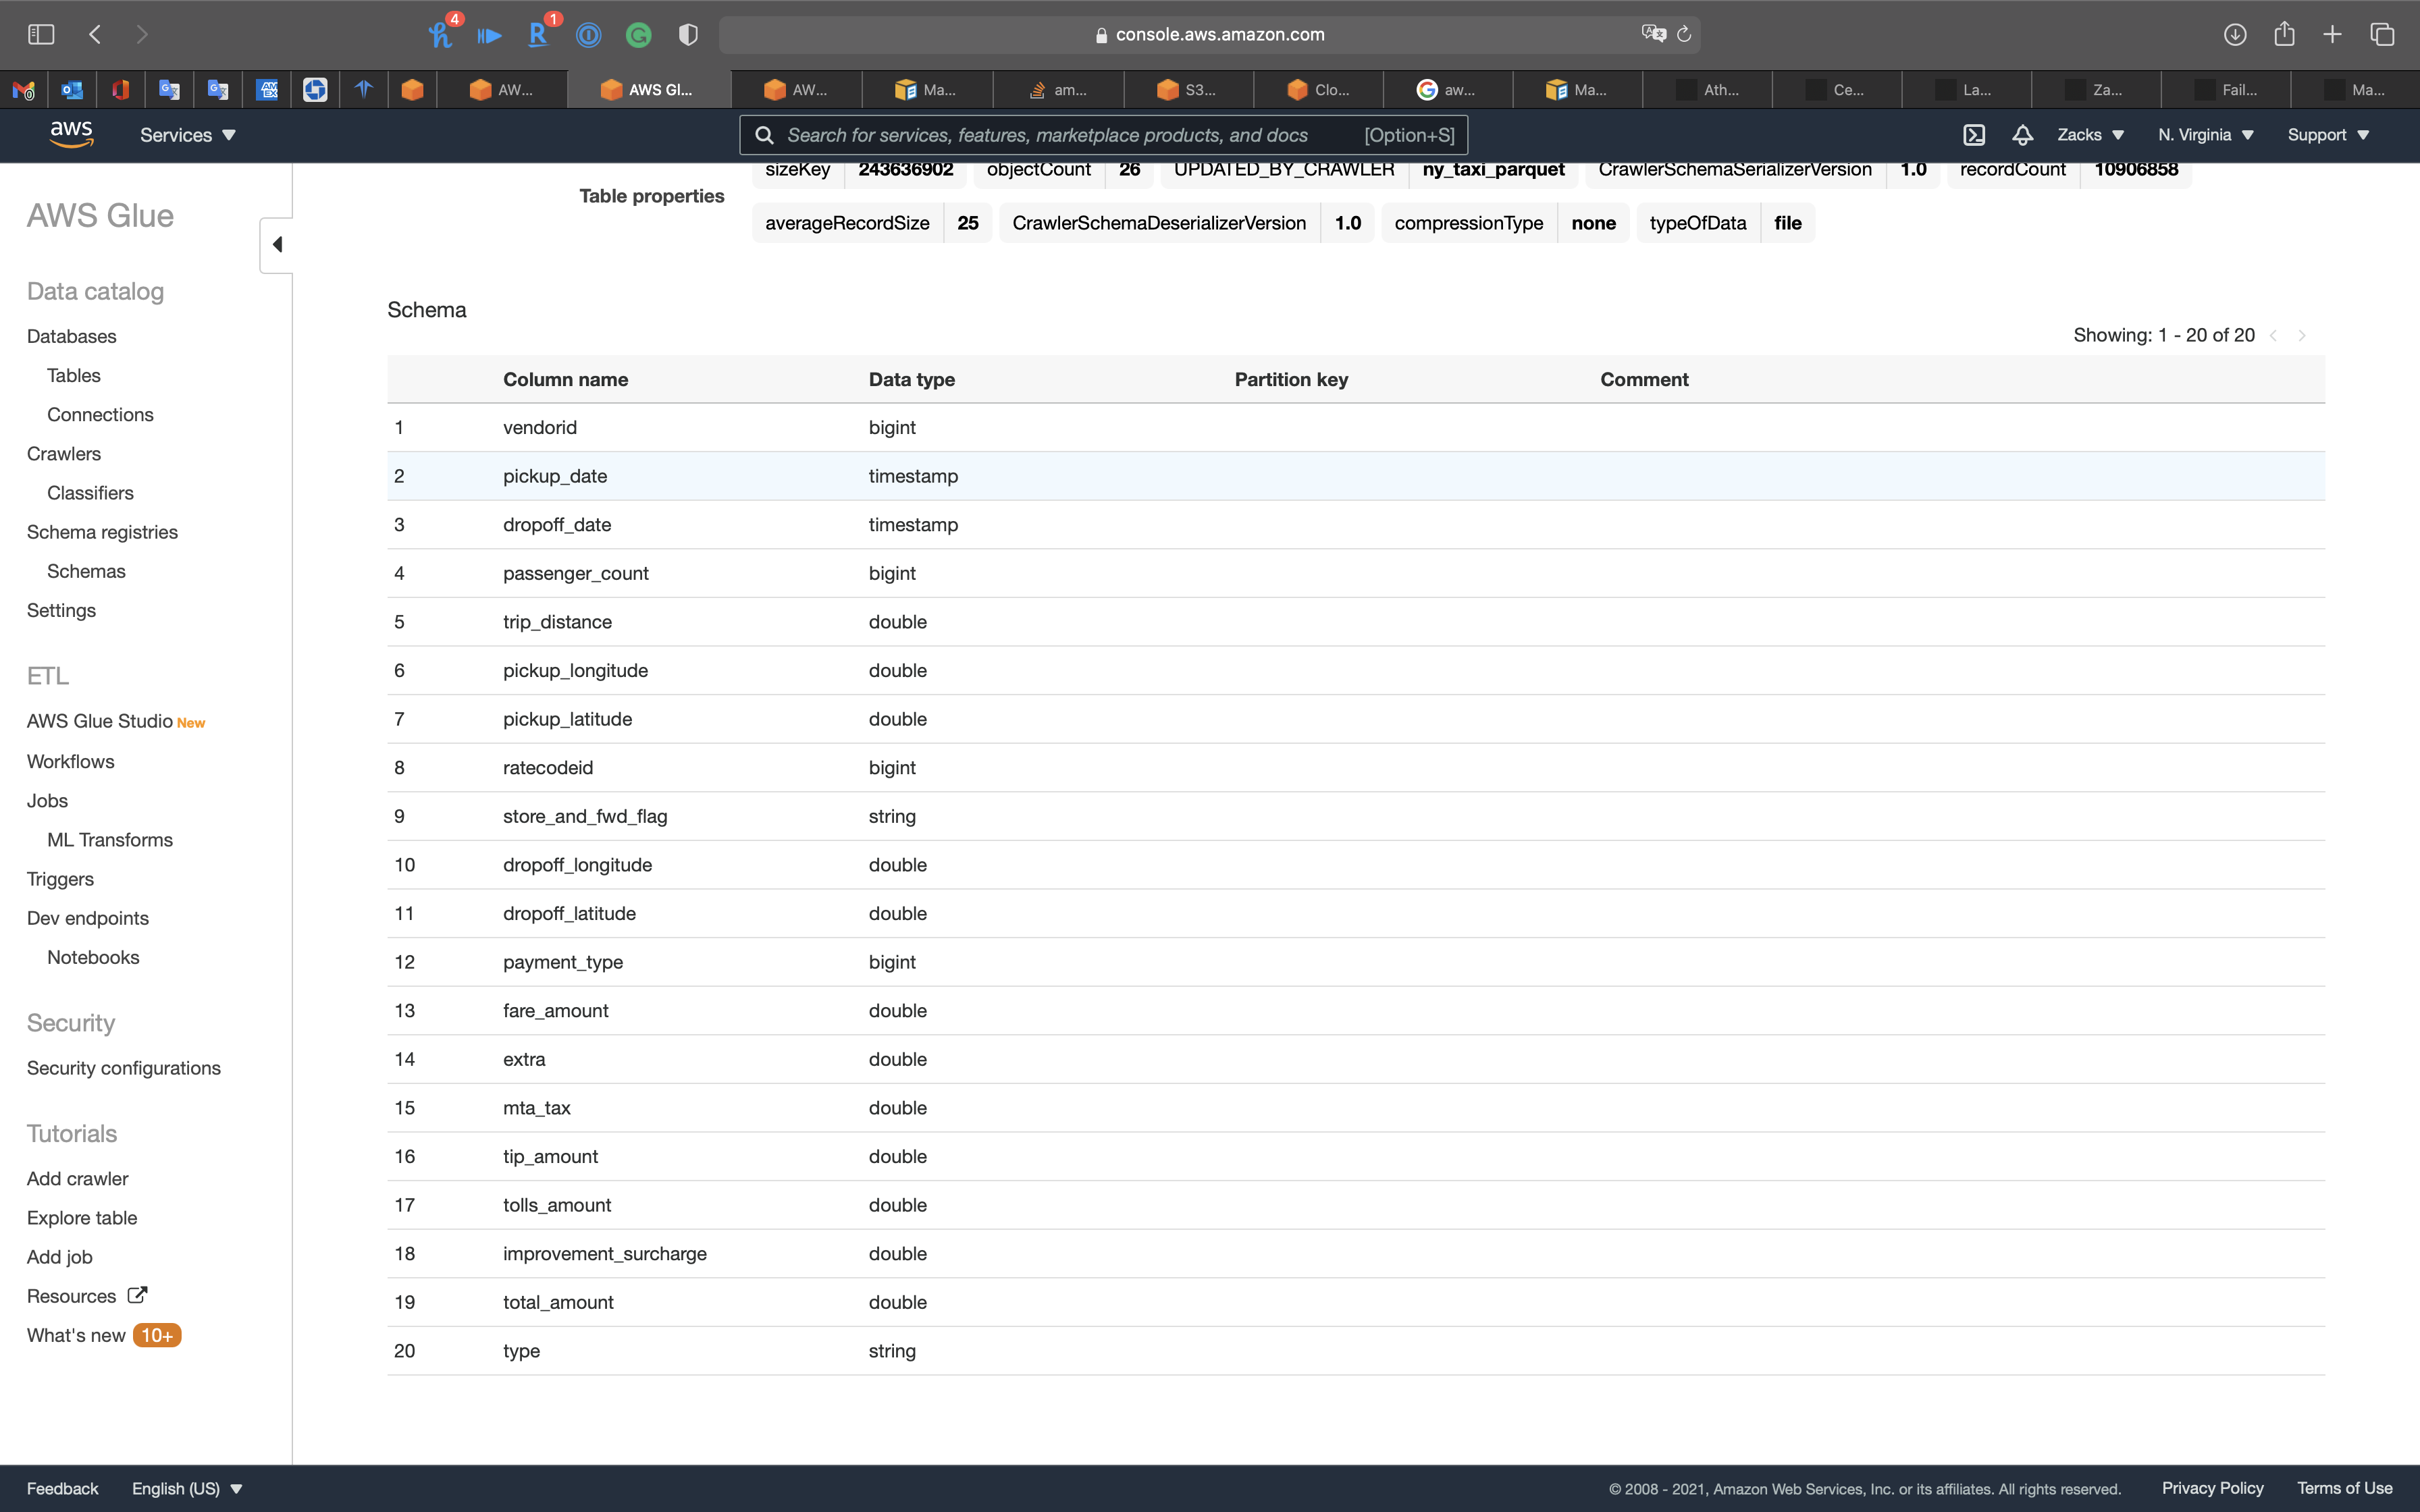
Notice we have the new column type.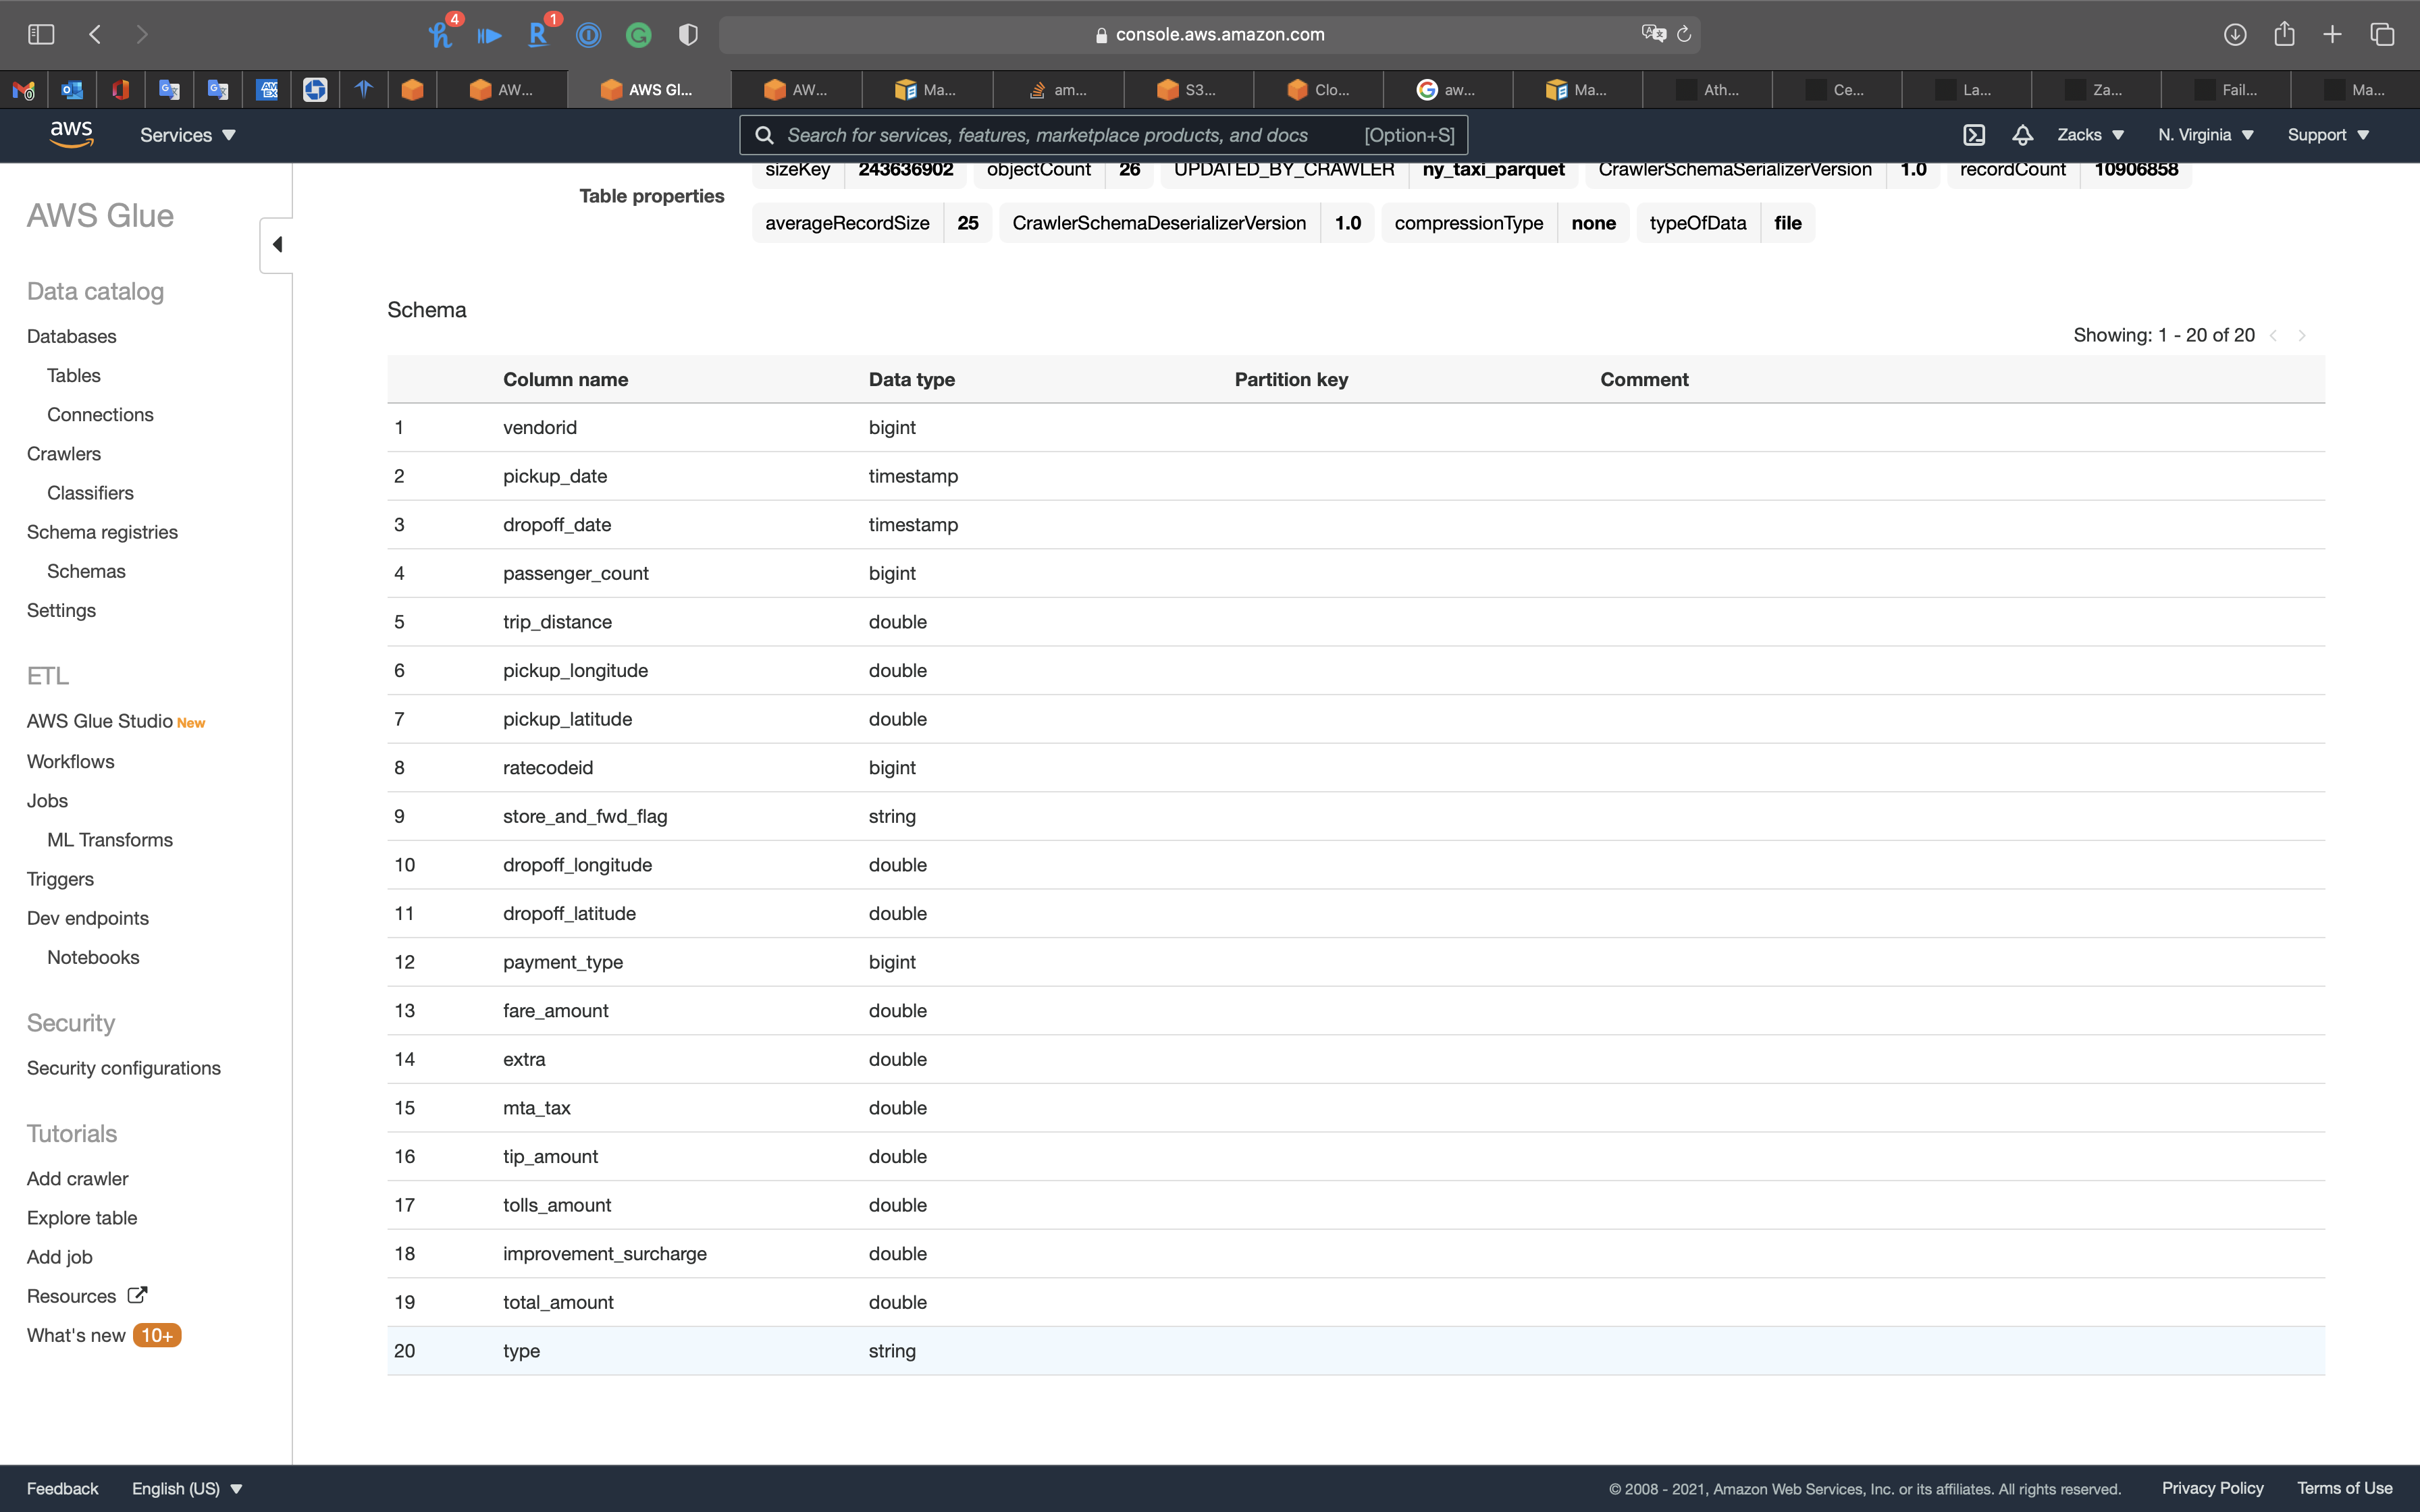
Athena Configuration
Services -> Athena
Click on Get Started
Athena User Interface
Data source
See our Data source is AwsDataCatalog that connect to AWS Glue.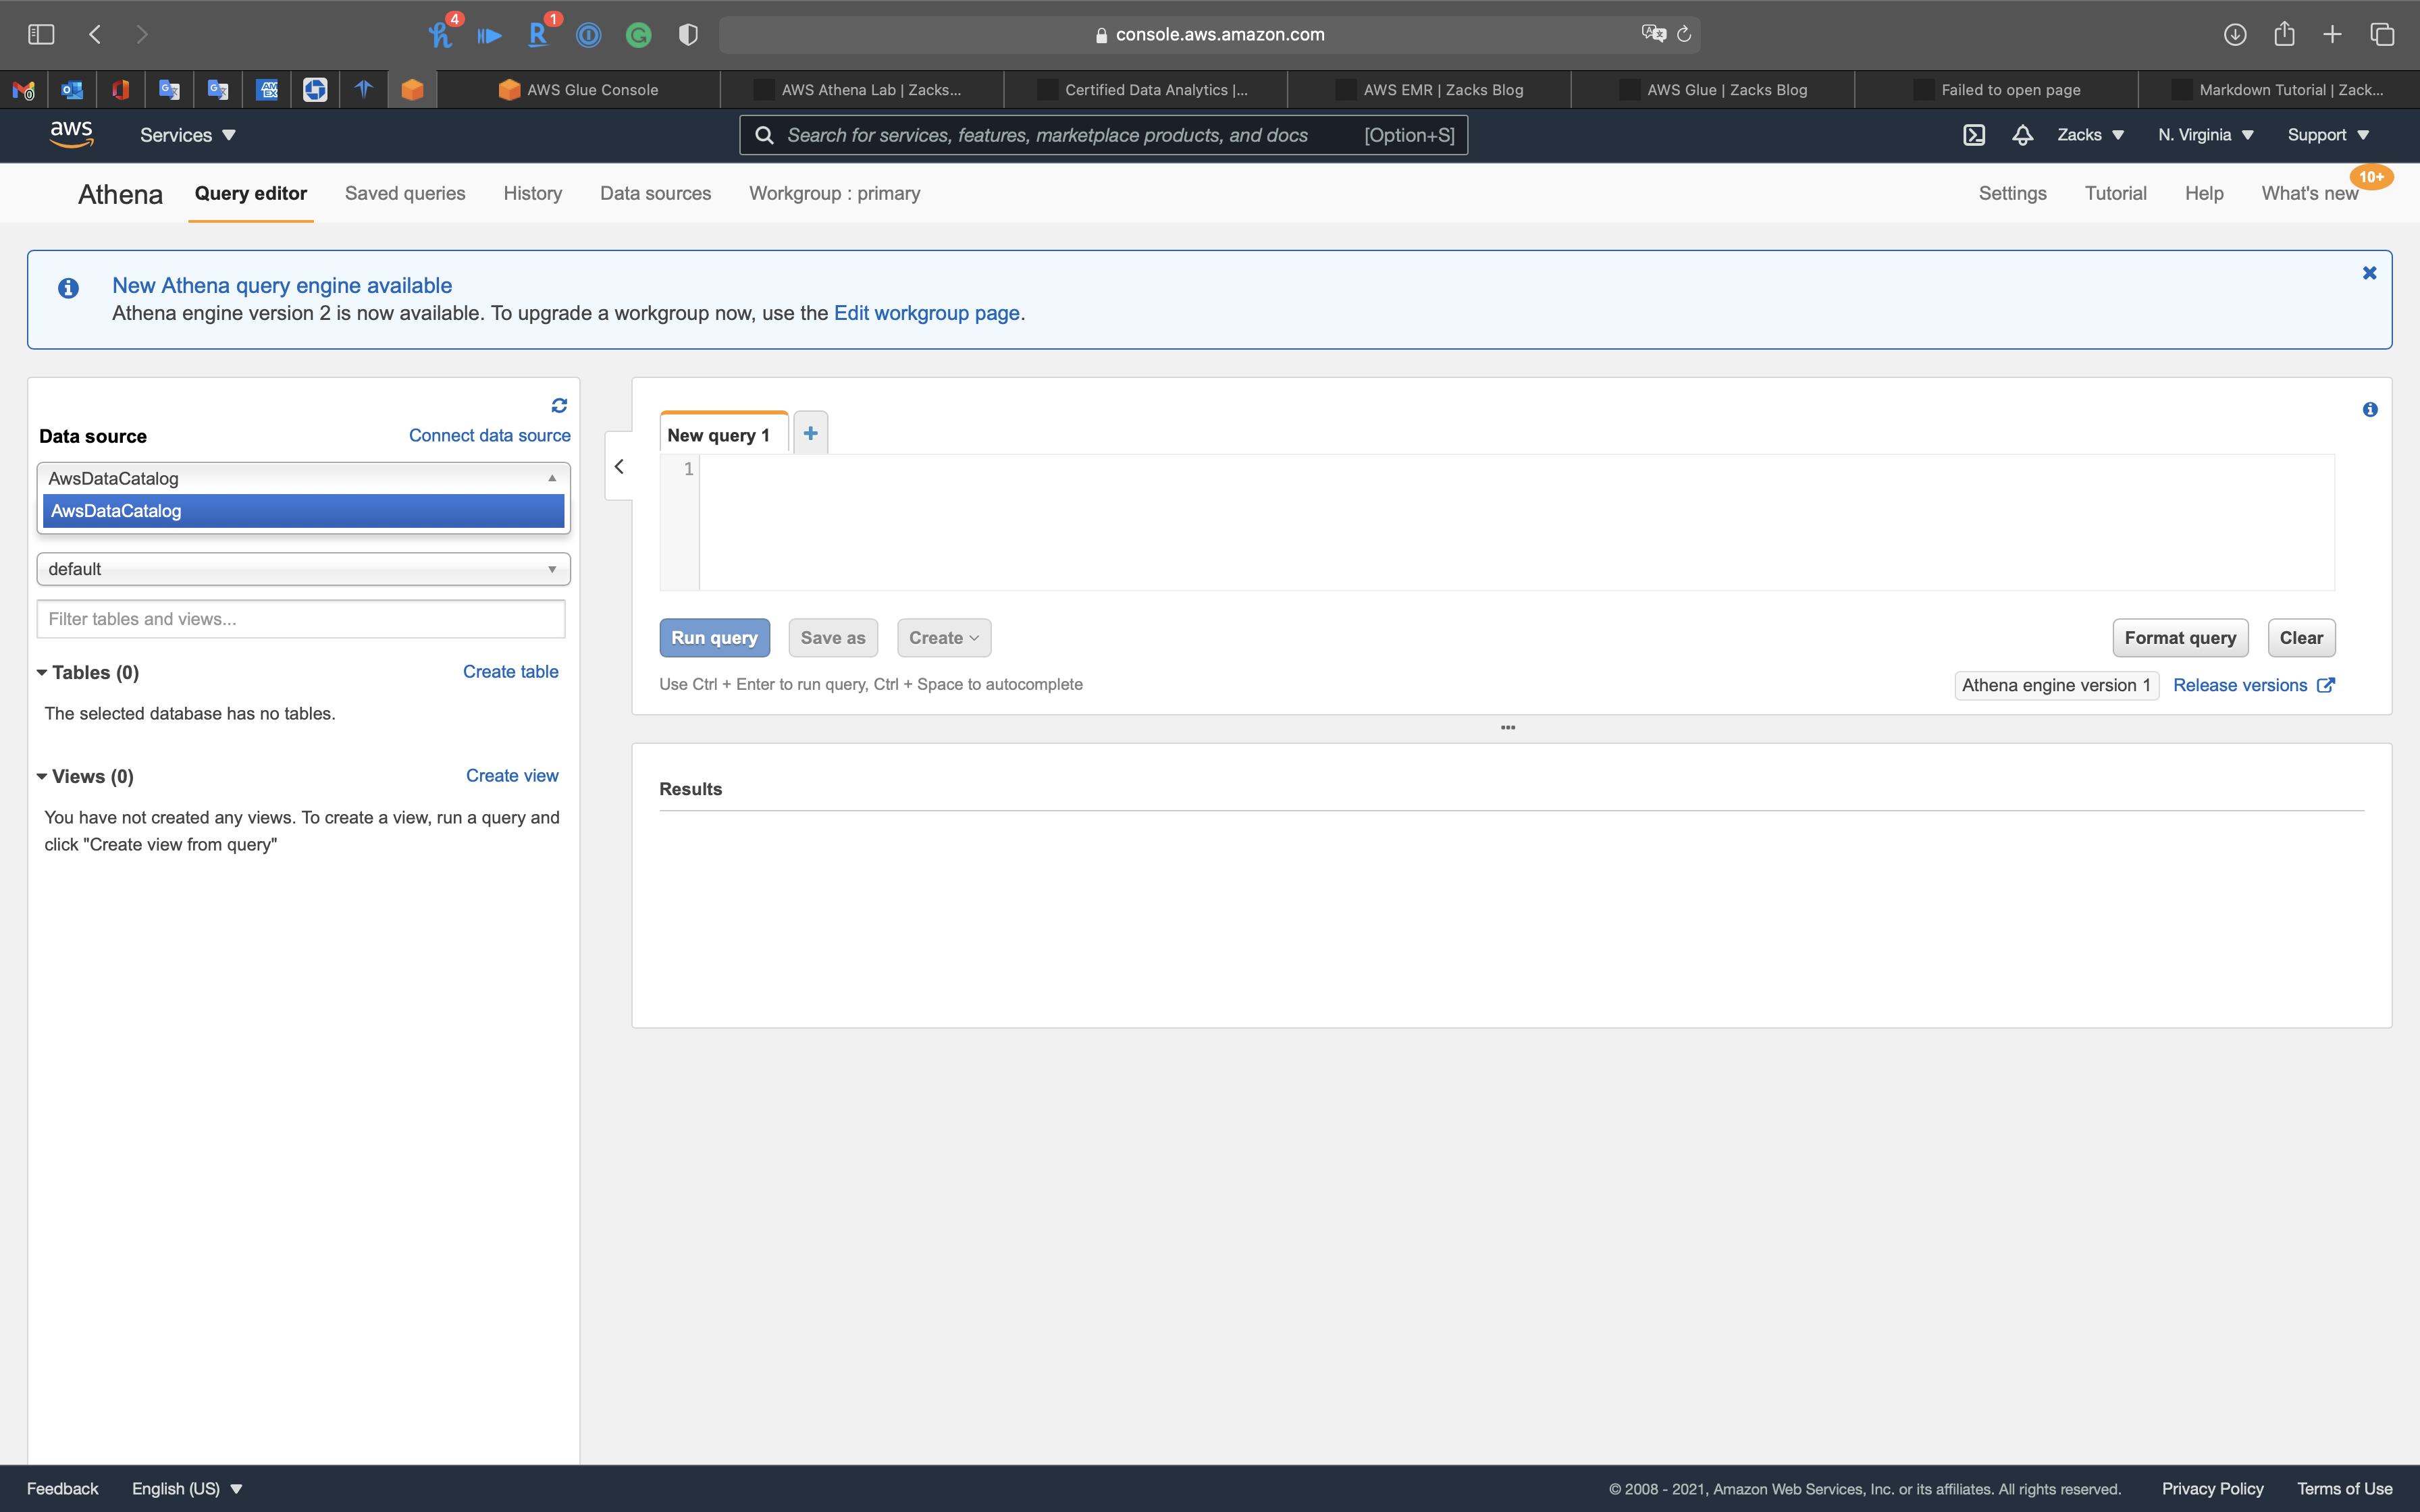
Athena is out-of-the-box integrated with AWS Glue Data Catalog, allowing you to create a unified metadata repository across various services, crawl data sources to discover schemas and populate your Catalog with new and modified table and partition definitions, and maintain schema versioning. See Amazon Athena.
Database
Under Database, collapse default to choose a database.
You can see ny_taxi_db, which is the database we created at the previous steps.
Select ny_taxi_db.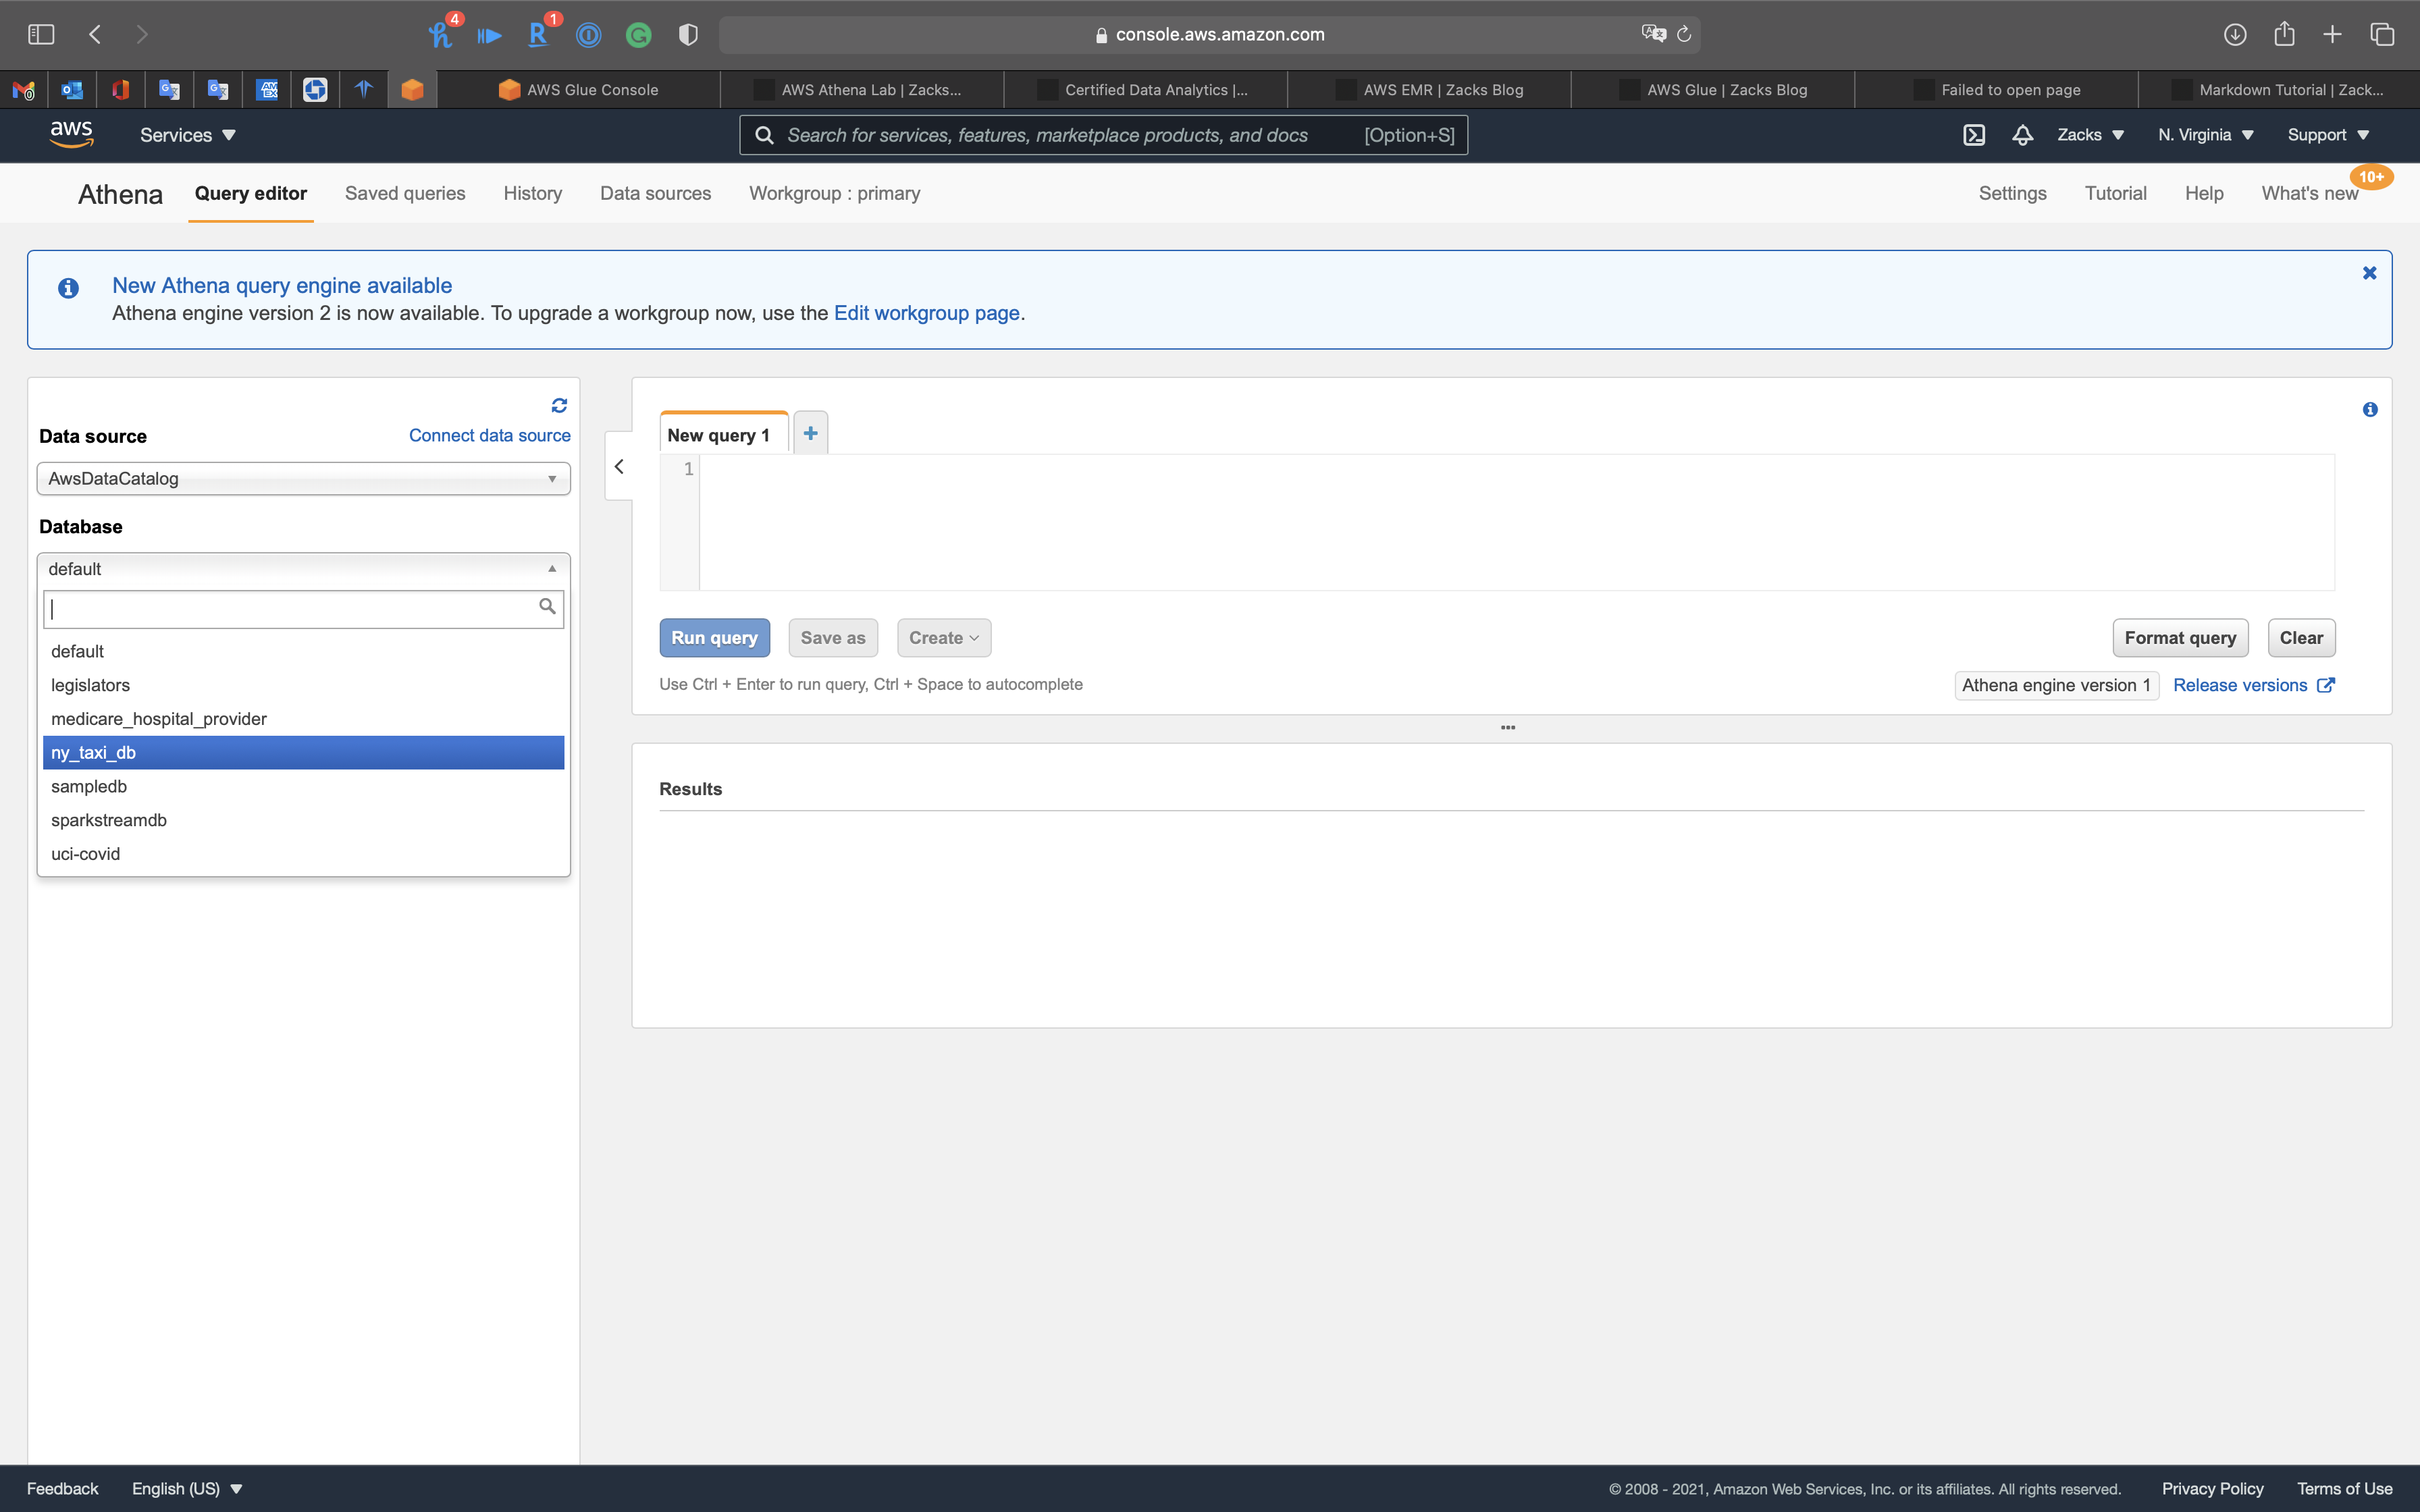
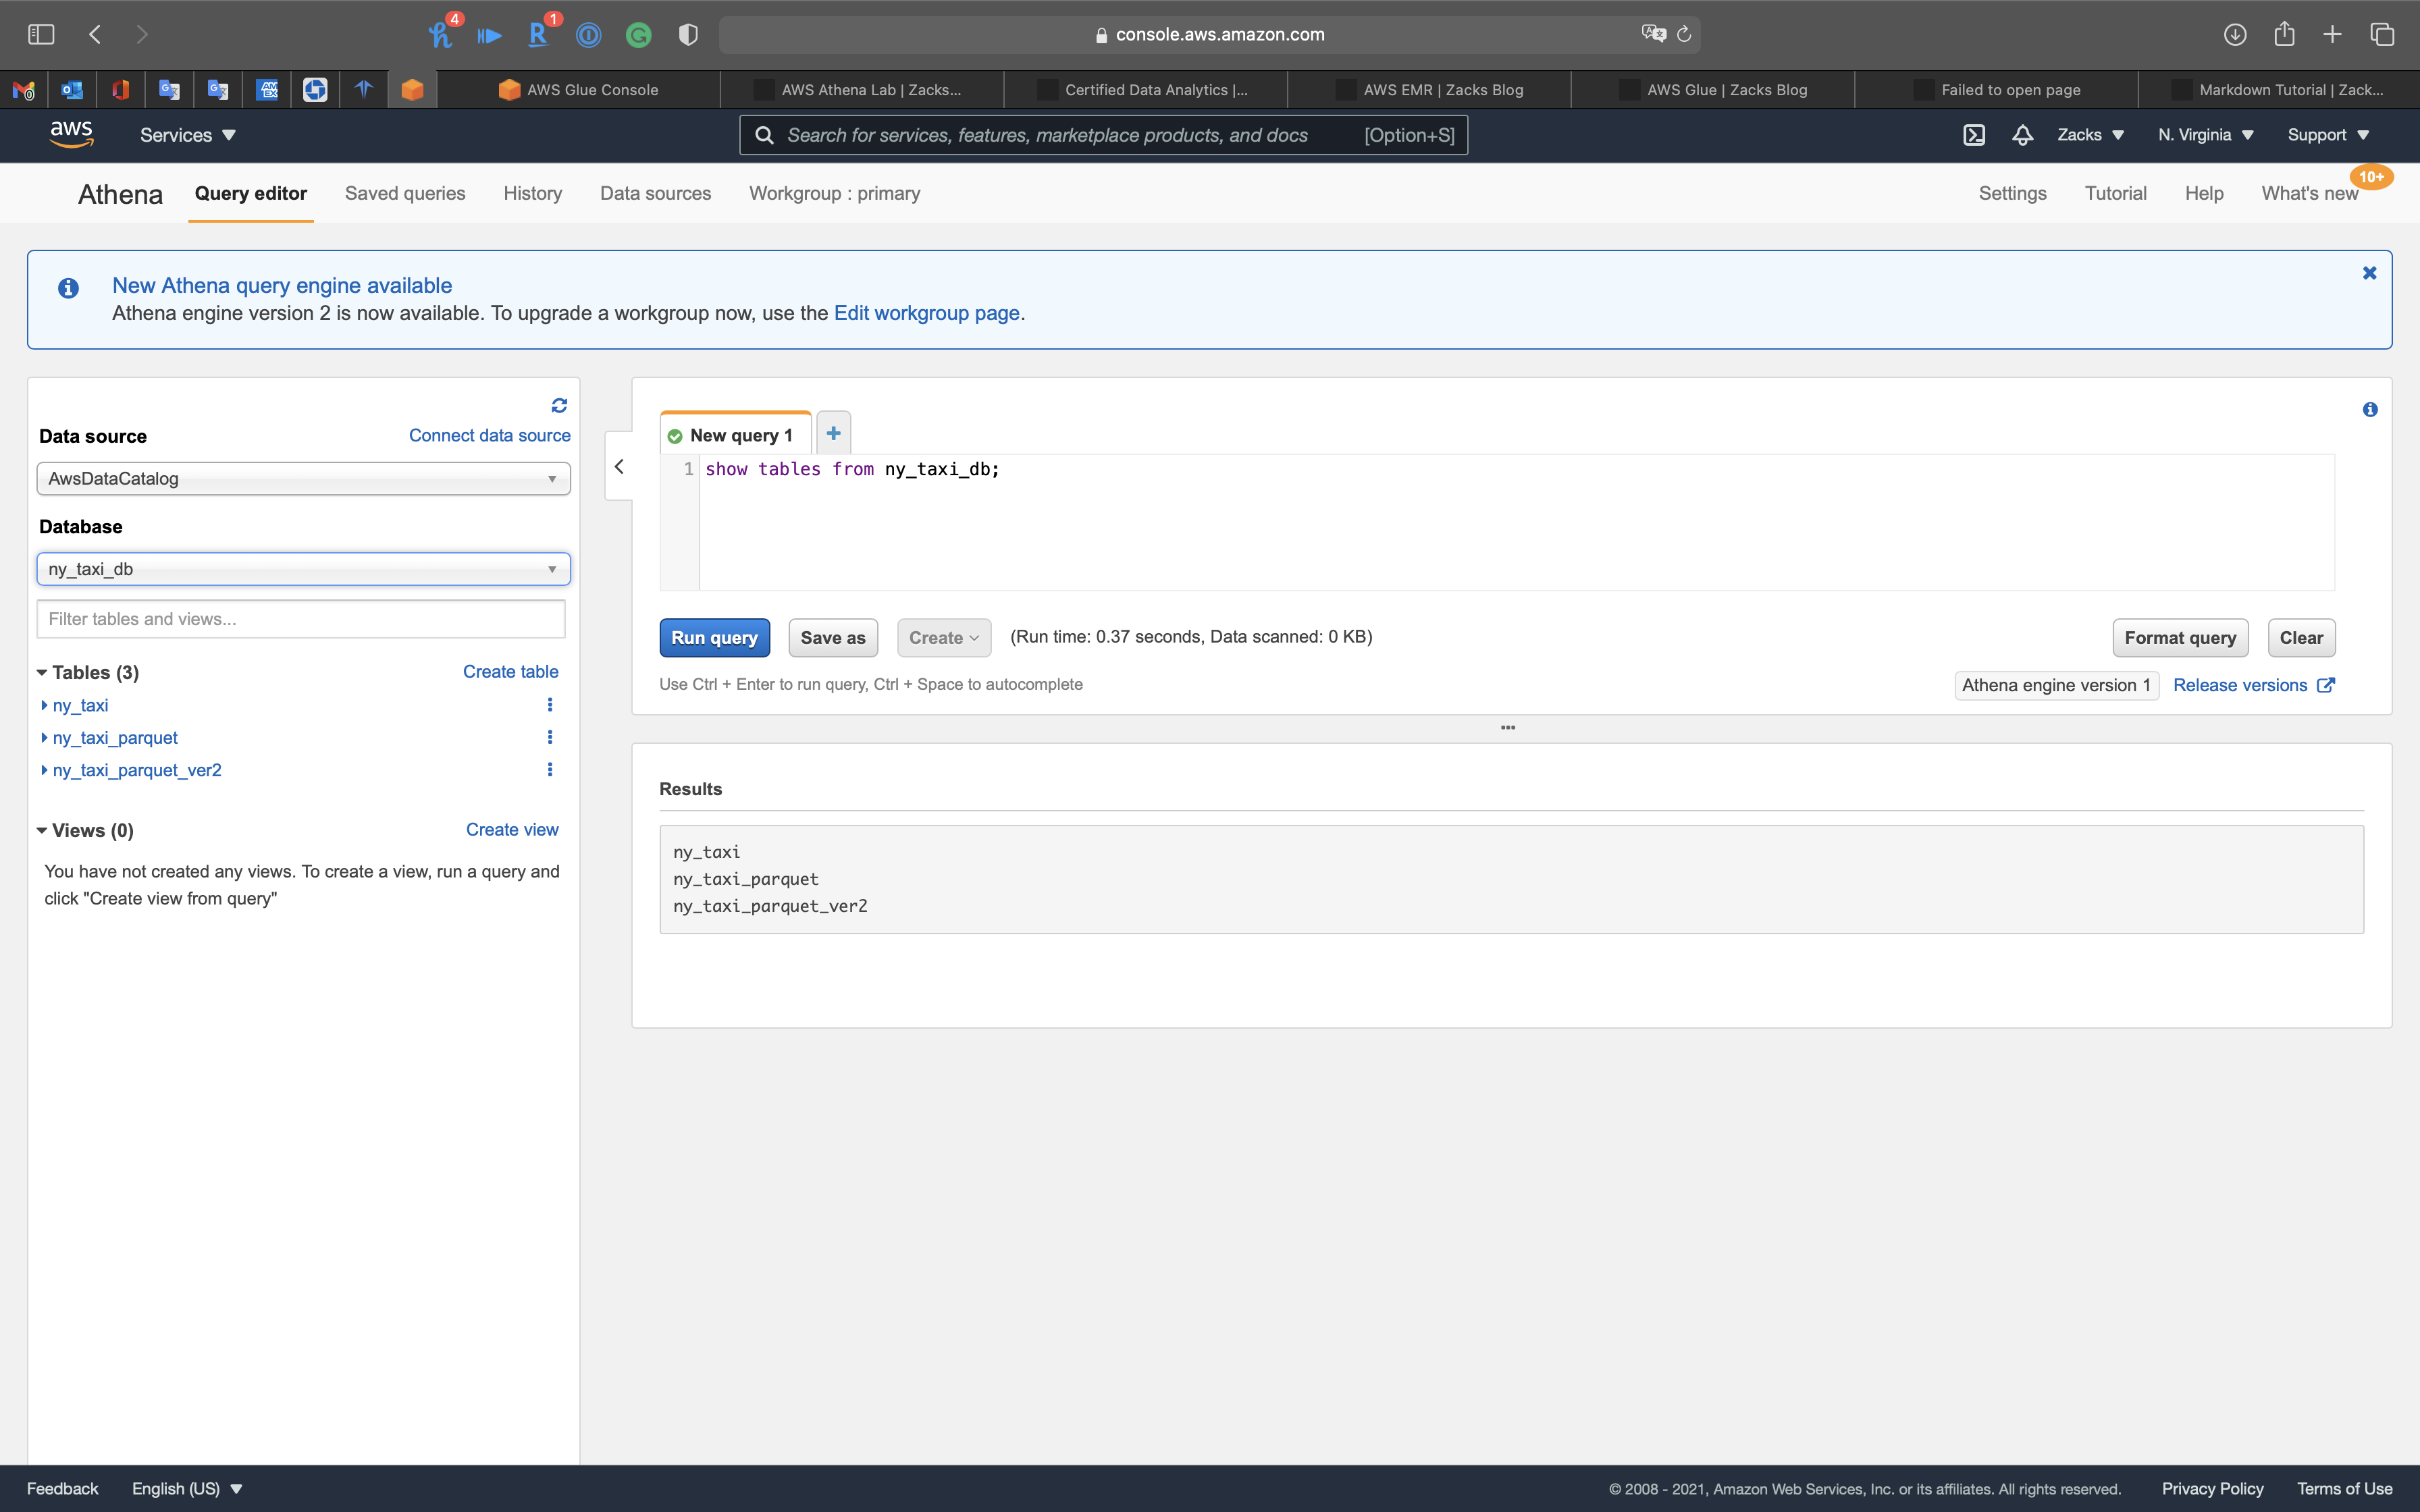
Tables
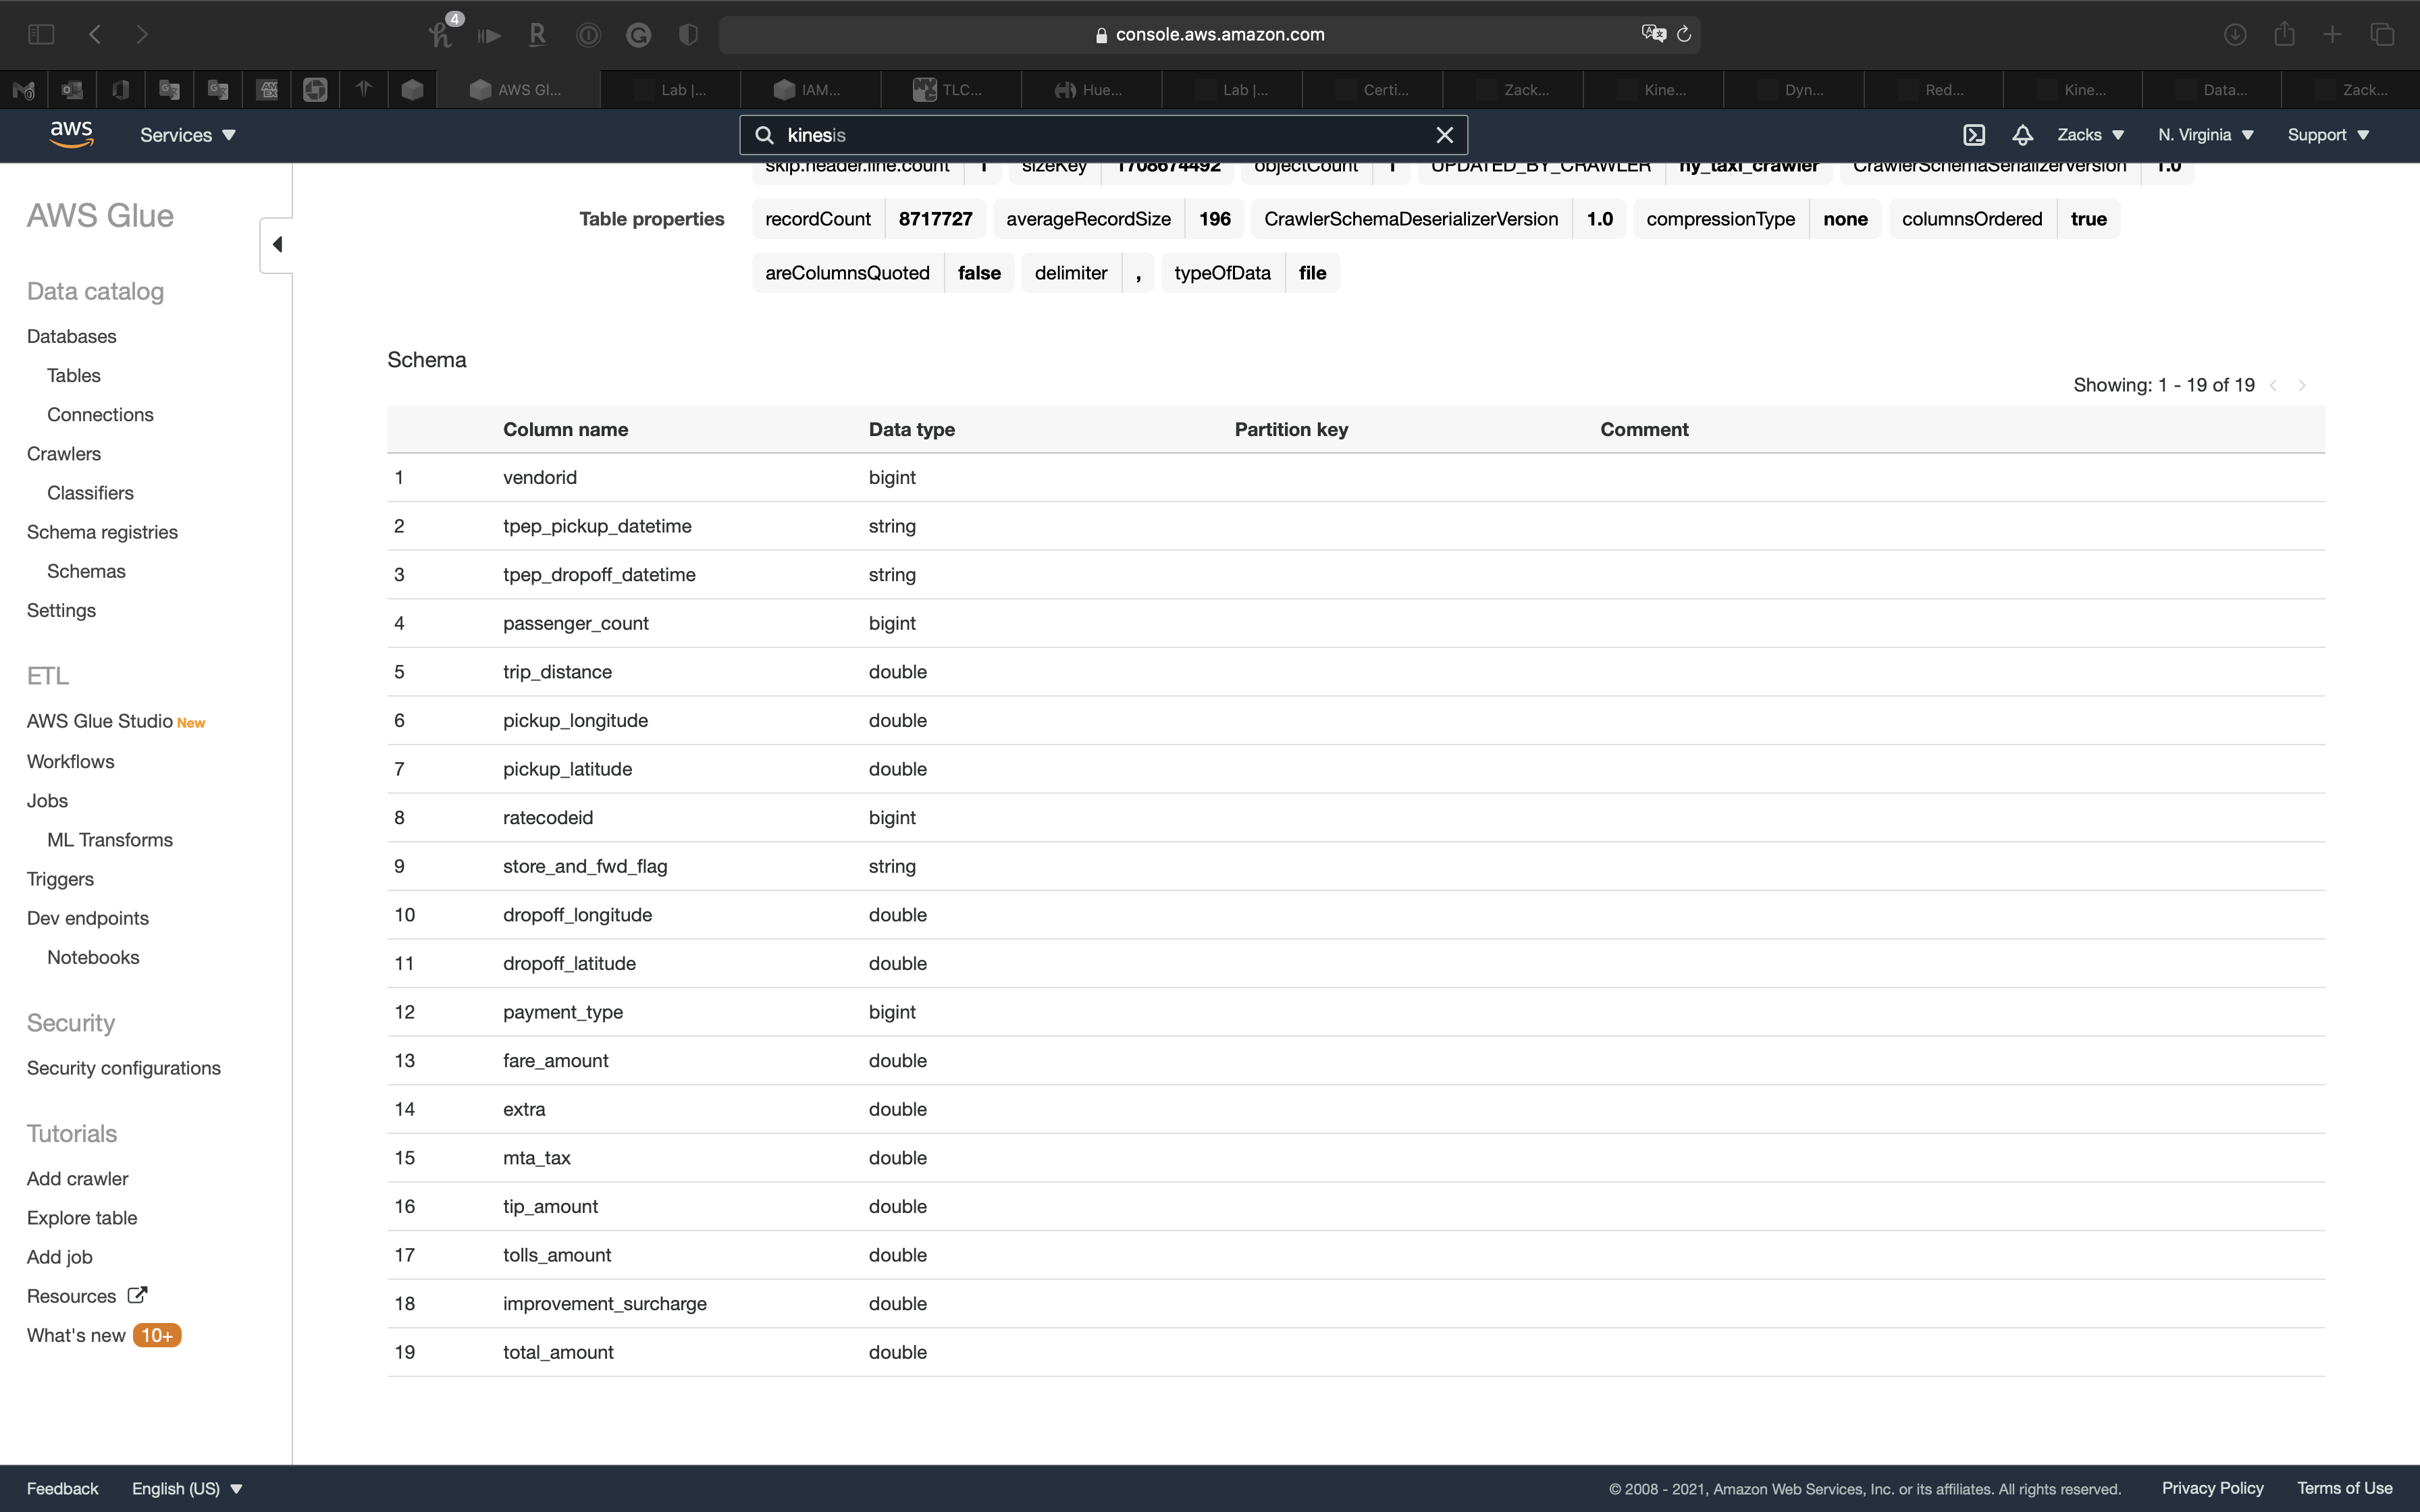
Here are the tables ny_taxi and ny_taxi_parquet.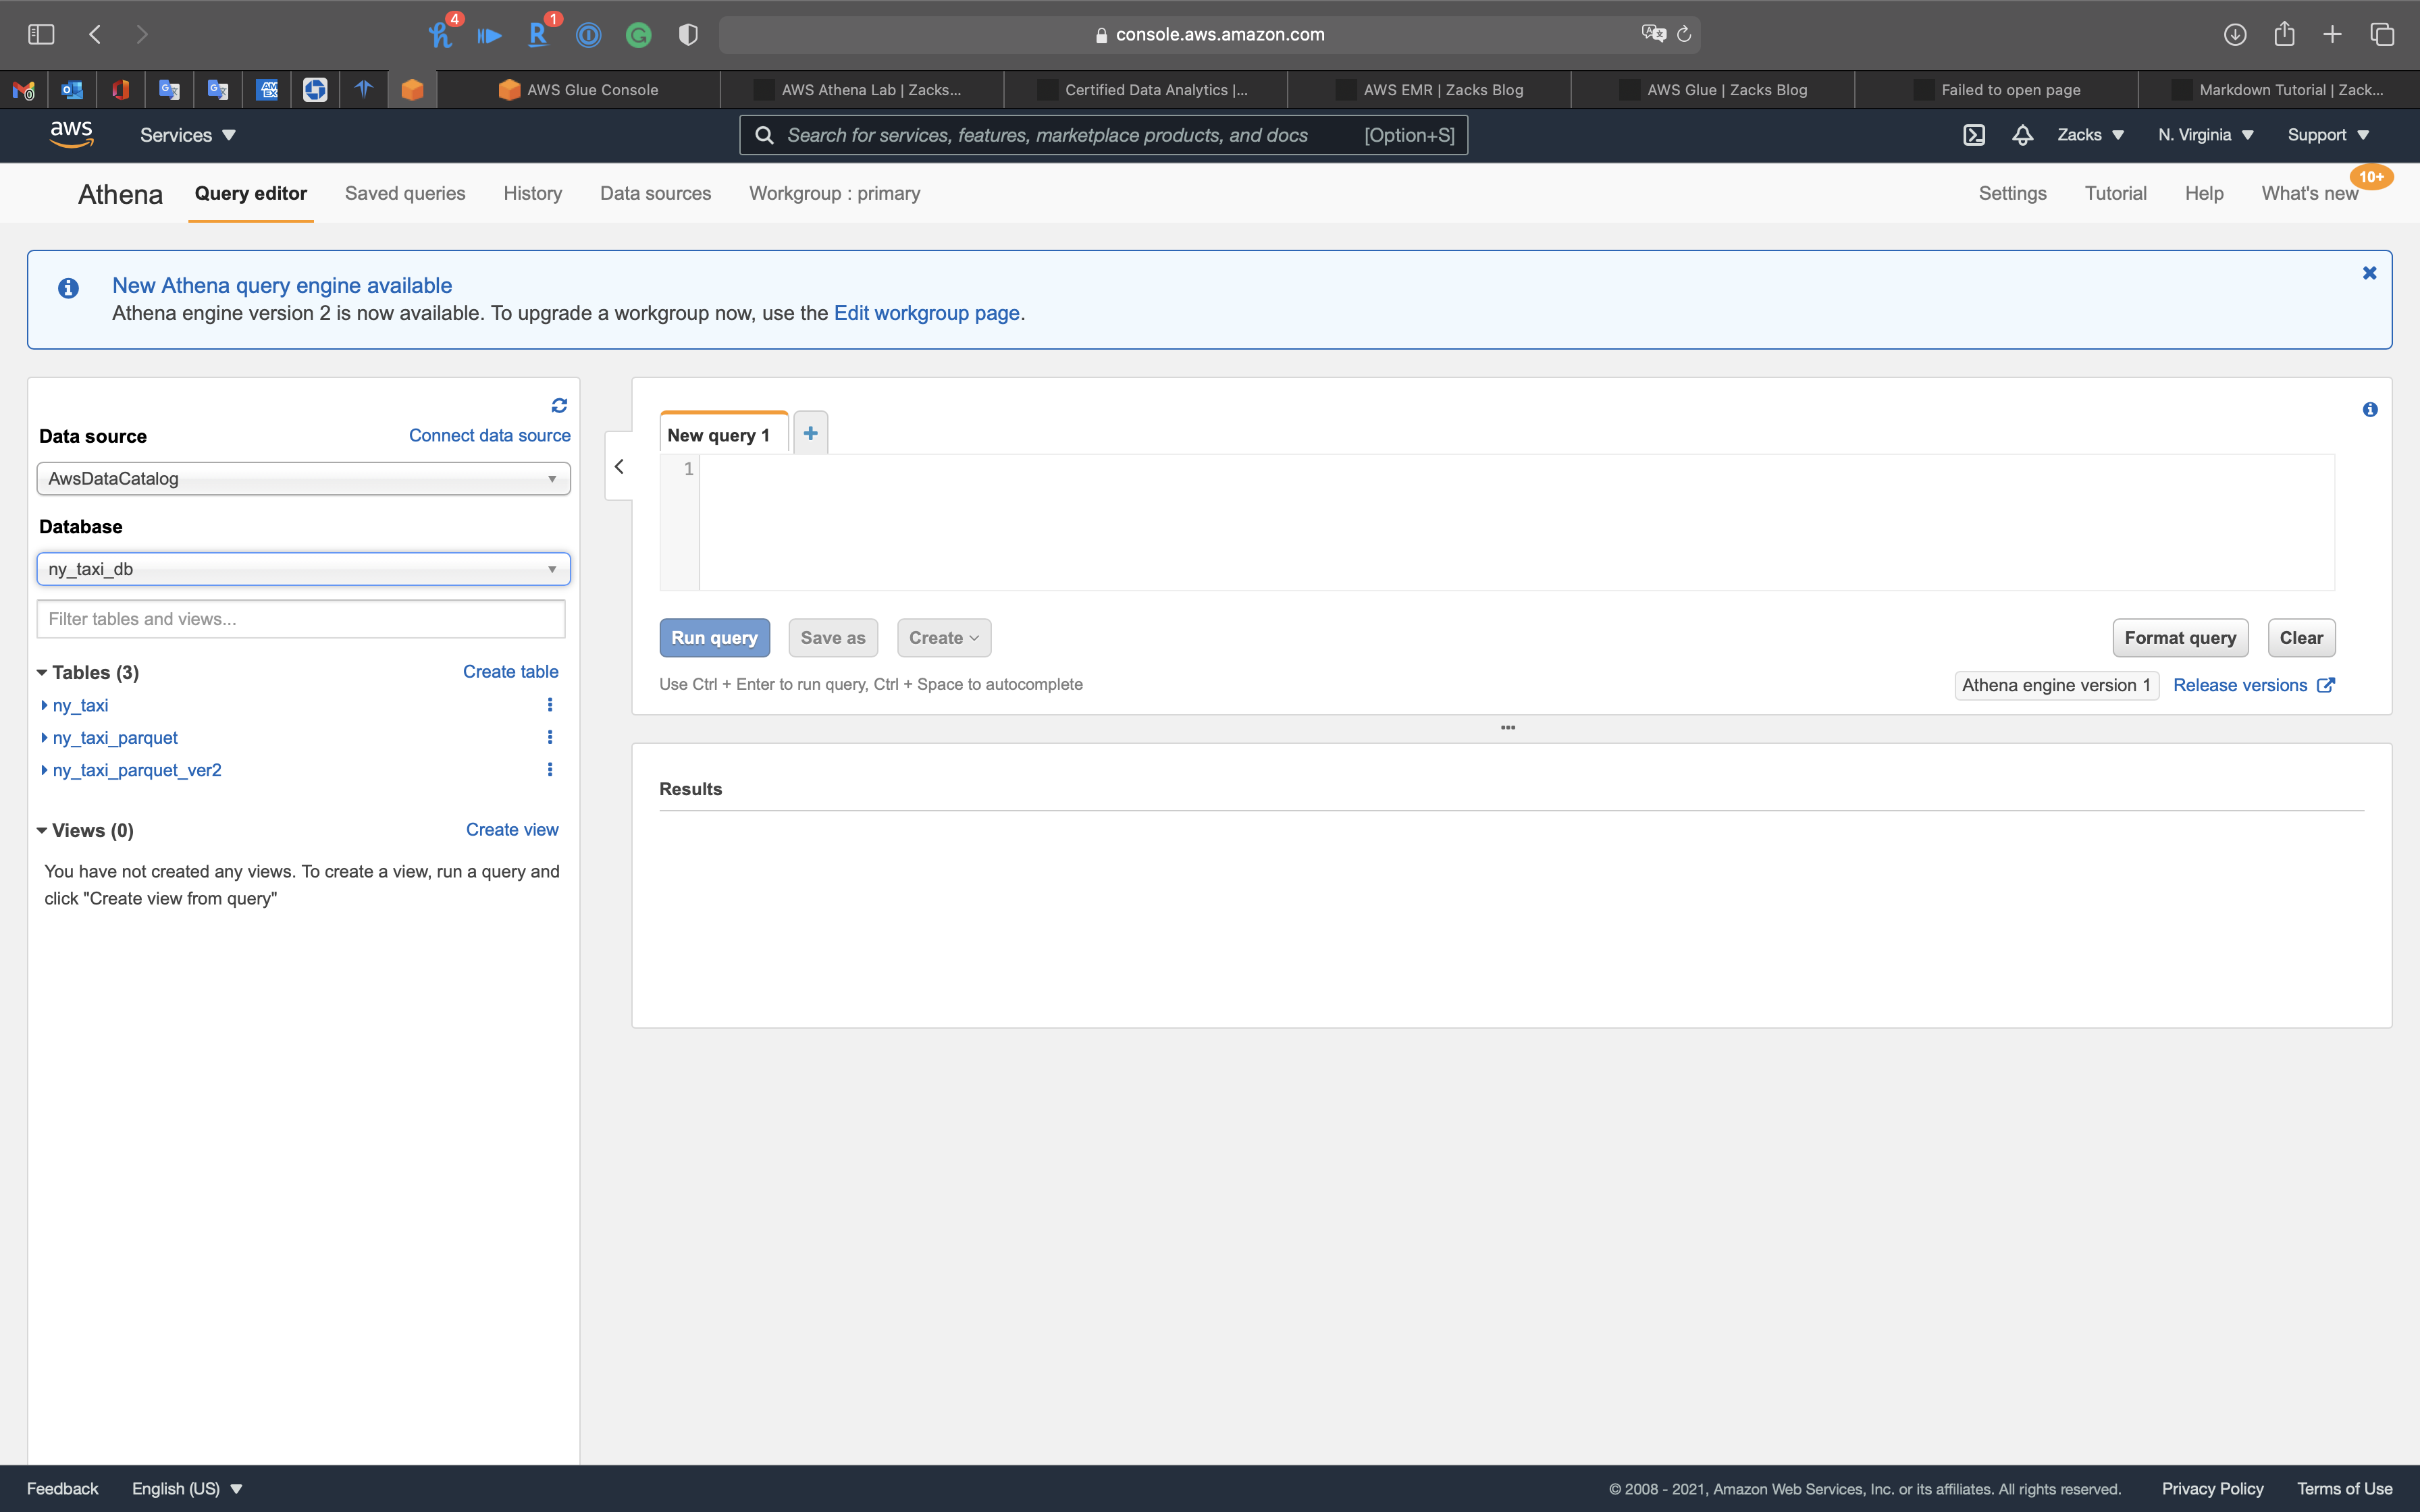
Attributes in table ny_taxi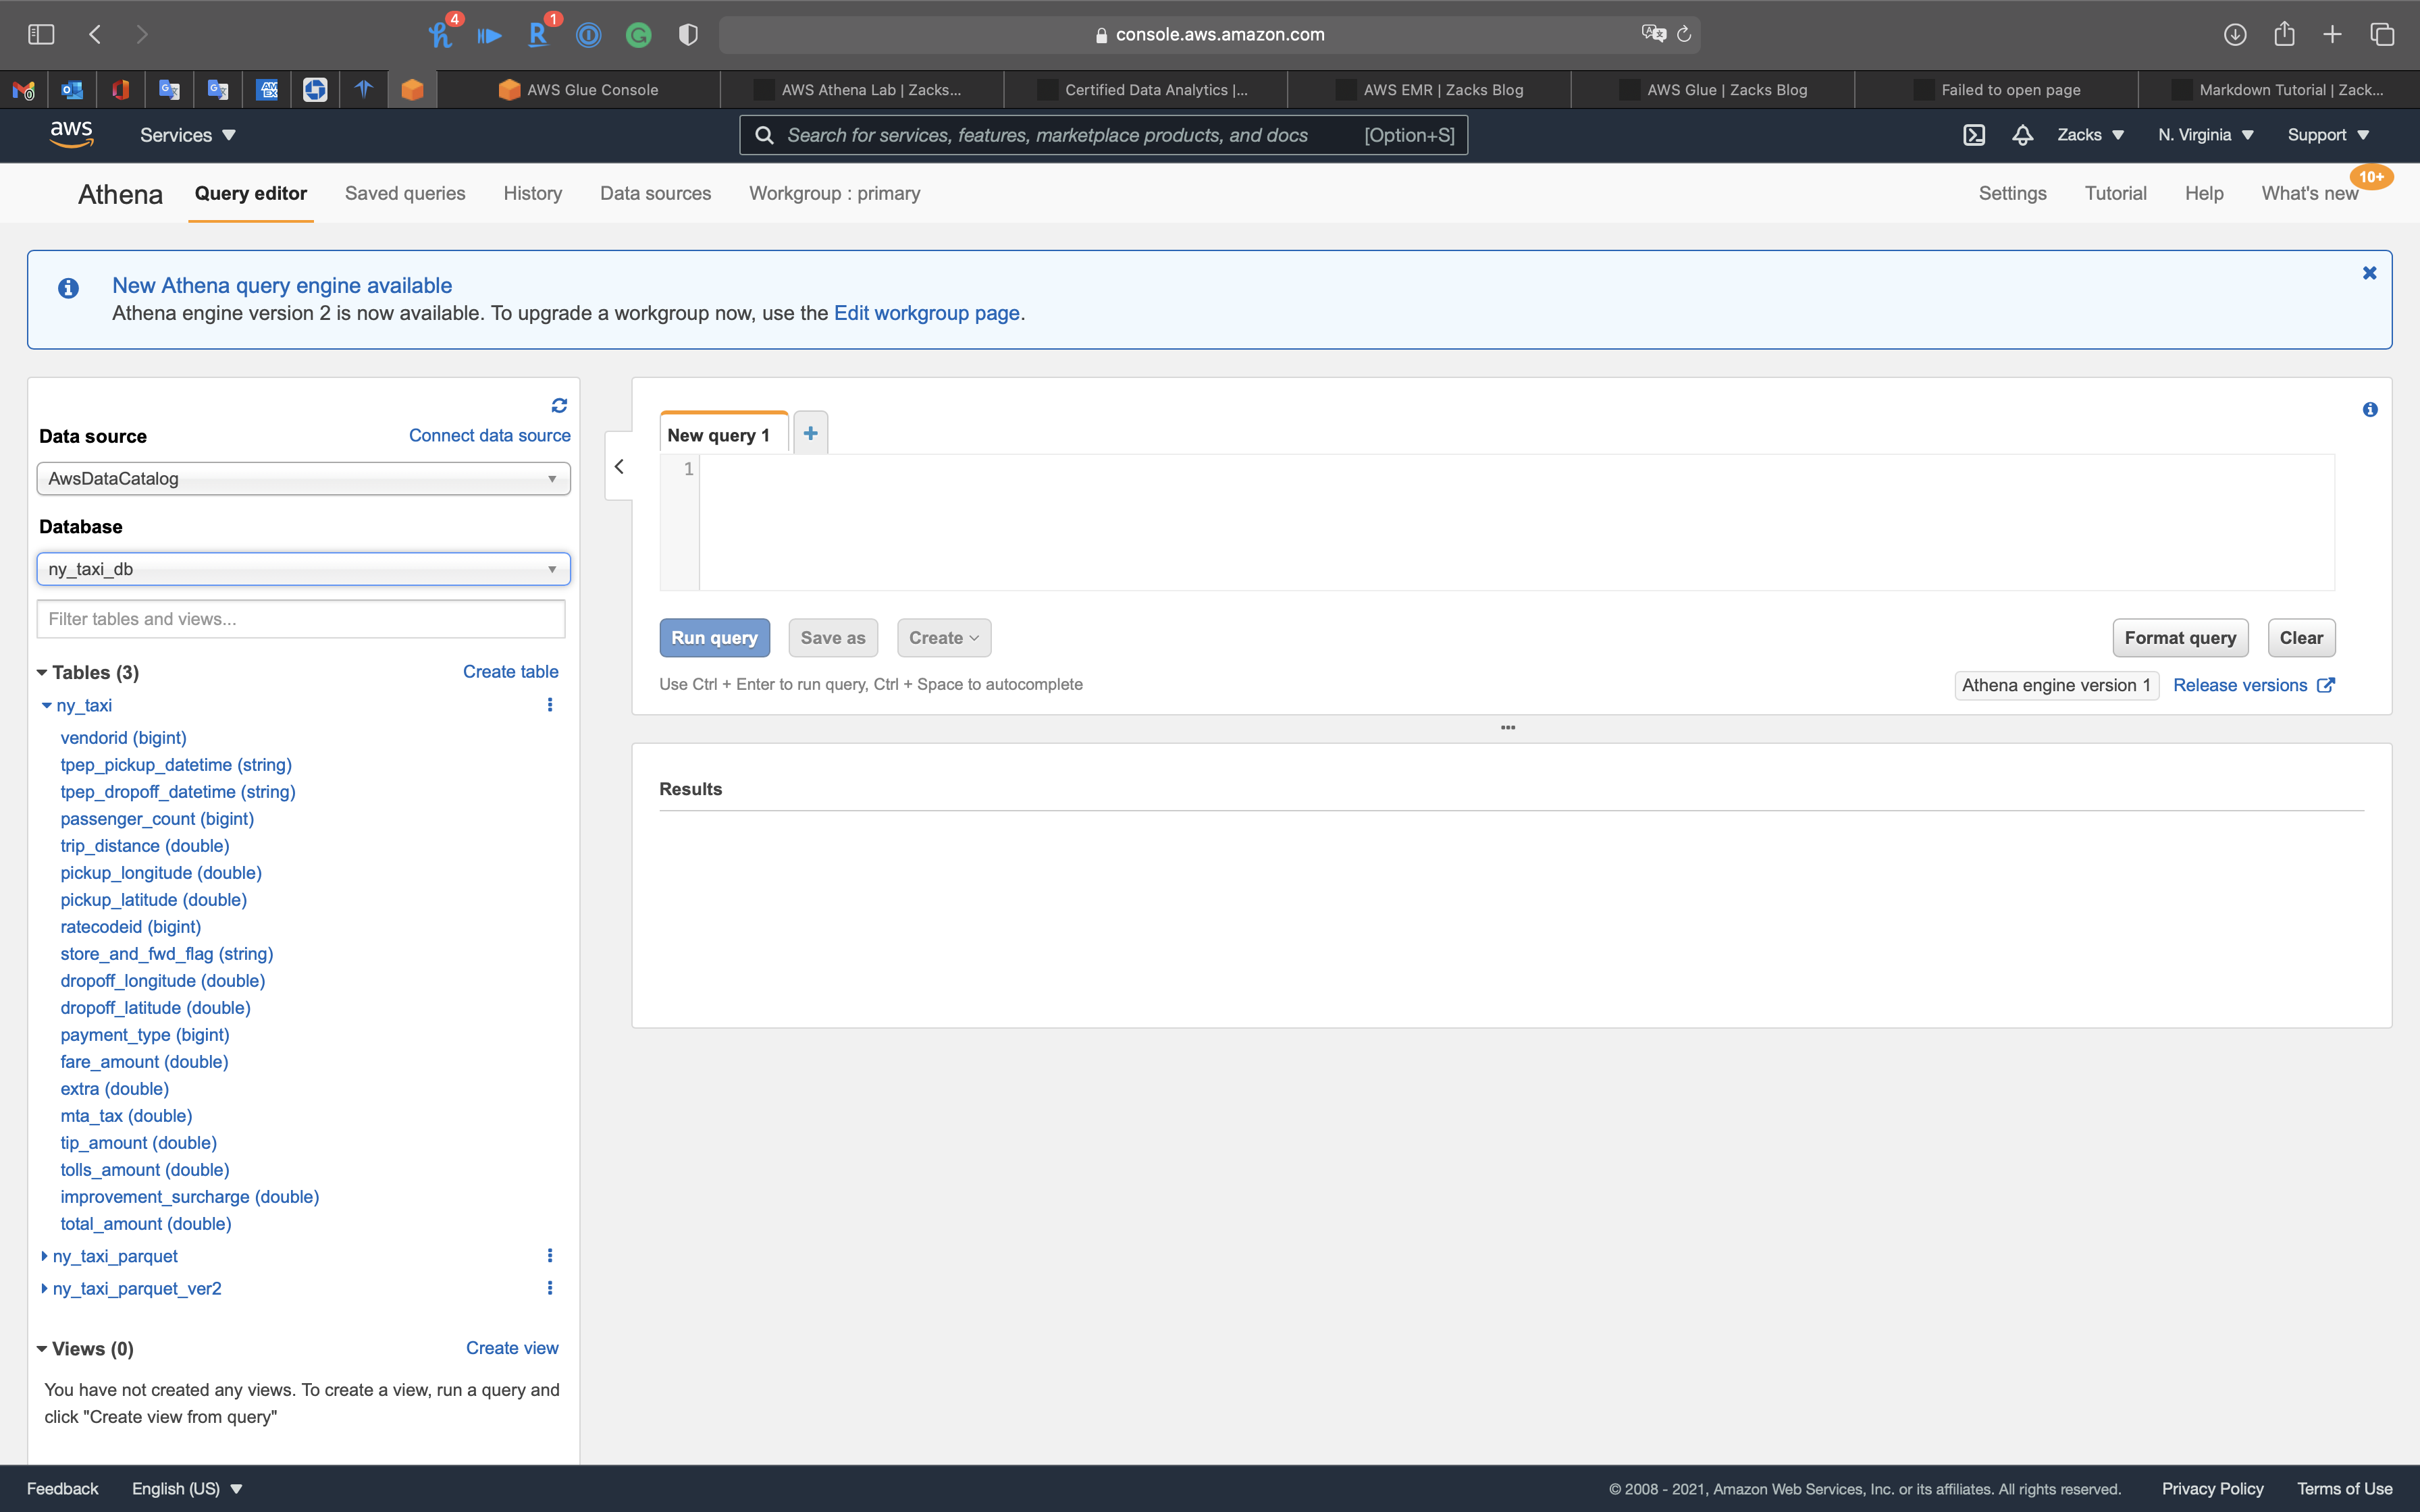
Attributes in table ny_taxi_parquet
You can see tpep_pickup_datetime (string) and tpep_dropoff_datetime (string) have been transformed to pickup_date (timestamp) and dropoff_date (timestamp)
Athena Query
You can click Run query button to query data in S3 through Glue schema.
You can also do it in pressing Command + Enter
1 | show tables from ny_taxi_db; |
1 | select count(*) from ny_taxi_db.ny_taxi; |
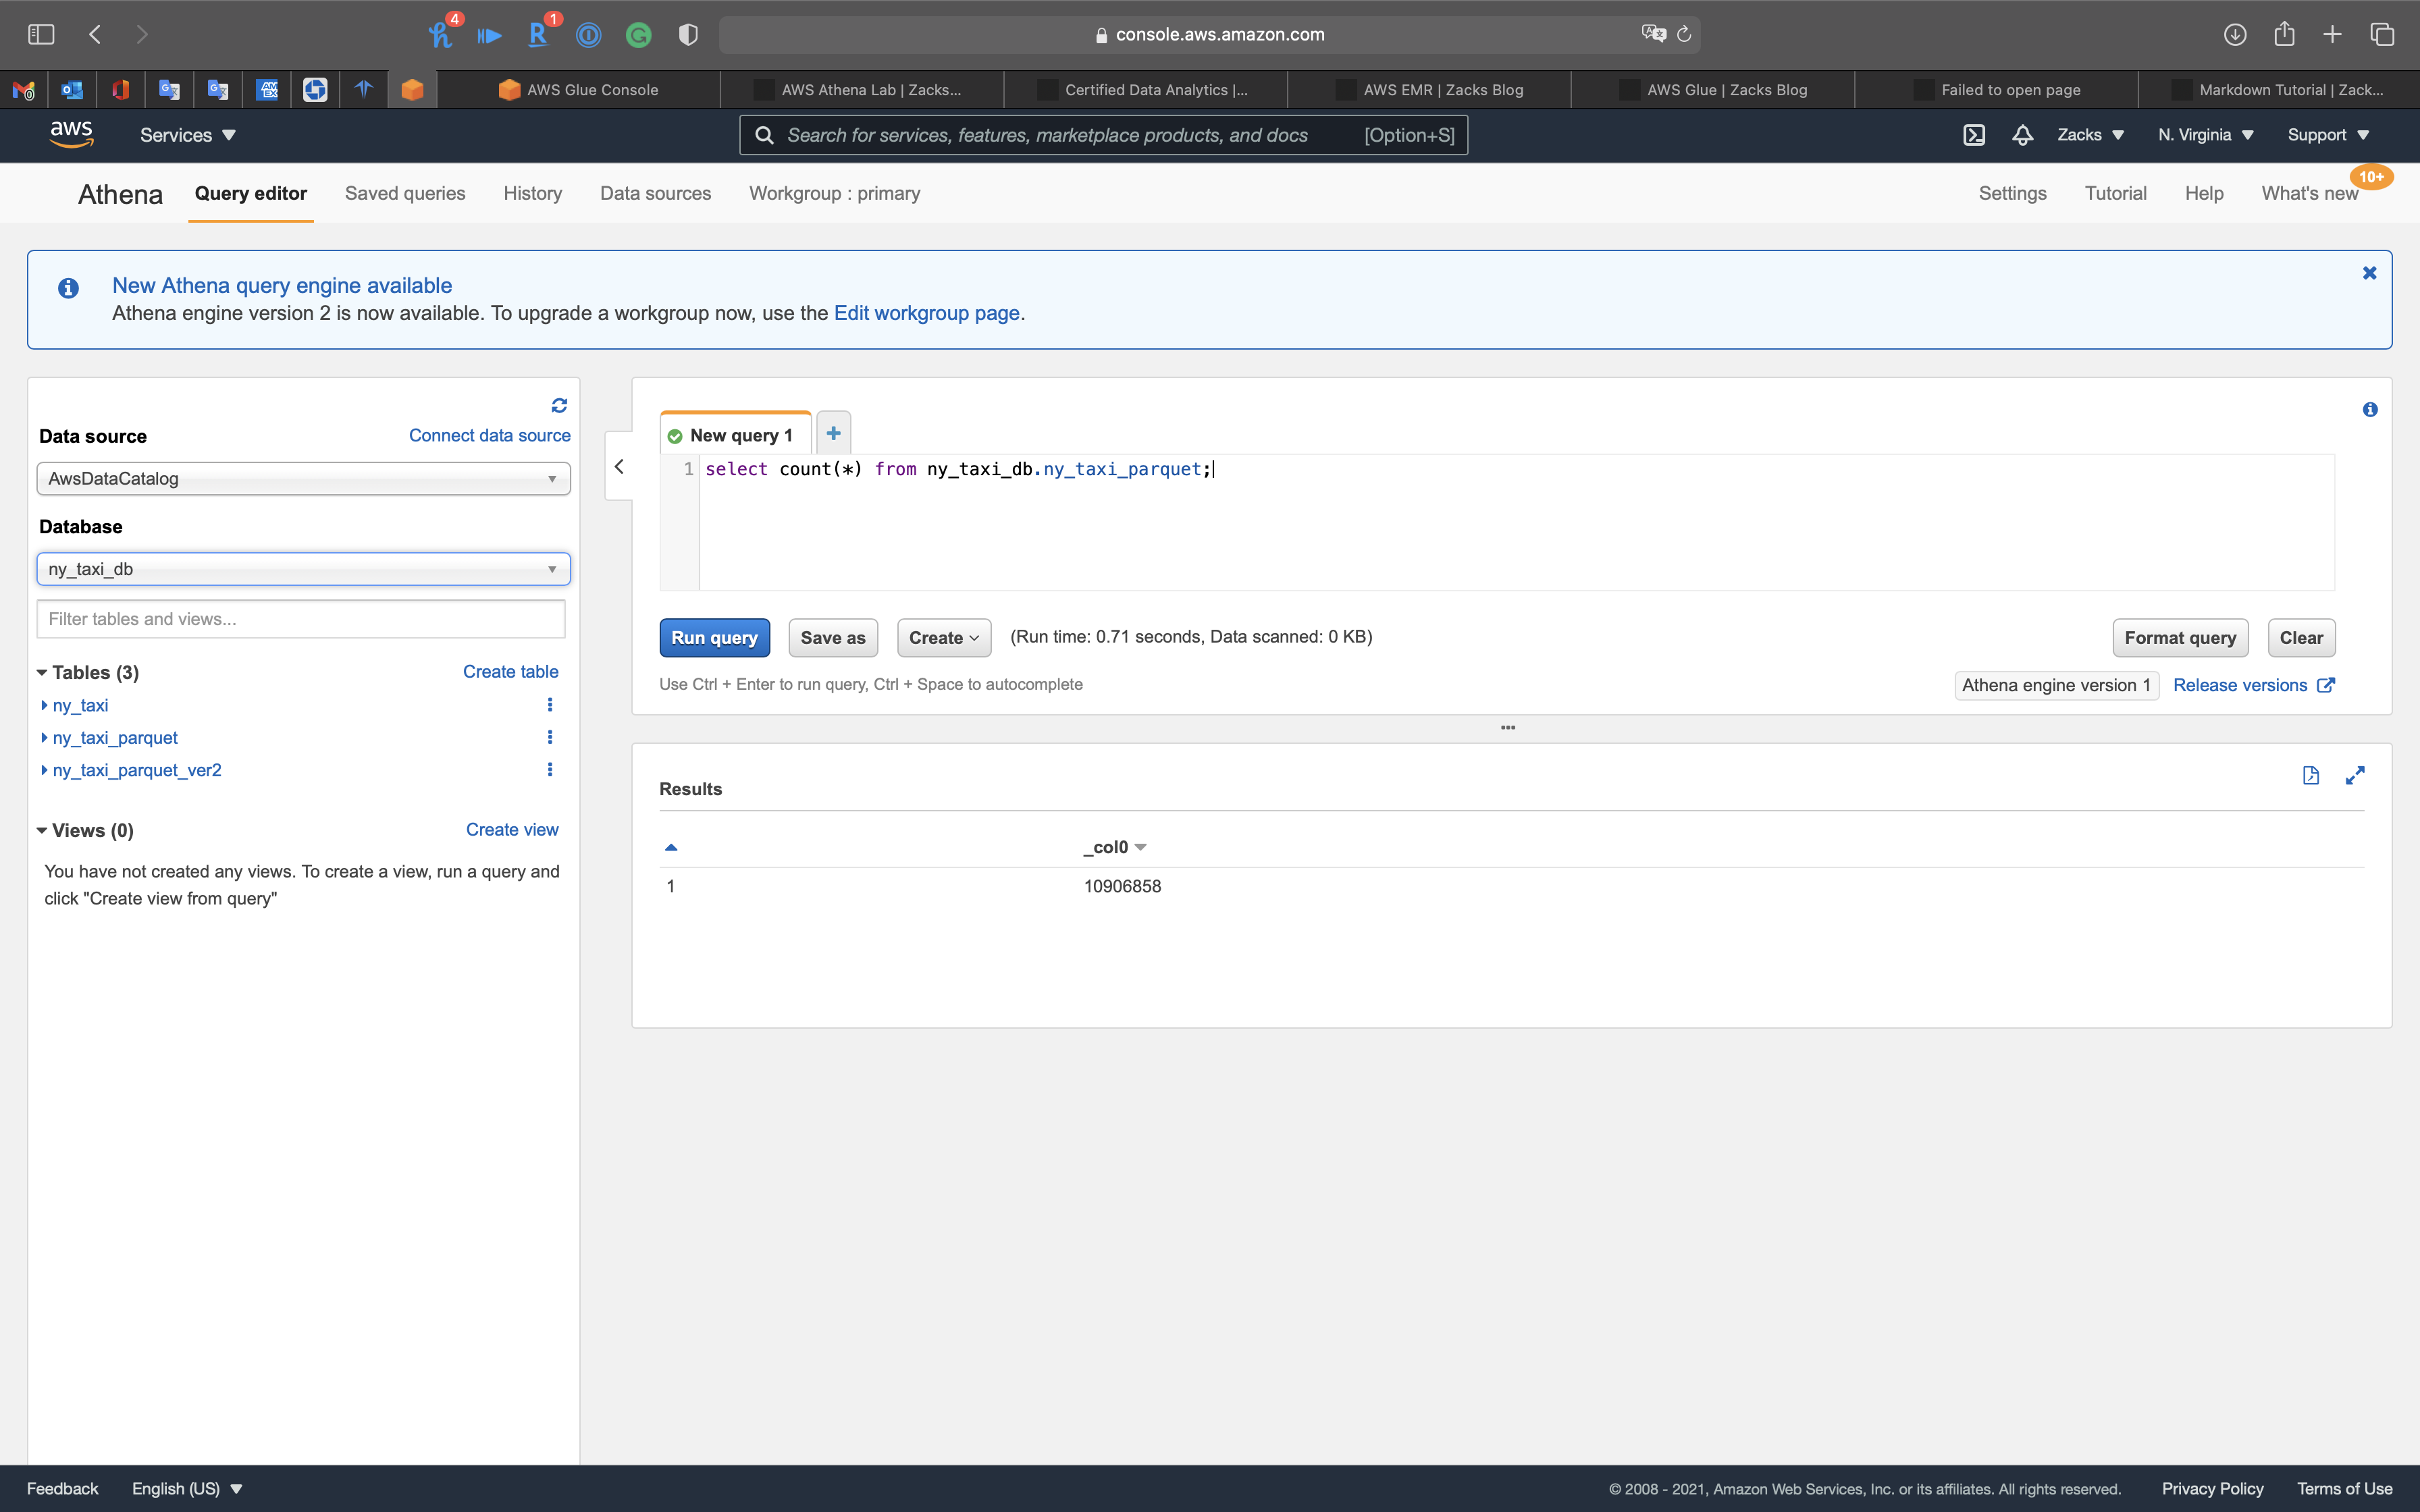
1 | select count(*) from ny_taxi_db.ny_taxi_parquet; |
Notice in ny_taxi table, the datetime is string type, which is hard to extract date and time.
1 | select * from ny_taxi_db.ny_taxi order by tpep_pickup_datetime limit 10; |
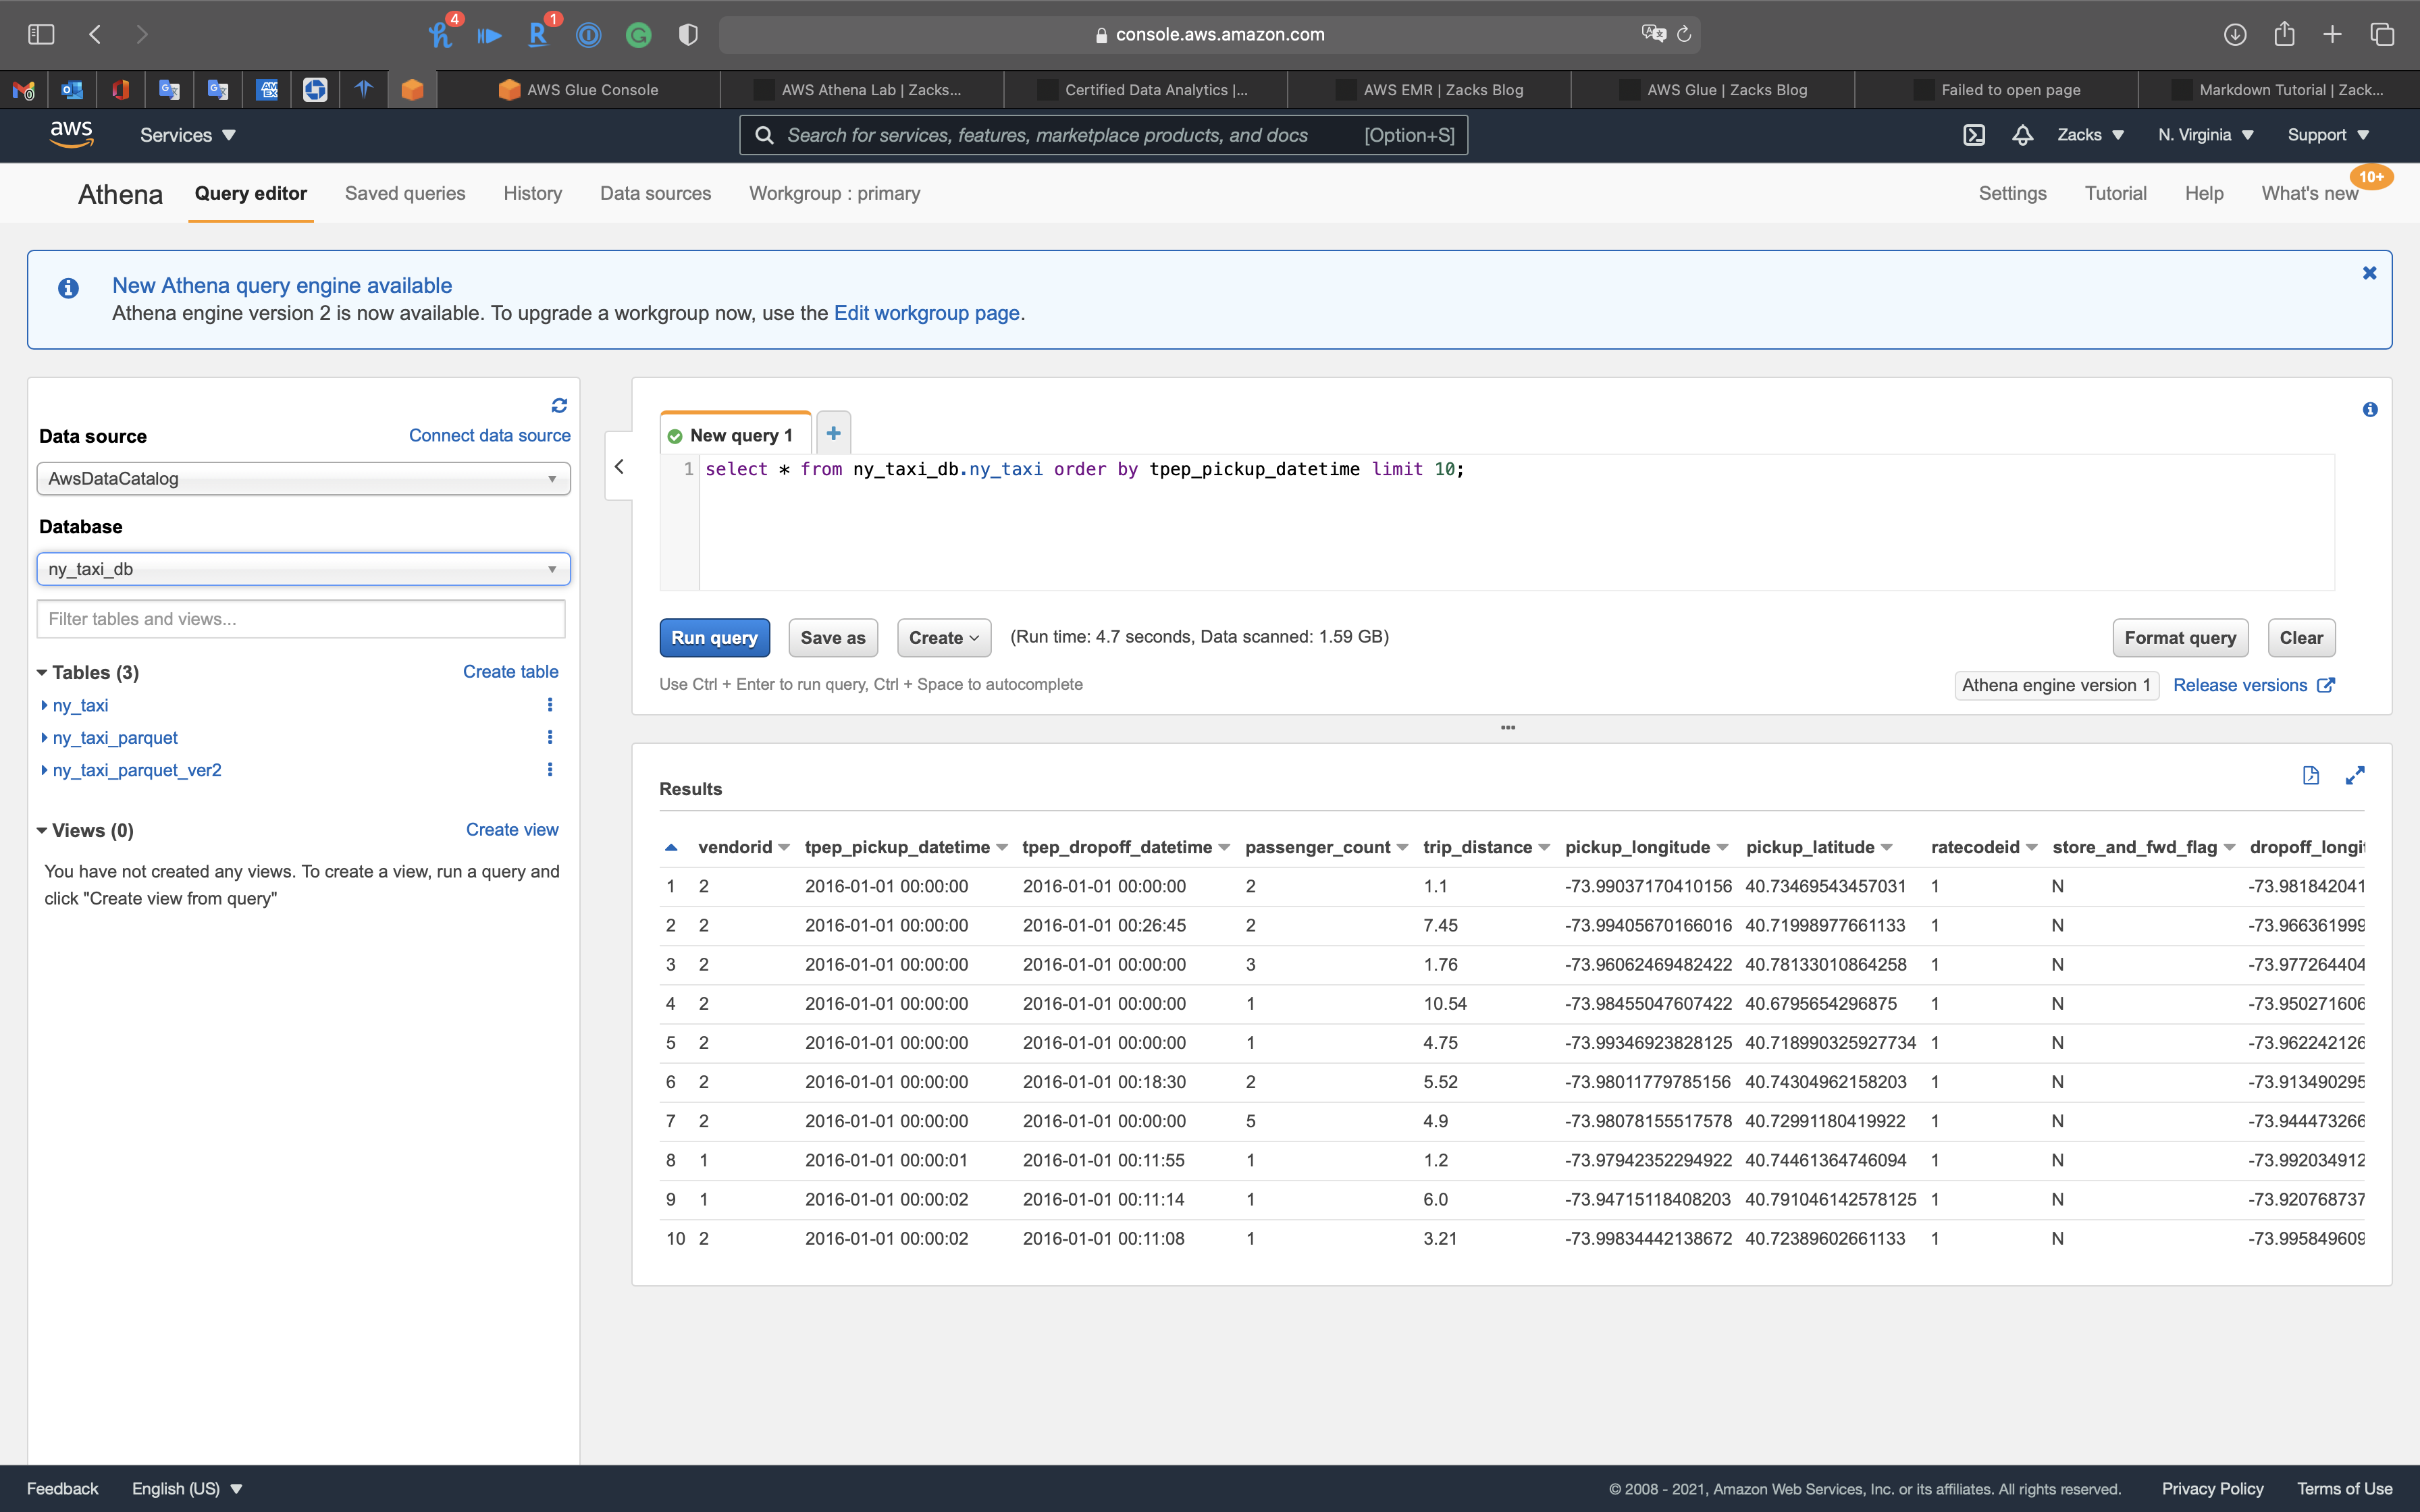
Since we use AWS Glue ETL convert the string of datetime in CSV file to timestamp and removed tpep_ prefix.
1 | select * from ny_taxi_db.ny_taxi_parquet order by pickup_date limit 10; |
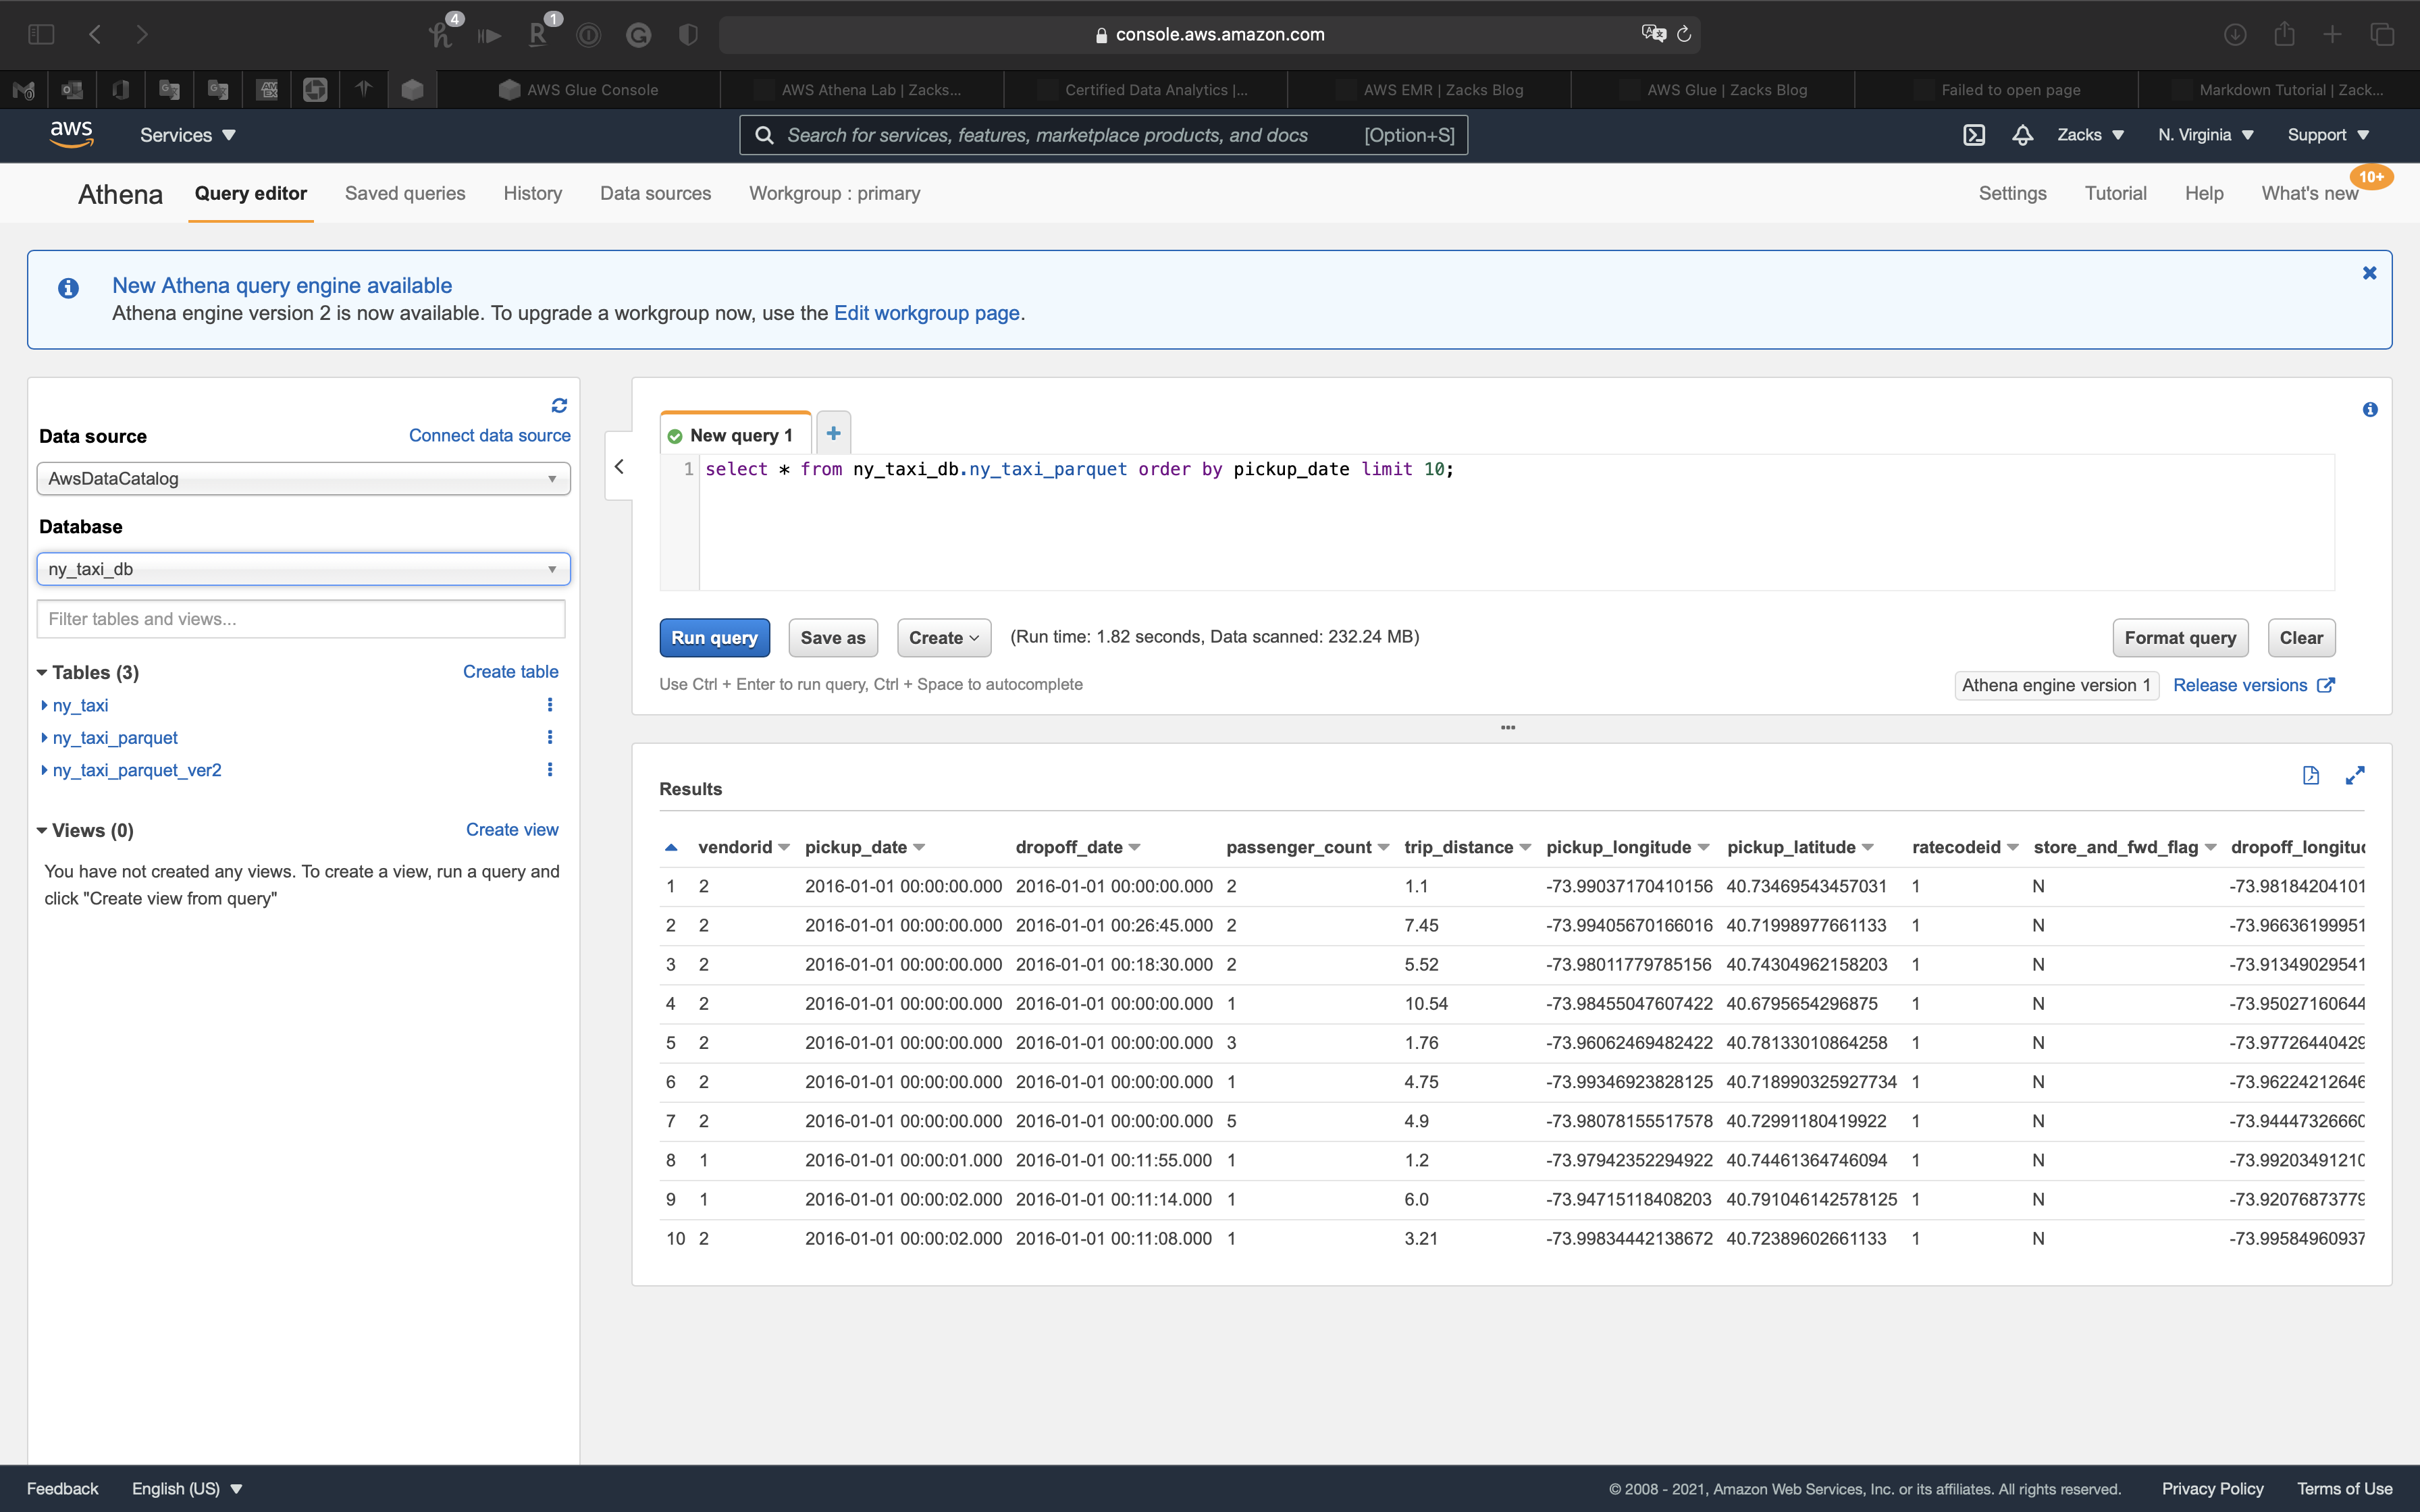
And when we scroll right, we can see the new column type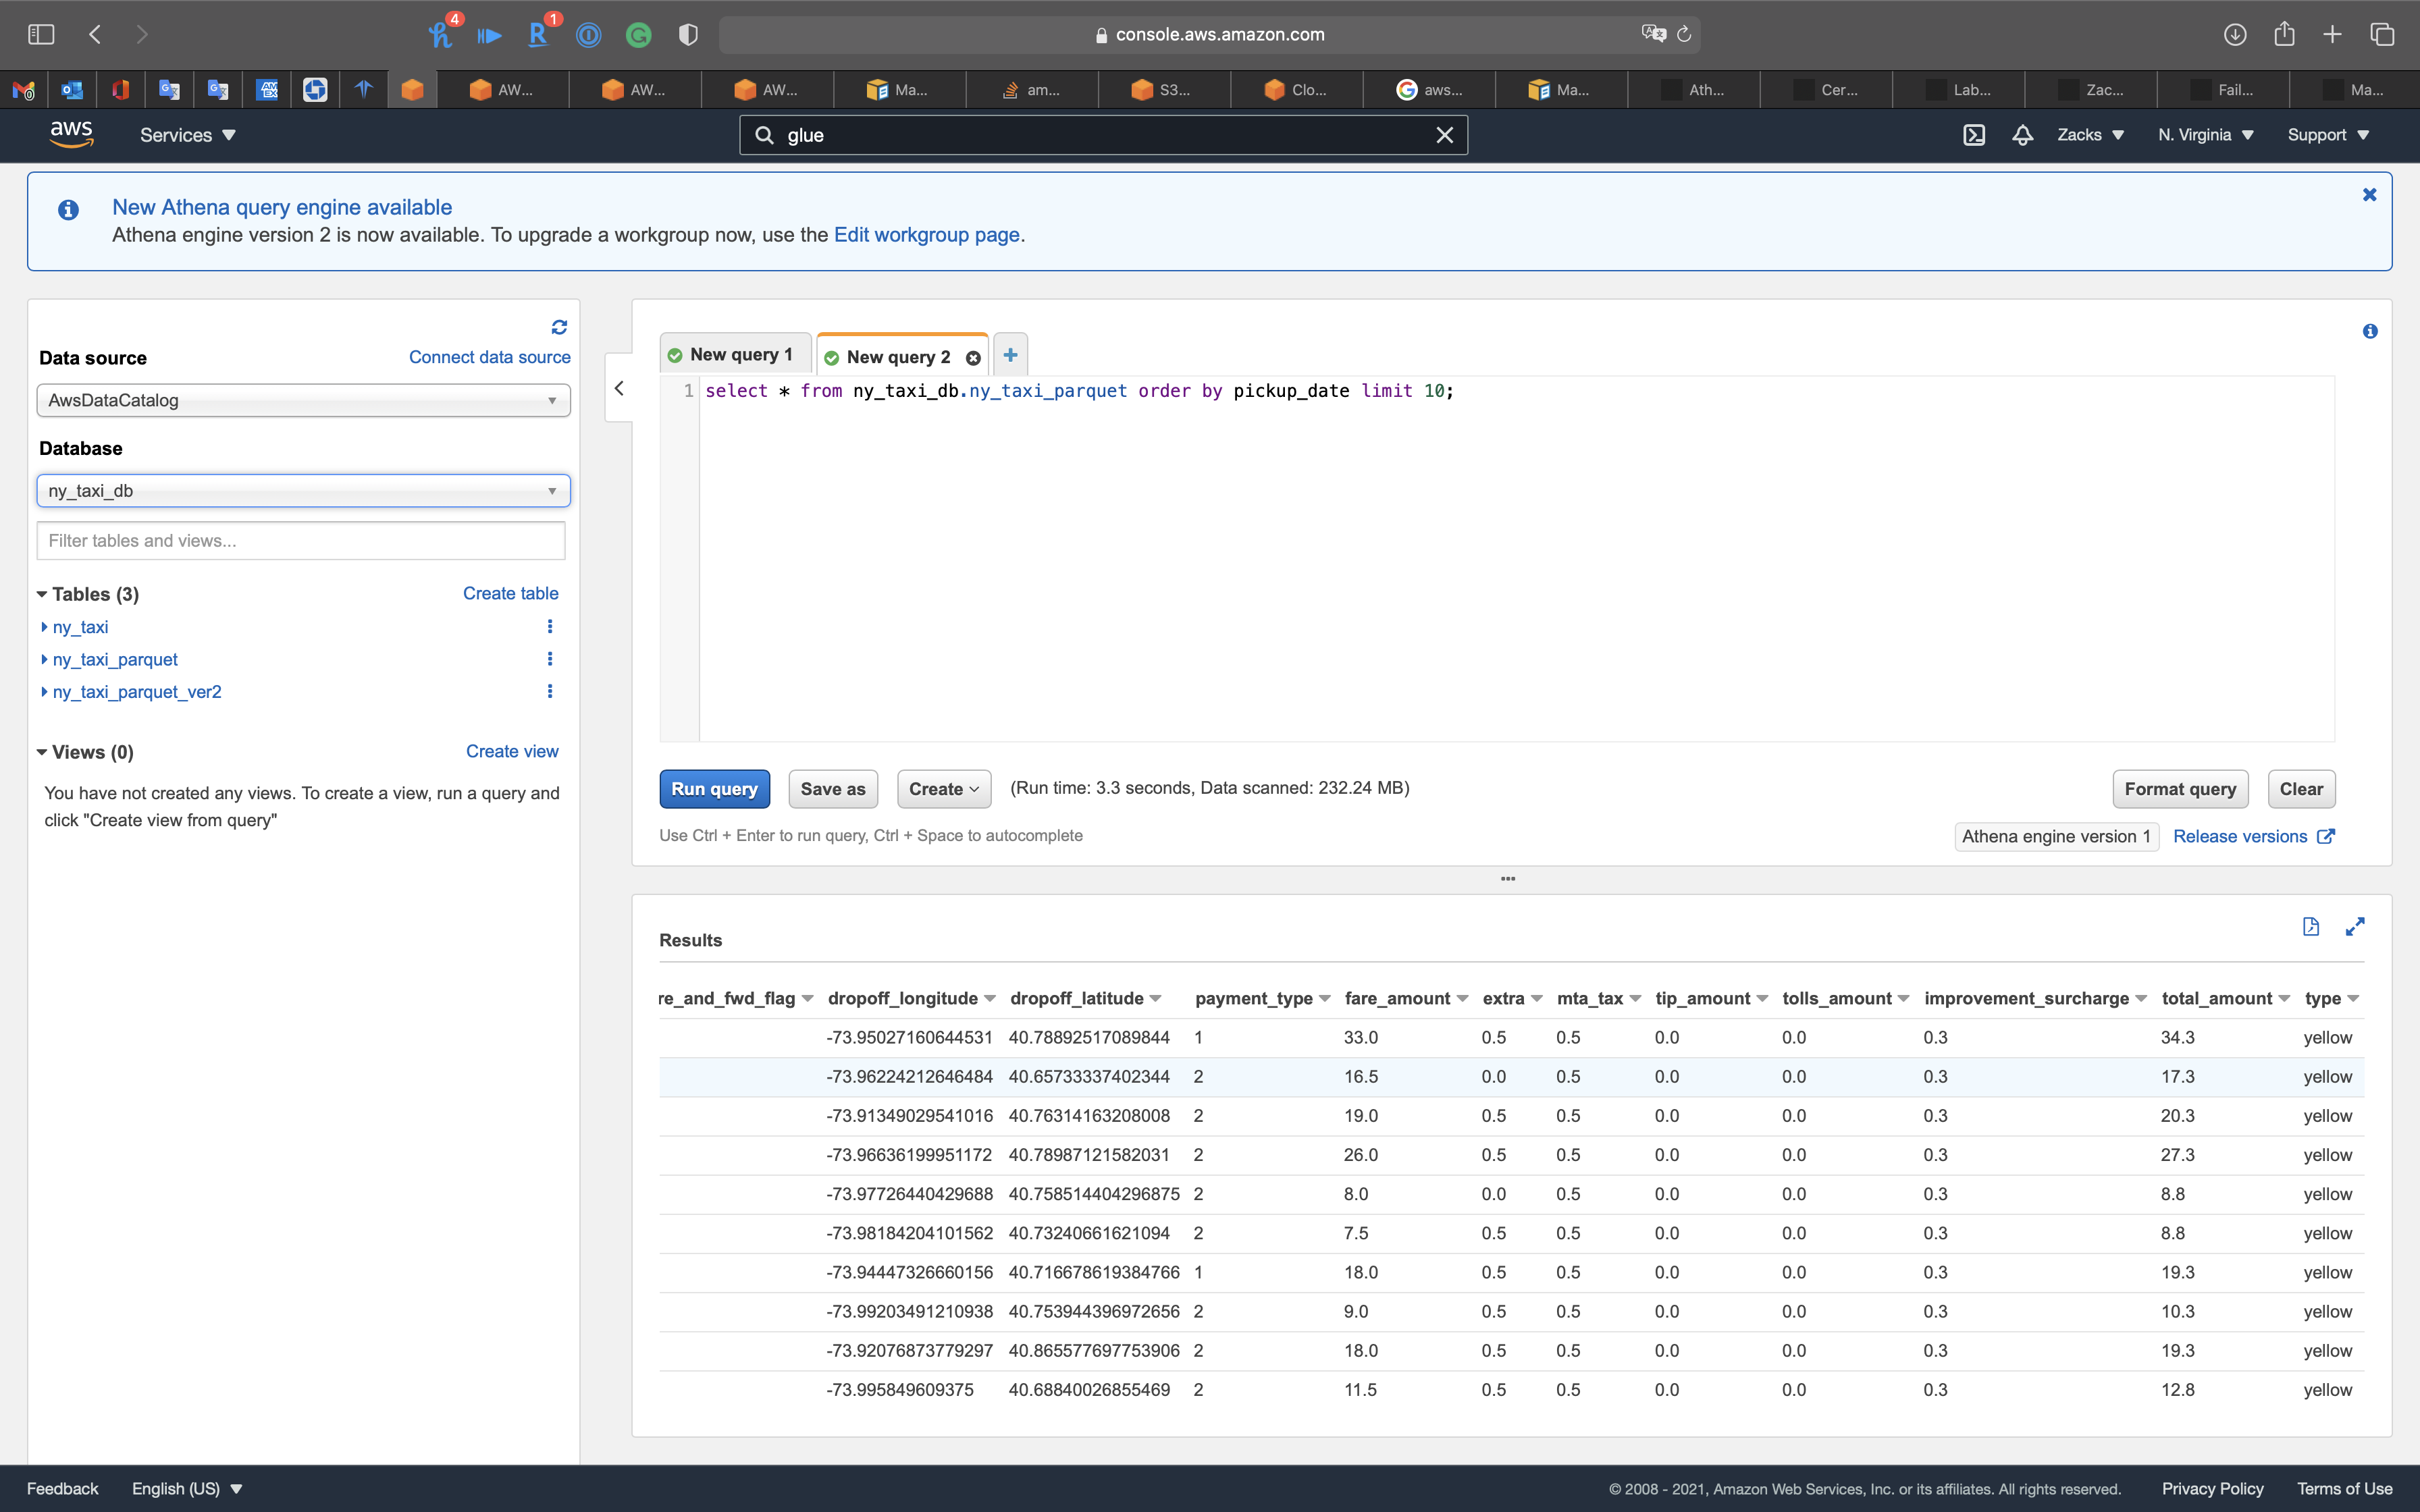
Use Athena to make time related queries
1 | SELECT EXTRACT (HOUR FROM pickup_date) AS hour, avg(fare_amount) AS average_fare FROM ny_taxi_db.ny_taxi_parquet GROUP BY 1 ORDER BY 1; |
We get the average_fare based on hour.
Conclusion: A taxi driver living in New York could earn the maximum fare during 4 AM to 5 AM.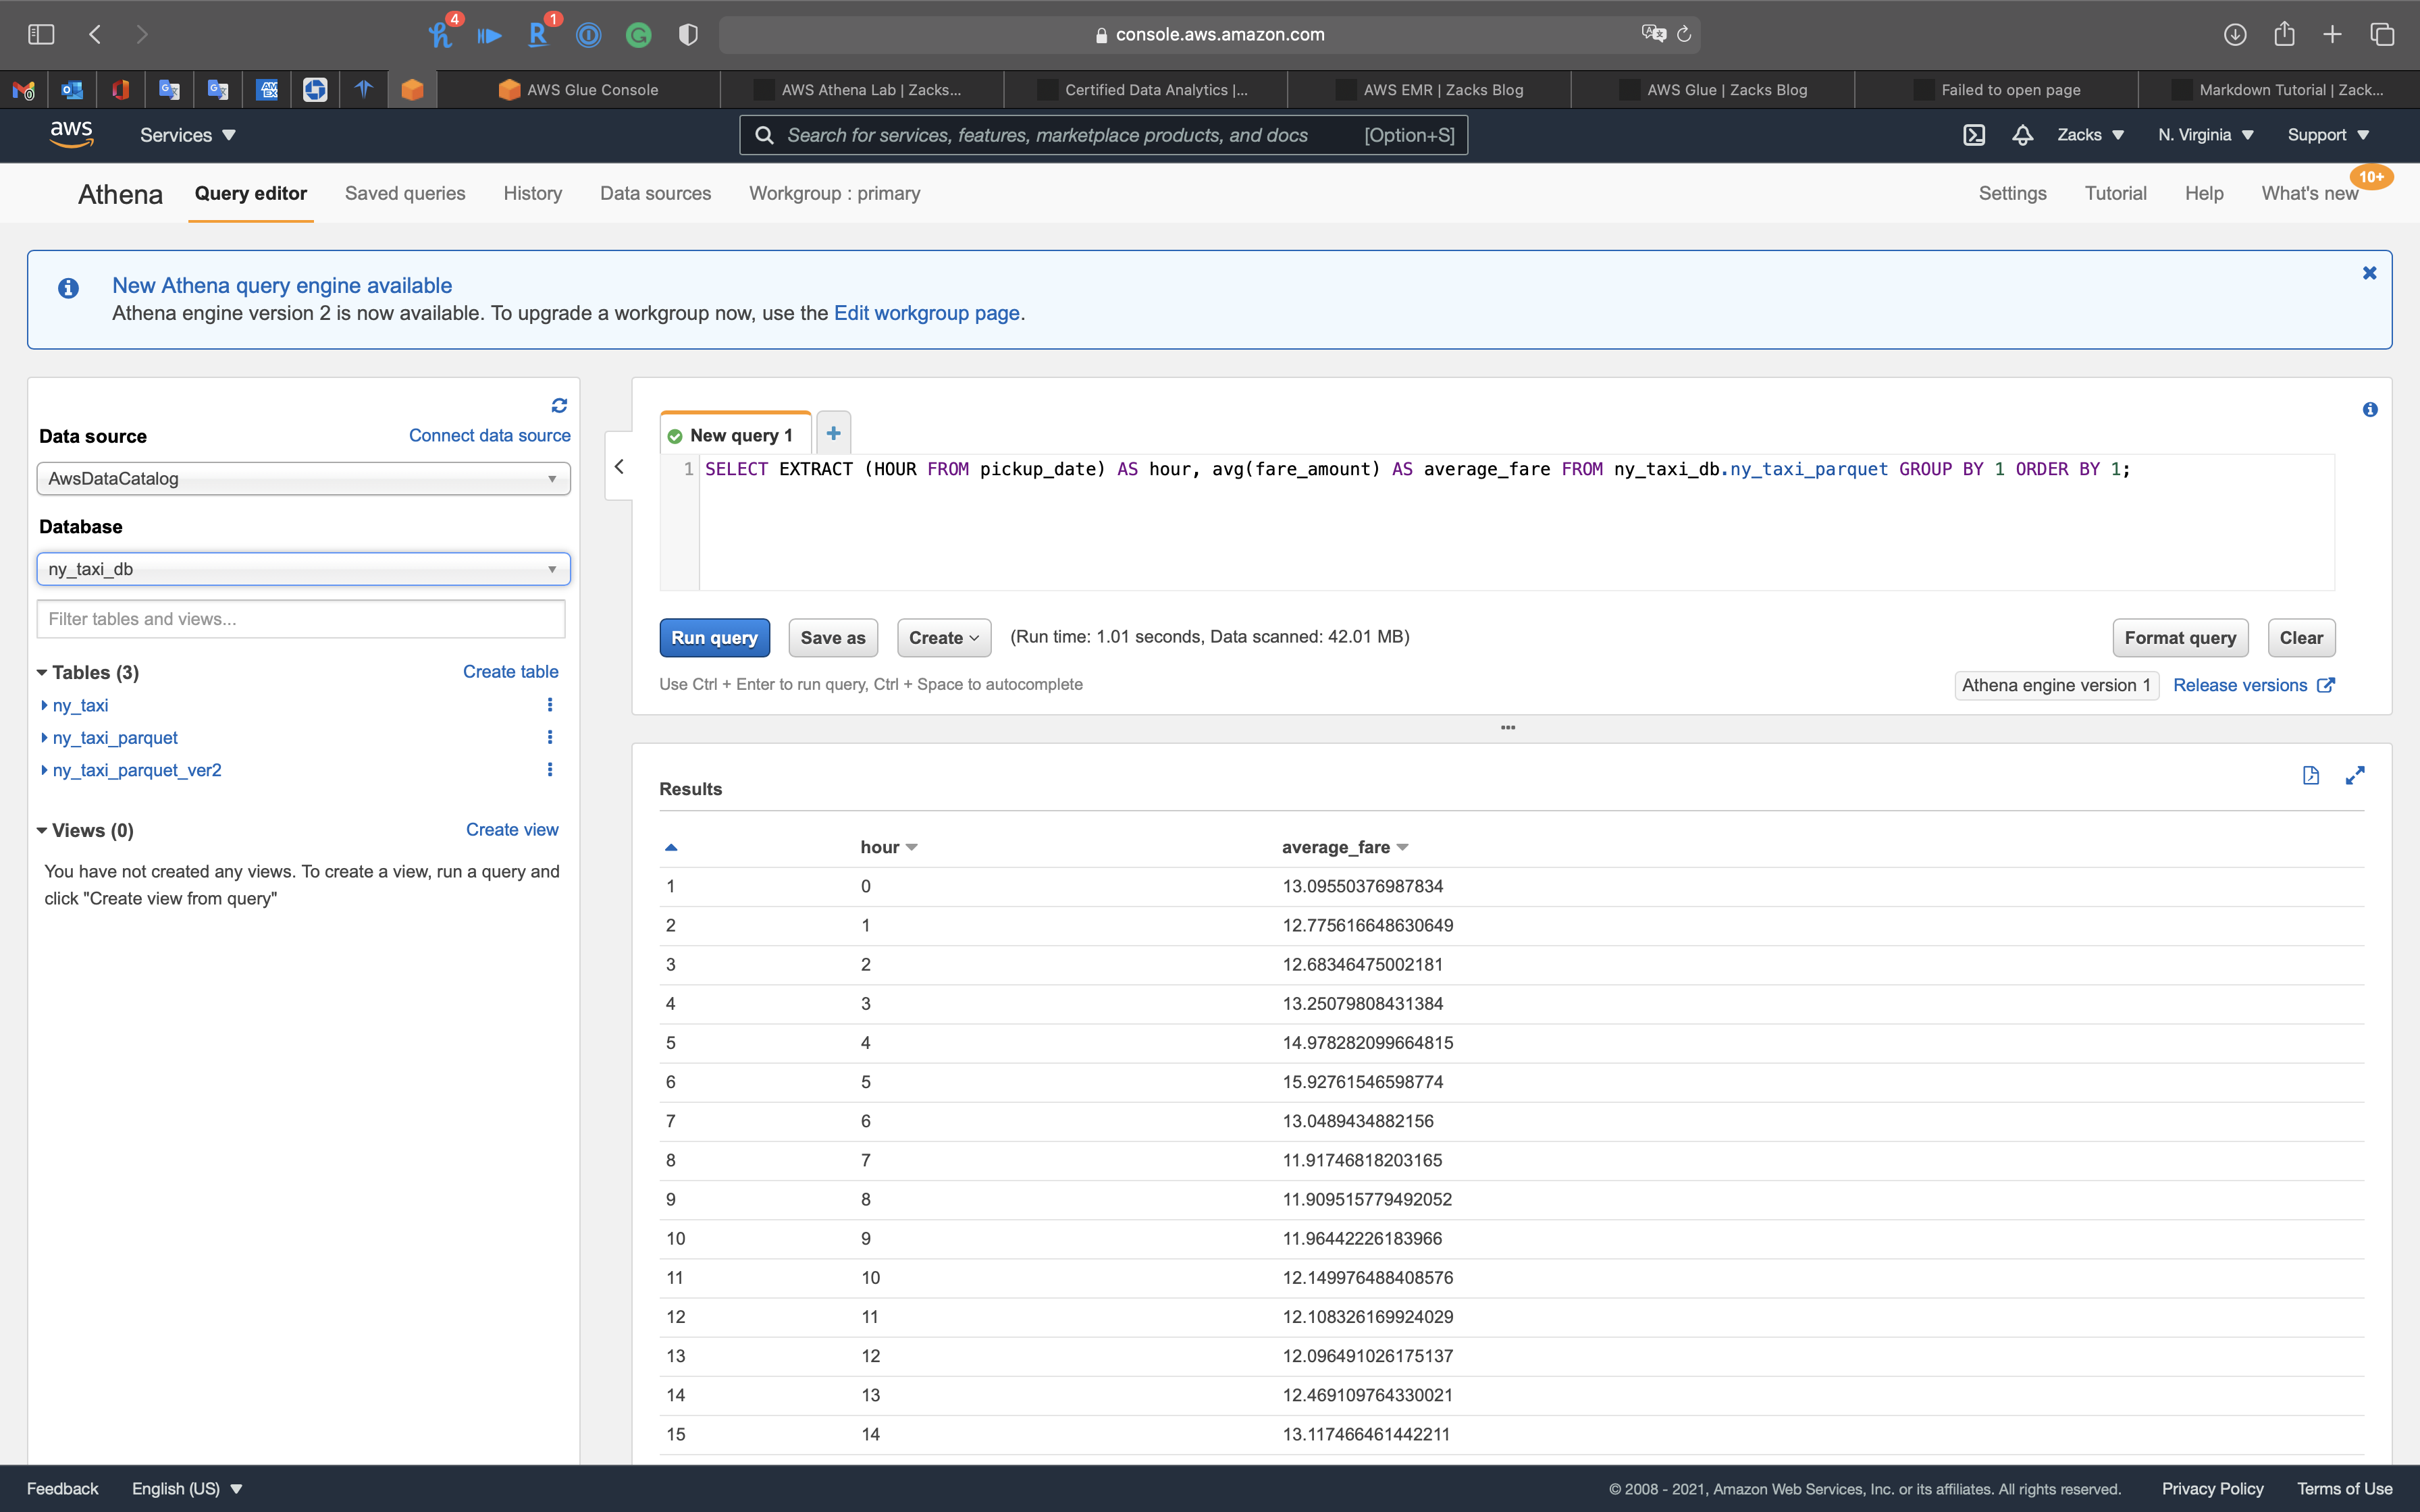
Query the tip percent category
1 | SELECT TipPrctCtgry |
Run time: 3.89s! It is much faster than m5.xlarge one core EMR cluster (14s) and m4.xlarge (25s).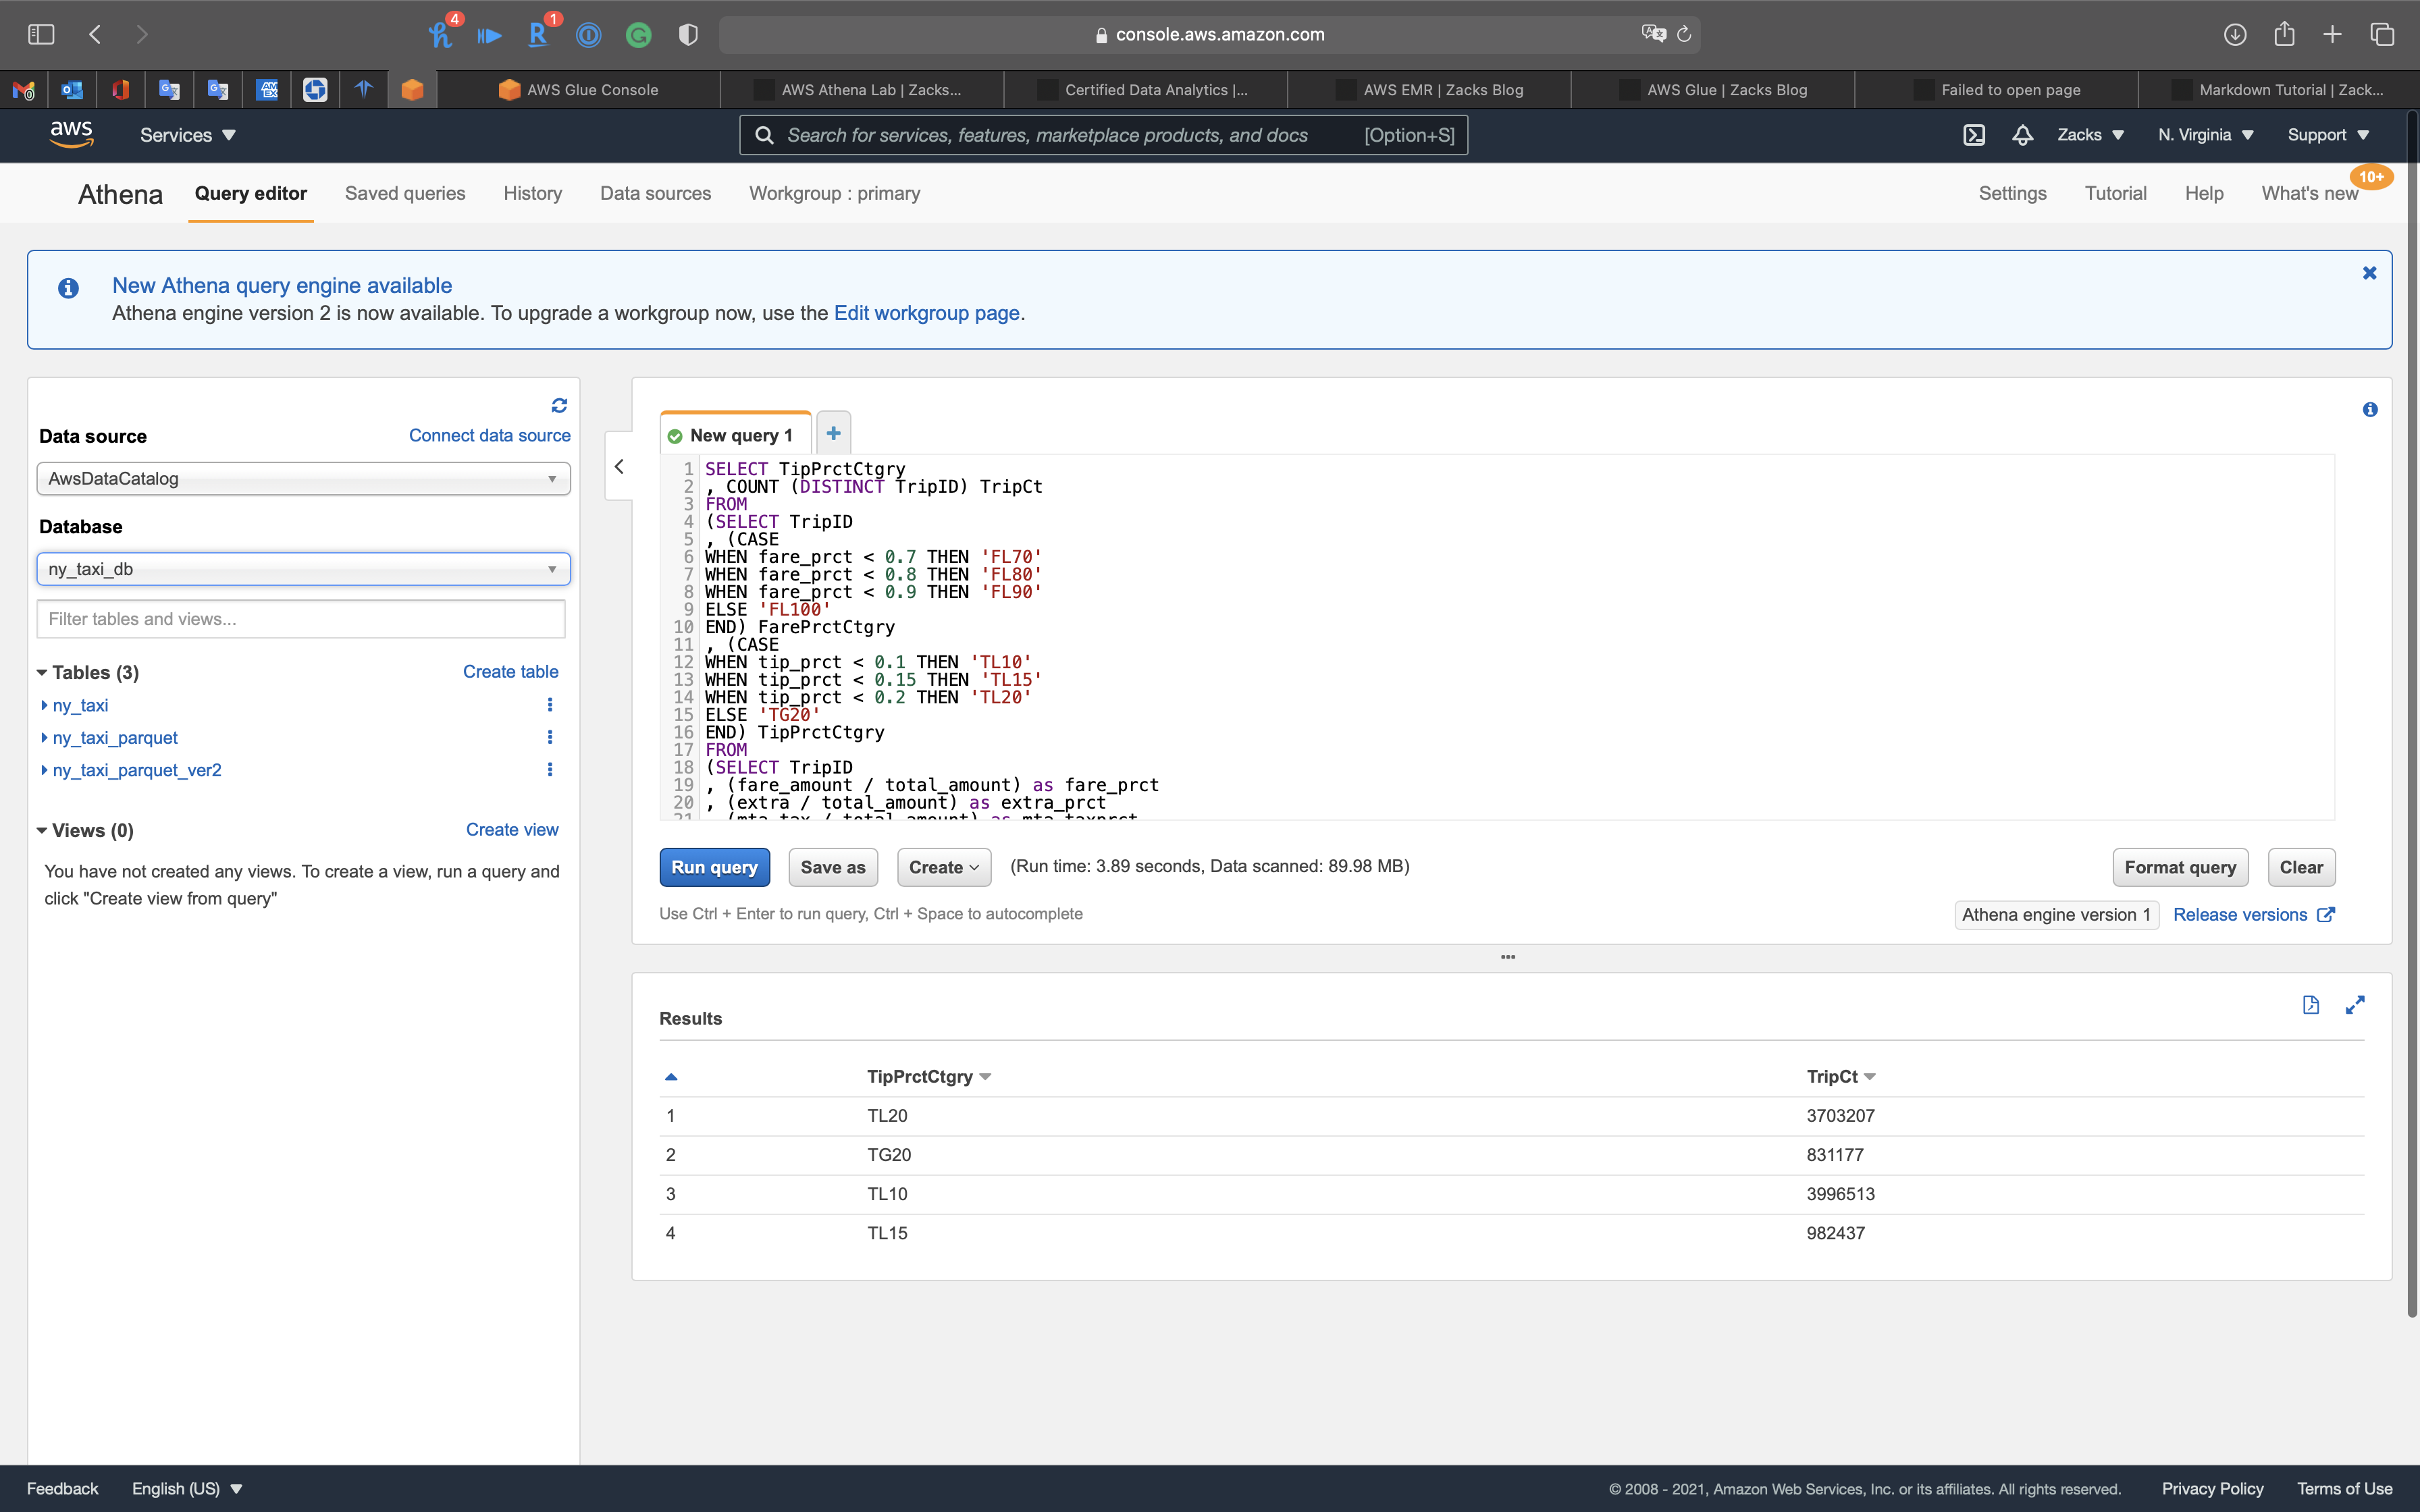
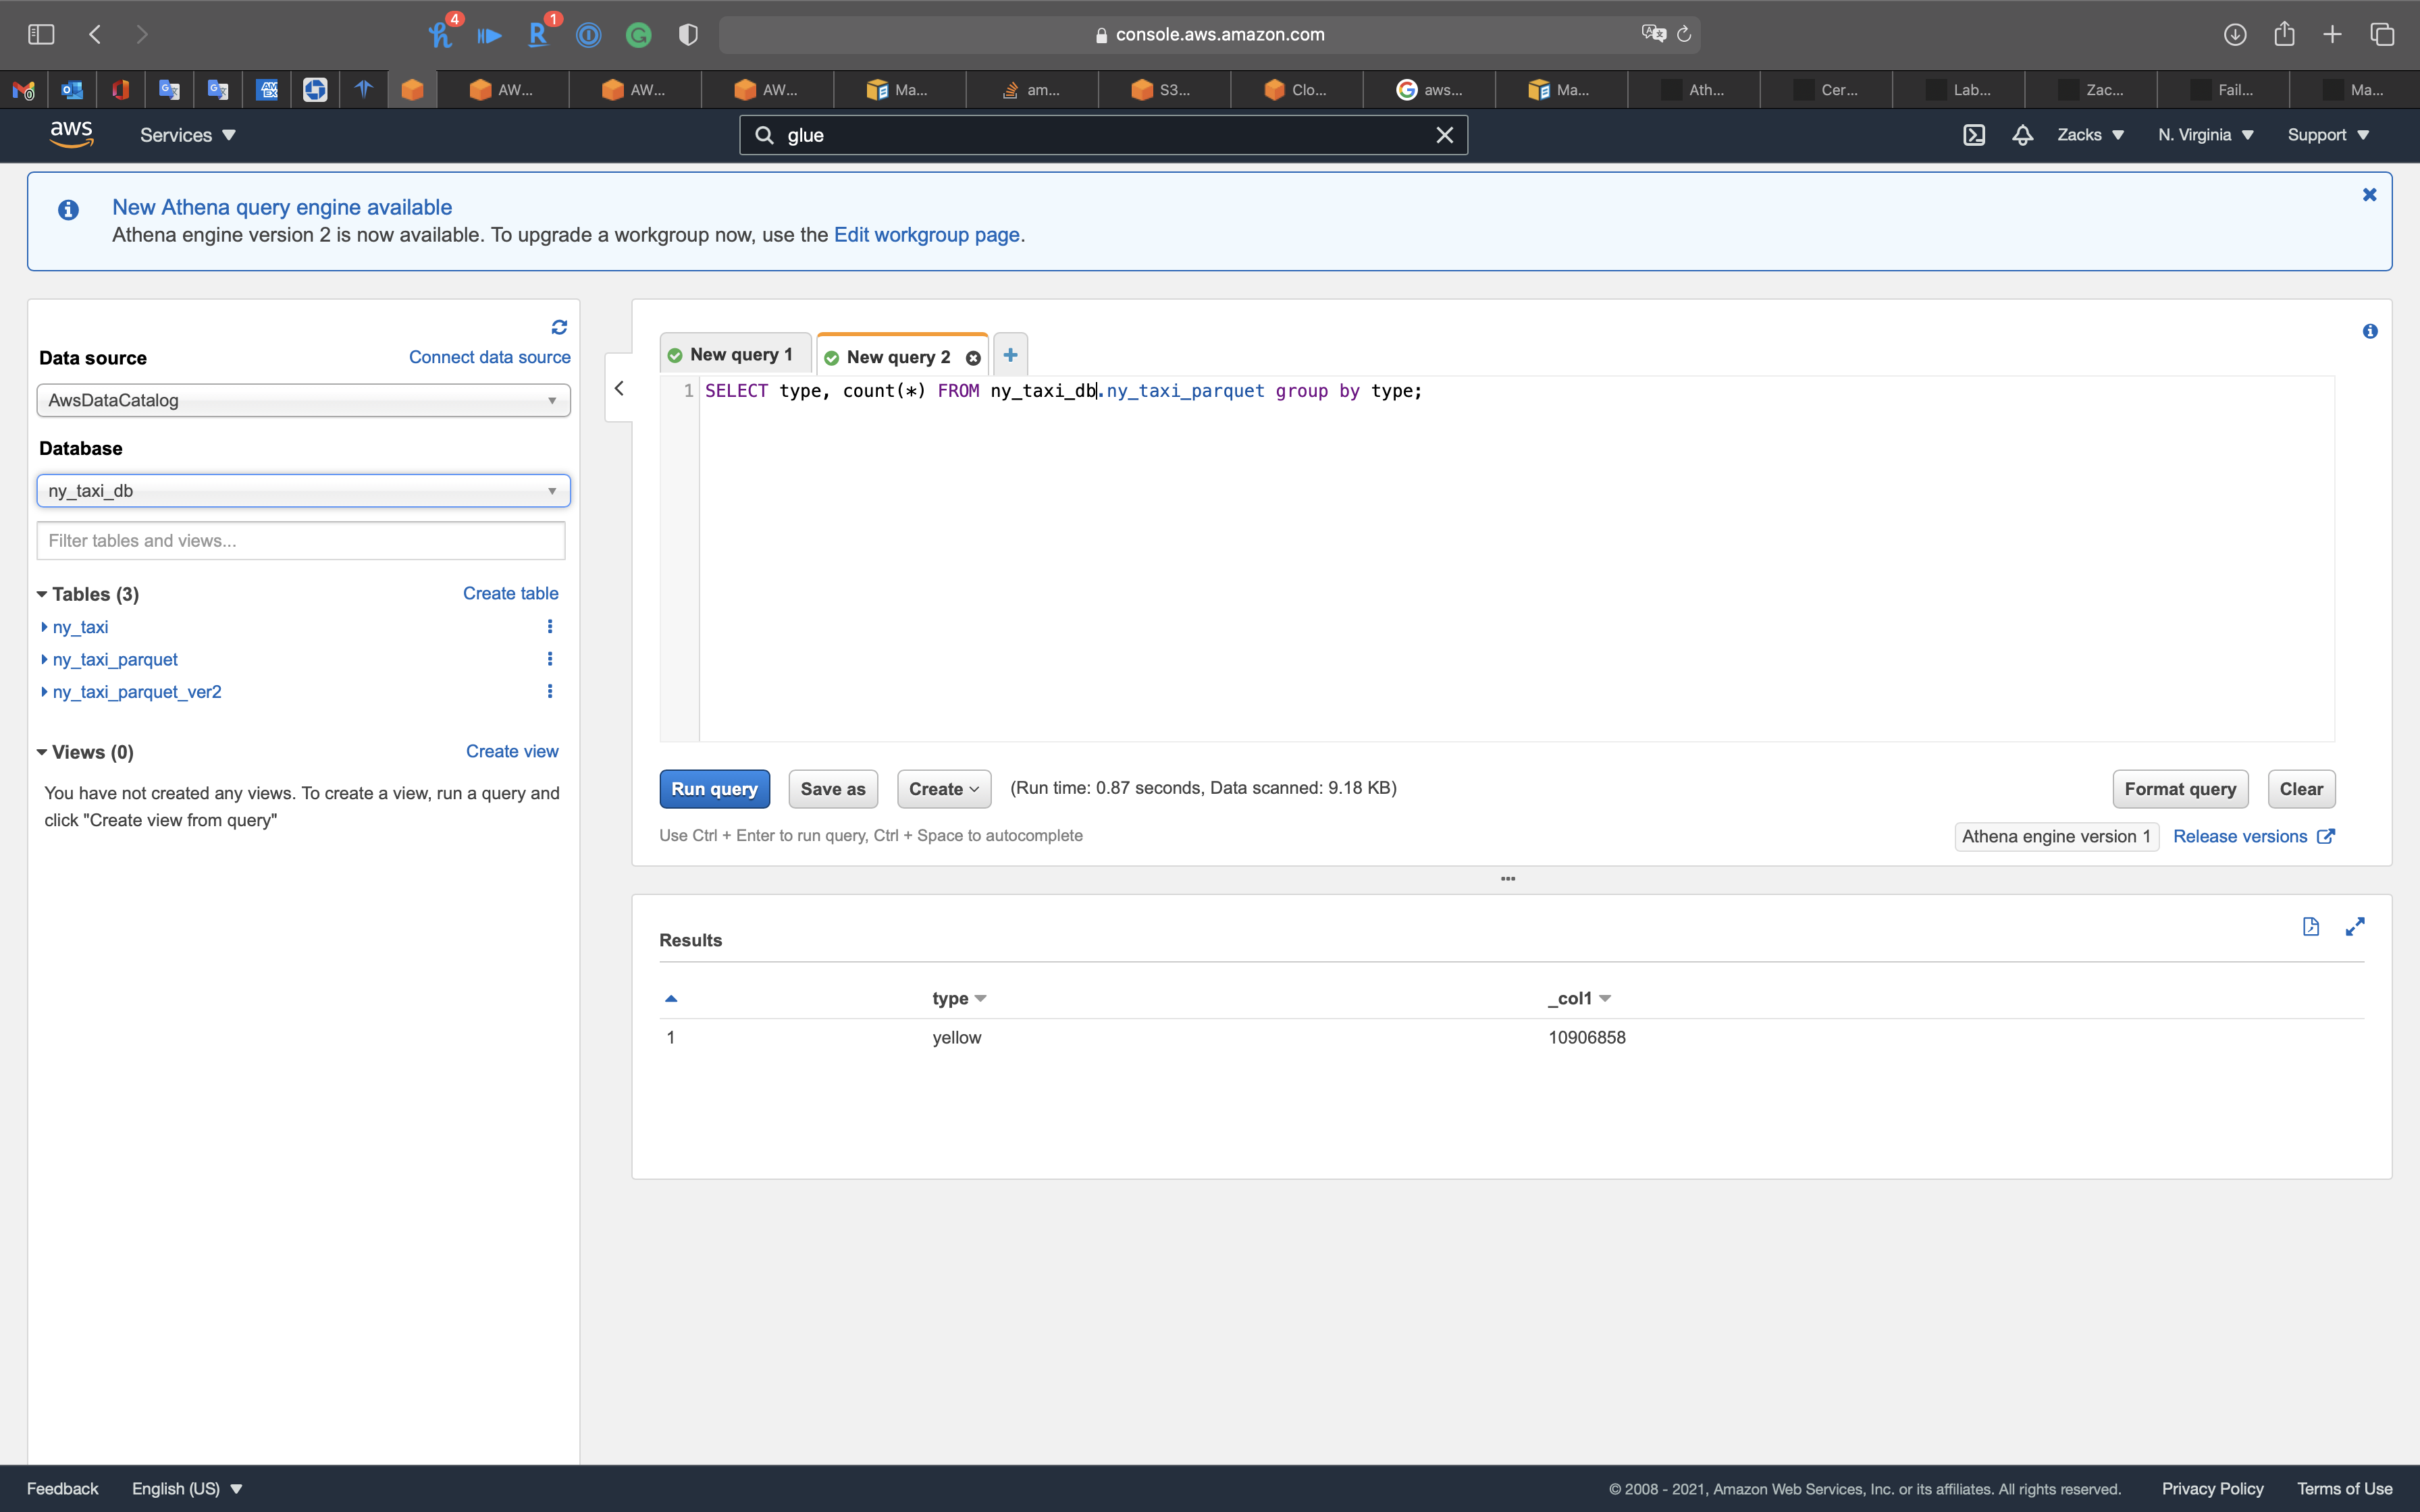
Count all rows in ny_taxi_parquet by type
1 | SELECT type, count(*) FROM ny_taxi_db.ny_taxi_parquet group by type; |
Get the max and min distances
1 | SELECT min(trip_distance) as minDistance, |
Seems like the data source contains some wired data.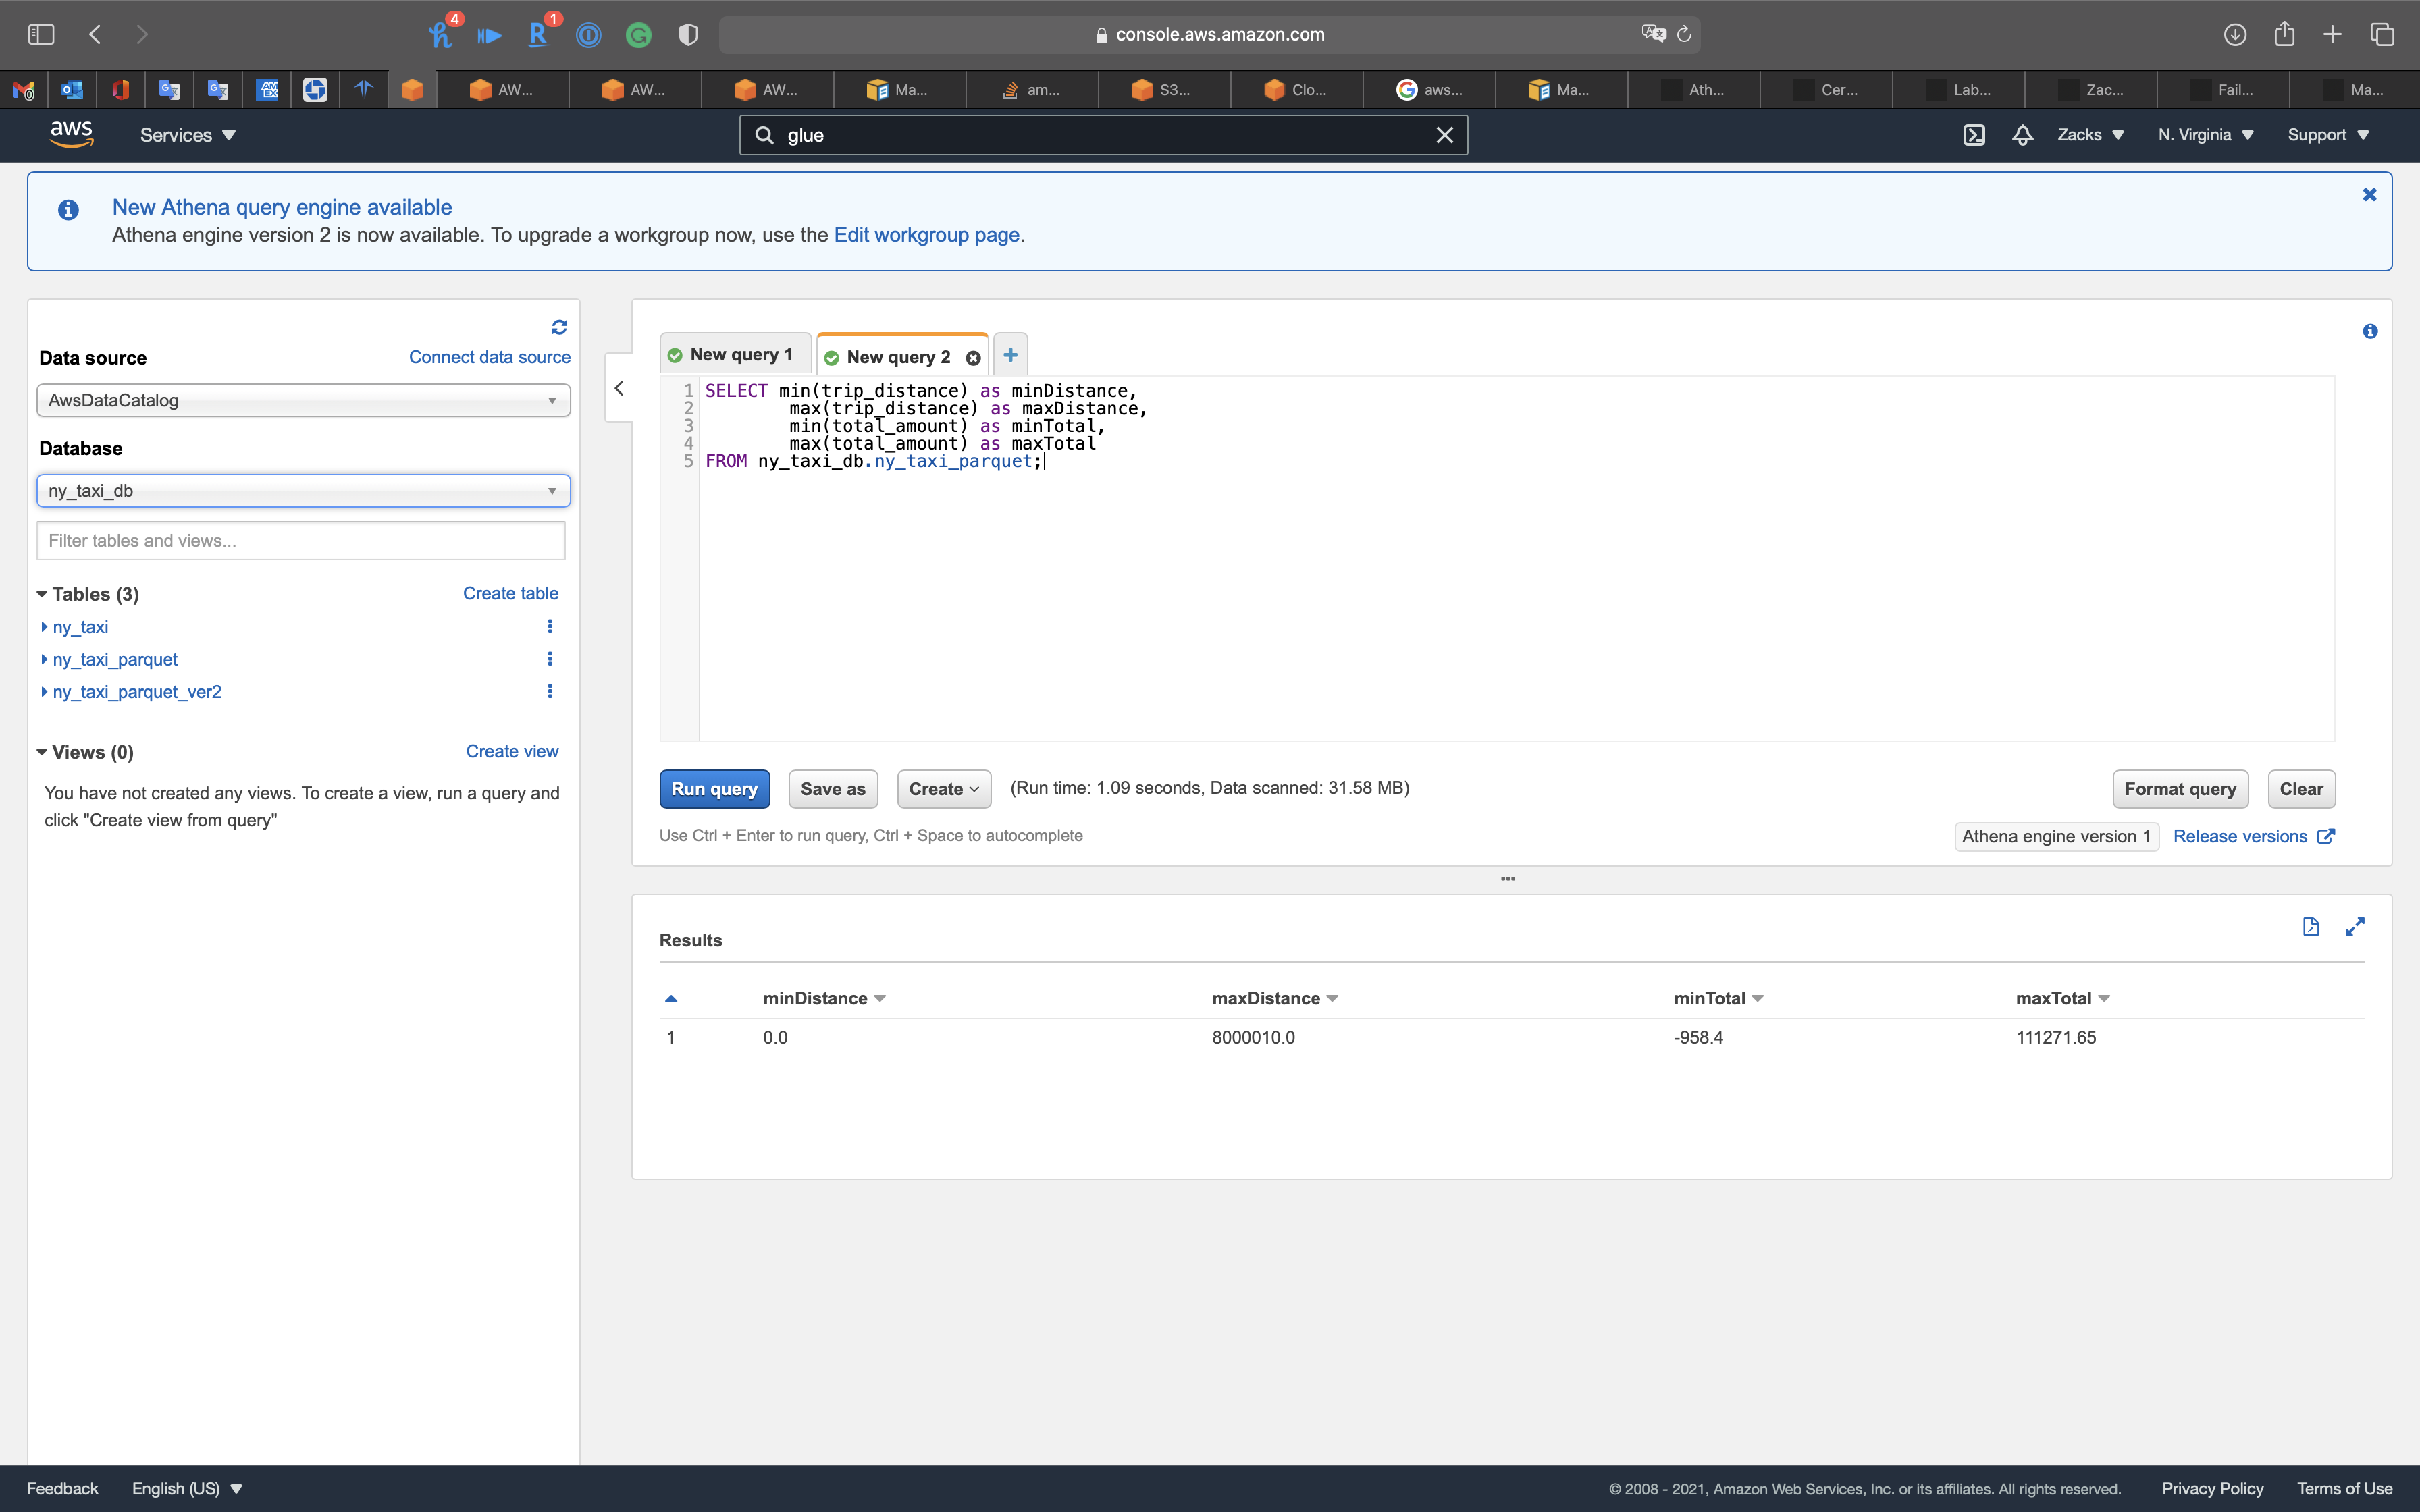
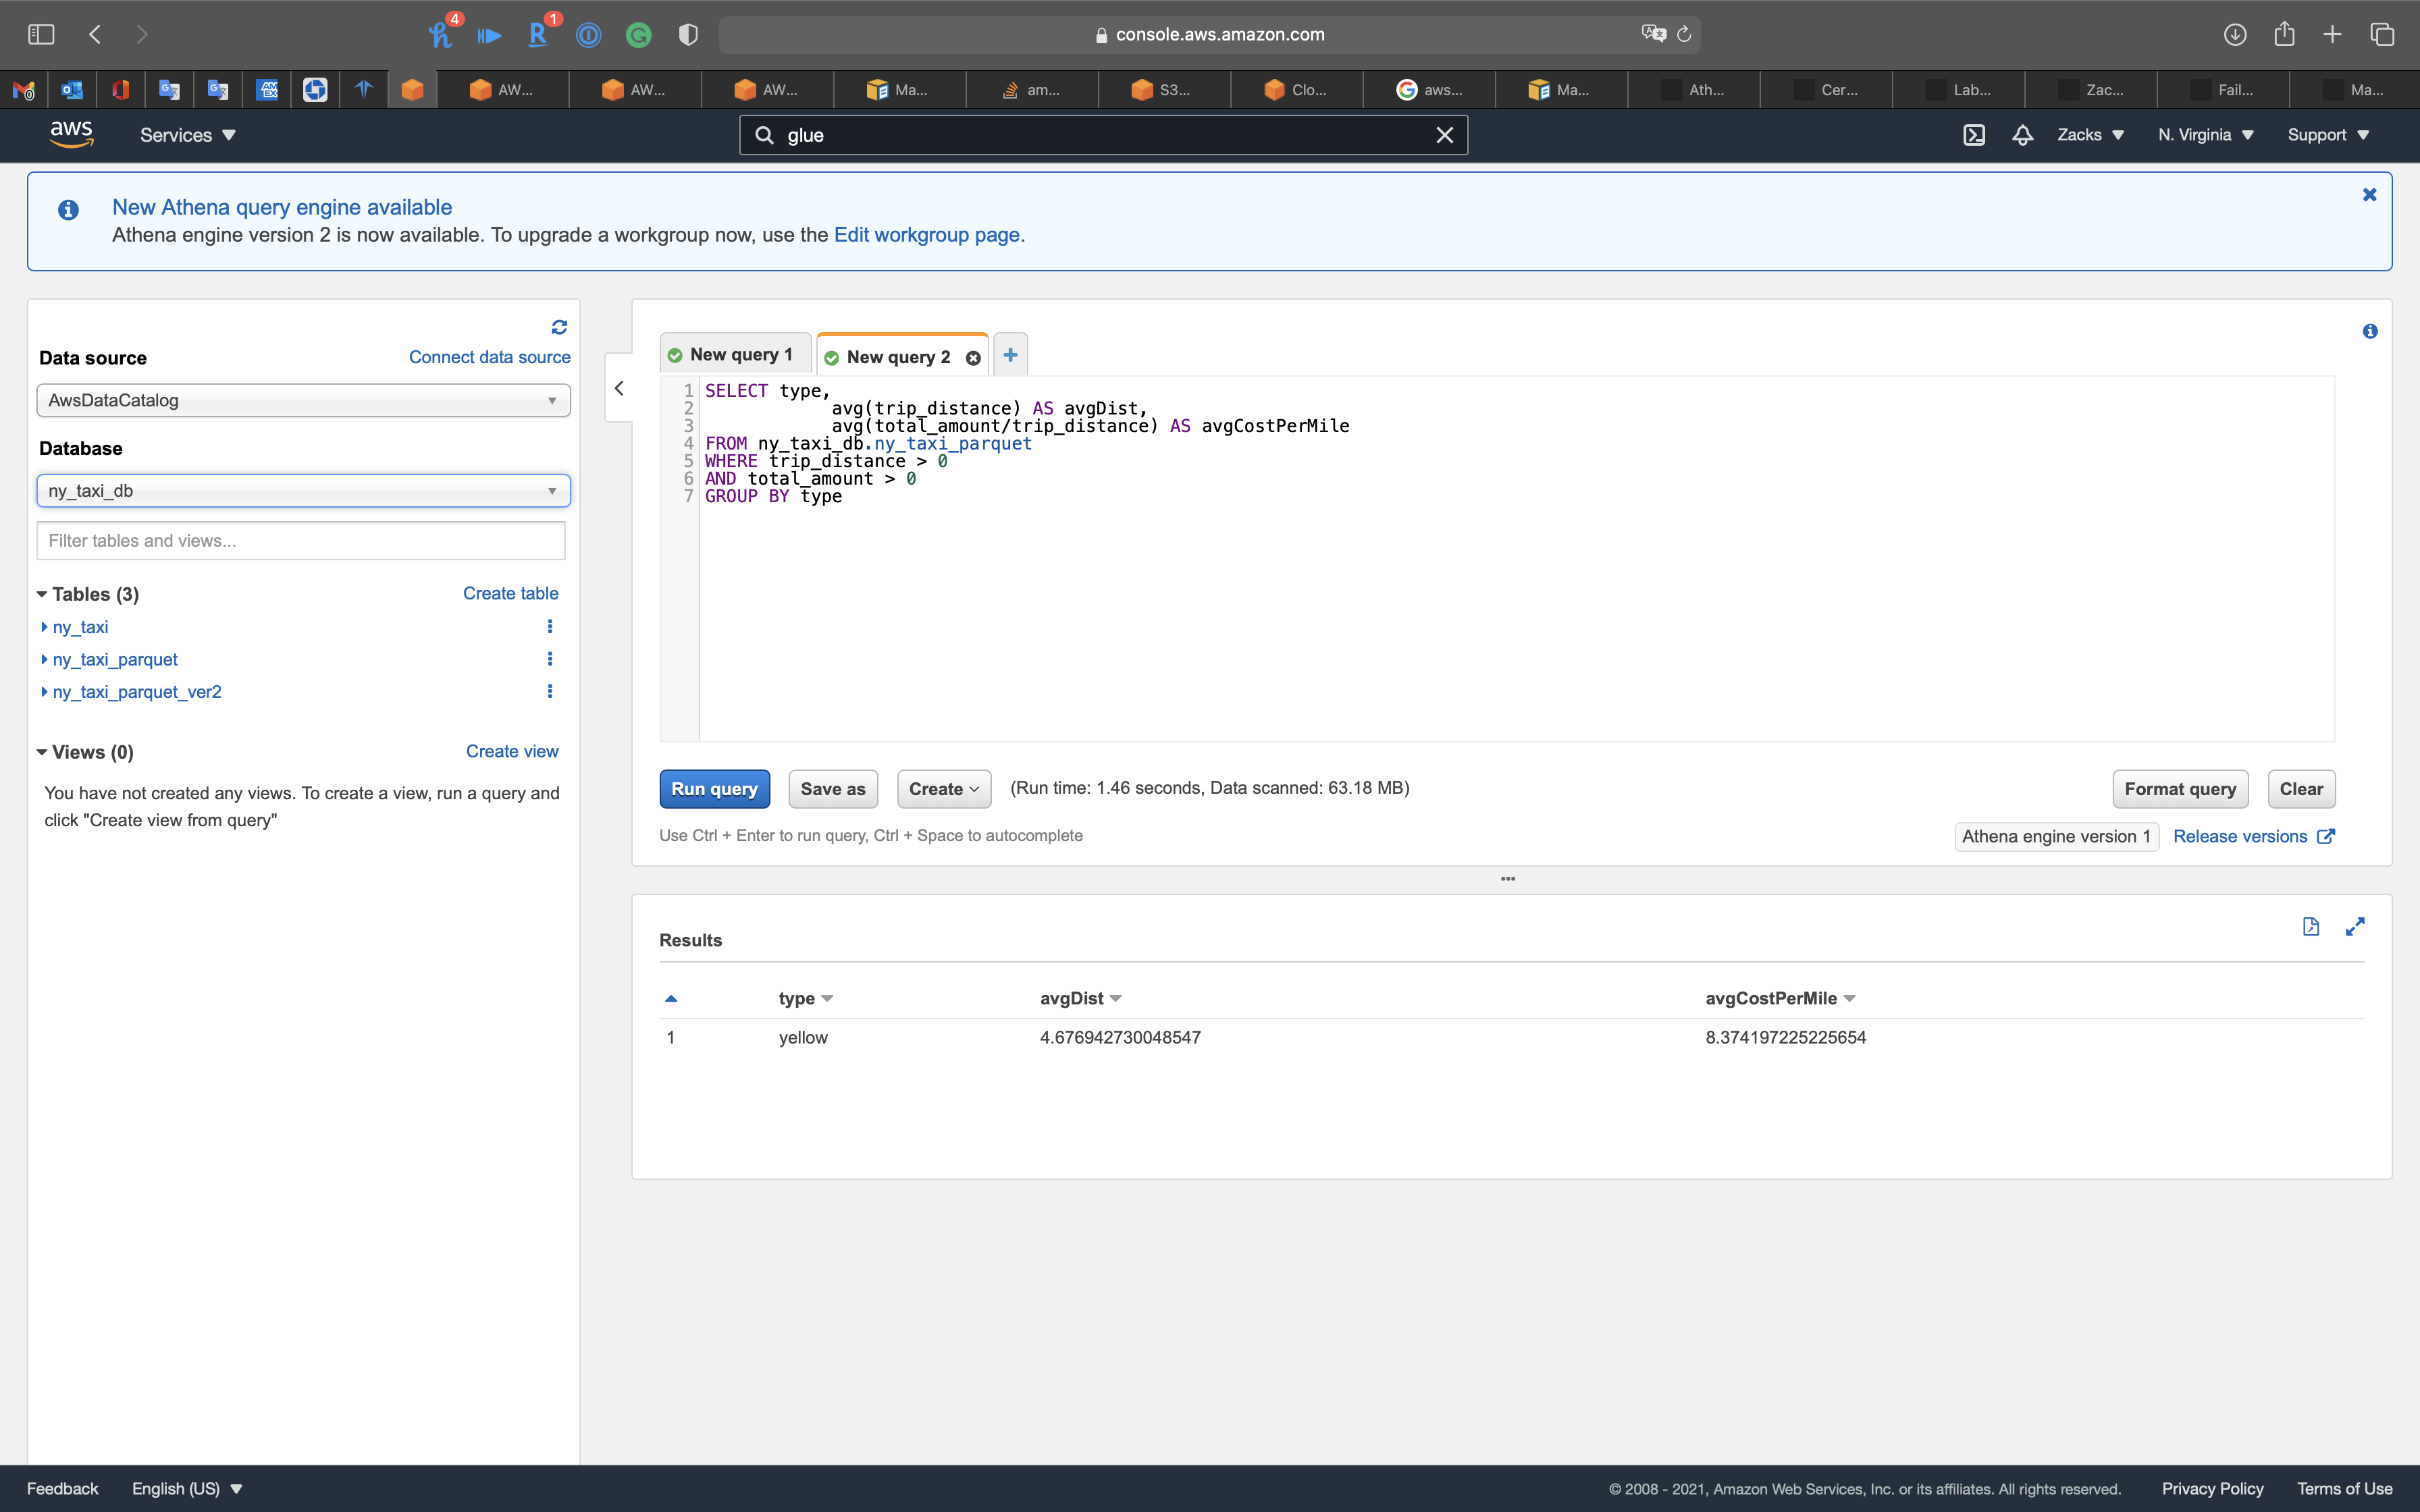
Get the average distance and average cost per mile
1 | SELECT type, |
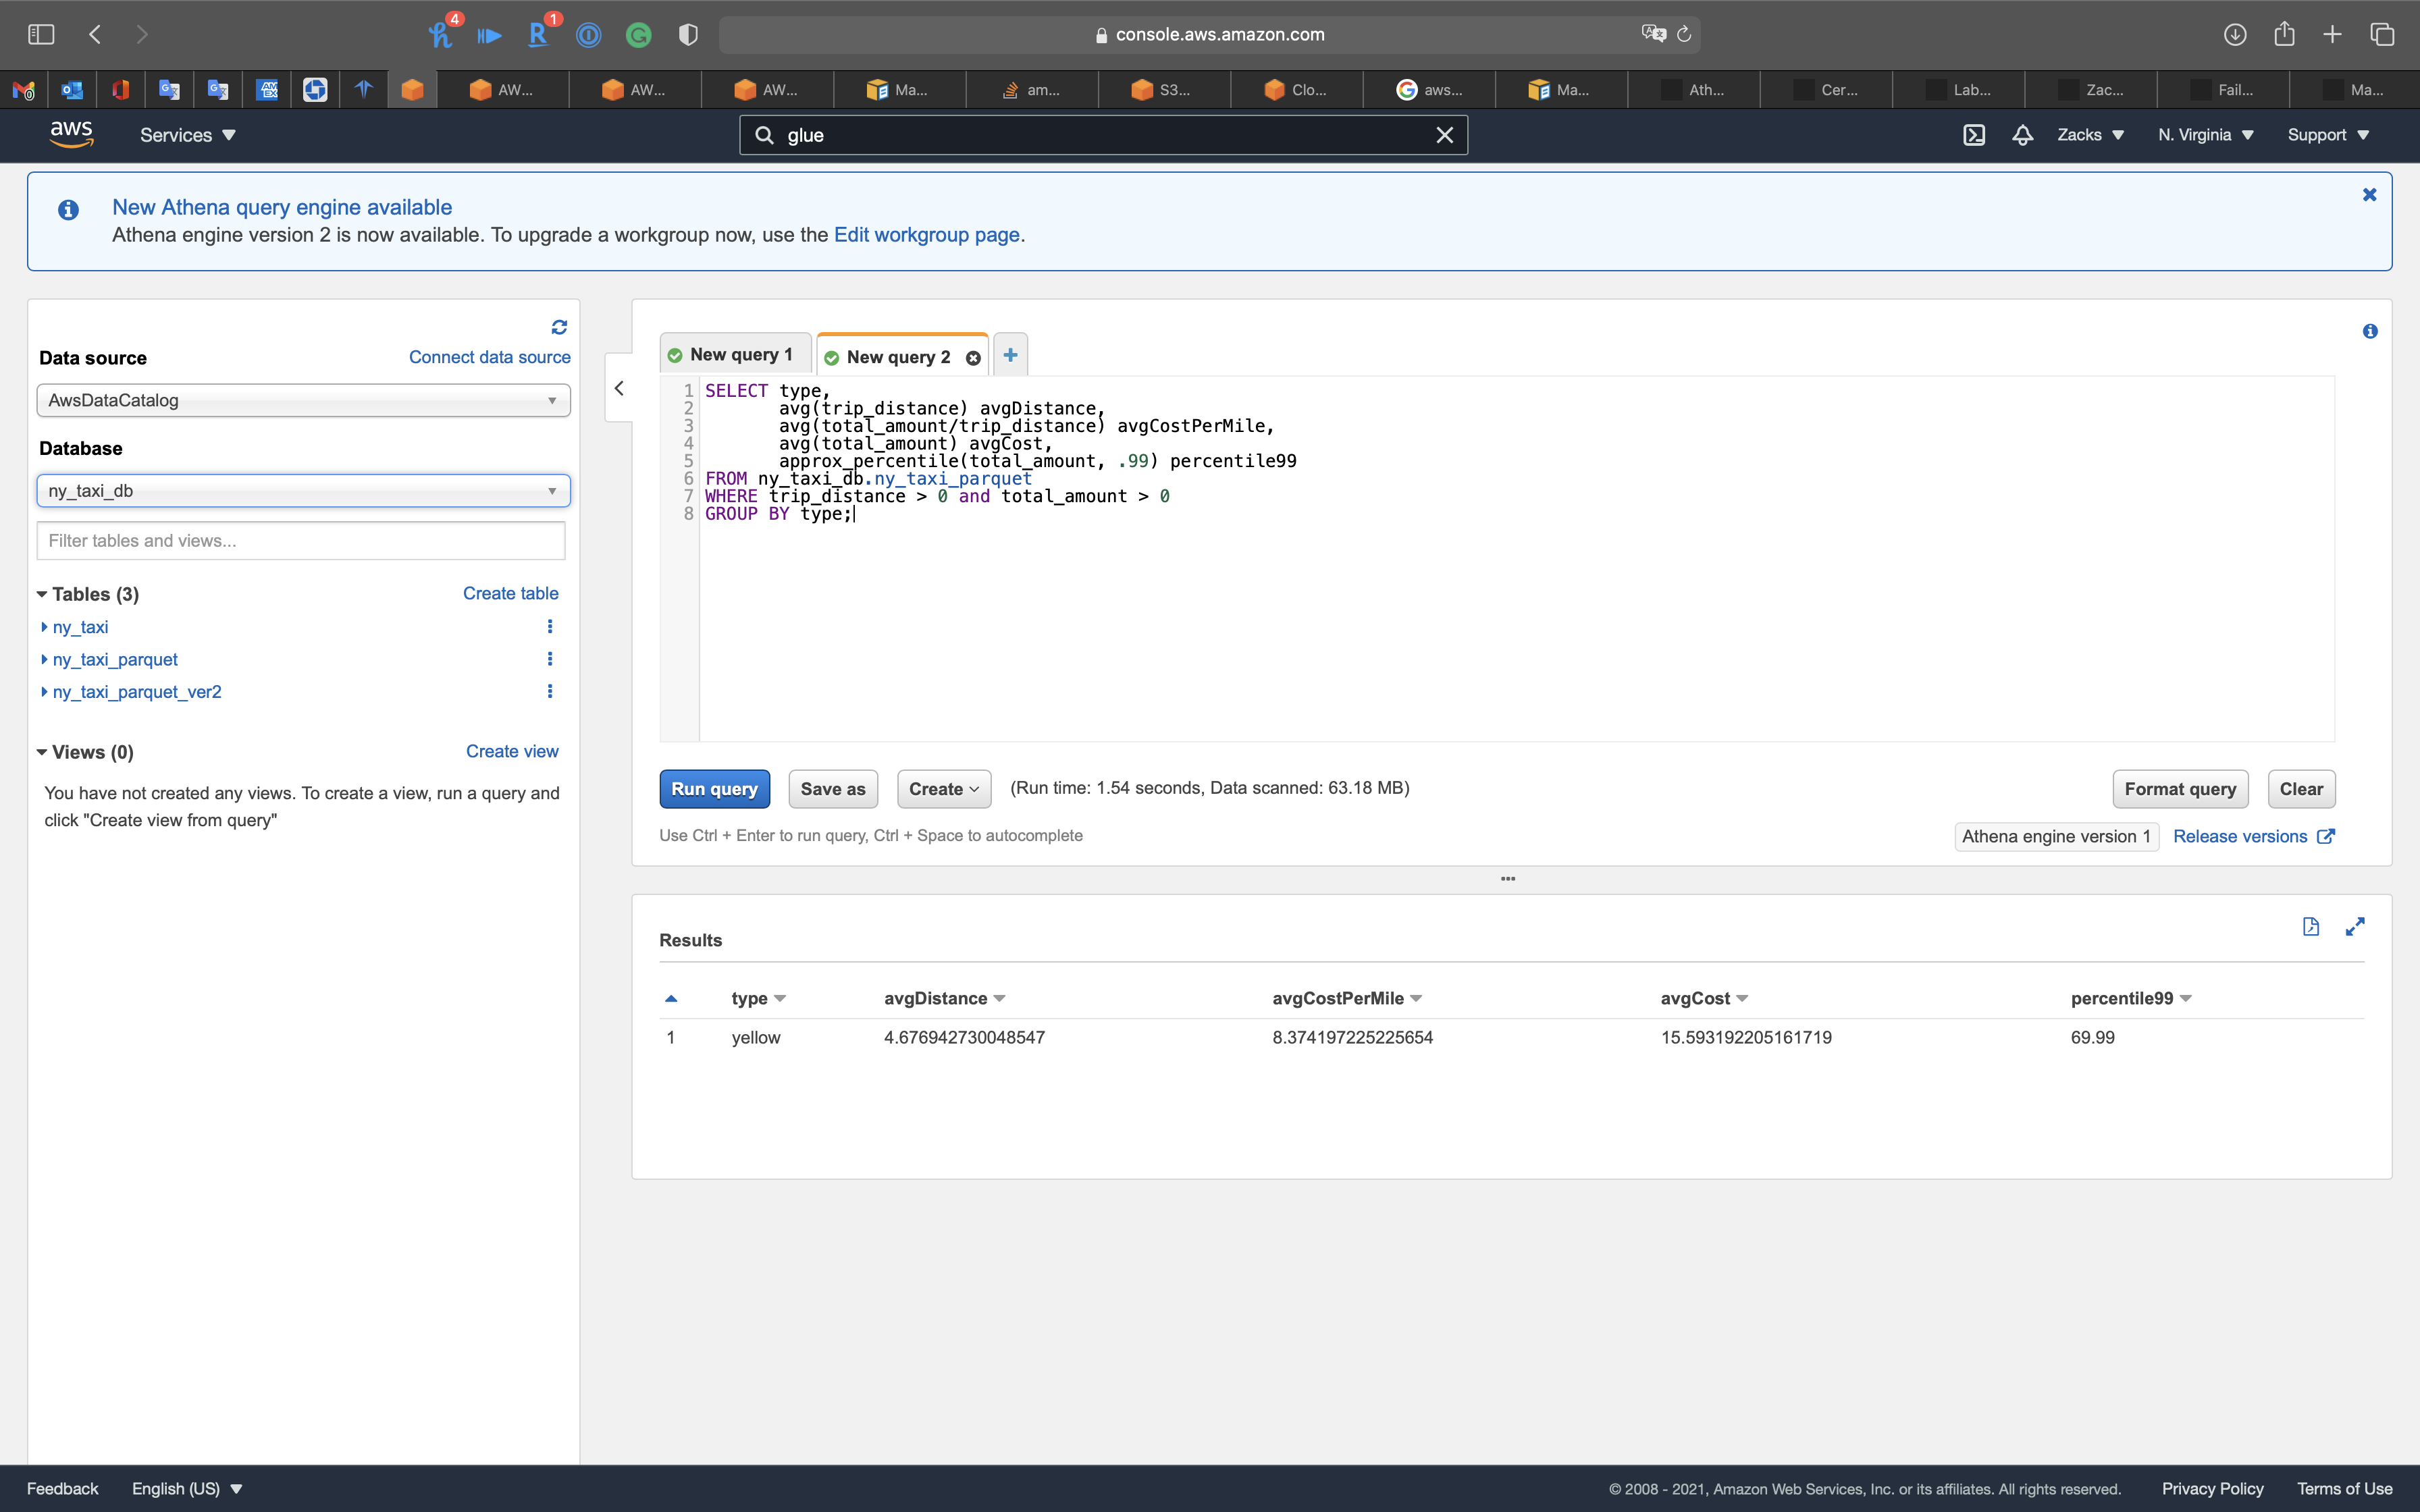
Get average distance and percentile
1 | SELECT type, |
QuickSight Configuration
Services -> QuickSight
Connect to Athena
Click on Datasets on navigation panel
Click on New dataset on the right and top page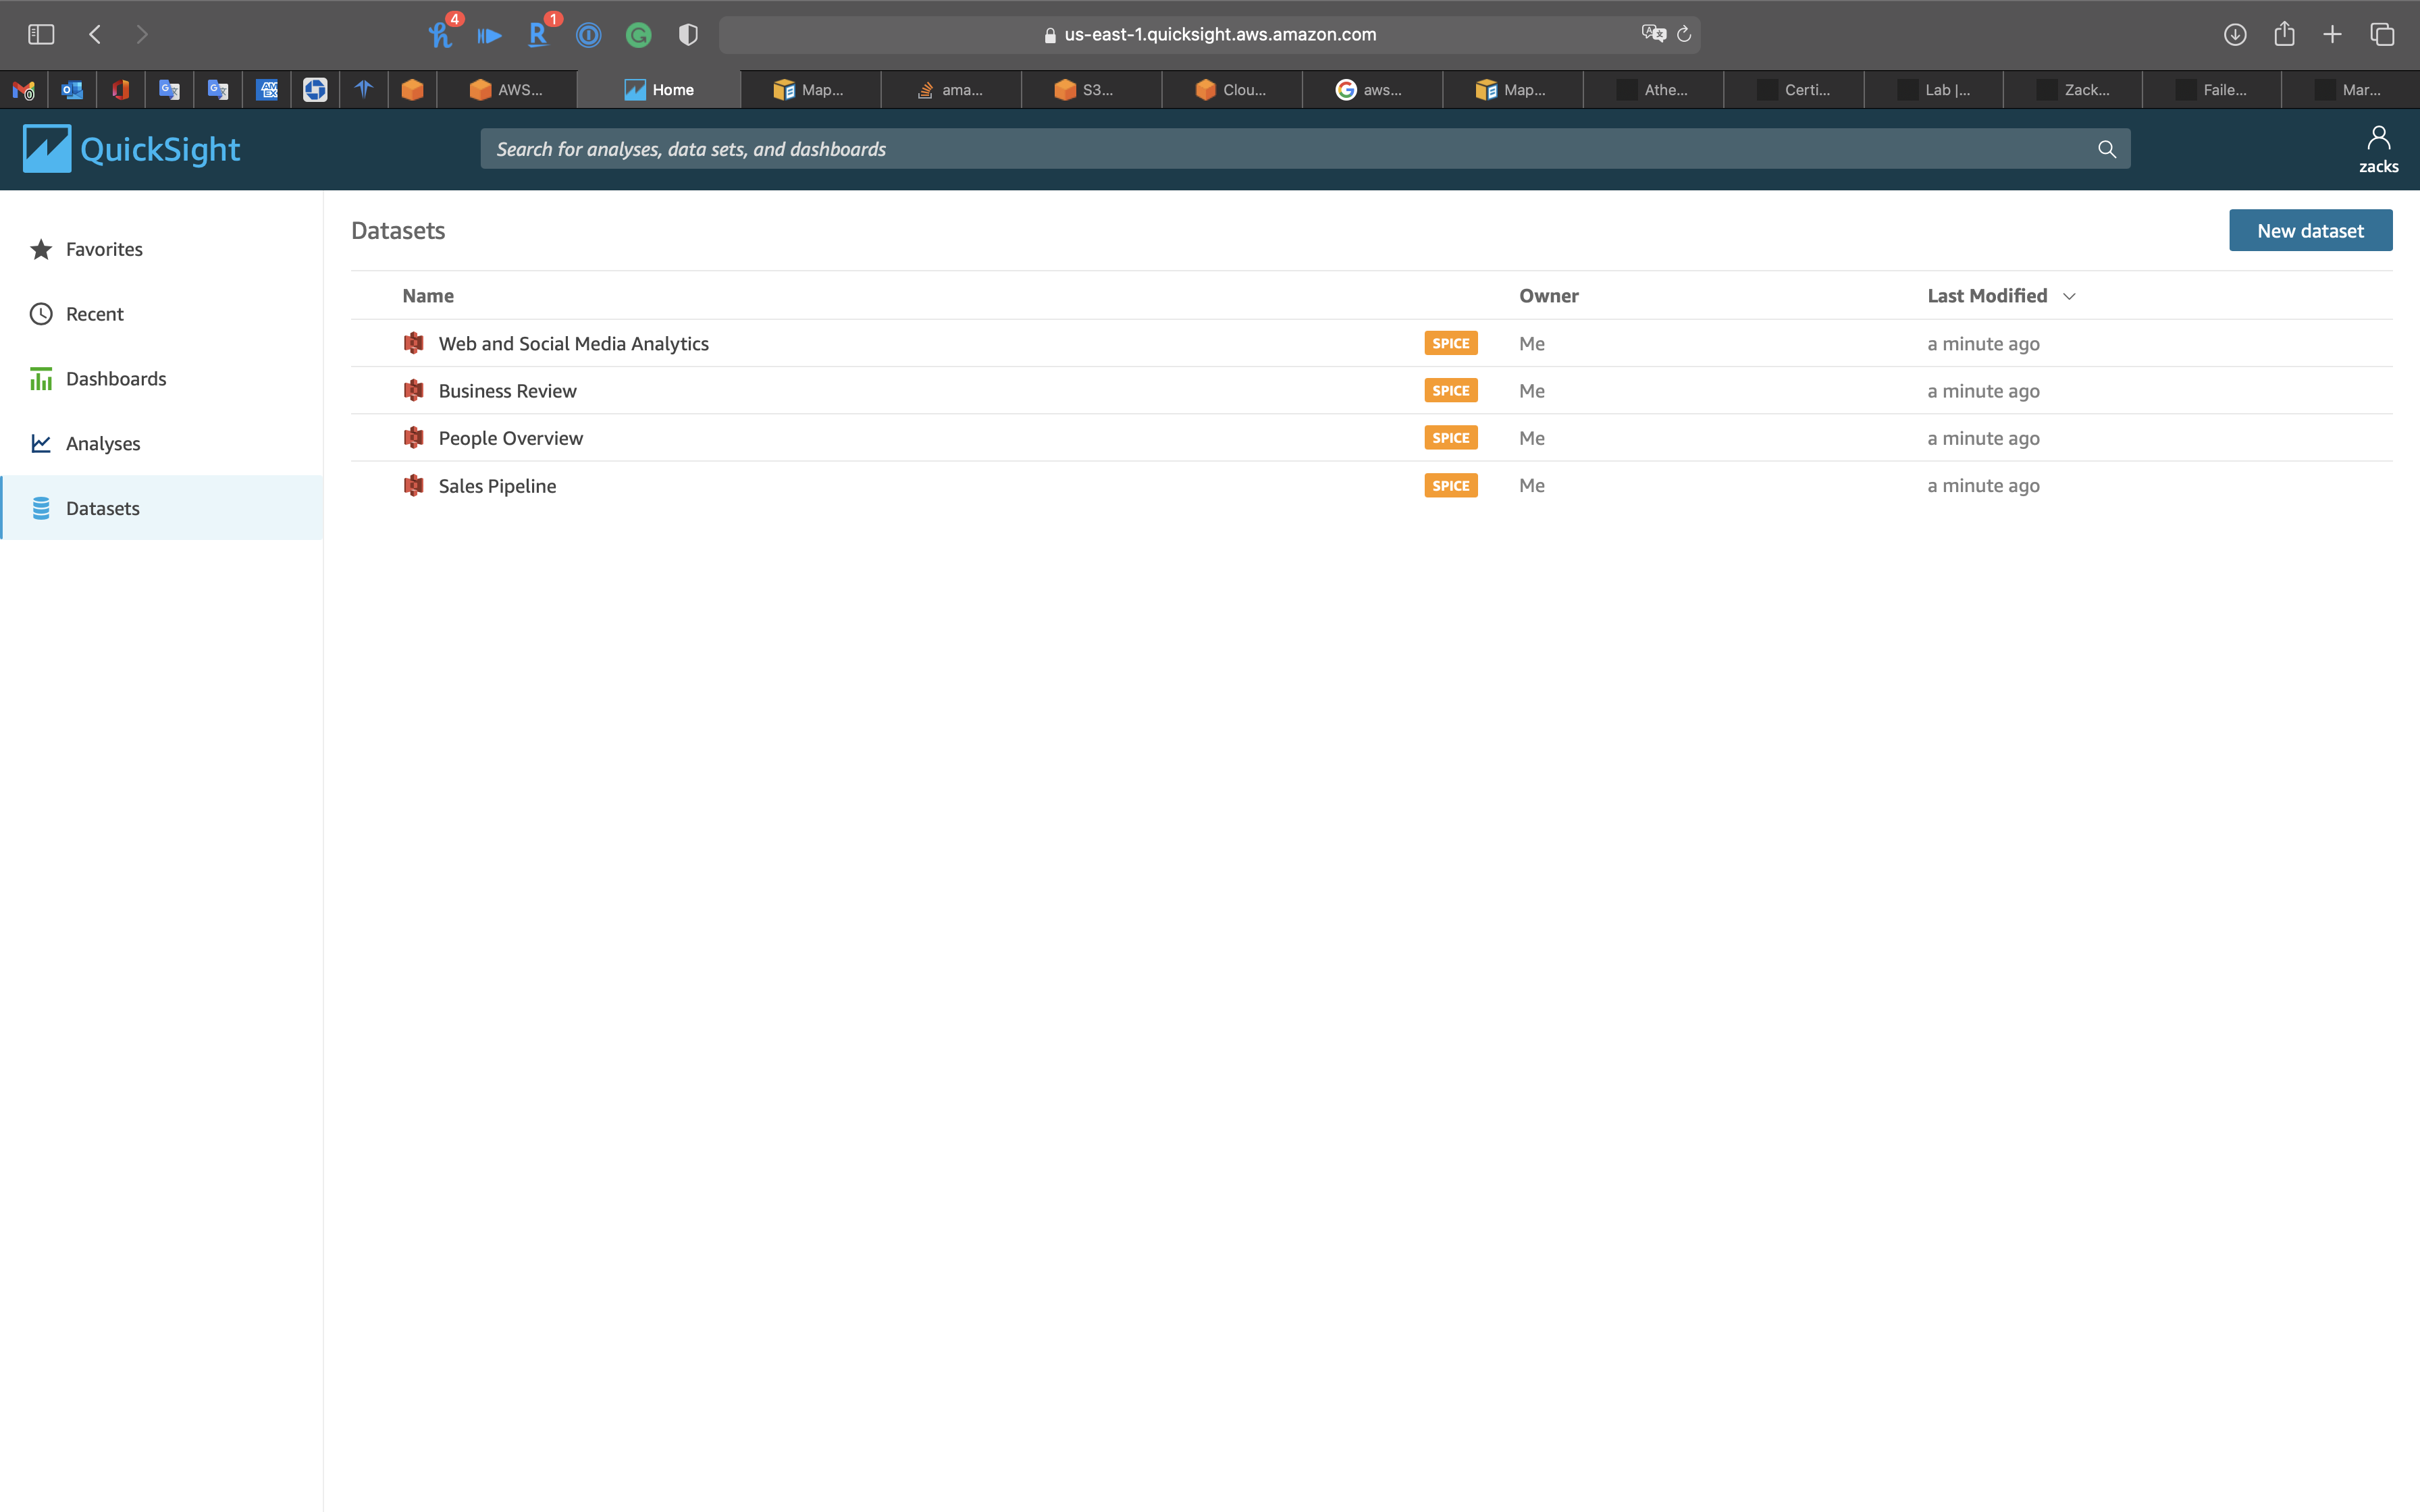
Click on Athena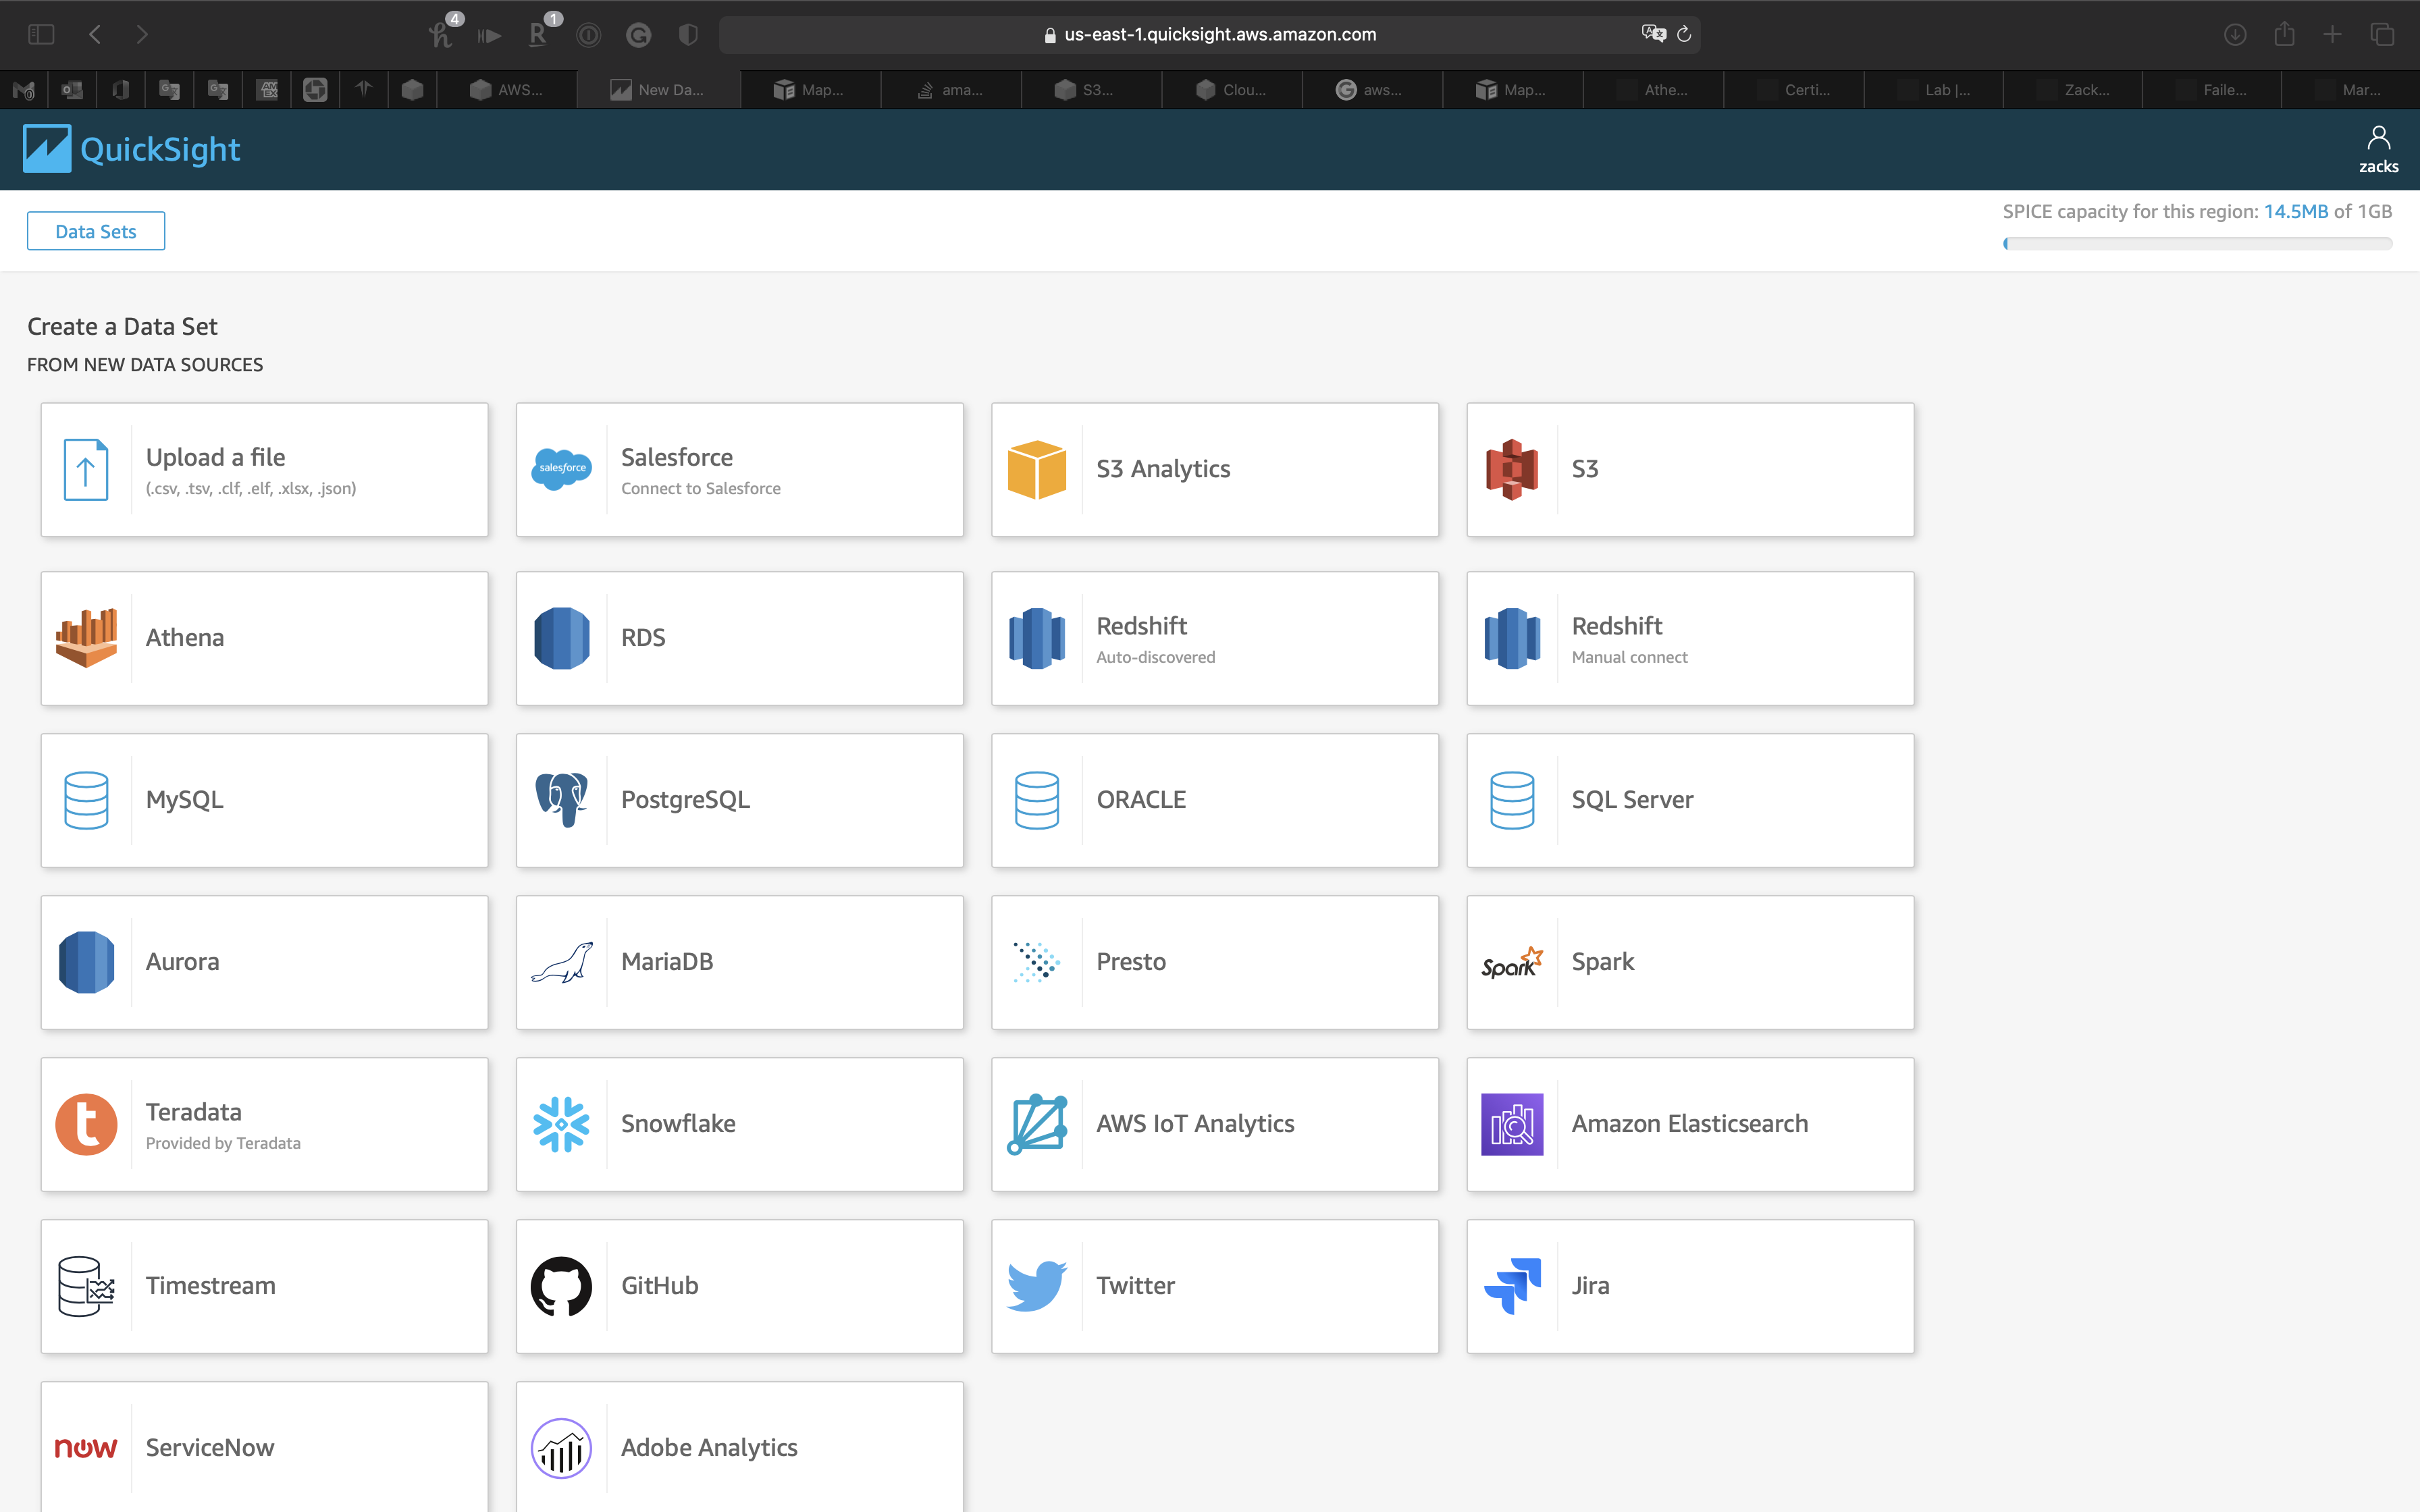
- Data source name:
NYC Taxi Parquet
Click on Validate connection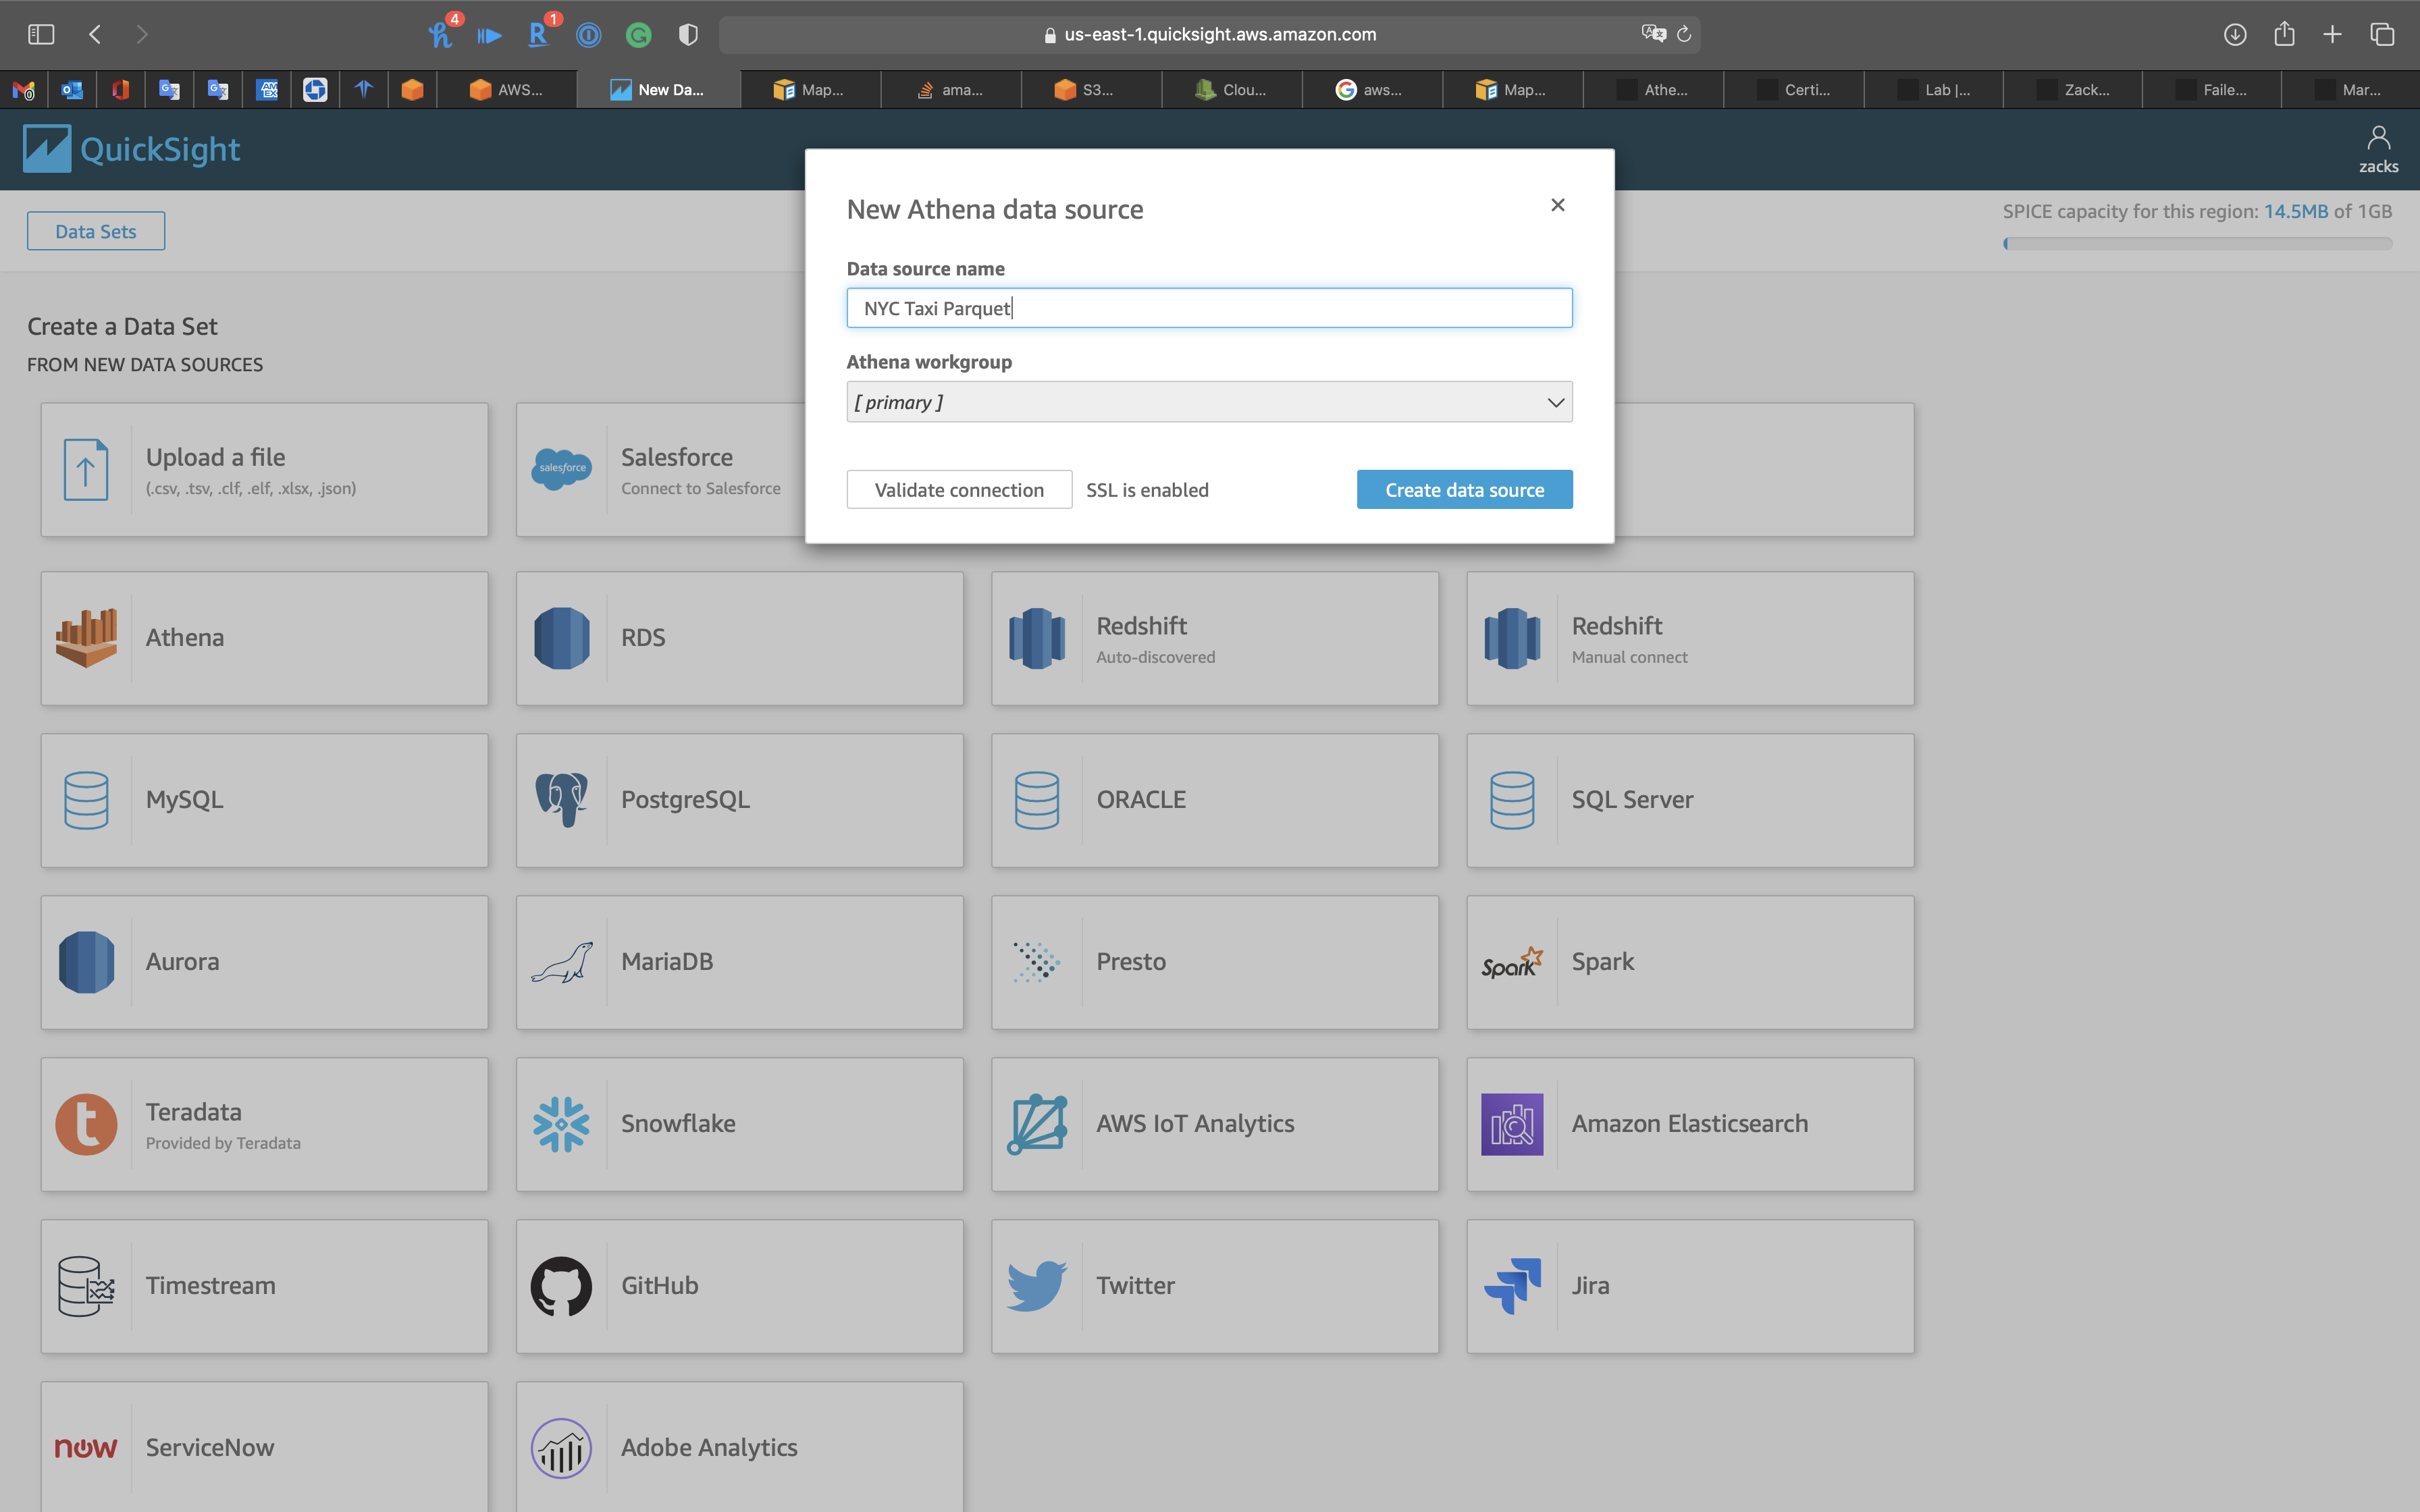
Click on Create data source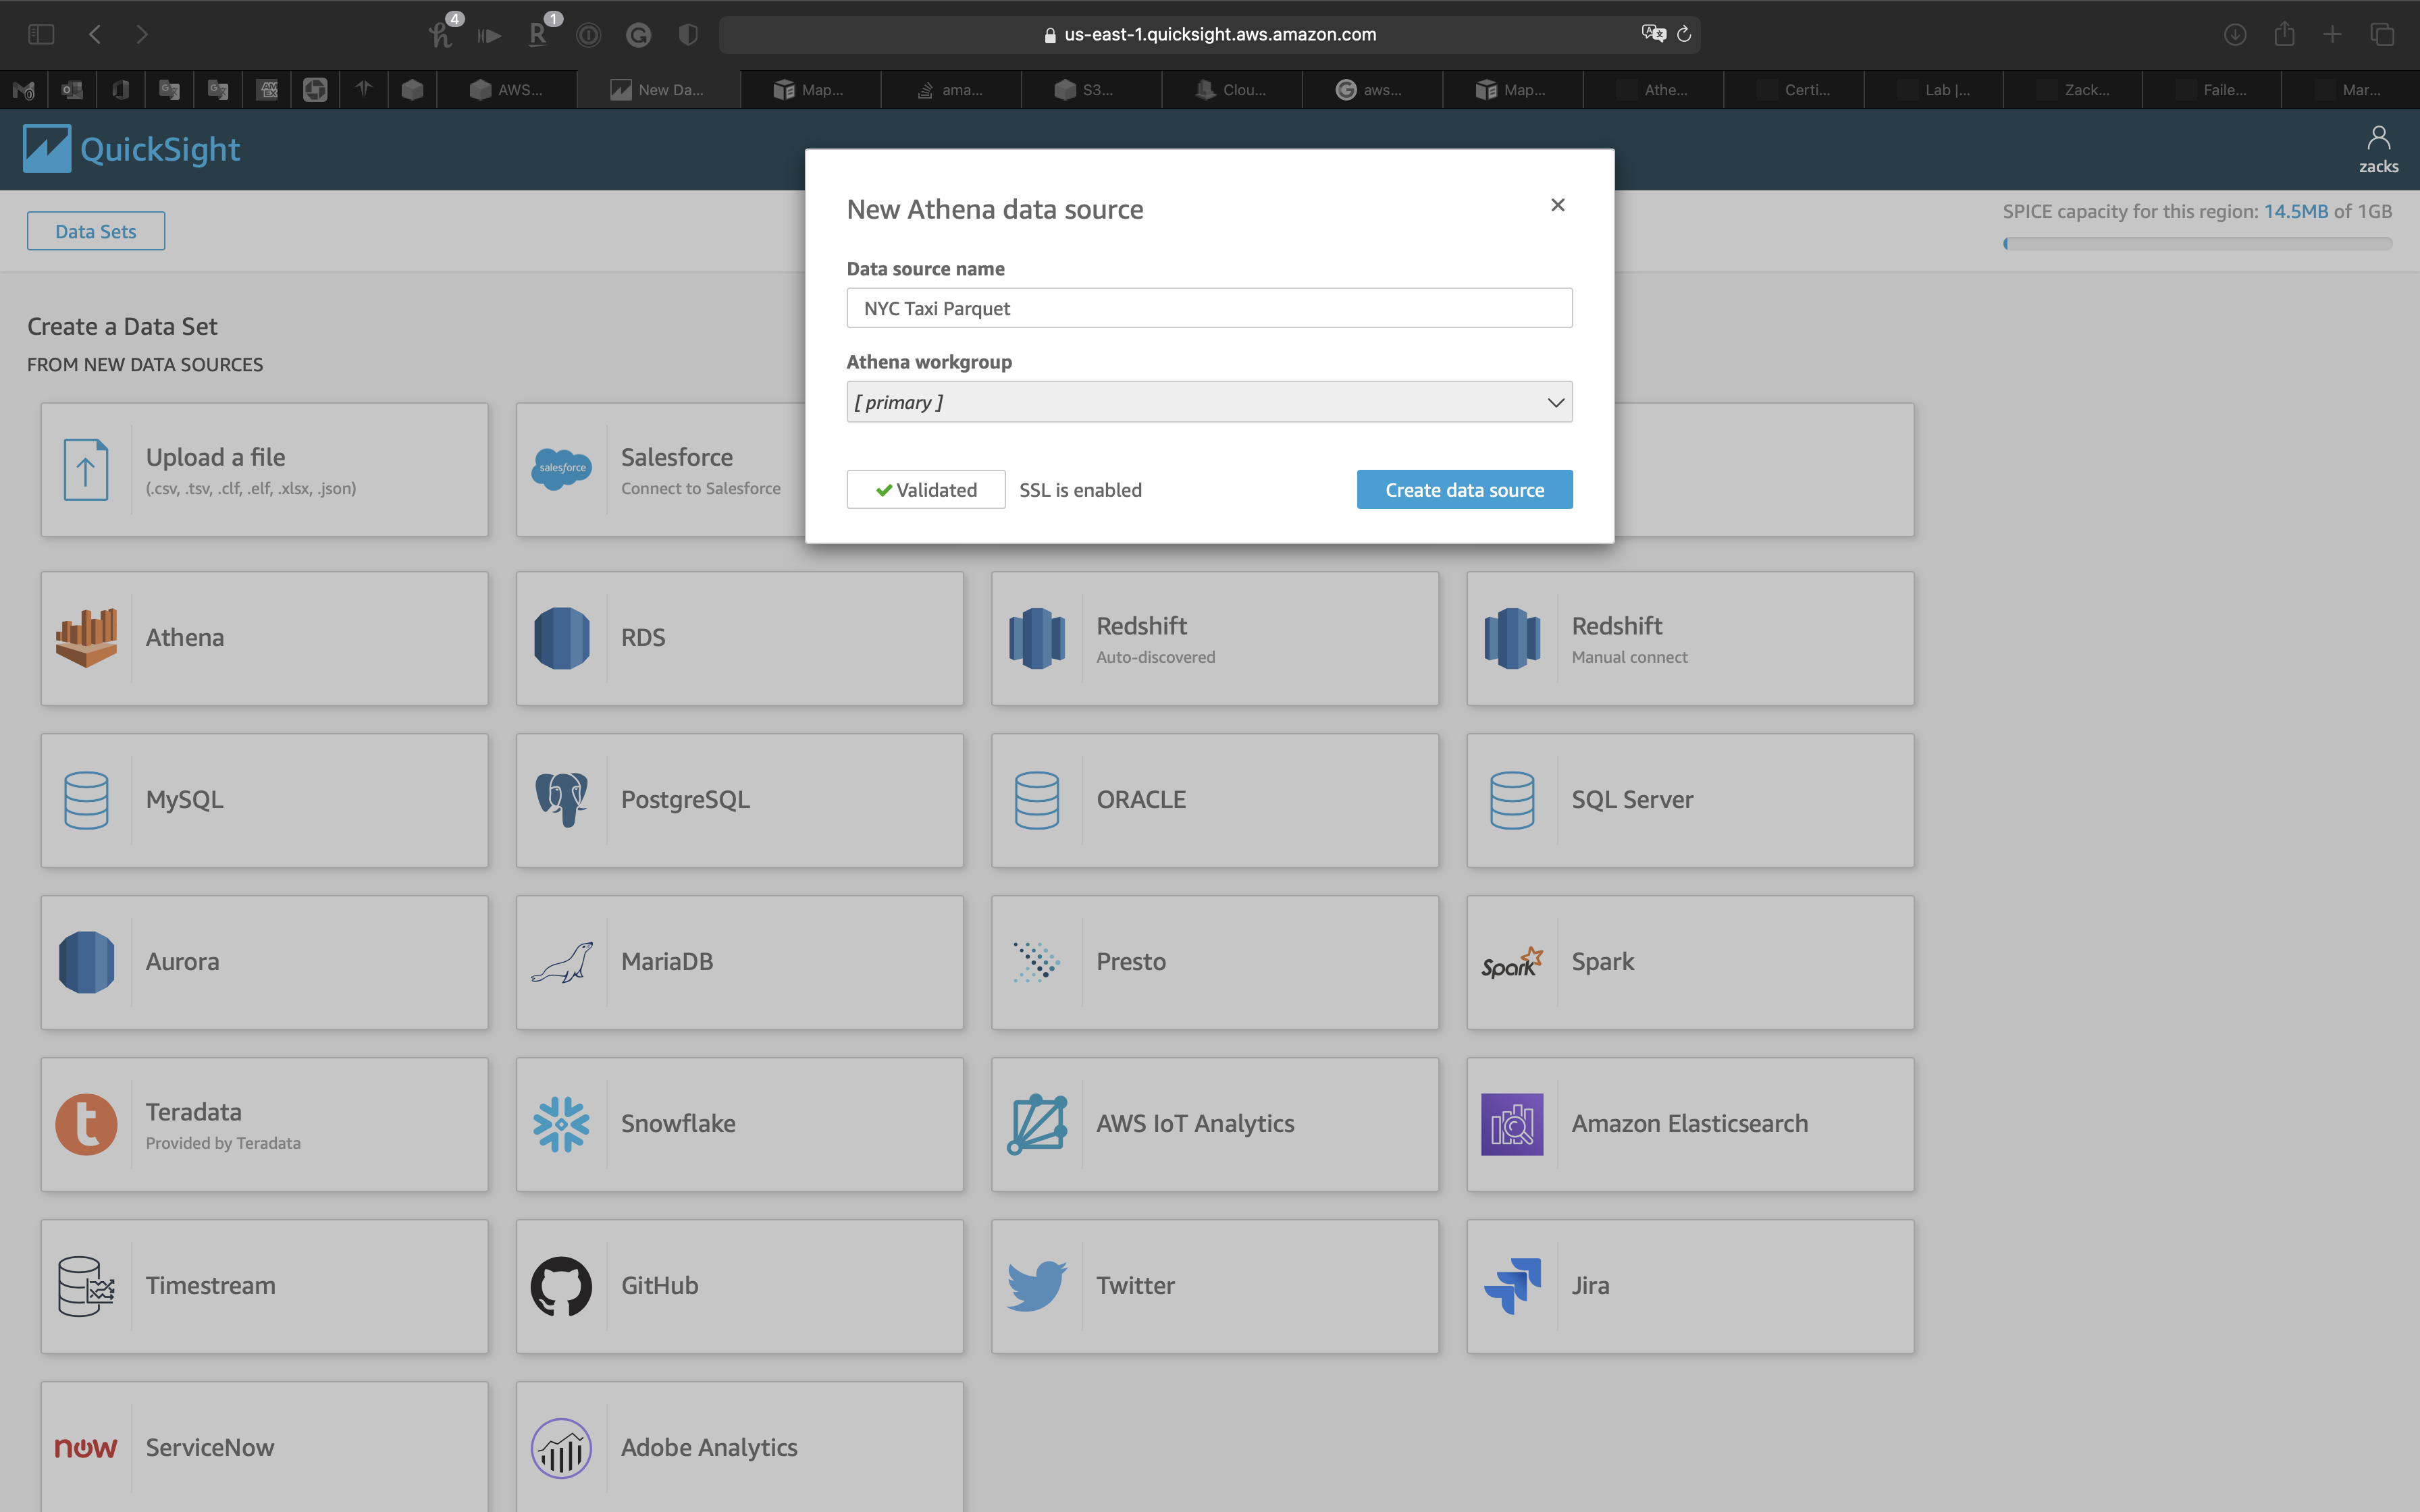
Database: select
ny_taxi_db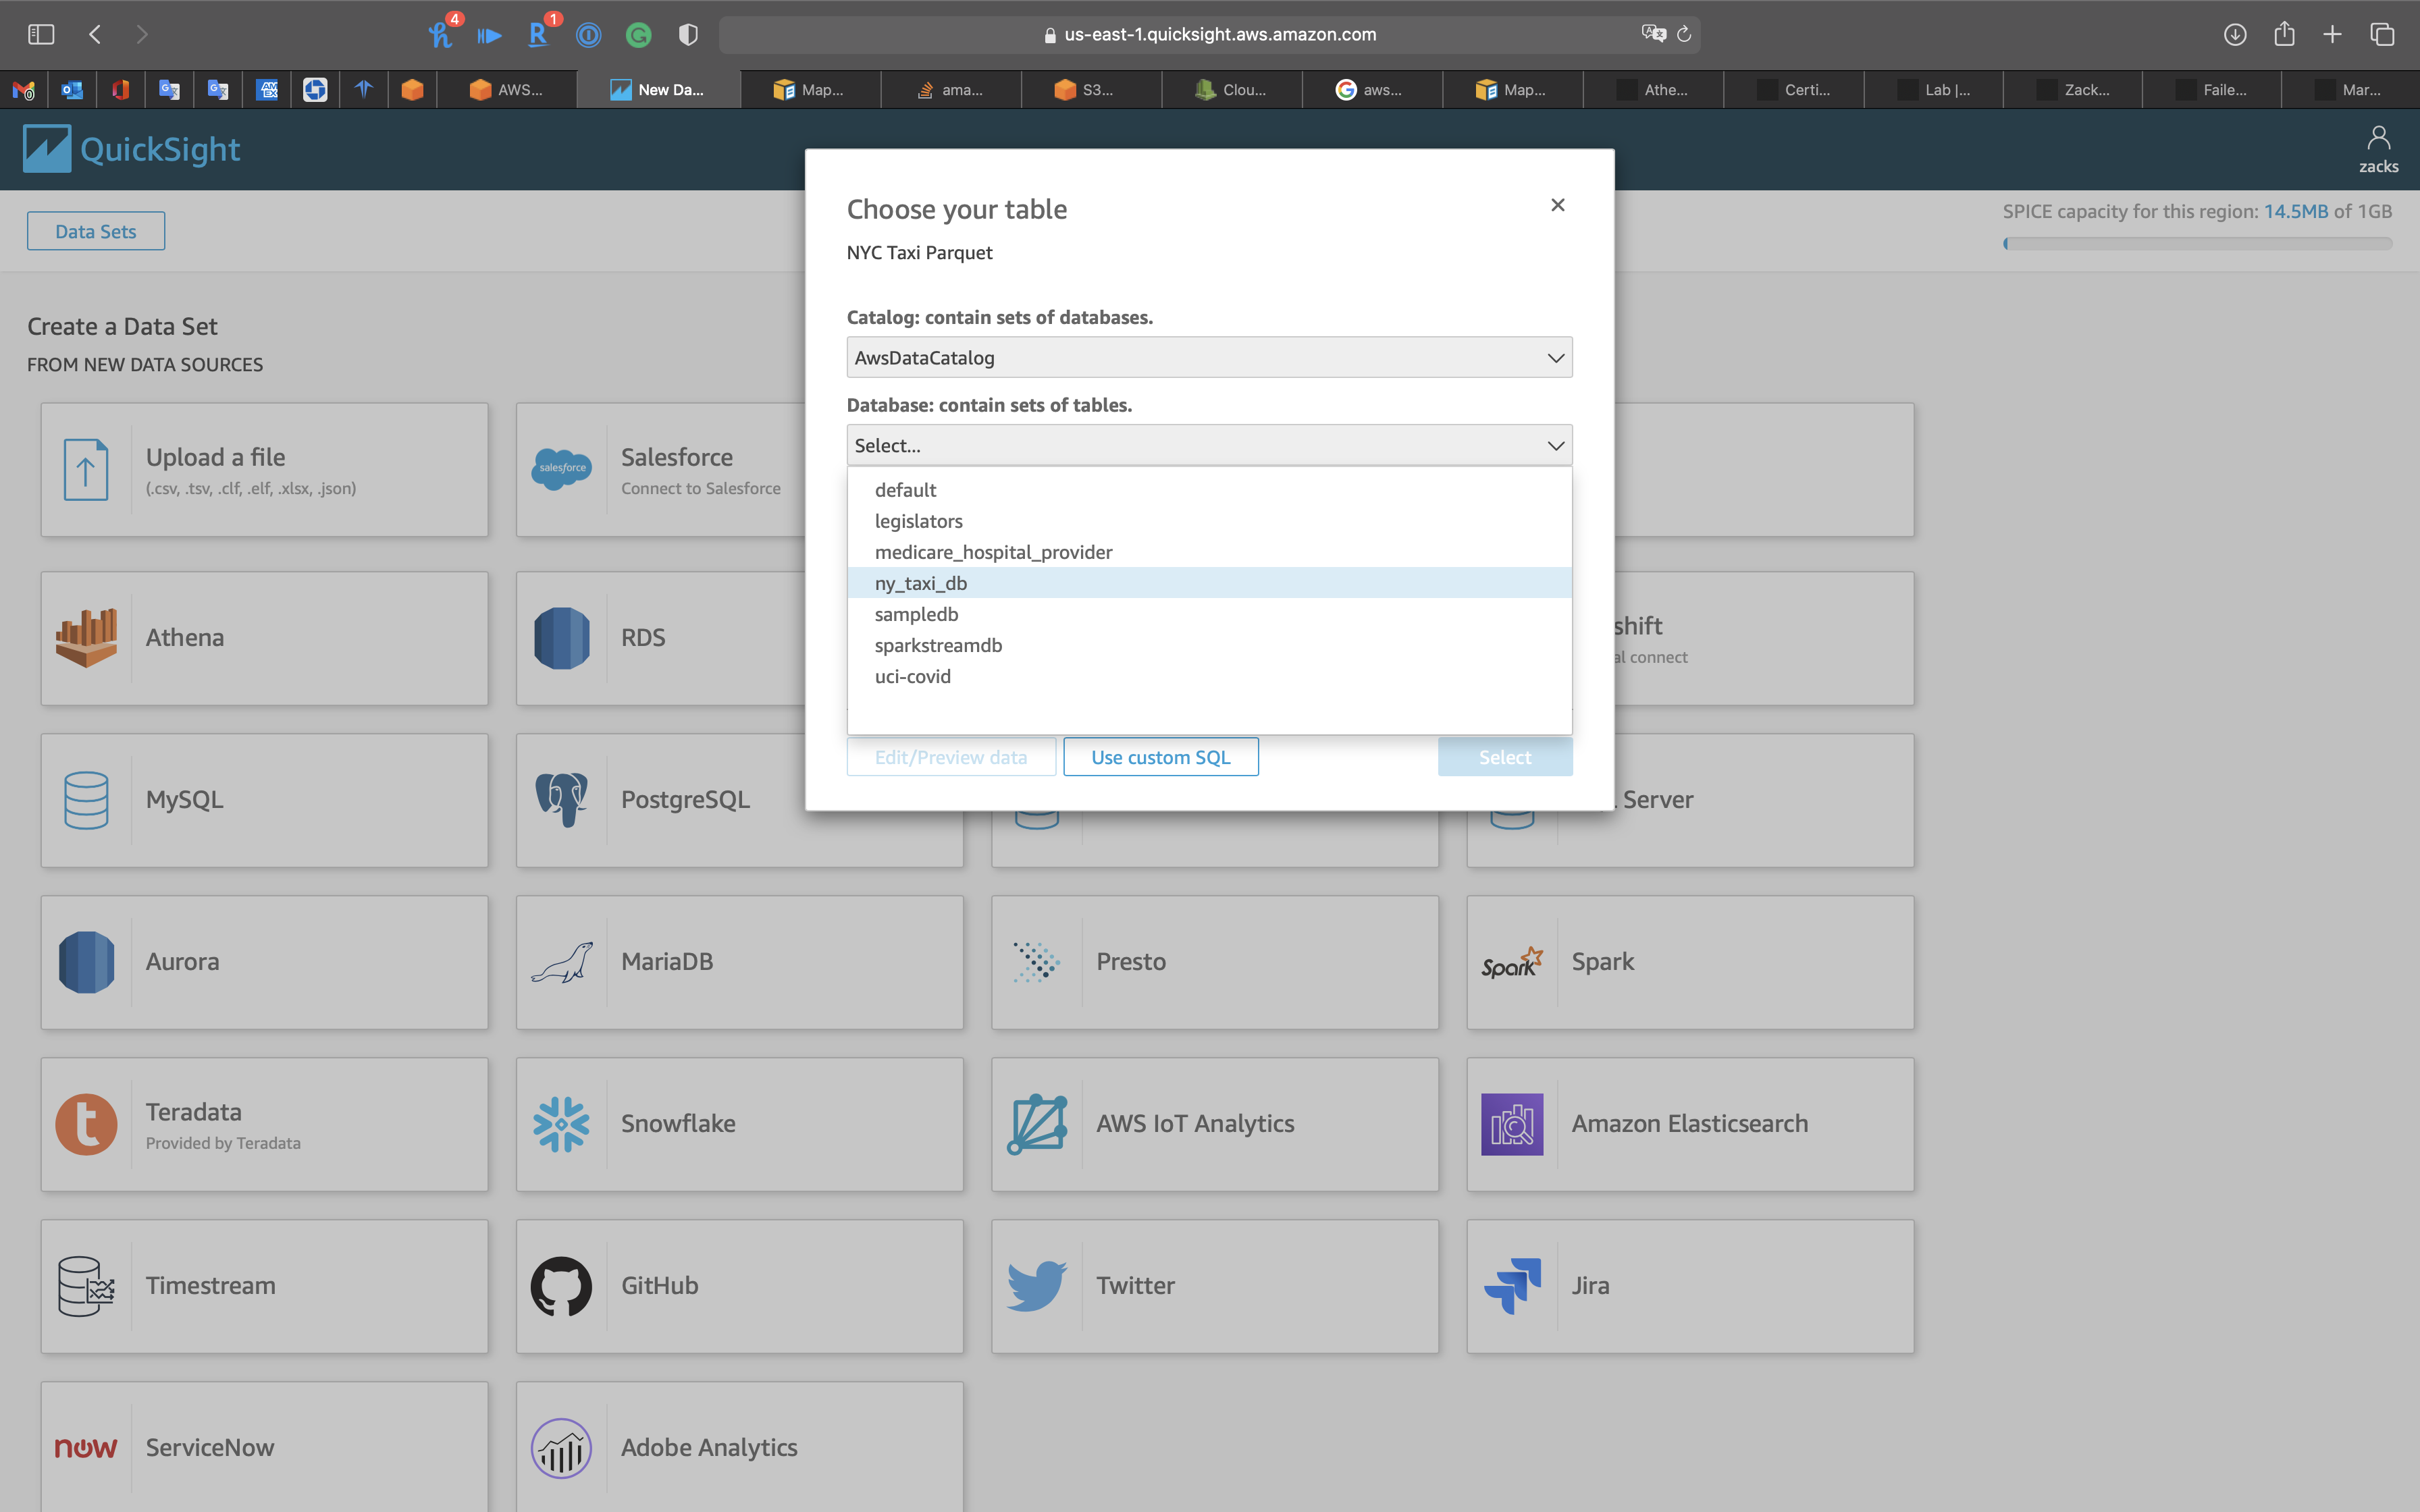
Select ny_taxi_parquet
Click on Edit/Preview data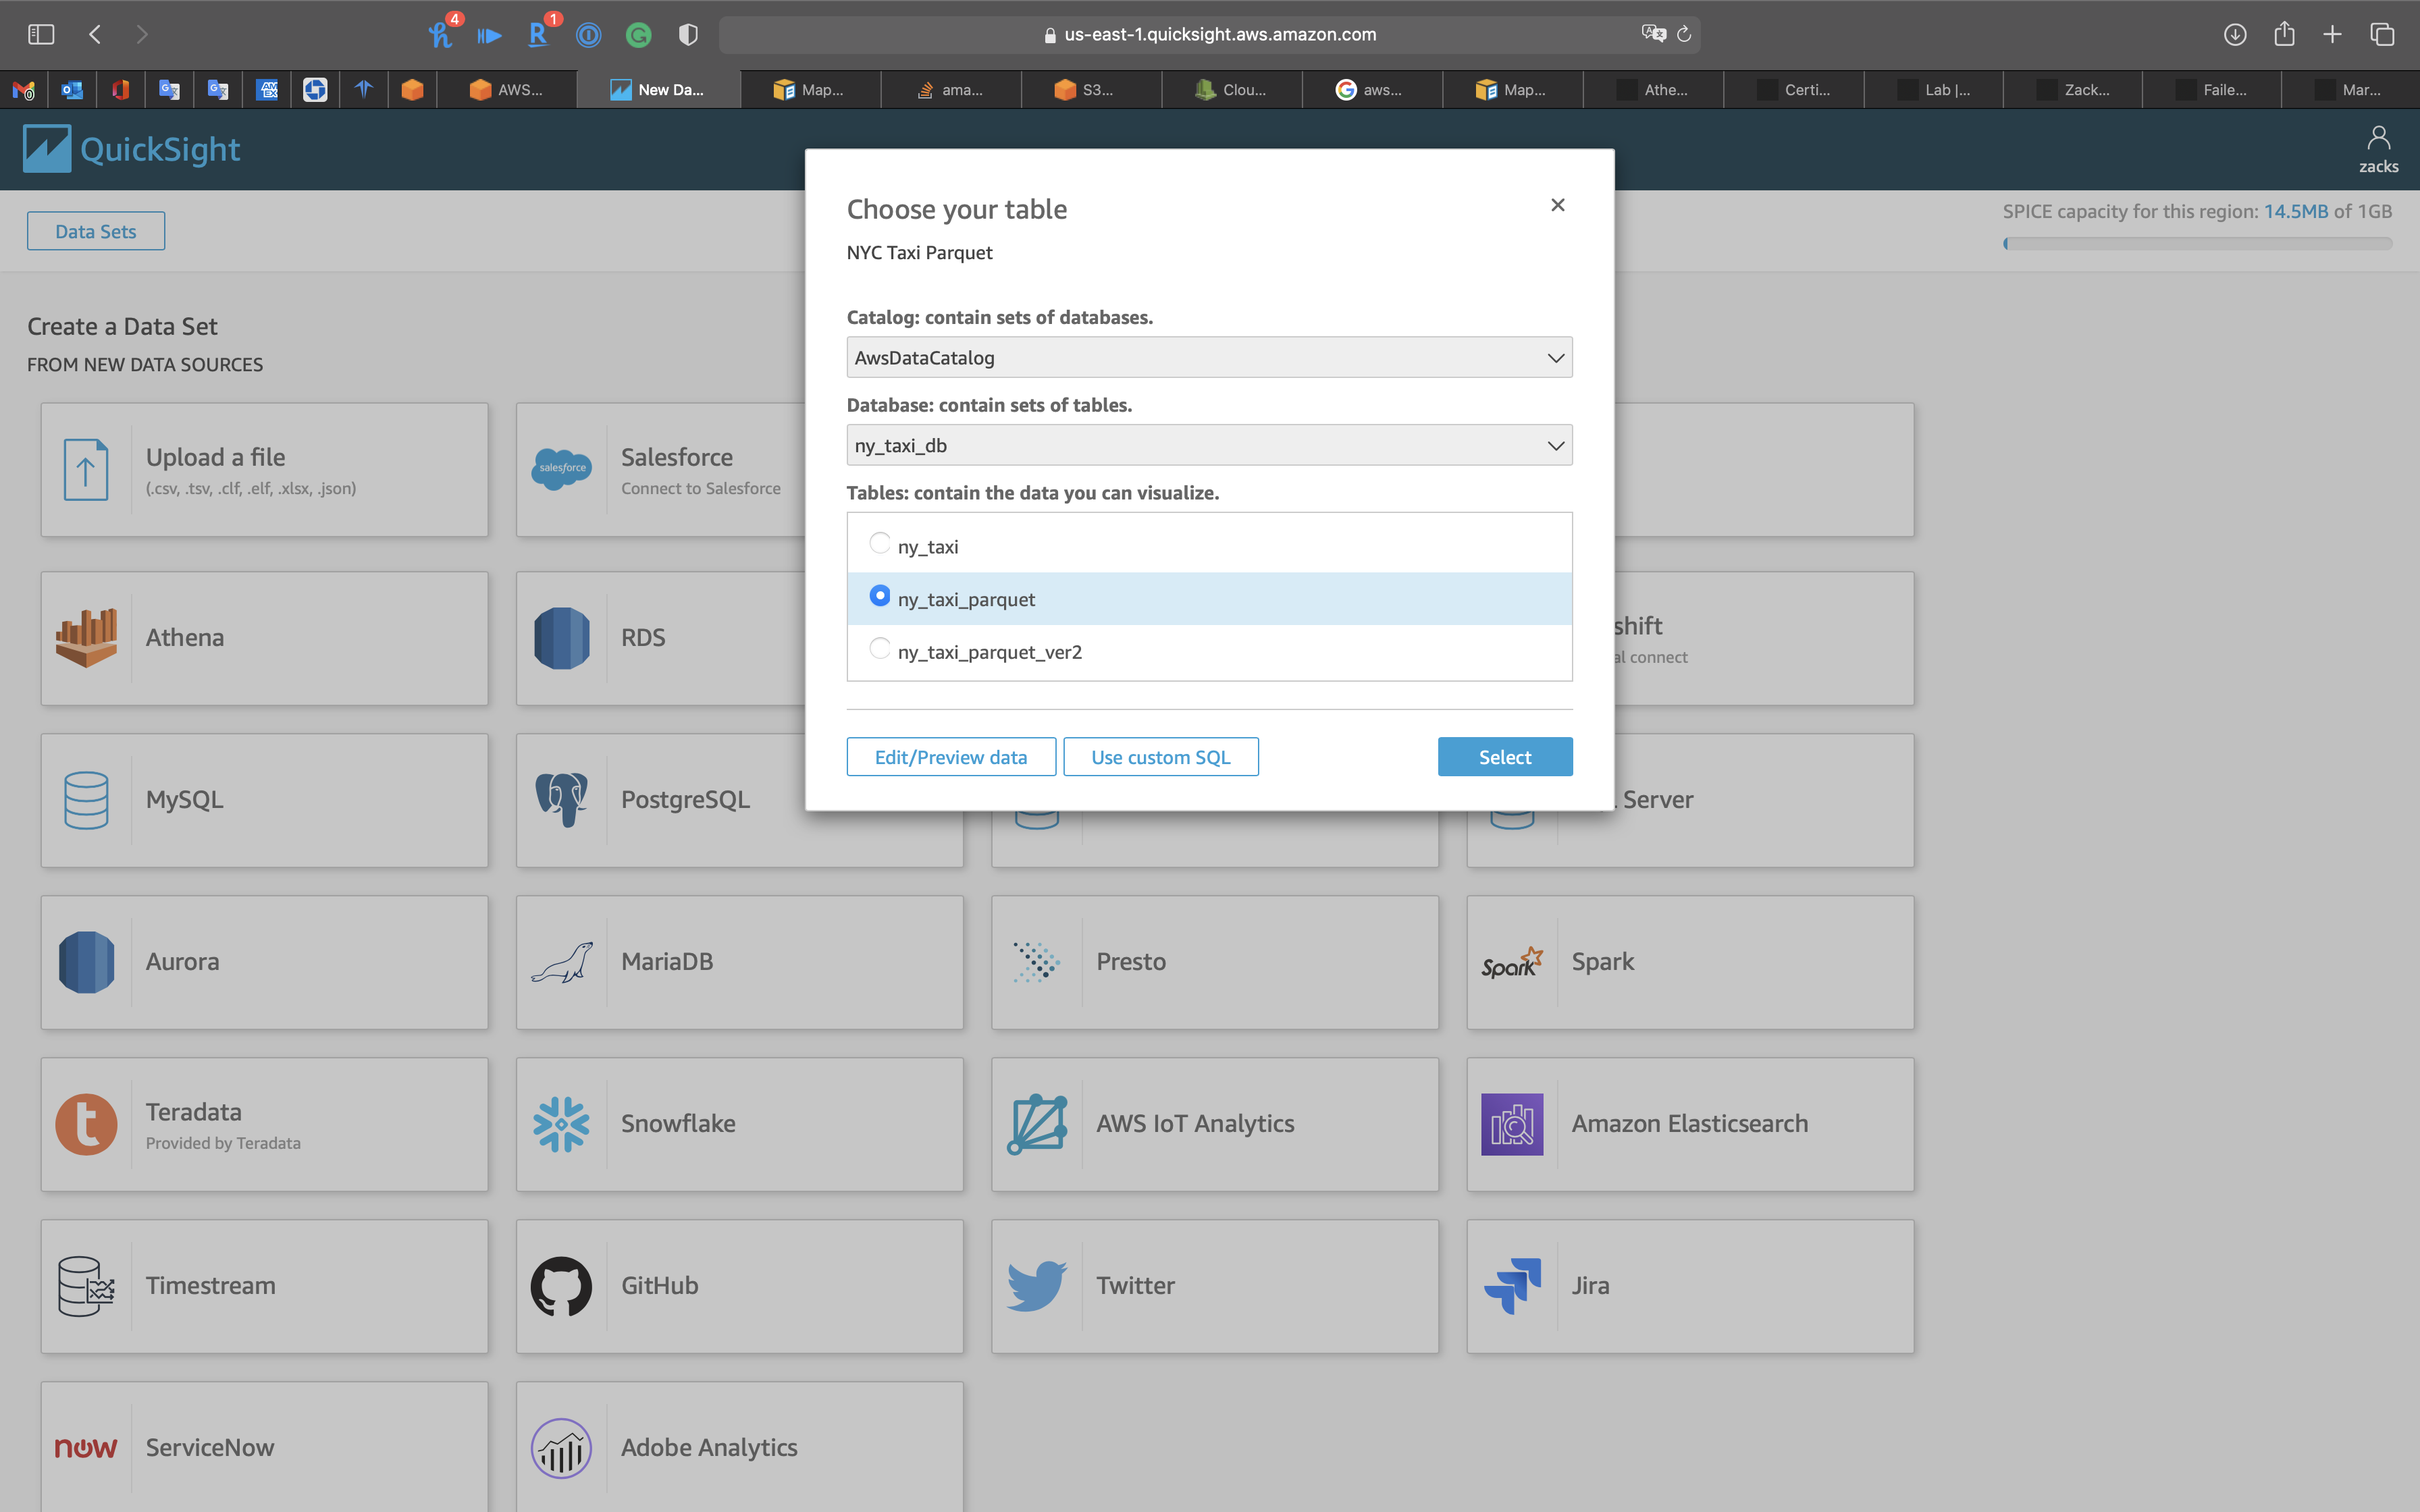
Edit/Preview data
Click on Add calculated field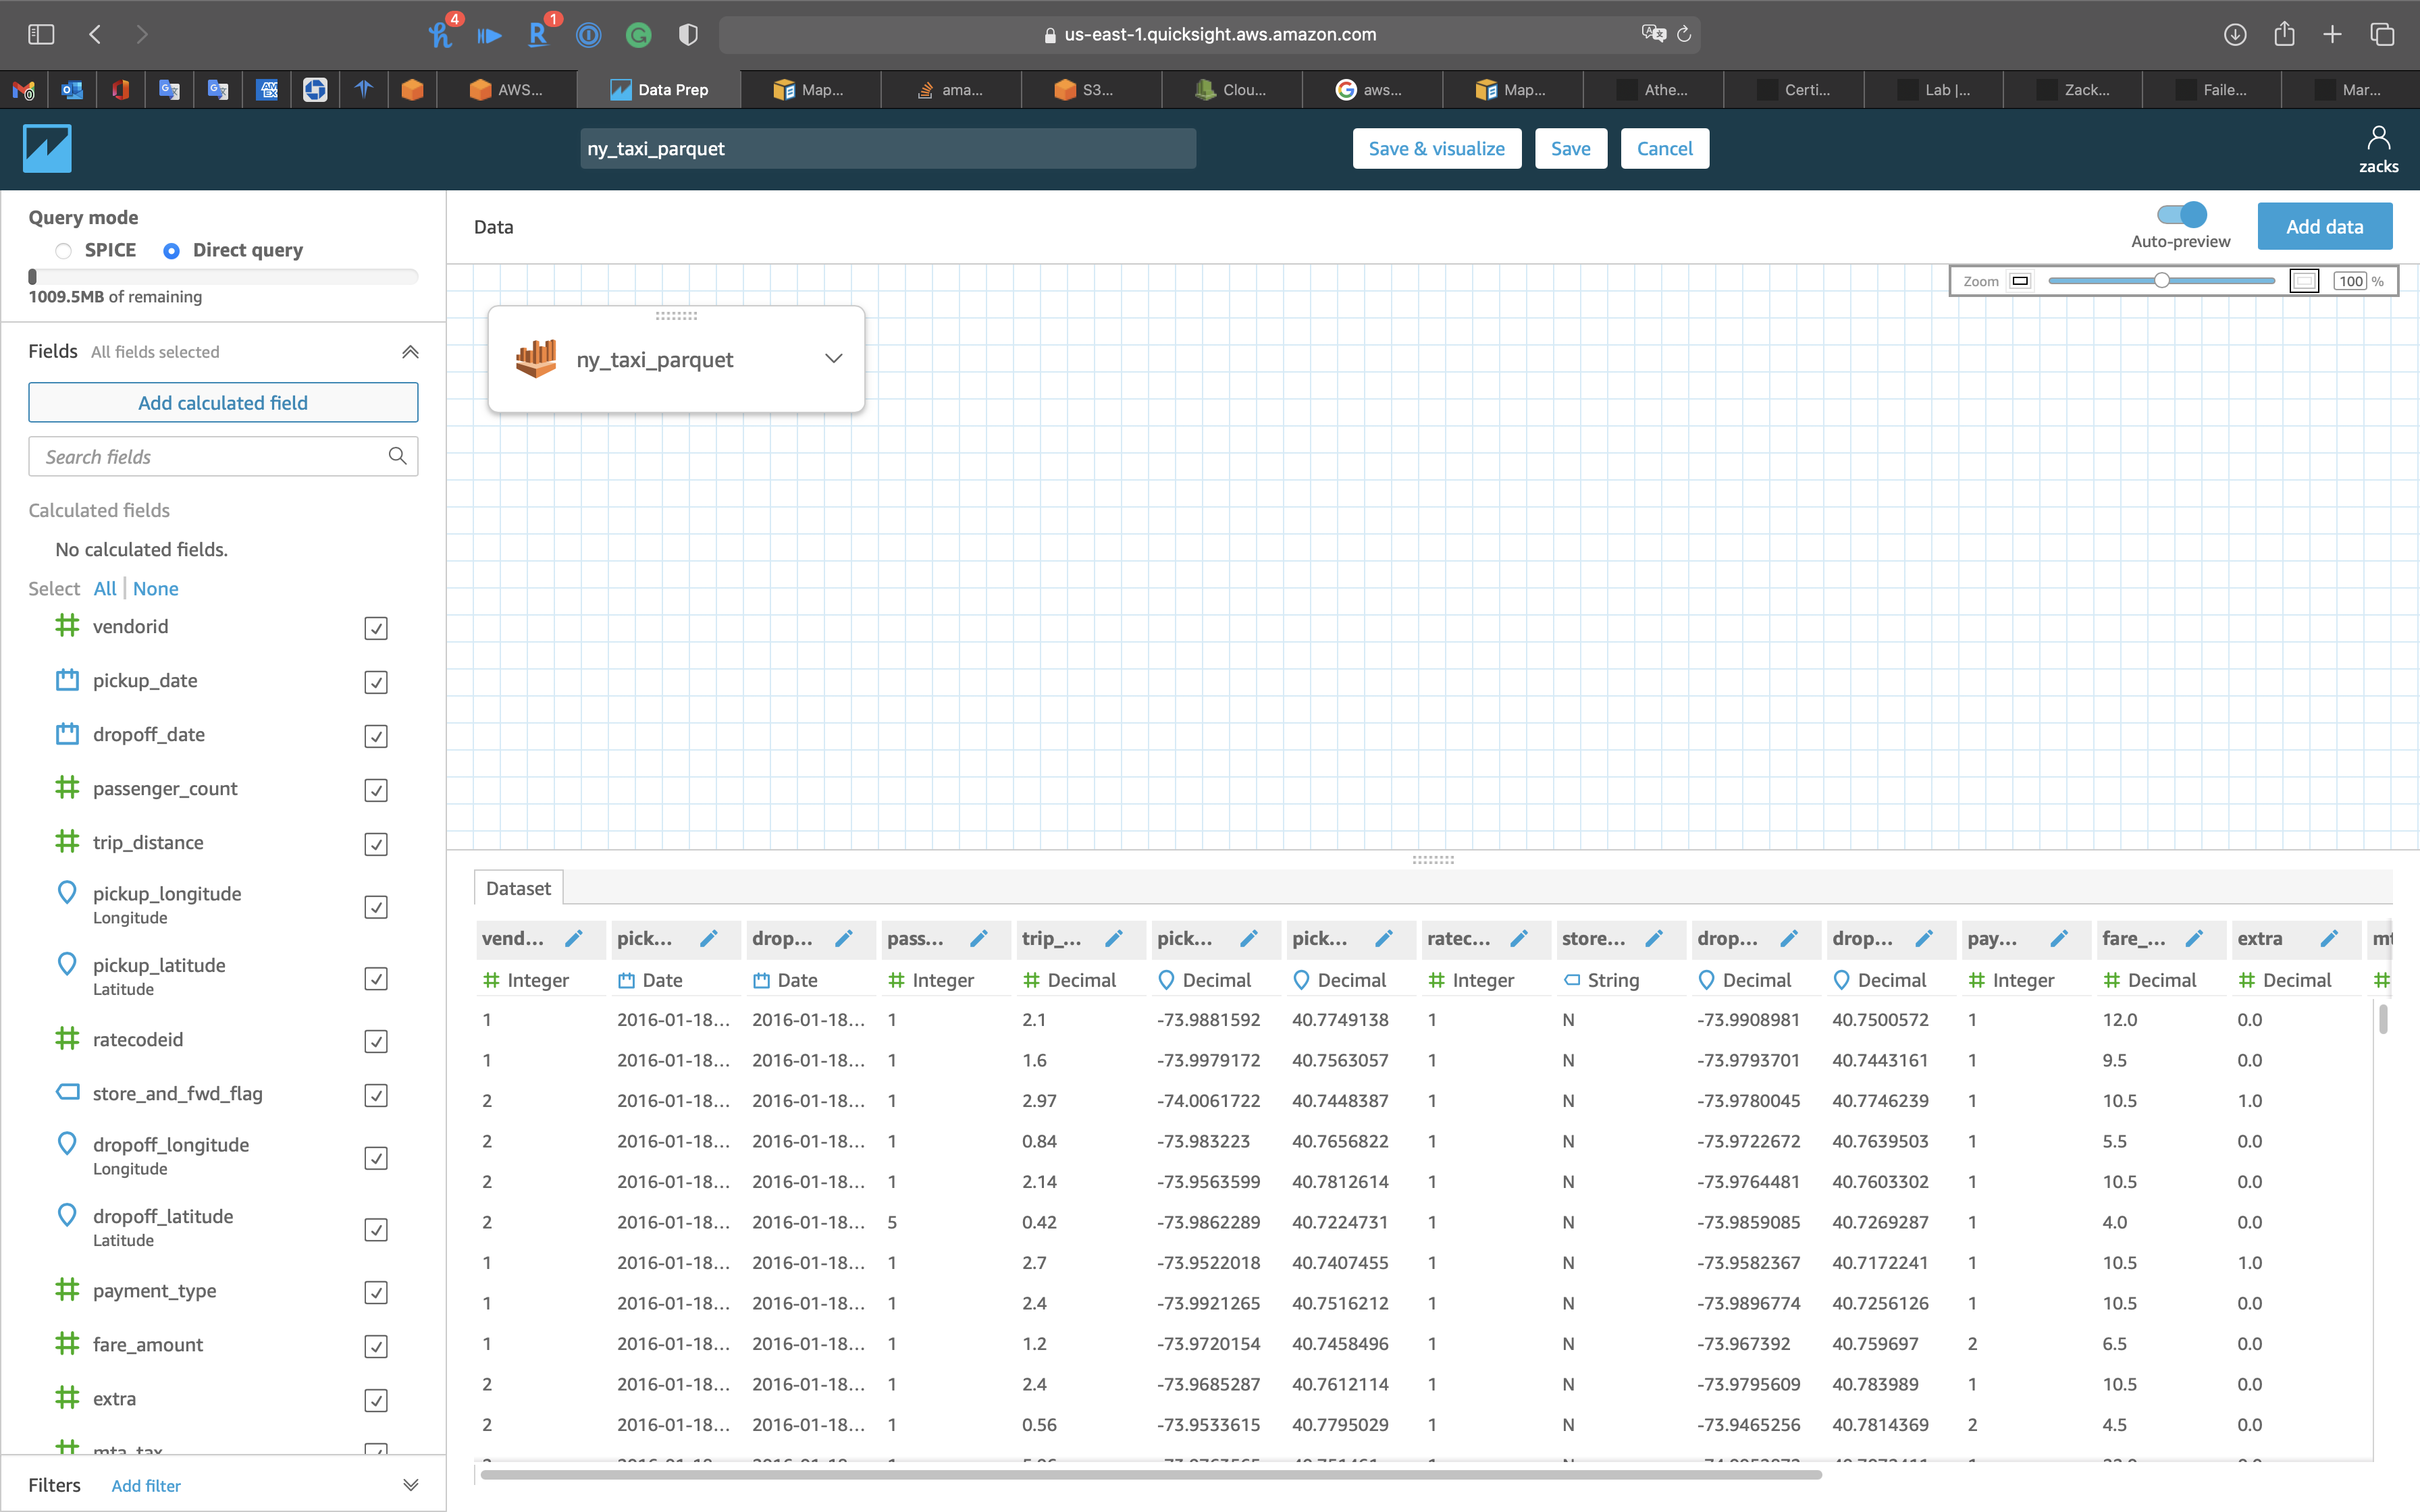
Add name: HourOfDay
Type the following expression
1 | extract('HH', {pickup_date}) |
Click on Save
Now we have the new field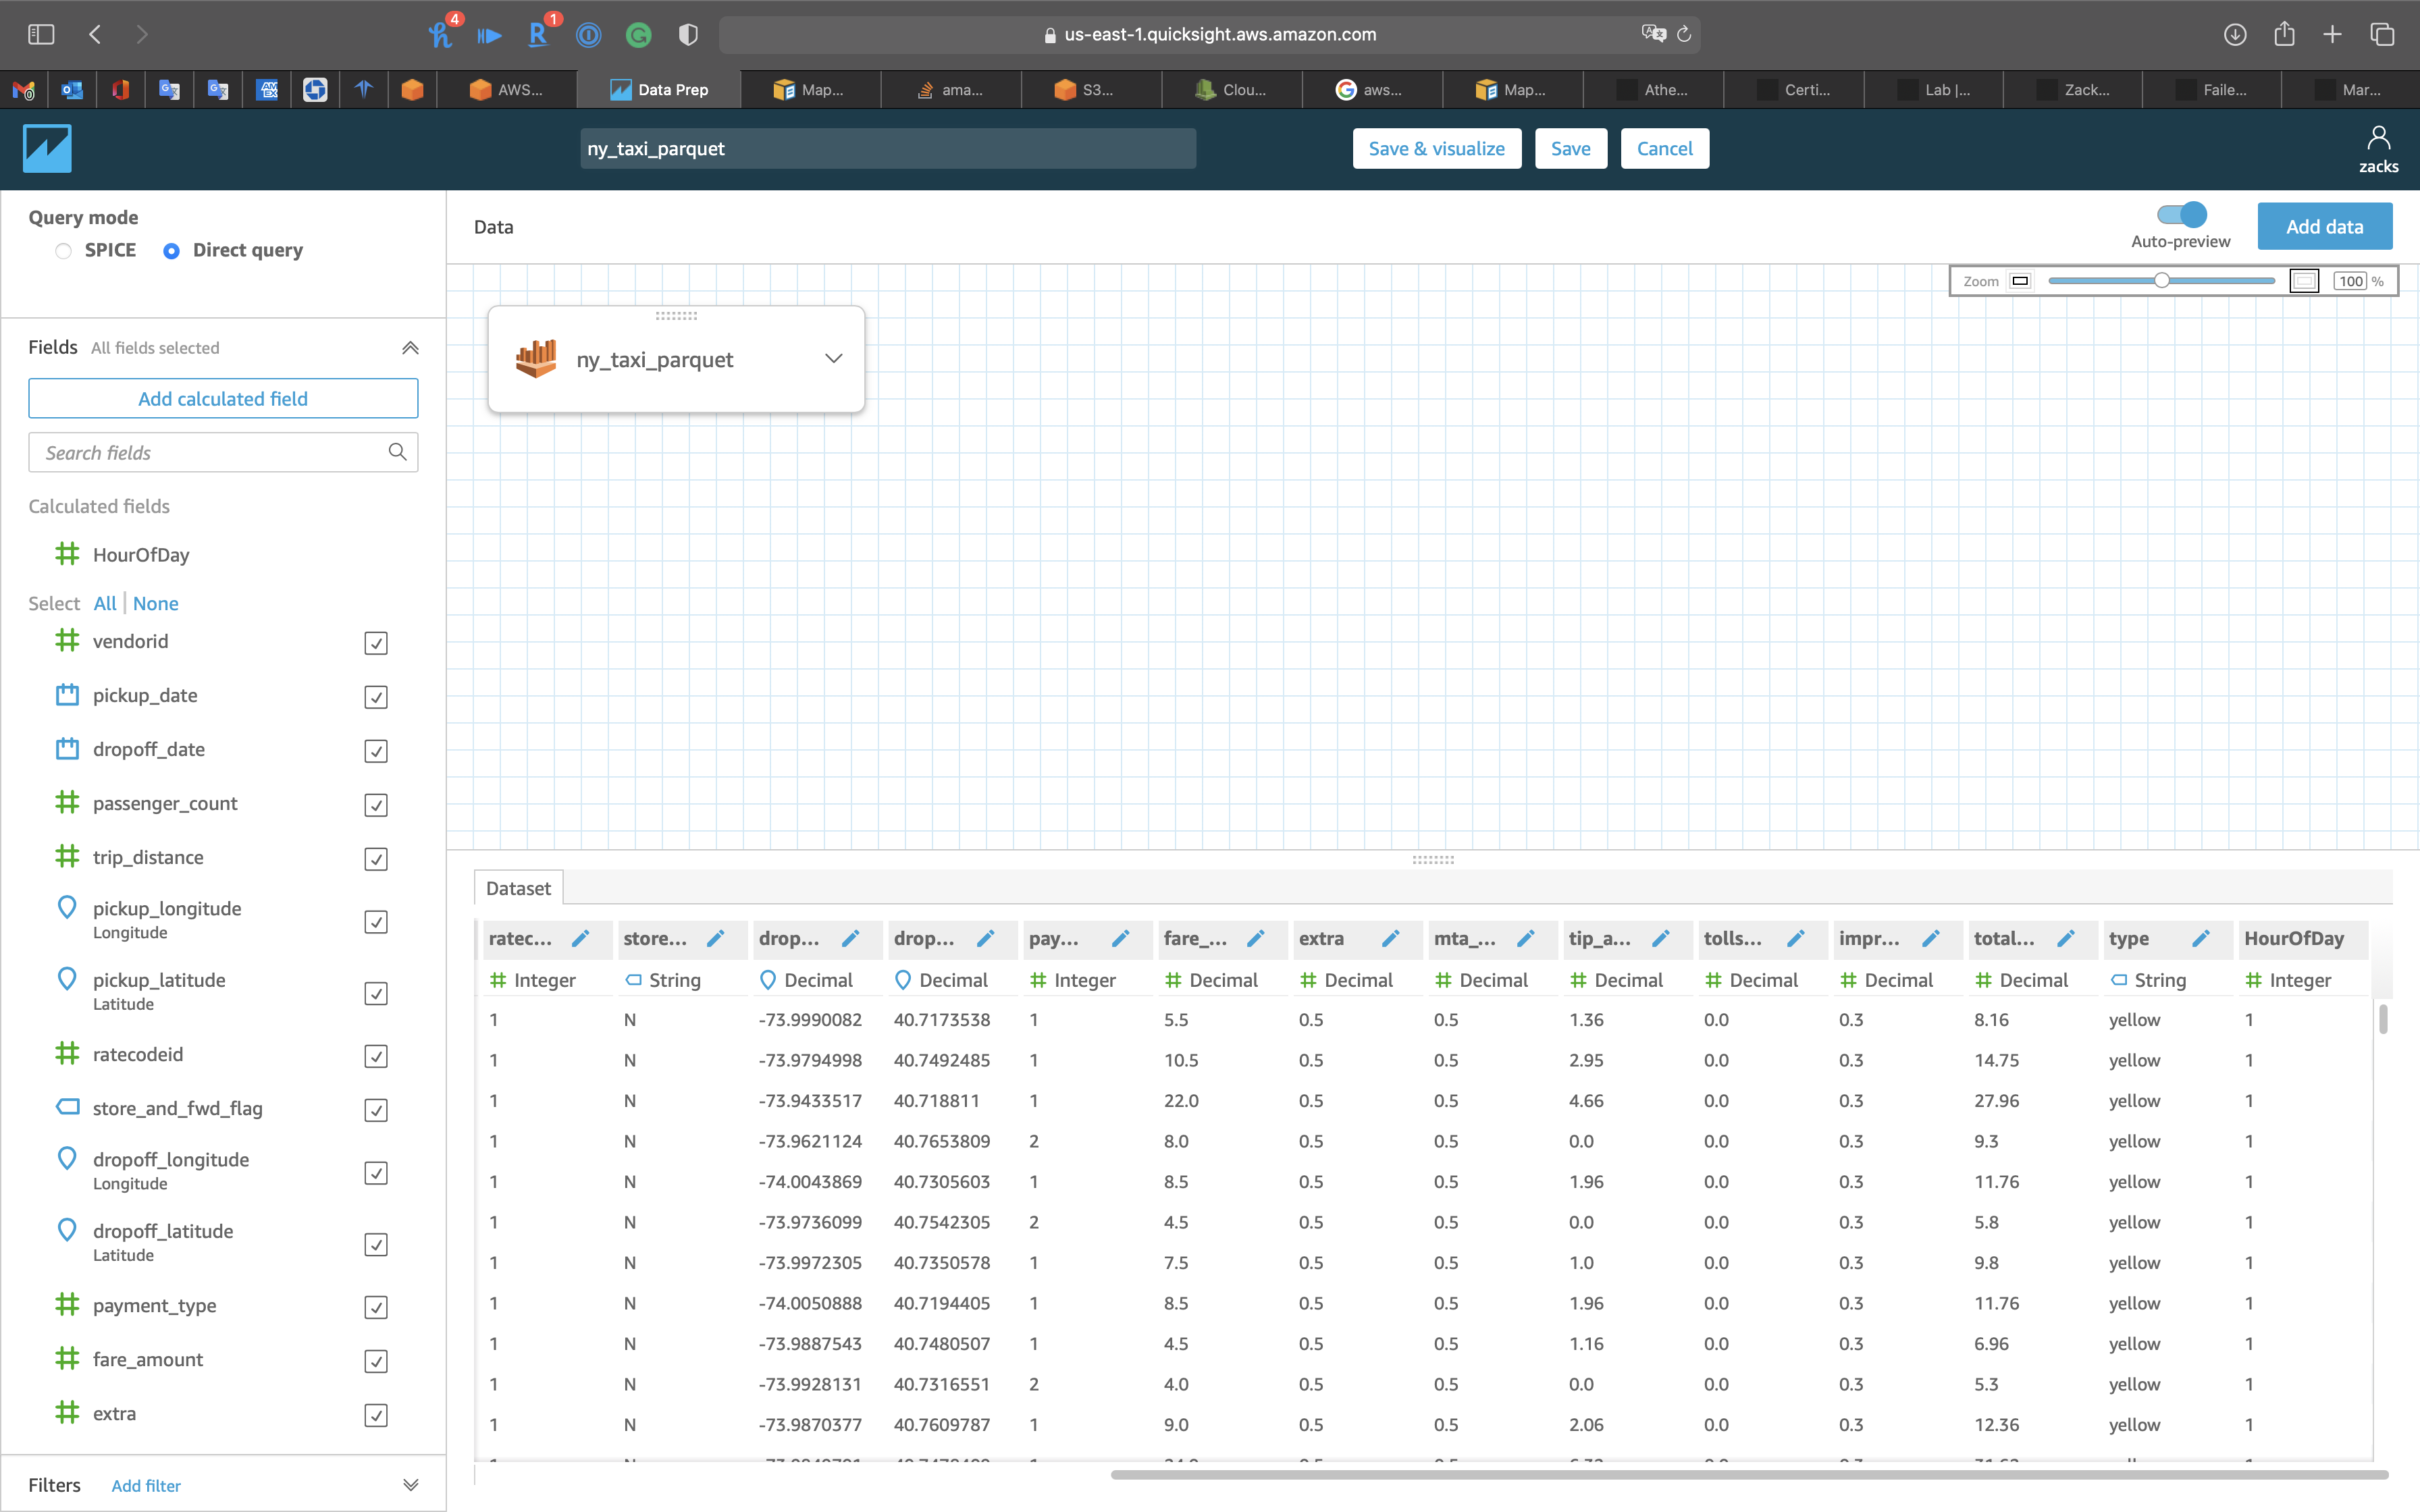
Click on Save & visualize on the top and middle page
AutoGraph
- Visual types:
AutoGraph - Y axis:
HourOfDay
Click on the expand button to see the graph in full size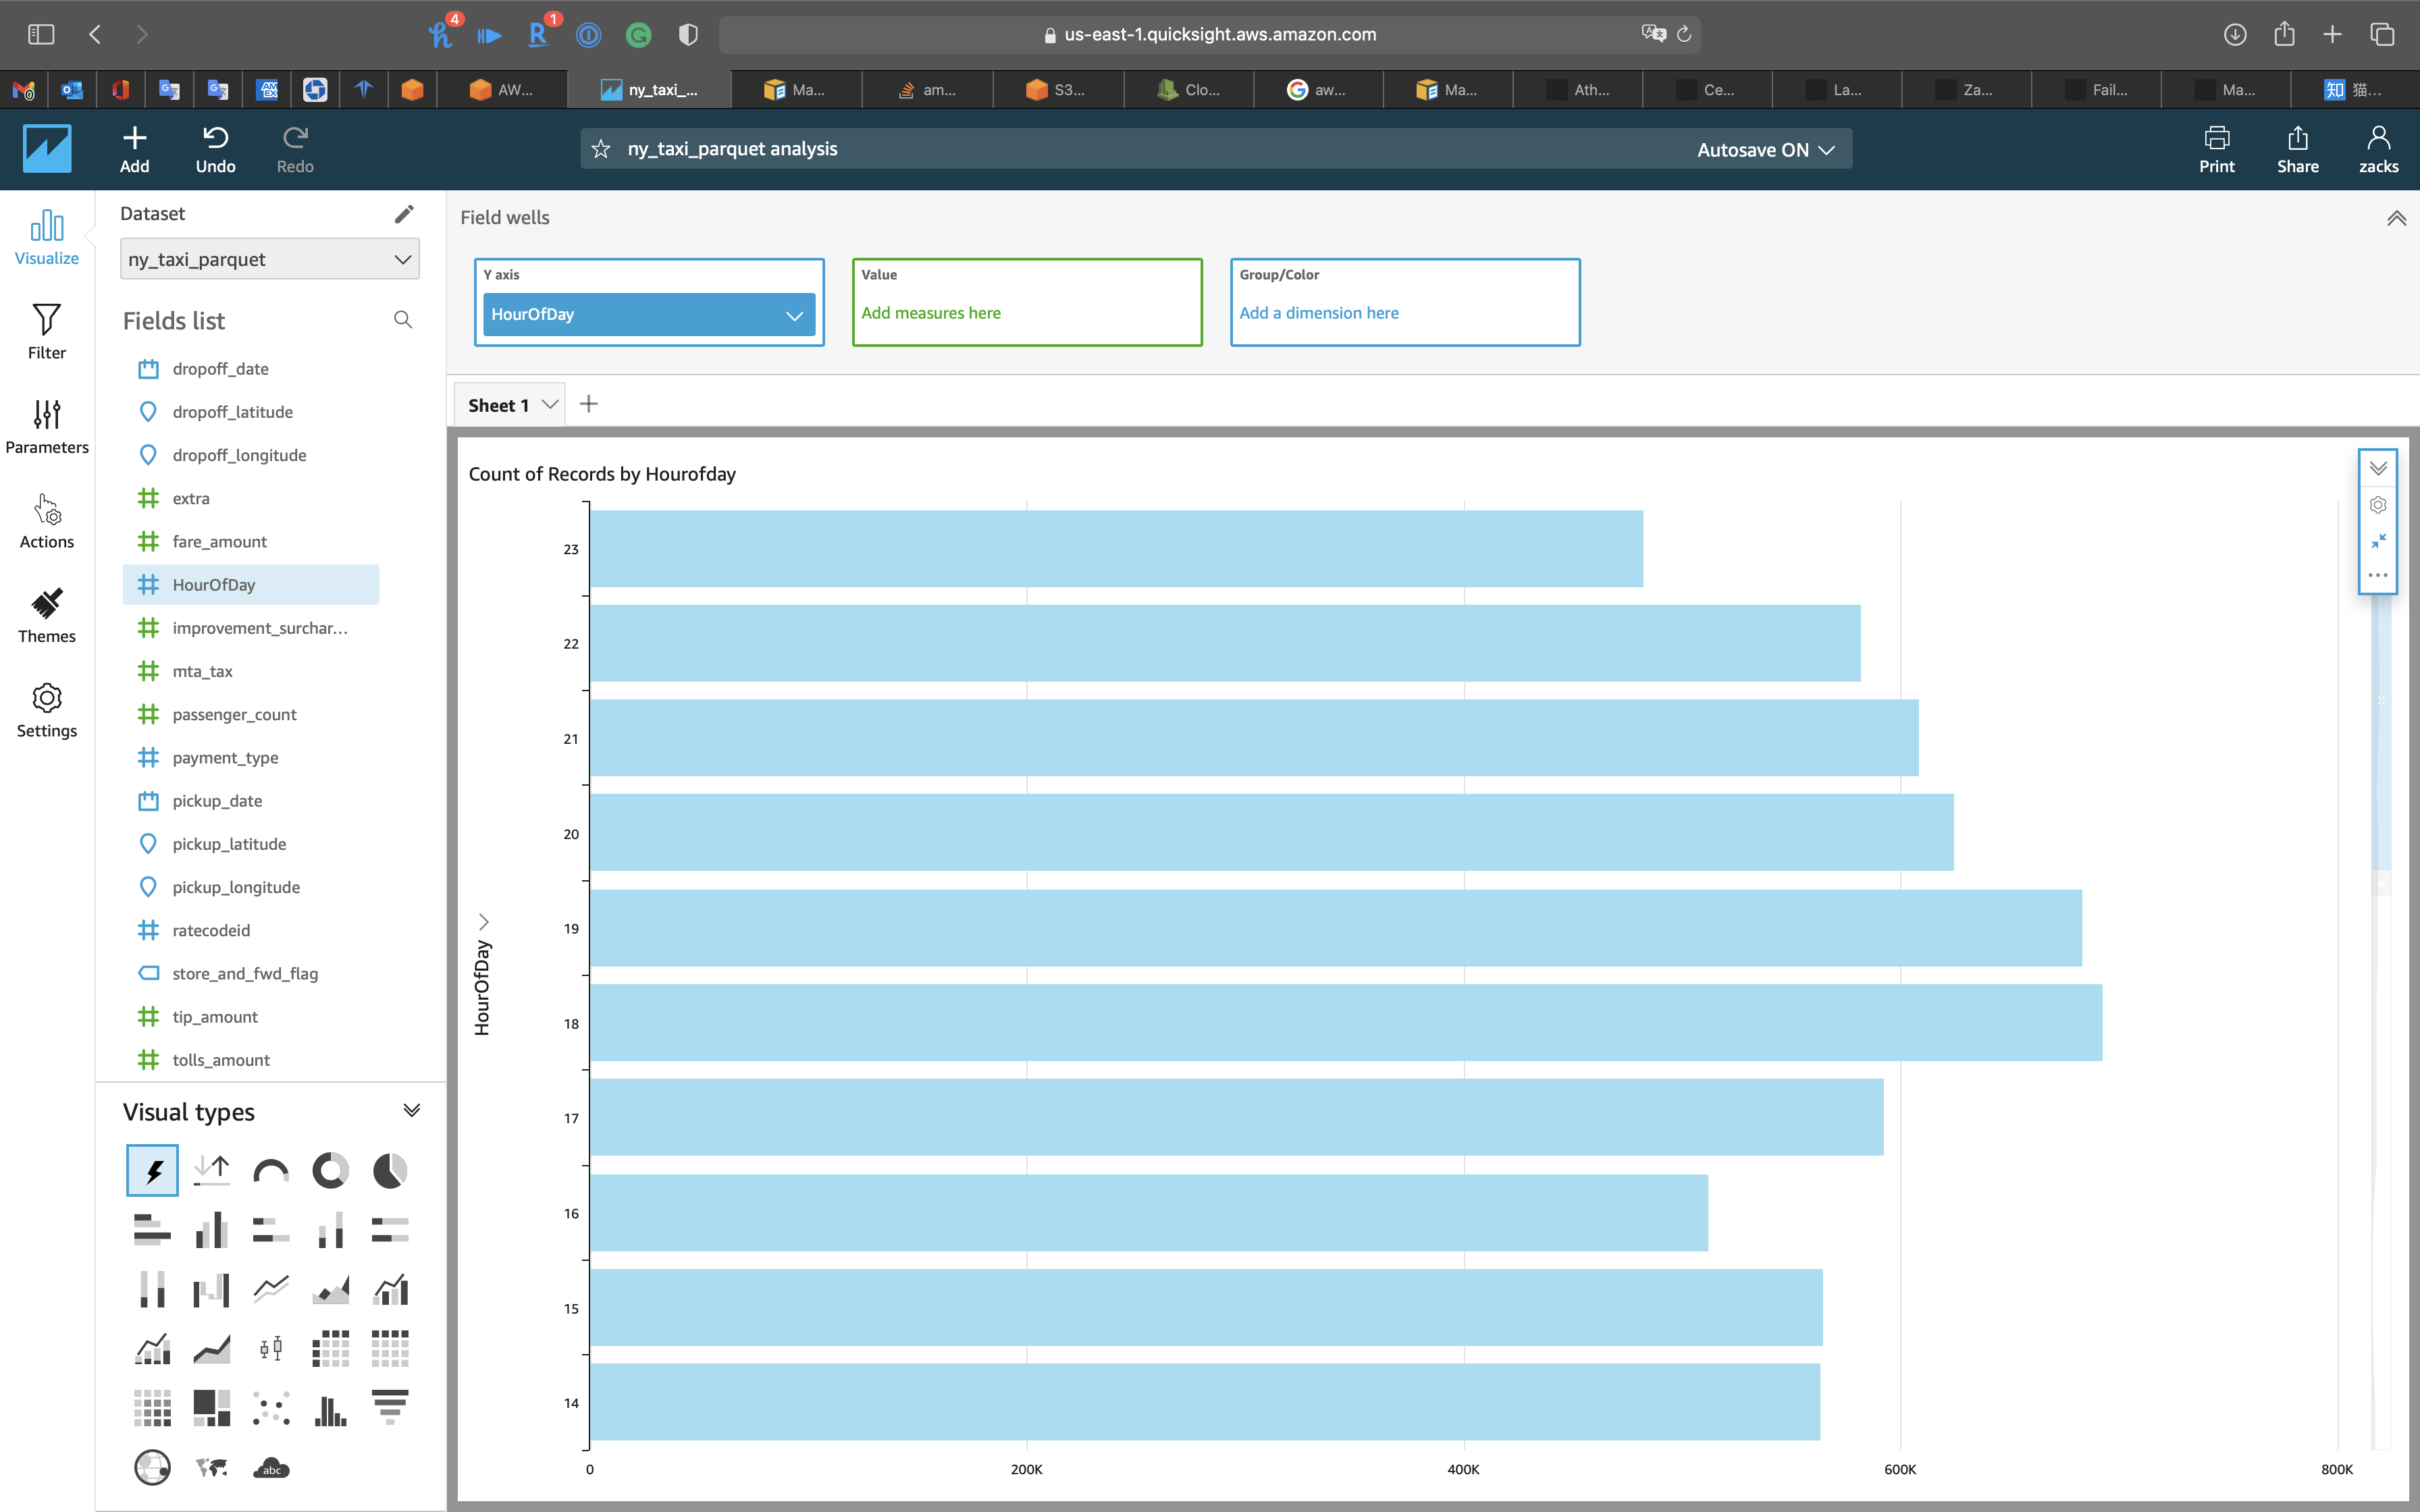
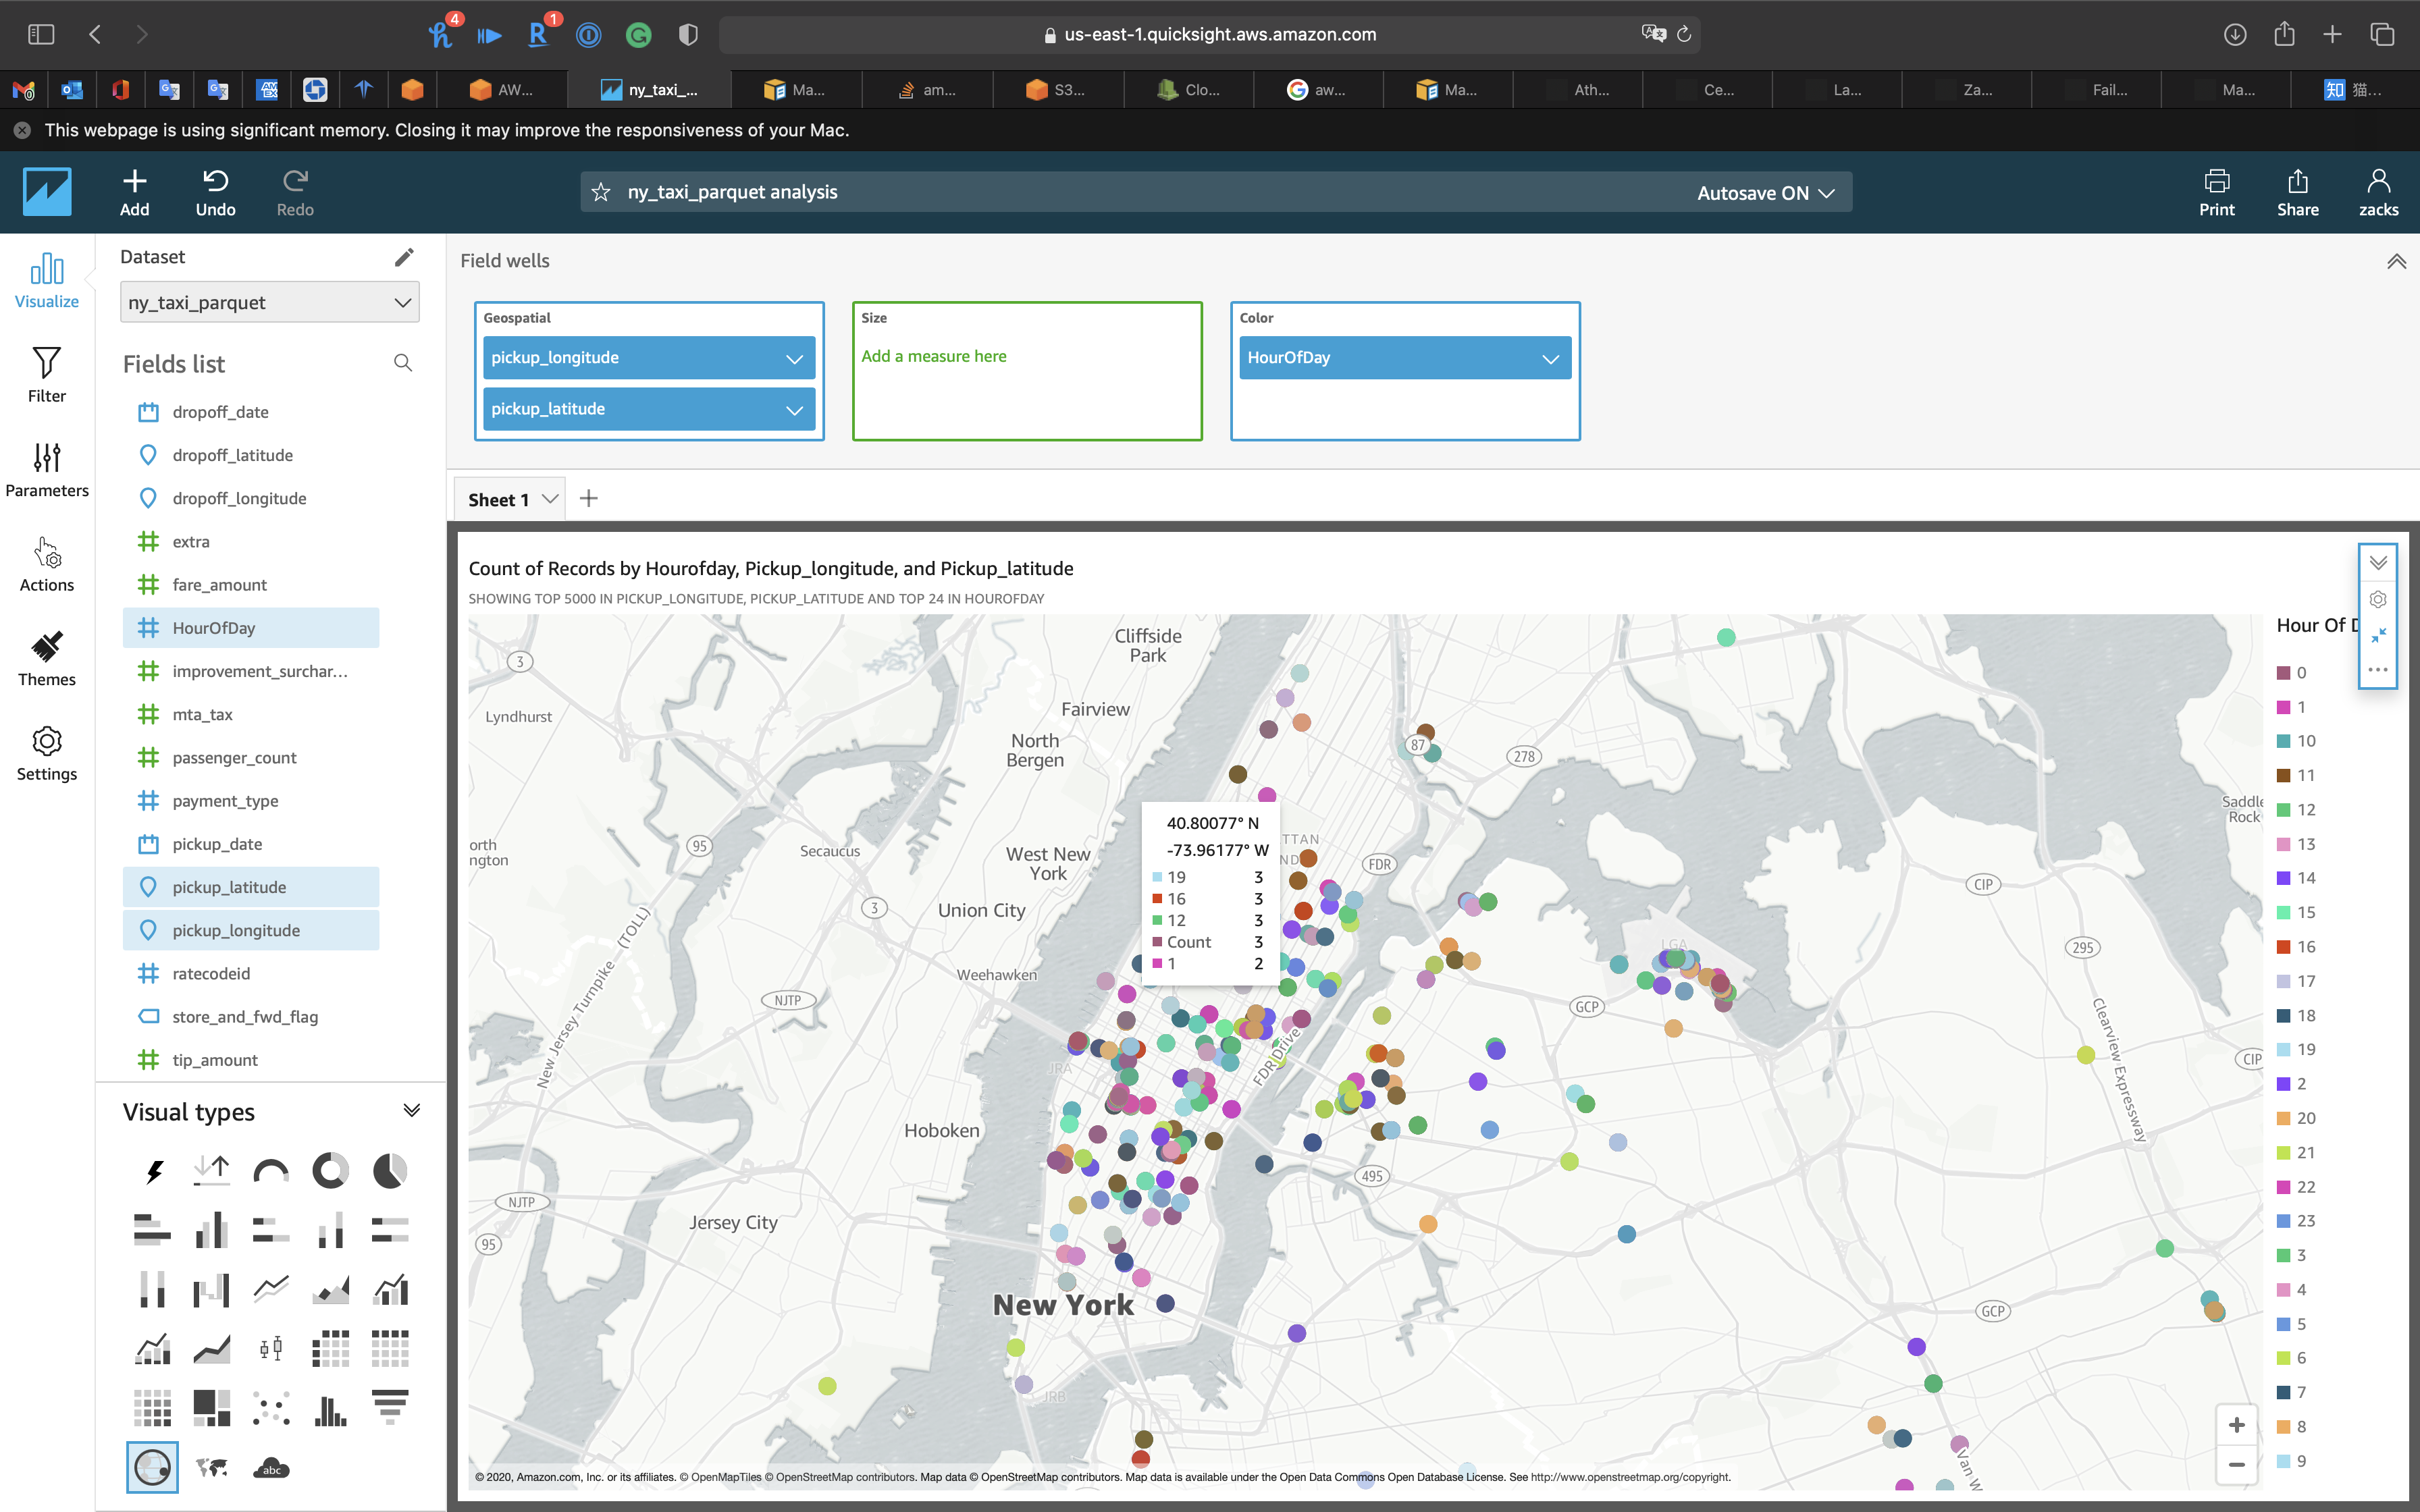
Geospatial chart
- Visual types:
Points on map - Geospatil
pickup_longitudepickup_latitude
- Color:
HourOfDay
Wait a minute for the result.
- You can zoom in the map to see details.
- Put your cursor on the point to see the details