Udacity Data Science
Home Page
References
The Data Science Process
Introduction
CRISP-DM
The CRISP-DM Process (Cross Industry Process for Data Mining)
The lessons leading up to the first project are about helping you go through CRISP-DM in practice from start to finish. Even when we get into the weeds of coding, try to take a step back and realize what part of the process you are in, and assure that you remember the question you are trying answer and what a solution to that question looks like.
- Business Understanding
- Data Understanding
- Data Preparation
- Modeling
- Evaluation
- Deployment

CRISP-DM - Business & Data Understanding - 1
The first two steps of CRISP-DM are:
- Business Understanding - this means understanding the problem and questions you are interested in tackling in the context of whatever domain you’re working in. Examples include
- How do we acquire new customers?
- Does a new treatment perform better than an existing treatment?
- How can improve communication?
- How can we improve travel?
- How can we better retain information?
- Data Understanding - at this step, you need to move the questions from Business Understanding to data. You might already have data that could be used to answer the questions, or you might have to collect data to get at your questions of interest.
Dataset Summary
Find the dataset that you will be using in this course at the bottom of this page, as well as in the workspaces throughout this lesson.
The data was collected by providing a surveys to developers On Stack Overflow’s website.
Using Workspaces
Quiz: A Look at the Data
Solution
Quiz: Data Preparation
Check all of the things you should check about your dataset when getting started.
Check each column is a variable, and each row is an individual
Look at the number of rows and columns in the dataset
Check if there are missing values in any of the rows or columns
Check if any columns are of different data types than you would expect (ex: numbers showing as strings)
Build exploratory plots like bar charts, histograms and scatter plots to better understand the data
CRISP-DM - Business & Data Understanding - 2
Two ways
- Data -> Question -> Solution
- Question -> Data -> Solution
Business and Data Understanding
Business Questions
- How do I break into the field?
- What are the placement and salaries of those who attended a coding bootcamp?
- How well can we predict an individual’s salary? What aspects correlate well to salary?
- How well can we predict an individual’s job satisfaction? What aspects correlate well to job satisfaction?
Data Understanding
You will be using the Stackoverflow survey data to get some insight into each of these questions. In the rest of the lesson, you can work along with me to answer these questions, or you can take your own approach to see if the conclusions you draw are similar to those you would find throughout this lesson.
CRISP-DM - Data Preparation
The CRISP-DM
We have now defined the questions we want to answer and had a look through the data available to find the answers, that is, we have looked at the first two steps here:
- Business Understanding
- Data Understanding
We can now look at the third step of the process:
- Data Preparation
- Modeling
- Evaluation
- Deployment
Luckily stackoverflow has already collected the data for us. However, we still need to wrangle the data in a way for us to answer our questions. The wrangling and cleaning process is said to take 80% of the time of the data analysis process. You will see that will hold true through this lesson, as a majority of the remaining parts of this lesson will be around basic data wrangling strategies.
We will discuss the advantages and disadvantages of the strategies discussed in this lesson.
Quiz: How to break into the field?
Solution
Quiz: Bootcamps
Bootcamp Takeaways
Use the images from the previous video to assist with the quizzes on this page.
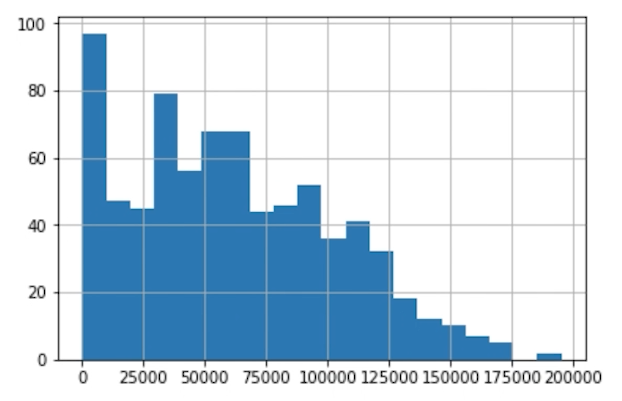
What were your earnings for your job after the bootcamp?

What does the data suggest about earnings completing the bootcamp?
We can clearly see the bootcamp was worth it for these individuals in terms of earnings afterwards.
We can clearly see the bootcamp was not worth it for these individuals in terms of earnings.
Not a whole lot.
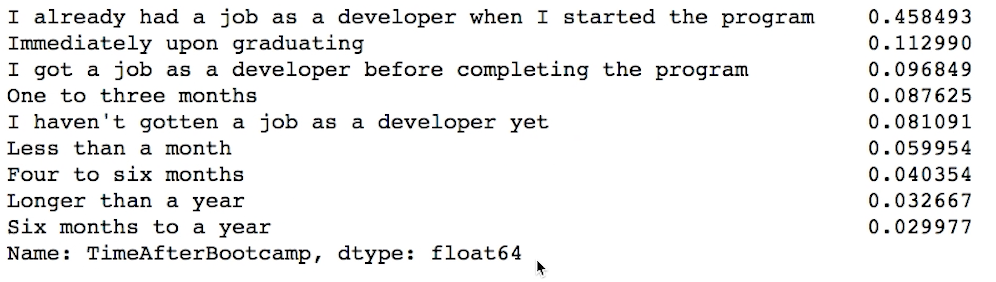
How long until you earned a job after the bootcamp?
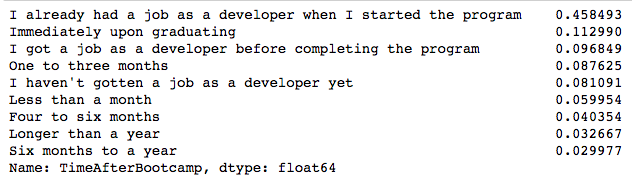
With those who already had roles as developers before the bootcamp removed, we have the following results.
Select all of the statements that you can conclude to be true based on the data above.
Most of them were placed in jobs as developers because of the bootcamp very quickly.
At least 20% of individuals earned jobs as developers upon graduation or earlier.
Approximately 46% of bootcamp grads in the dataset already had jobs as developers.
There were some big takeaways from the last screencast. Which statements were true about searching for results regarding bootcamp graduates? In case you want to look at the results of the previous screencast, the notebook is linked at the bottom of this page.
| STATEMENTS | TRUE OR FALSE |
|---|---|
| Bootcamp grads tended to earn similar salaries to one another upon bootcamp completion. | False |
| It was easy to bucket all bootcamp grads into when they were hired upon completing the bootcamp. | False |
| All bootcamp grads in the dataset were employed upon submitting their survey results. | False |
That’s right. All of these were false - it was difficult to bucket bootcamp grads based on salary or completion times, as these were extremely variable. We were able to see that not all were hired, but one option was not currently hired, and we didn’t know how long since those students completed their bootcamp.
Quiz: Job Satisfaction
Solution
It Is Not Always About ML
When looking at the first two questions:
- How to break into the field?
- What are the placement and salaries for those who attended a coding bootcamp?
we did not need to do any predictive modeling. We only used descriptive and a little inferential statistics to retrieve the results.
Therefore, all steps of CRISP-DM were not necessary for these first two questions. CRISP-DM states 6 steps:
- Business Understanding
- Data Understanding
- Data Preparation
- Modeling
- Evaluation
- Deployment
For these first two questions, we did not need step 4. In the previous notebooks, you performed steps 3 and 5 without needing step 4 at all. A lot of the hype in data science, artificial intelligence, and deep learning is integrated into step 4, but there are still plenty of questions to be answered not using machine learning, artificial intelligence, and deep learning.
All Data Science Problems Involve
- Curiosity.
- The right data.
- A tool of some kind (Python, Tableau, Excel, R, etc.) used to find a solution (You could use your head, but that would be inefficient with the massive amounts of data being generated in the world today).
- Well communicated or deployed solution.
Extra Useful Tools to Know But That Are NOT Necessary for ALL Projects
- Deep Learning
- Fancy machine learning algorithms
With that, you will be getting a more in depth look at these items, but it is worth mentioning (given the massive amount of hype) that they do not solve all the problems. Deep learning cannot turn bad data into good conclusions. Or bad questions into amazing results.
CRISP-DM - Modeling
When looking at the first two questions:
How to break into the field?
What are the placement and salaries for those who attended a coding bootcamp?
we did not need to do any predictive modeling. We only used descriptive and a little inferential statistics to retrieve the results.
Therefore, all steps of CRISP-DM were not necessary for these first two questions. The process would look closer to the following:
- Business Understanding
- Data Understanding
- Data Preparation
- Evaluation
- Deployment
However, for the last two questions:
- How well can we predict an individual’s salary? What aspects correlate well to salary?
- How well can we predict an individual’s job satisfaction? What aspects correlate well to job satisfaction?
We will need to use a predictive model. We will need to pick up at step 3 to answer these two questions, so let’s get started. The process for answering these last two questions will follow the full 6 steps shown here.
- Business Understanding
- Data Understanding
- Data Preparation
- Modeling
- Evaluation
- Deployment
Predicting Salary
In the modeling section, you will learn that step three of CRISP-DM is essential to getting the most out of your data. In this case, we are interested in using any of the variables we can from the dataset to predict an individual’s salary.
The variables we use to predict are commonly called X (or an Exploratory matrix). The column we are interested in predicting is commonly called y (or the response vector).
In this case X is all the variables in the dataset that are not salary, while y is the salary column in the dataset.
On the next page, you will see what happens when we try to use sklearn to fit a model to the data, and we will do some work to get useful predictions out of our sklearn model.
Predicting Salary through sklearn
Supervised ML Process
- Instantiate
- Fit
- Predict
- Score
Quiz: What Happened?
Solution
Working with Missing Values
There are two main ‘pain’ points for passing data to machine learning models in sklearn:
- Missing Values
- Categorical Values
Sklearn does not know how you want to treat missing values or categorical variables, and there are lots of methods for working with each. For this lesson, we will look at common, quick fixes. These methods help you get your models into production quickly, but thoughtful treatment of missing values and categorical variables should be done to remove bias and improve predictions over time.
Three strategies for working with missing values include:
- We can remove (or “drop”) the rows or columns holding the missing values.
- We can impute the missing values.
- We can build models that work around them, and only use the information provided.
Removing Data
Removing Data - Why Not?
Though dropping rows and/or columns holding missing values is quite easy to do using numpy and pandas, it is often not appropriate.
Understanding why the data is missing is important before dropping these rows and columns. In this video you saw a number of situations in which dropping values was not a good idea. These included
- Dropping data values associated with the effort or time an individual put into a survey.
- Dropping data values associated with sensitive information.
In either of these cases, the missing values hold information. A quick removal of the rows or columns associated with these missing values would remove missing data that could be used to better inform models.
Instead of removing these values, we might keep track of the missing values using indicator values, or counts associated with how many questions an individual skipped.
Removing Data - When Is It OK?
In the last video, you saw cases in which dropping rows or columns associated with missing values would not be a good idea. There are other cases in which dropping rows or columns associated with missing values would be okay.
A few instances in which dropping a row might be okay are:
- Dropping missing data associated with mechanical failures.
- The missing data is in a column that you are interested in predicting.
Other cases when you should consider dropping data that are not associated with missing data:
- Dropping columns with no variability in the data.
- Dropping data associated with information that you know is not correct.
In handling removing data, you should think more about why is this missing or why is this data incorrectly input to see if an alternative solution might be used than dropping the values.
Removing Data - Other Considerations
One common strategy for working with missing data is to understand the proportion of a column that is missing. If a large proportion of a column is missing data, this is a reason to consider dropping it.
There are easy ways using pandas to create dummy variables to track the missing values, so you can see if these missing values actually hold information (regardless of the proportion that are missing) before choosing to remove a full column.
Quiz: Removing Data
| SCENARIO | DROP |
|---|---|
| An entire column has missing values. | Ok to drop the column. |
| An entire row has missing values. | Ok to drop the row. |
| A column has a mix of heights in feet and meters. | Do not drop rows or columns. |
| For the response (the variable we want to predict), there are rows with missing values. | Ok to drop the rows. |
That’s right! If an entire column or row is missing, we can remove it, as there is no information being provided.
The column with mixed heights, we should be able to (for the most part) map those to a consistent measurement (all meters or all feet). We don’t want to just drop this.
If the response is missing, for those rows, we have nothing to predict. You might be interested in predicting those values. Without a target/response to predict, your model cannot learn. These rows are not providing information for training any sort of supervised learning model.
| SCENARIO | DROP |
|---|---|
| Only 2% of the values in the column exists. | Might be okay to drop the column, but should see if the provided data is useful. |
| There are no missing values in the column, but all values are 1. | Drop the column. |
| A column pertaining to values that should all be positive has some negative values. | Consider dropping the wrong data if there is no domain related fix for why the values are negative. |
That’s right! These were tricky!
Though it is common to drop columns just because not many values exist, there may be value to grouping rows that have a column missing as compared to rows that do not have a missing value for that particular column.
If there is no variability (all the values are the same) in a column, it does not provide value for prediction or finding differences in your data. It should be dropped for this reason. Keeping it doesn’t really hurt, but it can lead to confusing results as we will see later in this lesson.
When you have incorrect data, you do not want to input this information into your conclusions. You should attempt to correct these values, or you may need to drop them.
Quiz: Removing Data Part I
Solution
Quiz: Removing Data Part II
Solution
Imputing Missing Values
Imputation is likely the most common method for working with missing values for any data science team. The methods shown here included the frequently used methods of imputing the mean, median, or mode of a column into the missing values for the column.
There are many advanced techniques for imputing missing values including using machine learning and bayesian statistical approaches. This could be techniques as simple as using k-nearest neighbors to find the features that are most similar, and using the values those features have to fill in values that are missing or complex methods like those in the very popular AMELIA library.
Regardless your imputation approach, you should be very cautious of the BIAS you are imputing into any model that uses these imputed values. Though imputing values is very common, and often leads to better predictive power in machine learning models, it can lead to over generalizations. In extremely advanced techniques in Data Science, this can even mean ethical implications. Machines can only ‘learn’ from the data they are provided. If you provide biased data (due to imputation, poor data collection, etc.), it should be no surprise, you will achieve results that are biased.
Imputation Methods and Resources
One of the most common methods for working with missing values is by imputing the missing values. Imputation means that you input a value for values that were originally missing.
It is very common to impute in the following ways:
Impute the mean of a column.
If you are working with categorical data or a variable with outliers, then use the mode of the column.
Impute 0, a very small number, or a very large number to differentiate missing values from other values.
Use KNN to impute values based on features that are most similar.
In general, you should try to be more careful with missing data in understanding the real world implications and reasons for why the missing values exist. At the same time, these solutions are very quick, and they enable you to get models off the ground. You can then iterate on your feature engineering to be more careful as time permits.
Let’s take a look at how some of them work. Chris’ content is again very helpful for many of these items - and you can access it here. He uses the sklearn.preprocessing library. There are also a ton of ways to fill in missing values directly using pandas, which can be found here.
Quiz: Imputation Methods and Resources
Solution
Quiz: Imputing Values
Solution
Working with Categorical Variables Refresher
Notice that in the earlier video in the pre-requisites, there was a mention of dropping a column to assure your X matrix is full rank. This is not true using LinearRegression within sklearn, because there is a ridge (or L2 penalty used by default). However, dropping the columns would also be okay, it is just not required, as it is with OLS without a penalty.
You will see this holds true in the upcoming content.
Categorical Variables
One of the main ways for working with categorical variables is using 0, 1 encodings. In this technique, you create a new column for every level of the categorical variable. The advantages of this approach include:
- The ability to have differing influences of each level on the response.
- You do not impose a rank of the categories.
- The ability to interpret the results more easily than other encodings.
The disadvantages of this approach are that you introduce a large number of effects into your model. If you have a large number of categorical variables or categorical variables with a large number of levels, but not a large sample size, you might not be able to estimate the impact of each of these variables on your response variable. There are some rules of thumb that suggest 10 data points for each variable you add to your model. That is 10 rows for each column. This is a reasonable lower bound, but the larger your sample (assuming it is representative), the better.
Let’s try out adding dummy variables for the categorical variables into the model. We will compare to see the improvement over the original model only using quantitative variables.
What is Binarization?: Binarization is the process of transforming data features of any entity into vectors of binary numbers to make classifier algorithms more efficient. In a simple example, transforming an image’s gray-scale from the 0-255 spectrum to a 0-1 spectrum is binarization.
What is One Hot Encoding? Why and When Do You Have to Use it?: One hot encoding is a process by which categorical variables are converted into a form that could be provided to ML algorithms to do a better job in prediction.
Quiz: Categorical Variables
Solution
How to Fix Overfitting?
Overfitting
Overfitting is a common problem when our model does not generalize to data it has not seen before. Assuring you build models that not only work for the data the model was trained on, but also generalize to new (test) data, is key to building models that will be successful to deploy and that will become successful in production.
Quiz: Putting It All Together
Solution
Quiz: Results
CRISP-DM
In working with missing values, categorical variables, and building out your model, it was probably easy to lose sight of the big picture of the process. Let’s take a quick second to recap that here, and pull together the results you should have arrived through your analysis.
- Business Understanding
- How do I break into the field?
- What are the placement and salaries of those who attended a coding bootcamp?
- How well can we predict an individual’s salary? What aspects correlate well to salary?
- How well can we predict an individual’s job satisfaction? What aspects correlate well to job satisfaction?
- Data Understanding
- Here we used the Stack Overflow data to attempt to answer our questions of interest. We did
1.and2.in tandem in this case, using the data to help us arrive at our questions of interest. This is one of two methods that is common in practice. The second method that is common is to have certain questions you are interested in answering, and then having to collect data related to those questions.
- Here we used the Stack Overflow data to attempt to answer our questions of interest. We did
- Data Preparation
- This is commonly denoted as 80% of the process. You saw this especially when attempting to build a model to predict salary, and there was still much more you could have done. From working with missing data to finding a way to work with categorical variables, and we didn’t even look for outliers or attempt to find points we were especially poor at predicting. There was ton more we could have done to wrangle the data, but you have to start somewhere, and then you can always iterate.
- Modeling
- We were finally able to model the data, but we had some back and forth with step
3.before we were able to build a model that had okay performance. There still may be changes that could be done to improve the model we have in place. From additional feature engineering to choosing a more advanced modeling technique, we did little to test that other approaches were better within this lesson.
- We were finally able to model the data, but we had some back and forth with step
- Evaluation
- Results are the findings from our wrangling and modeling. Below are some questions to recap the results found so far.
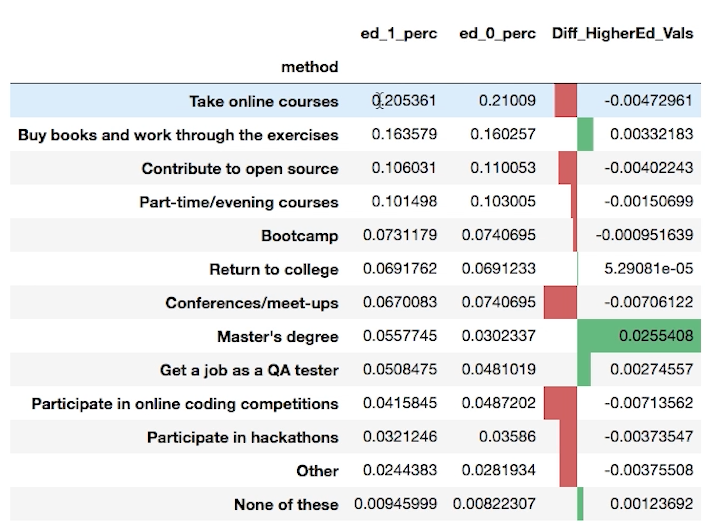
Use the images above and below this question to assist as necessary with this question. Select all that were results we found in the data when looking at the first question regarding breaking into the field.
The largest proportion of individuals suggests breaking into the filed by taking online courses.
There was evidence to suggest that those with higher degree are more likely to suggest other pursue higher degrees to break into the field.
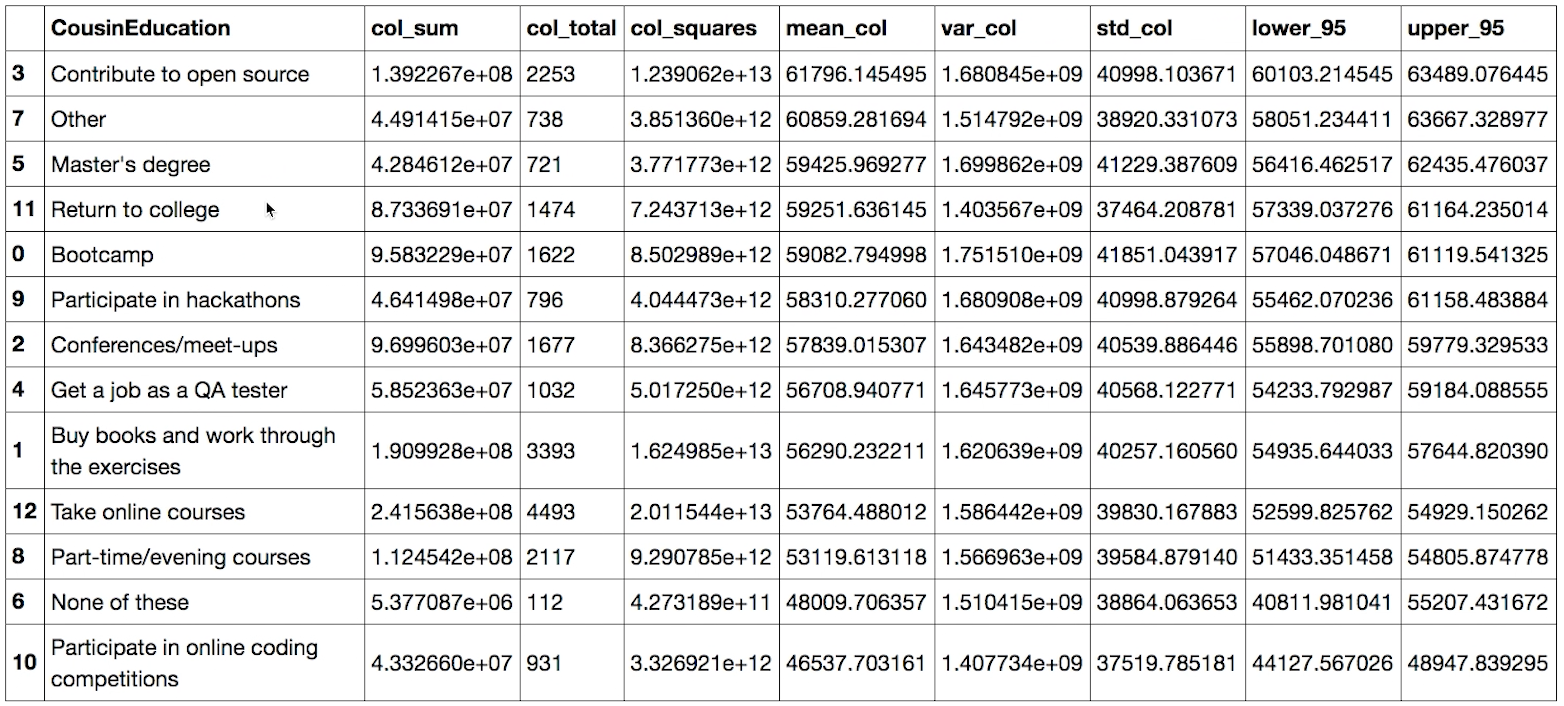
The average salary was highest for those that suggested contributing to open source as a method to break into the field.
Select all that were results we found in the data when looking at bootcamp graduation rates and salaries.
It was easy to see that bootcamps helped individual’s earn more.
It’s easy to see that the bootcamp was a fast track to new roles as data scientists and developers.
There was very little that was easily clear about statistics about bootcamp graduates.
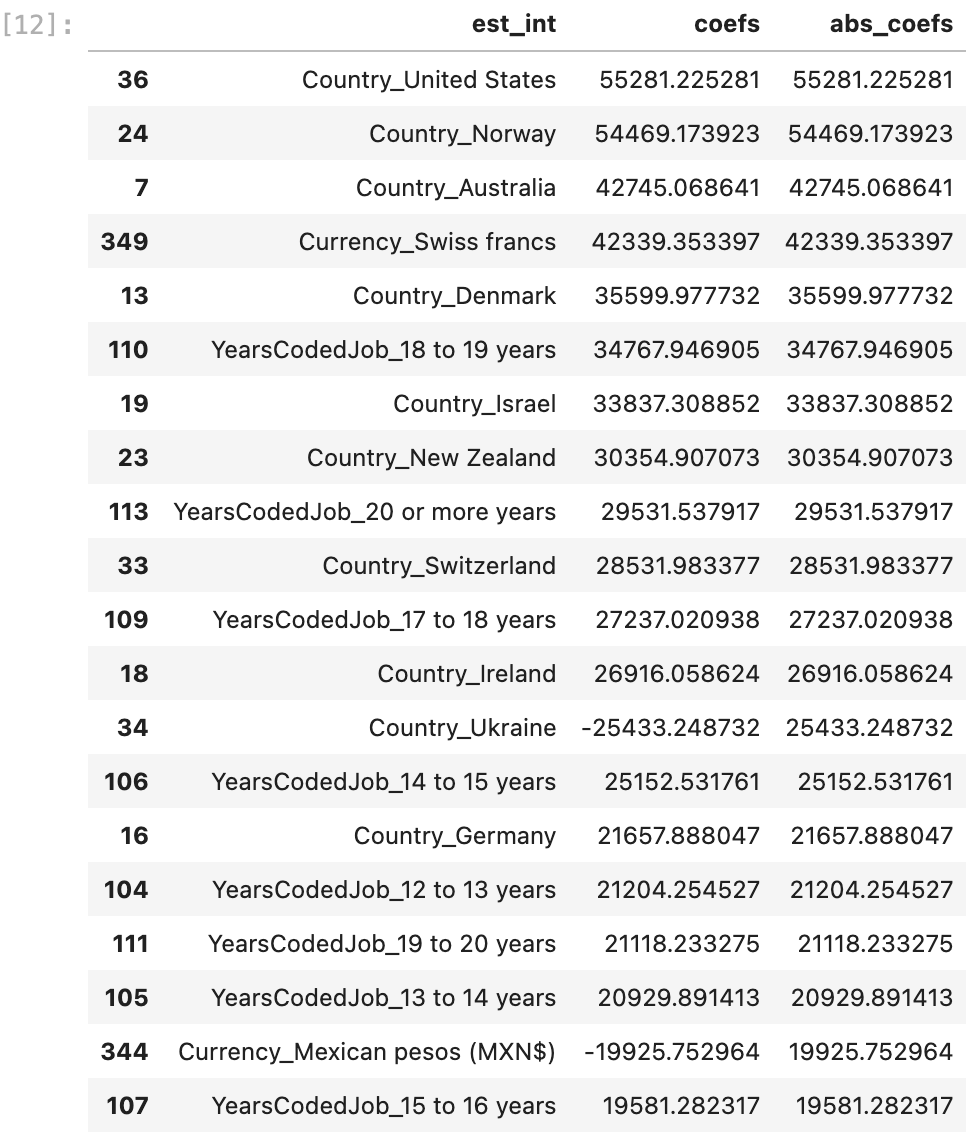
From the results of your predictive model for predicting salary, select all that were true.
It was important to get a model that fit the data well before drawing conclusions.
We found that where an individual lives is one of the greatest indicators of salary.
We found that years of experiences was one of the greatest indicators of salary.
That’s right! These are the results that non-developers want to hear about. They want to know the real world takeaways of your models. You need to communicate these details clearly.
Select all that were true regarding fitting your predictive model to predict salary.
You encountered errors when working with NaN values.
You encountered errors when working with categorical variables.
There are times when you can drop rows or columns, as well as times when you should not.
Imputing can assist in building models, but often it is important to consider why values are missing to improve models.
You normalized the features of your X matrix before fitting your model.
That’s right! There are a lot of things that can go wrong when fitting models. In this lesson, we found a lot of common and easy work arounds. This is often done in practice to get models into production more quickly, but the bias introduced by these models could be dangerous as machine learning integrates more heavily into our daily lives, and models aren’t just used for clicks, but for decisions that involve more ethical implications. Discussion around these topics are currently more so aimed at developers, but pretty soon everyone will need to be having these discussions as machine learning becomes more and more a part of our daily lives.
CRISP-DM - Evaluation & Deployment
Two techniques for deploying your results include:
- Automated techniques built into computer systems or across the web. You will do this later in this program!
- Communicate results with text, images, slides, dashboards, or other presentation methods to company stakeholders.
To get some practice with this second technique, you will be writing a blog post for the first project and turning in a Github repository that shares your work.
As a data scientist, communication of your results to both other team members and to less technical members of a company is a critical component
Recap
CRISP-DM
In working with missing values, categorical variables, and building out your model, it was probably easy to lose sight of the big picture of the process. Let’s take a quick second to recap that here, and pull together the results you should have arrived through your analysis.
- Business Understanding
- How do I break into the field?
- What are the placement and salaries of those who attended a coding bootcamp?
- How well can we predict an individual’s salary? What aspects correlate well to salary?
- How well can we predict an individual’s job satisfaction? What aspects correlate well to job satisfaction?
- Data Understanding
- Here we used the Stack Overflow data to attempt to answer our questions of interest. We did
1.and2.in tandem in this case, using the data to help us arrive at our questions of interest. This is one of two methods that is common in practice. The second method that is common is to have certain questions you are interested in answering, and then having to collect data related to those questions.
- Here we used the Stack Overflow data to attempt to answer our questions of interest. We did
- Data Preparation
- This is commonly denoted as 80% of the process. You saw this especially when attempting to build a model to predict salary, and there was still much more you could have done. From working with missing data to finding a way to work with categorical variables, and we didn’t even look for outliers or attempt to find points we were especially poor at predicting. There was ton more we could have done to wrangle the data, but you have to start somewhere, and then you can always iterate.
- Modeling
- We were finally able to model the data, but we had some back and forth with step
3.before we were able to build a model that had okay performance. There still may be changes that could be done to improve the model we have in place. From additional feature engineering to choosing a more advanced modeling technique, we did little to test that other approaches were better within this lesson.
- We were finally able to model the data, but we had some back and forth with step
- Evaluation
- Results are the findings from our wrangling and modeling. They are the answers you found to each of the questions.
- Deployment
- Deploying can occur by moving your approach into production or by using your results to persuade others within a company to act on the results. Communication is such an important part of the role of a data scientist.
Communicating to Stakeholders
Introduction
- Code
- Data Visualizations
- Written Communication
- Spoken Communication
First Things First
A Good README Has:
- Motivation
- File Descriptions
- How to interact with your project
- Licensing
- Authors
- Acknowledgements
README Showcase
Let’s take a look at some of the qualities of good README files. In the last video, you saw that a good README should have:
- Installations
- Project Motivation
- File Descriptions
- How to Interact with your project
- Licensing, Authors, Acknowledgements, etc.
A full Udacity course on this topic can be found here.
Let’s take a look at a few profiles that do this well, so you can have some model examples to follow when putting together your project profile.
Example 1: Bootstrap
An example a good README is shown here. Boostrap, as you can see from their logo, is a way to quickly build projects to deploy on the web.
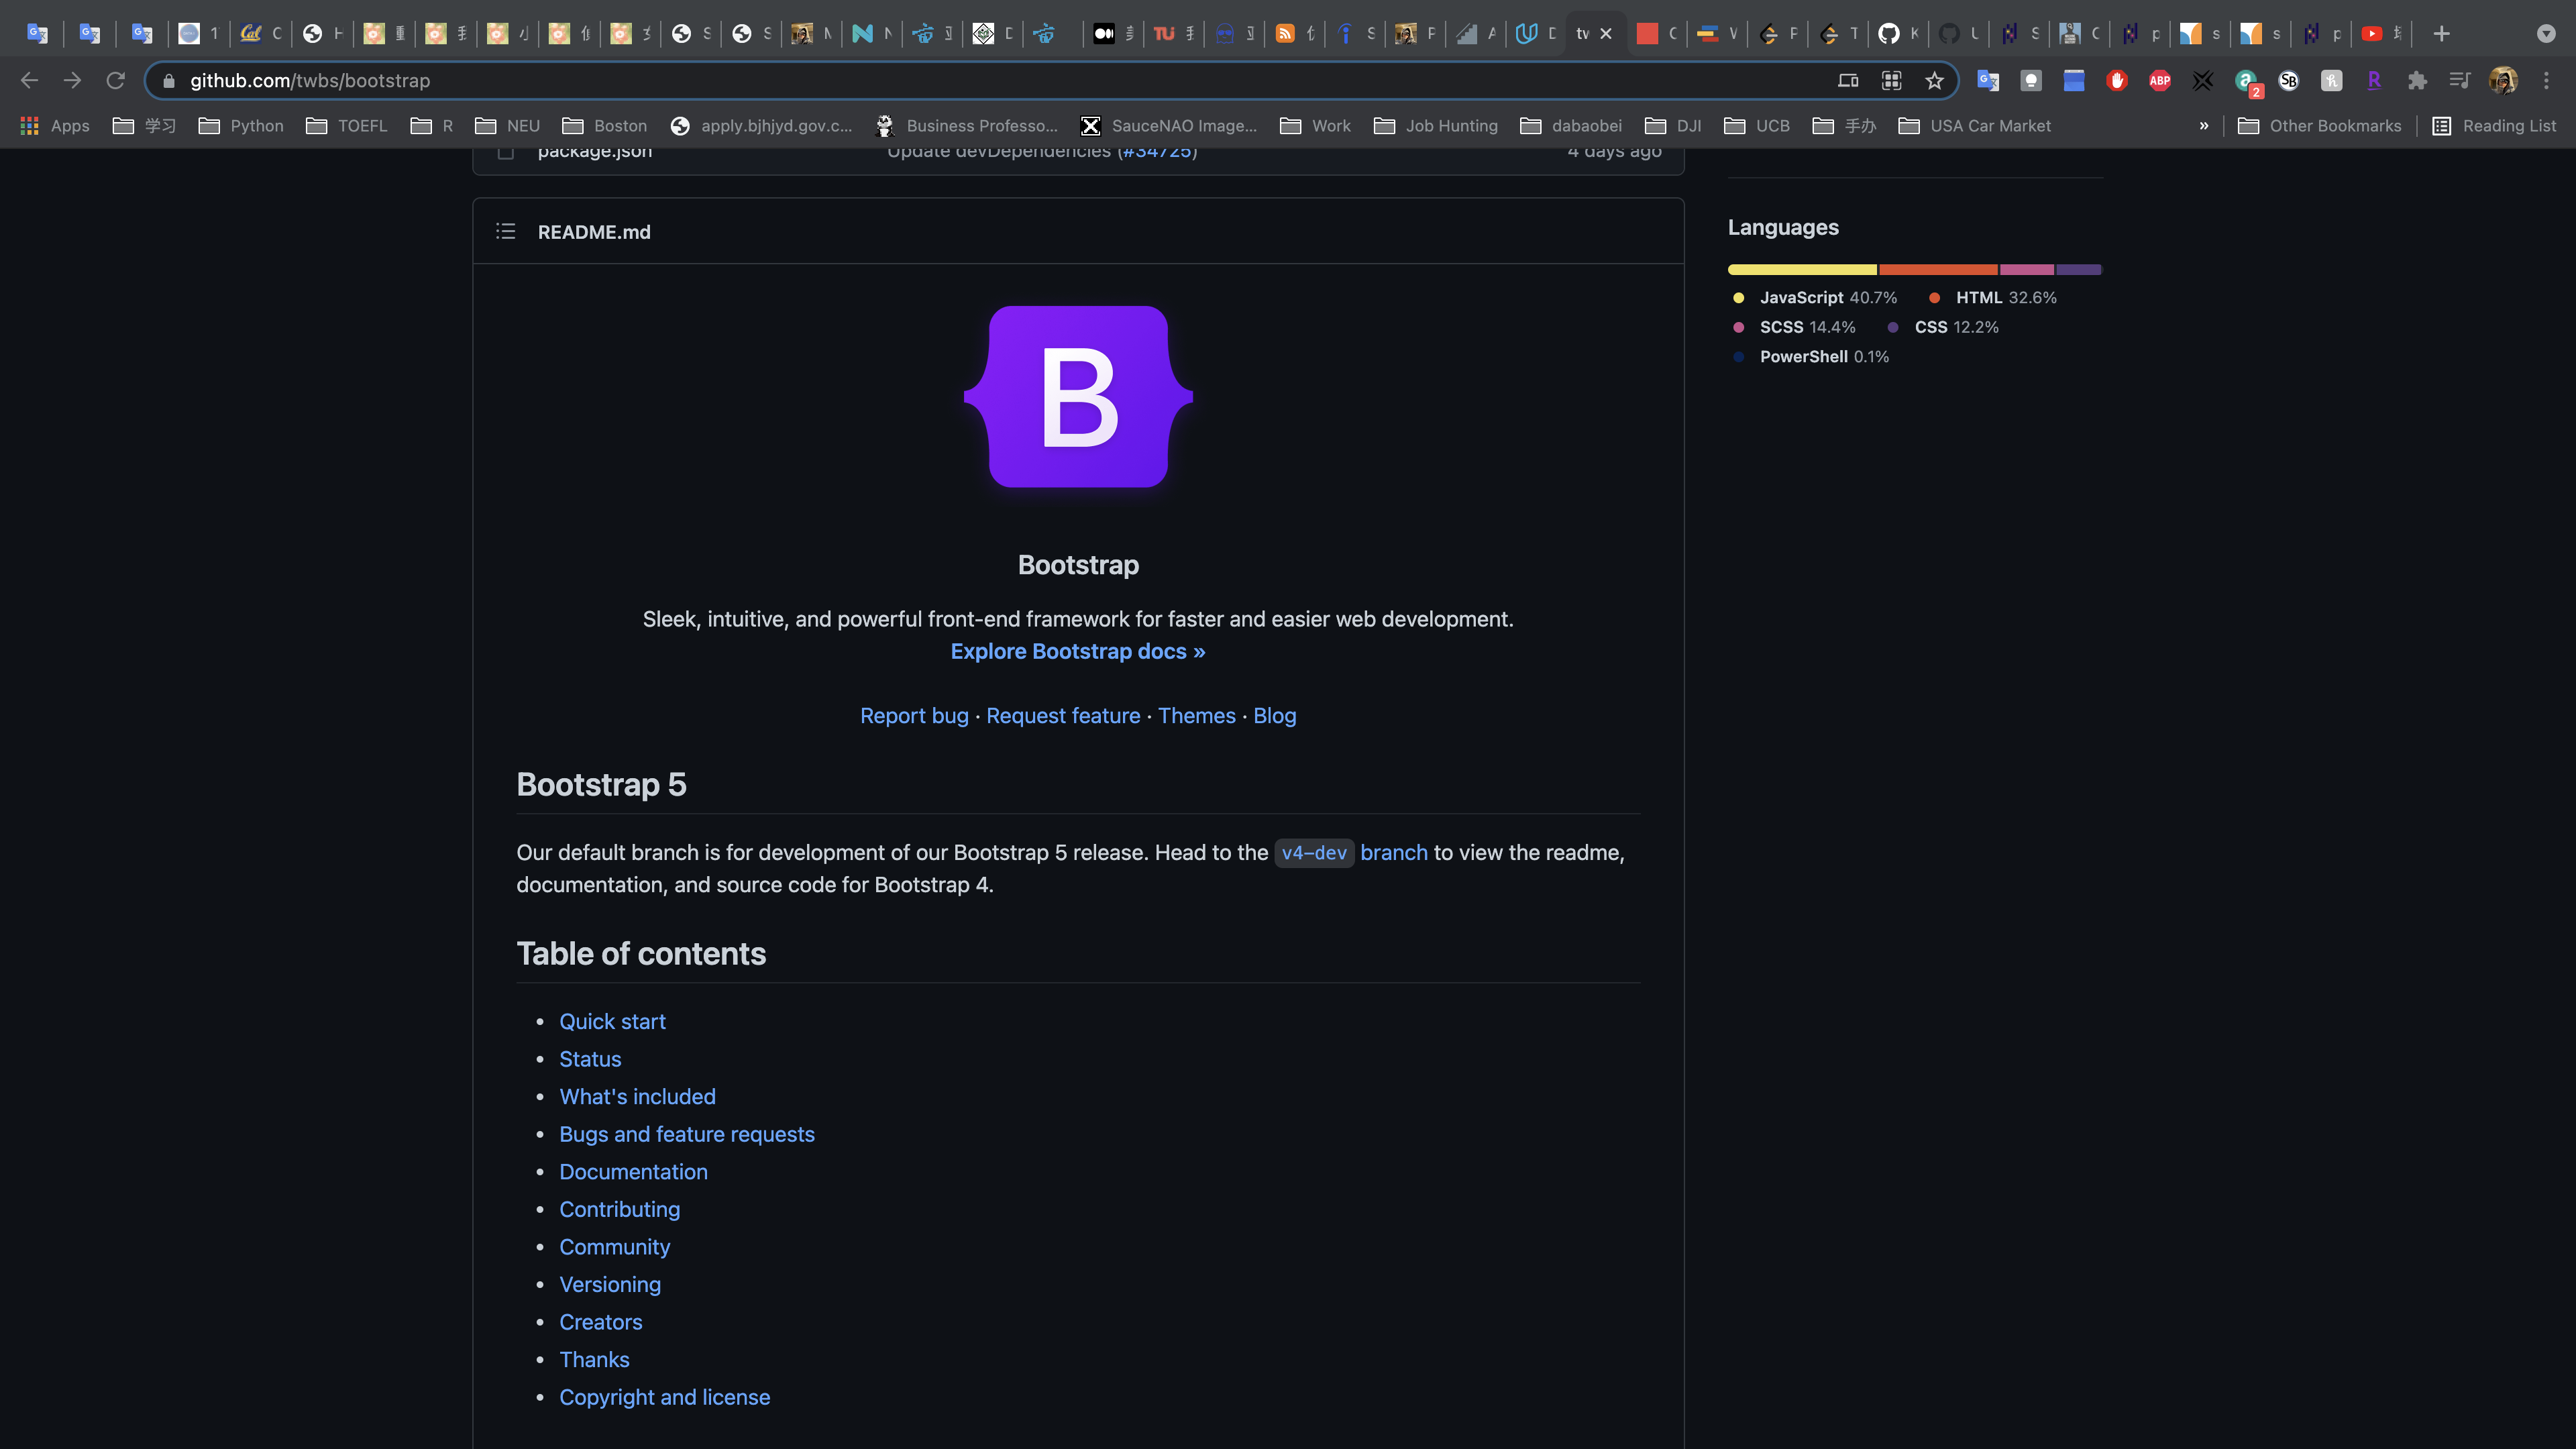
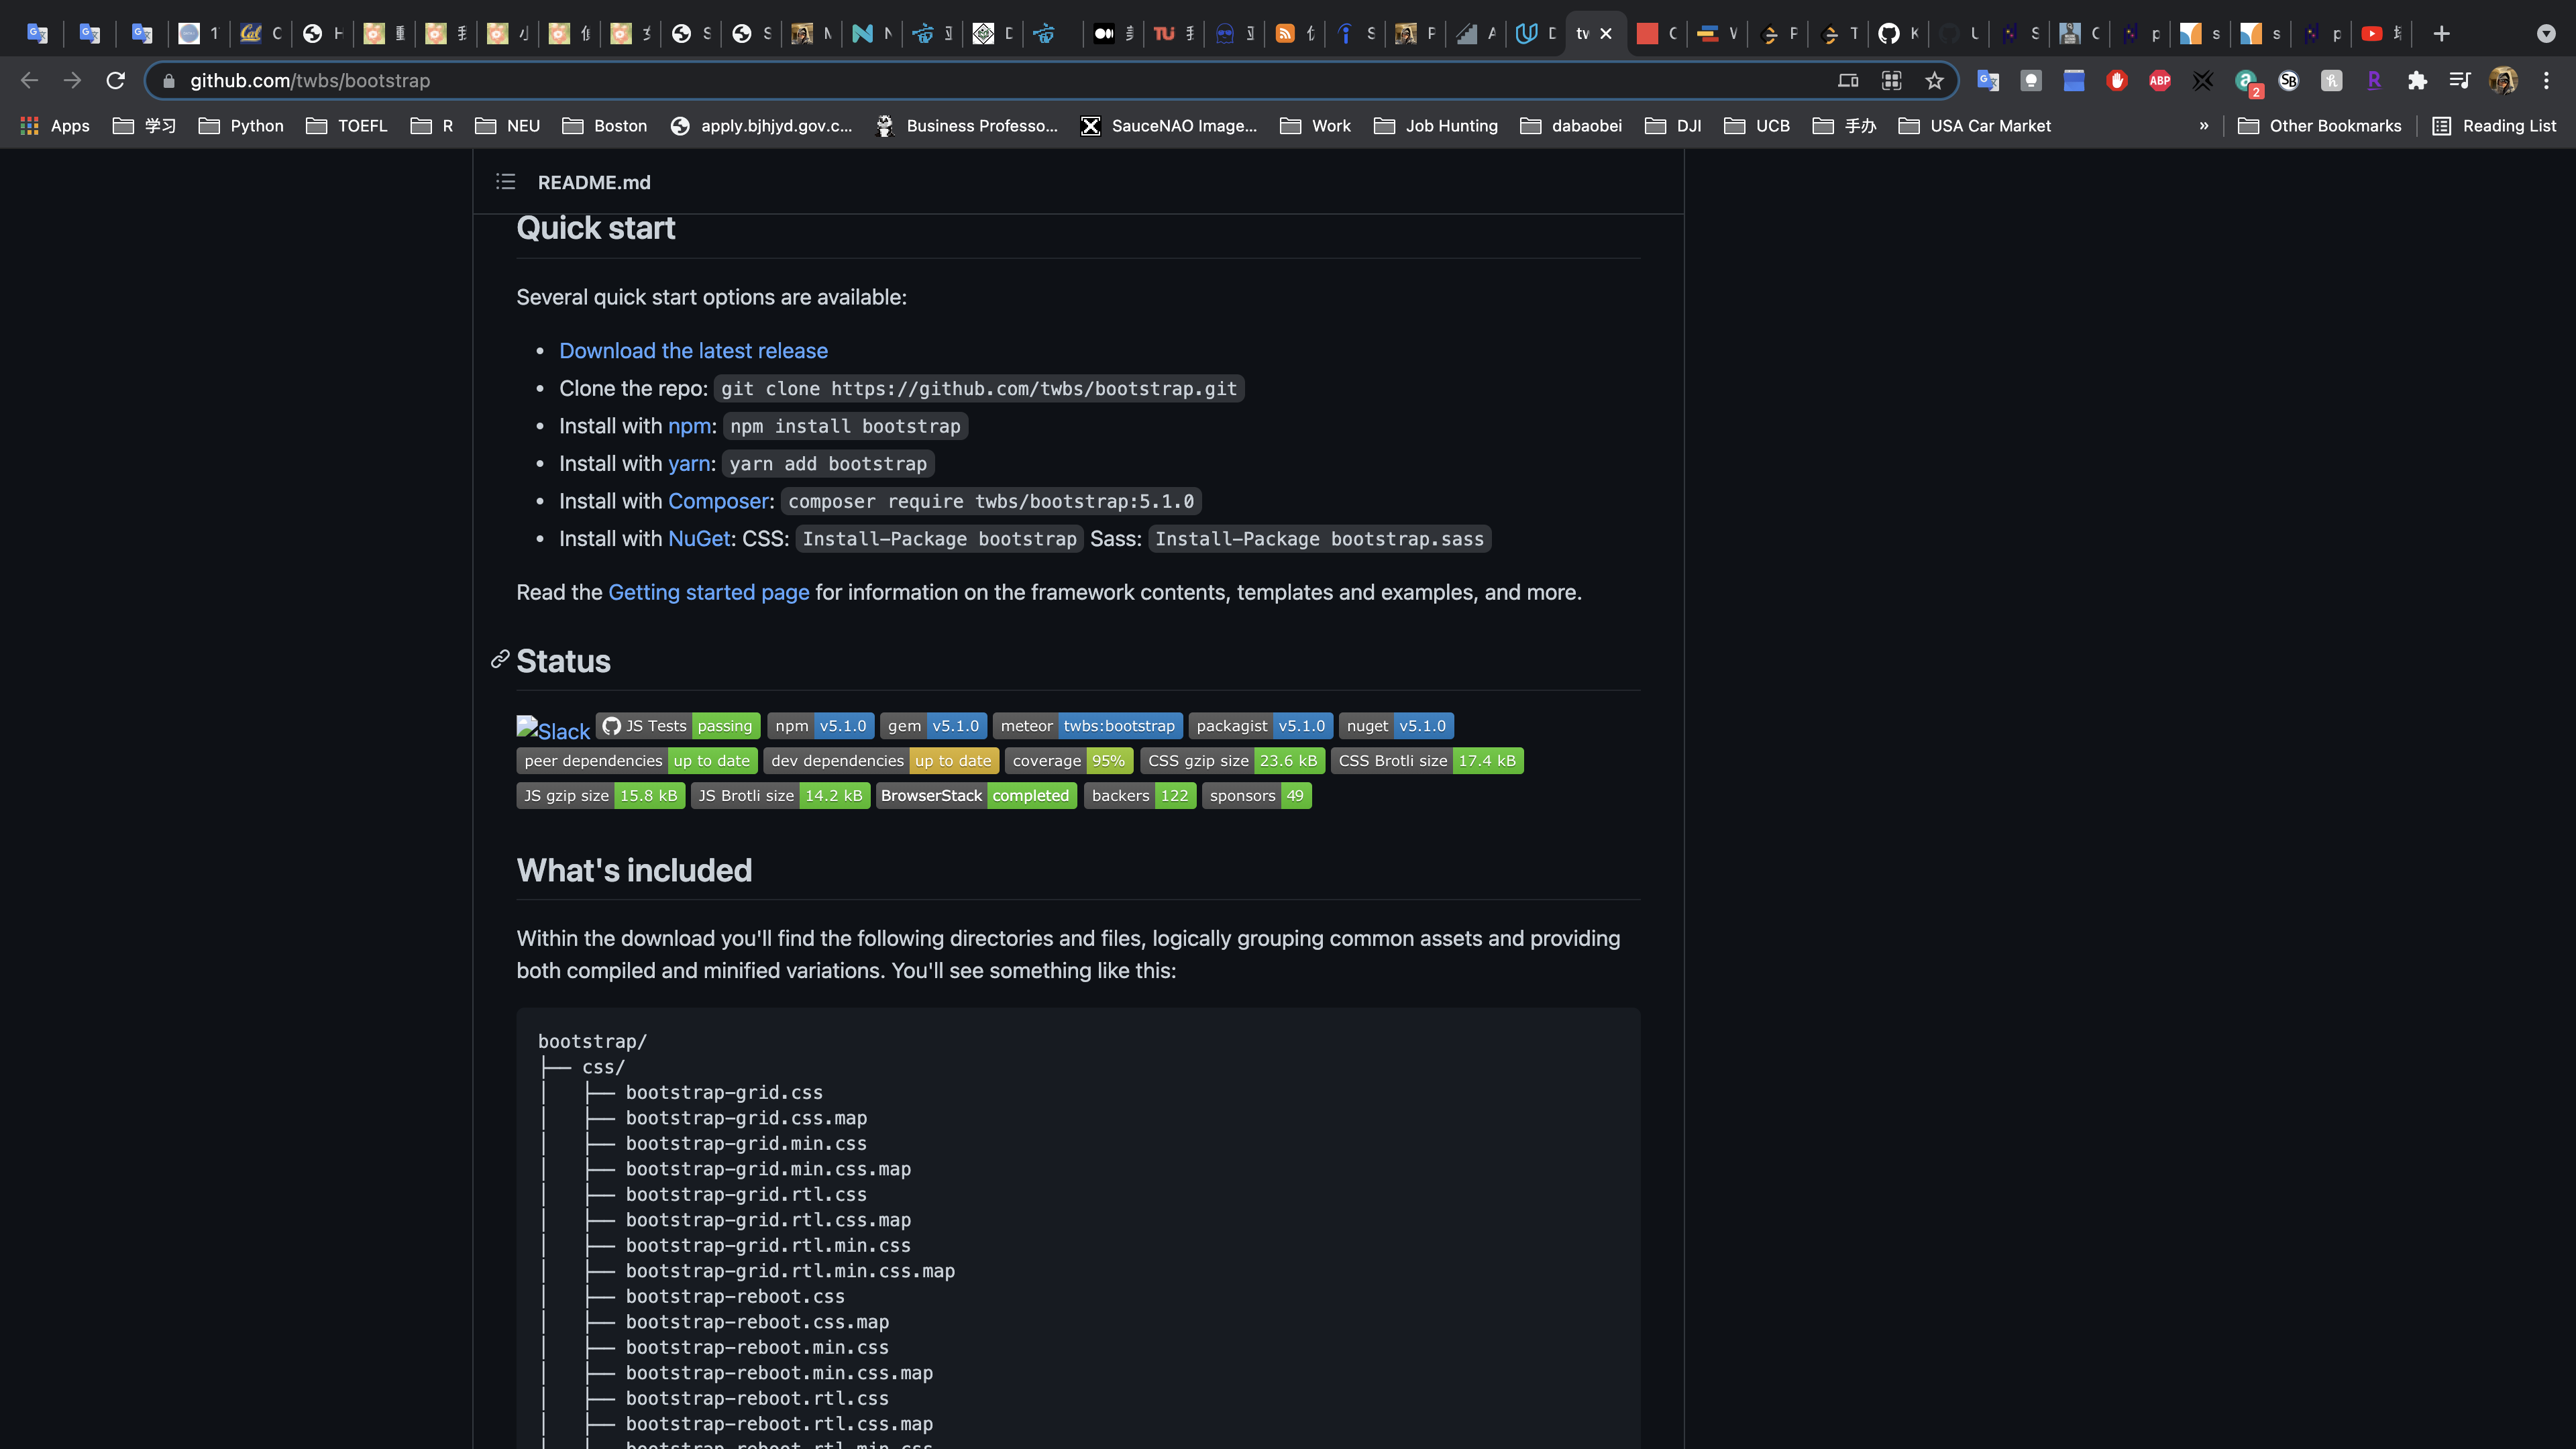
Not only does this README have all of the information of a good README file, it also provides a table of contents to quickly navigate! Depending on how long your README file is, providing a table of contents is an excellent idea for helping others navigate your documentation.
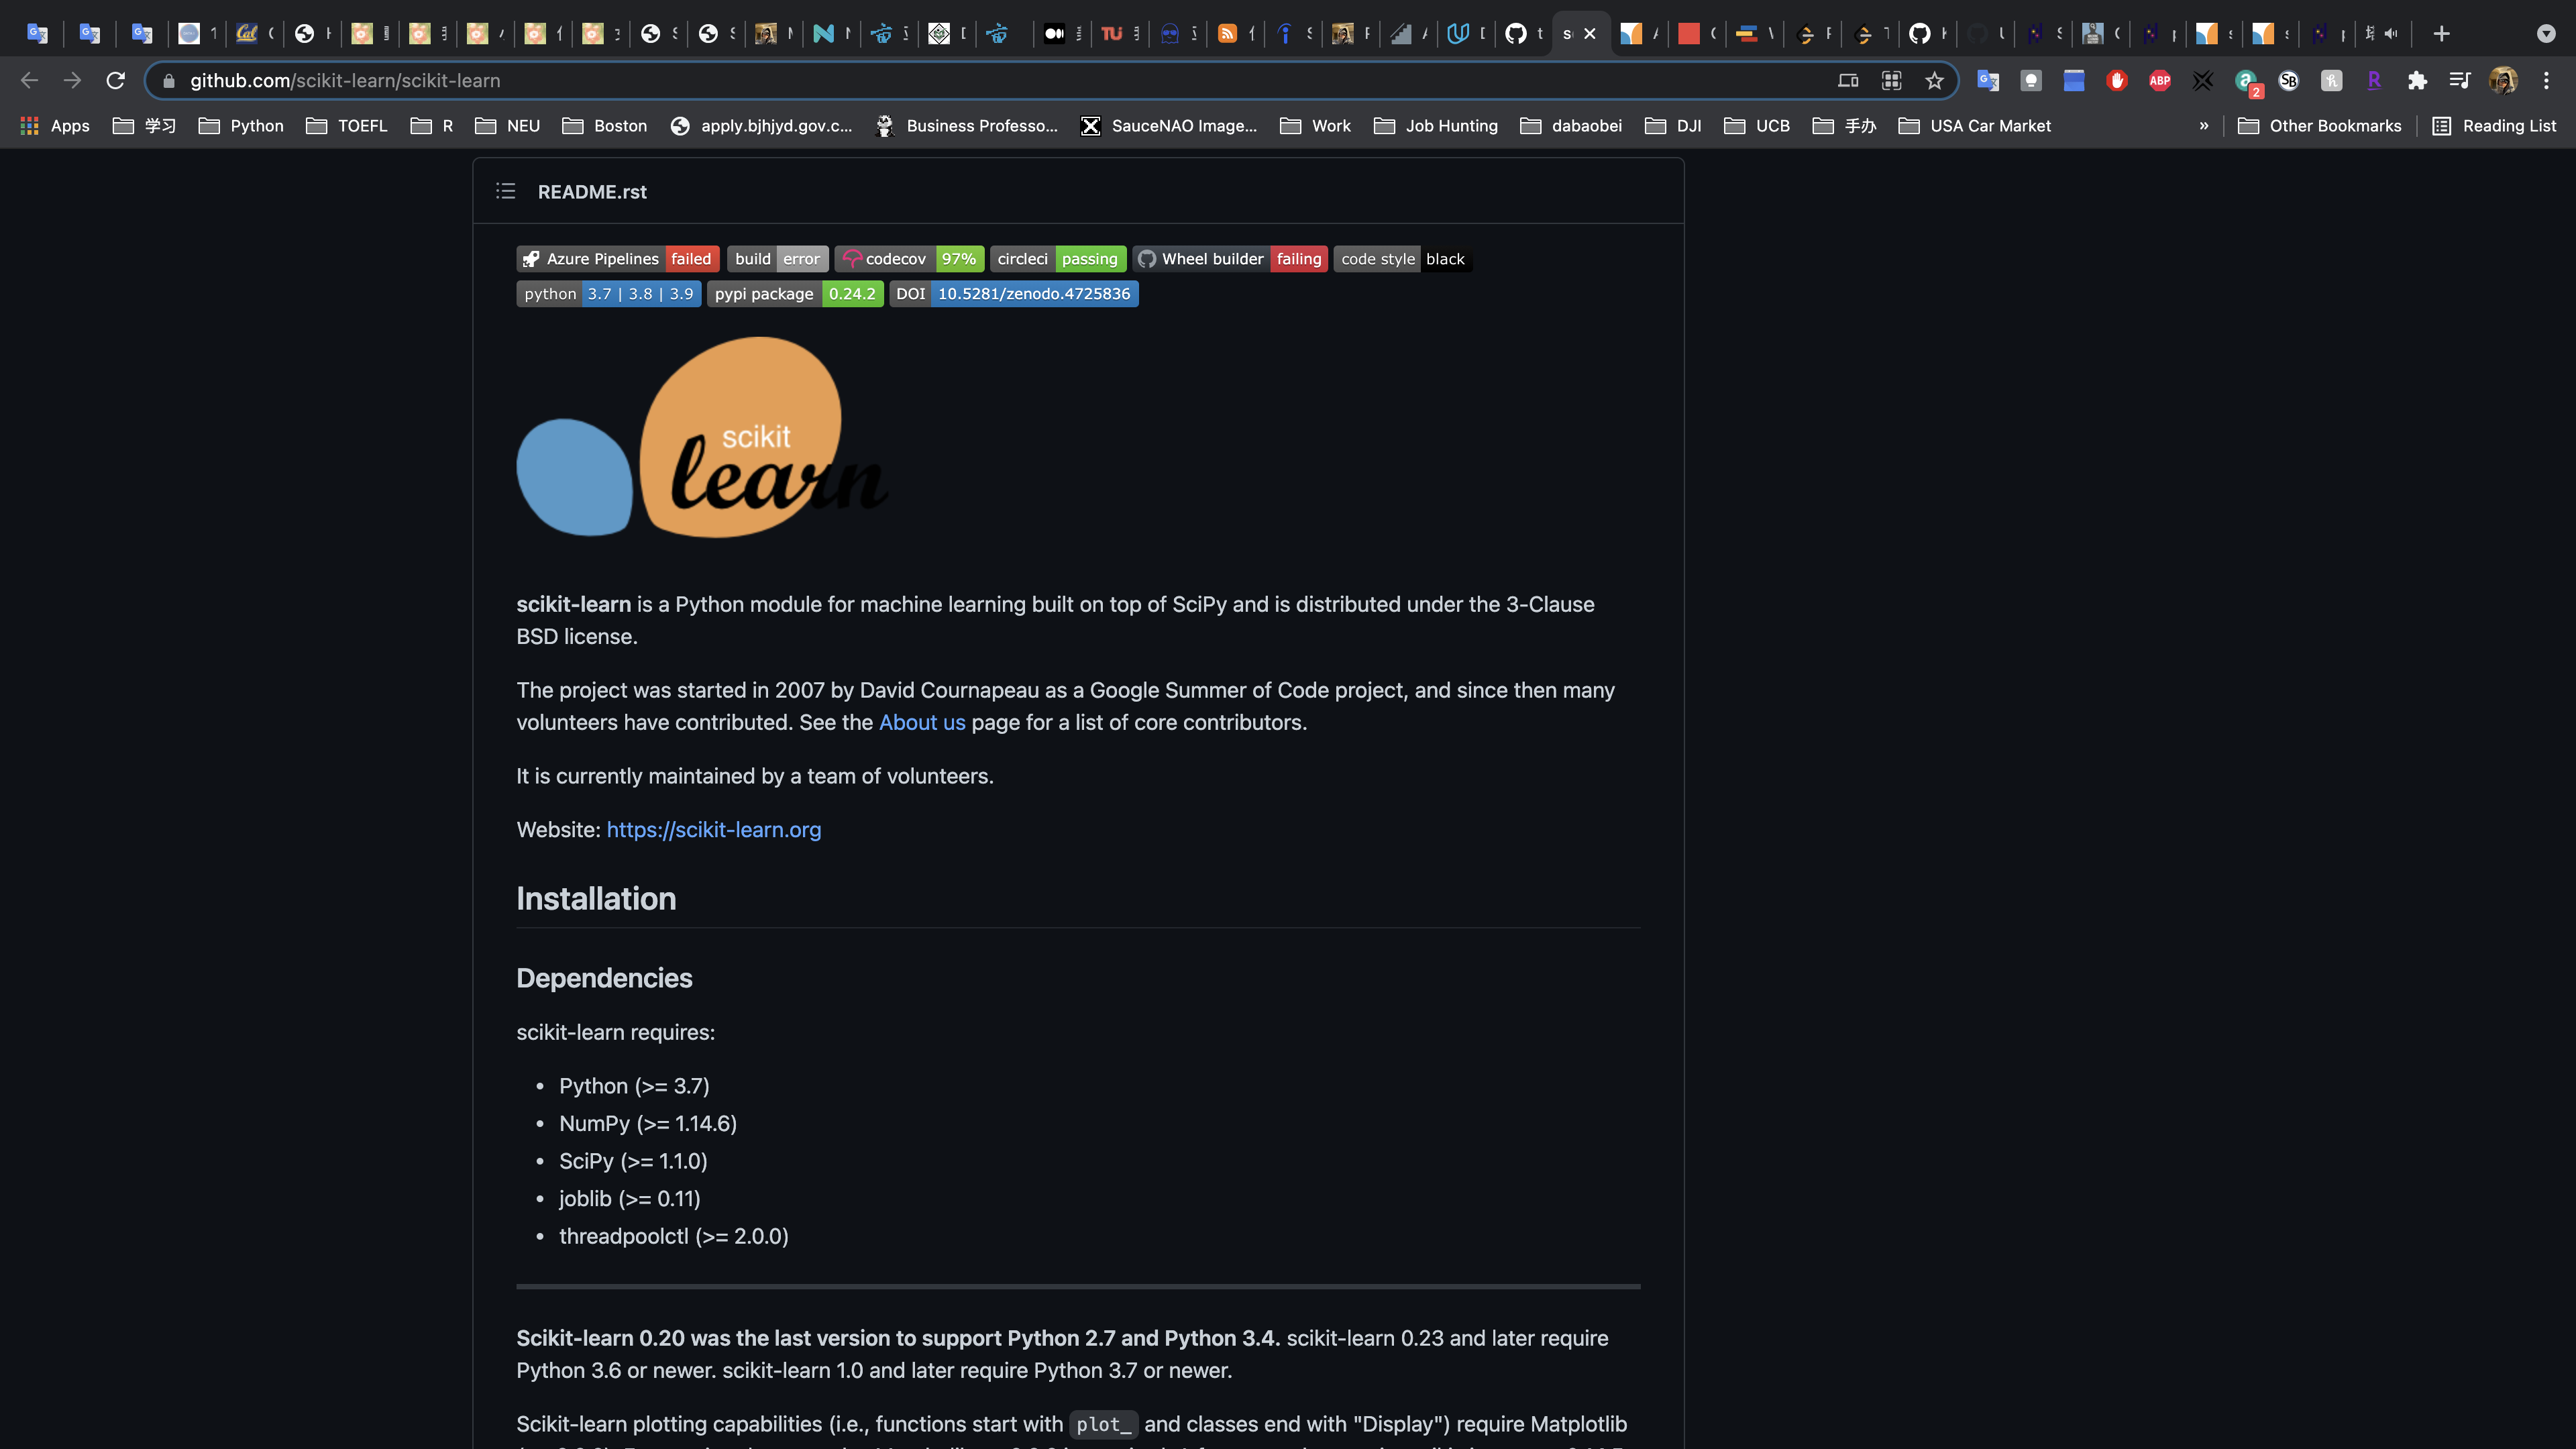
Example 2: Scikit-Learn
Another example of great documentation is through the scikit-learn documentation (also known as sklearn). Though you can get all of the information from the documentation linked in the title, the community surrounding scikit-learn has added the documentation you likely find when you Google search for particular functionality.
Therefore, the limited description of how to use this library in the README is due to the massive amount of information surrounding scikit-learn in other documentation. You can find an example of the documentation that walks you through using this extensive library here.
Example 3: Stack Overflow Blog
Now, Example 1 and 2 above aimed at assisting others with building their own websites or machine learning models using the provided code. In your case, you are showcasing your work and insights. It is still important that you provide:
- Installation - Extra libraries that are not installed with the Anaconda distribution, as well as what what version of python you are using should be noted.
- Project Motivation - Discuss what your project is about, and what interested you in pursuing the project.
- File Descriptions - Guide others through the files in your repository. You may not talk about every file here, but you should let them know where they can find the work they might find most interesting.
- How To Interact With Your Project - When your project isn’t meant to be interactive or used for other projects, you should instead talk about the technical details of your project. What were your results? What did you do to improve them? What methods did you try? What worked? What didn’t work?
- Licensing, Authors, Acknowledgements - You always want to give credit where necessary. Acknowledge other contributors, helpful peers, data providers, etc.
You can use this to assist as a template for your own post
Posting to Github
Useful Commands
From this video, you saw the use of the following commands:
git clone- clone a repository from any url to your local machinegit add *- adds all the files of the repository to the staging areagit commit -m 'comment about changes made'- commits changes and adds a message for changes madegit push- pushes your changes to a remote repository
Medium
Medium Getting Started Post and Links
If you are brand new to Medium, this is an excellent post on how to get started. It is essentially all you need to get started and take off to create your own awesome content.
Additionally, this post is useful for helping you stay motivated and keeping your readers connected. We will talk more about some of these tips in the rest of this lesson, but this is a nice post to keep close by.
How To Attract Users?
Throughout the rest of this lesson, I will provide some of the tips and tricks I have pieced together through conversations with insiders at Udacity and my own experiences. However, the post here is also very useful as you get started putting together your own posts and are looking to attract new users.
When To Post?
Though the plots on the post here are mostly terrible, there is a lot of useful information about the timing of your posts in order to attract users to your posts provided. Using other social media accounts to advertise your posts is a great way to attract more people to your post.
Medium Posts Are About Anything And Everything, Any Specific Tips For Data Story Telling?
Some additional tips about data storytelling are provided in the post here.
Looking through the posts on this page, can get you thinking about what you liked and didn’t like about the posts you saw as well. Which ones were you most motivated to finish? Why do you think that was? What sentences resonated with you? What was it about the page layout that helped or hindered your understanding of the information?
In general, everyone has their own style. However, there are still some best practices that can be followed. You will learn more about that throughout the rest of this lesson, but hopefully these links already have thinking about how you can start putting together your own posts!
Can You Make Money by Blogging on Medium?
The simple answer to this question is “Yes“. Here are two posts to assist you if this is a goal for you.
From everything I can tell, this is likely to be more of a side hustle than a full time job for most individuals. However, it is a great way to get noticed and help you stand out from other candidates in an interview process.
Know Your Audience
Technical Audience Discussion Topics
- Technical details
- Edge Cases
- Data Integrity Issues
- Thought Process
- Creative Solution
Broad Audience Discussion Topics
- Questions of Interest
- Results for Each
- Everyone Relates Better to Visuals
Three Steps to Captivate Your Audience
- How to pull in a reader
- How to keep reader engaged
- How to close your post
First Cath Their Eye
Picture First, Title Second
Select all that are true as you begin writing your post.
You should start writing your post from the beginning and work through it sequentially.
You should think of captivating your audience with a great image, first. A corresponding, catchy title, second.
You should always keep your audience in mind as you work through the post.
More Advice
100m Articles Analyzed: What You Need To Write The Best Headlines [2021]
Take another look at the article here. What did this article do well?
Breaks up white space.
Tries to relate to a problem the reader is facing.
Provides call to action at the end of the article.
Uses an image + tile on introduction.
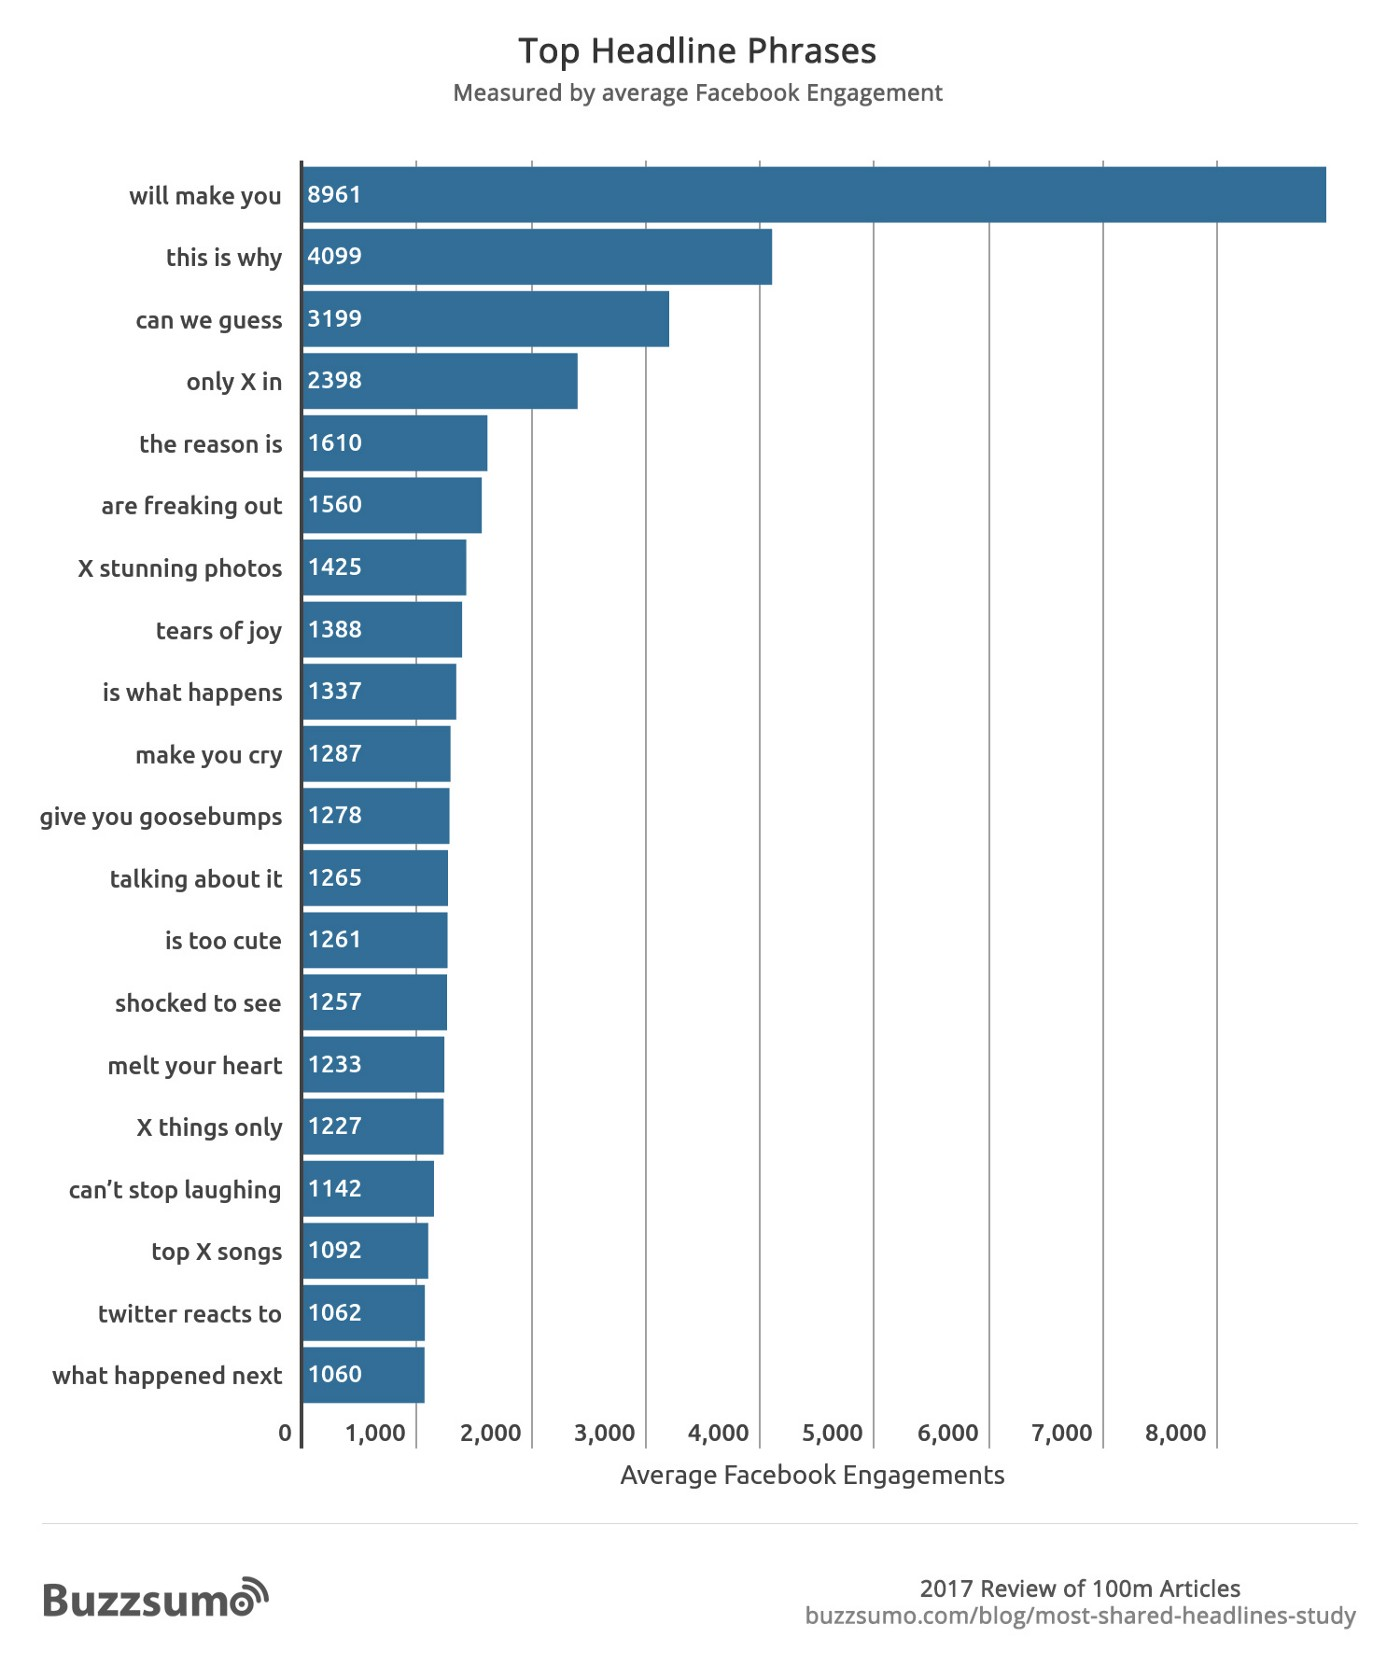
That’s right! You can tell this guy works in marketing! He follows all the rules. There isn’t anything particularly spectacular about this post. The image is meh. The value of the content is okay. But it didn’t move you, there was no compelling story, and I didn’t really leave with a higher motivational spirit.
The article simply followed the rules, and it earned 1,400 claps. That is a lot for no motivational movement!
End with a Call to Action
How to end your post:
- Reiterate the main points
- Call to action
Here is an example of a post that relates to the findings from the previous lesson using the Stack Overflow survey. Match each part I below to the appropriate part II.
| PART I | PART II |
|---|---|
| The call to action for this article | How will YOU break into the field? |
| What was interesting about job satisfaction and salary? | They tended to move together. |
| What did the majority believe about breaking into the field? | Take online course. |
| Was there evidence of bias of developers with higher degrees suggesting others do the same? | Yes |
Other Important Information
Logistics Reminders
- Short and Sweet
- 1 - 2 pages
- 200 - 500 words
- Less than 8 mins
- Create an outline
- Review your work
Recap
You are so ready to take on this project! I hope you are excited to create your own post! There was a lot to take away from this lesson. Here were the big points I had in mind:
Related to Marketing Yourself
- Catchy image followed by a catchy title.
- Write in small blocks of text, as large blocks of text will exhaust and demotivate your reader.
- Start with an engaging question or current event that your audience is likely thinking about.
- End with a recap and a call to action.
Related to Keeping Yourself and Your Reader Motivated
- Keep your post short and sweet. 1-2 pages per post will increase audience engagement, as well as the likelihood you complete the writing of your post.
- Create an outline. A useful outline for your post could just be: introduction, each of your questions, and then a conclusion. This will help you stay focused when writing your post.
- Review. Review. Review. When you think you have reviewed enough, find someone else to review. The more review you have of your work, the better it will become.
The three Text portions of this class contain A LOT of useful information. Use them for reference as you complete your project, and as you continue to write more posts in the future!
Conclusion
Project: Write a Data Science Blog Post
Project Overview
Project Motivation and Details
Data
For this project, you will pick a dataset. Inspired by Robert, there are a few public datasets from AirBnB available below, but you may also choose a dataset similar to what was used in the lessons, or an entirely different dataset. Using your dataset, you will choose 3 questions you aspire to answer from the data.
Stack Overflow Data - 2017 Survey
You might have different questions about the 2017 StackOverflow survey data than I looked at earlier in the course. If you choose this dataset, you can not use the same questions that were analyzed earlier in the classroom.
Alternatively, if you felt pretty confident with the techniques in this lesson, you might be looking to push the envelope. In this case, you may choose to retrieve all of the Stack Overflow Survey - Multiple Years results. From this data, you could analyze trends over time. What languages were most popular in each year? What other changes can you observe over time?
Seattle AirBNB Data
The Seattle AirBnB homes data can be used at the above link. You might pair this with the Boston AirBnB data, which can be found at the link below.
Boston AirBNB Data
If you are looking to really challenge yourself, data from Seattle and Boston AirBNB homes can be used to understand how much AirBNB homes are earning in certain time frames and areas. You can compare rates between the two cities, or try to understand if there is anything about the properties that helps you predict price. Can you find negative and positive reviews based on text? This dataset requires a number of skills beyond those shown thus far in the course, but if you would like a challenge, this will certainly test your ability to work with messy, real world data.
You can find additional AirBnB data at the link here.
Choose A Dataset of Your Own
You are welcome to use Kaggle or another platform (or your own data) to create a blog and Github post instead of using the datasets discussed above.
Key Steps for Project
Feel free to be creative with your solutions, but do follow the CRISP-DM process in finding your solutions.
- Pick a dataset.
- Pose at least three questions related to business or real-world applications of how the data could be used.
- Create a Jupyter Notebook, using any associated packages you’d like, to:
- Prepare data:
- Gather necessary data to answer your questions
- Handle categorical and missing data
- Provide insight into the methods you chose and why you chose them
- Analyze, Model, and Visualize
- Provide a clear connection between your business questions and how the data answers them.
- Communicate your business insights:
- Create a GitHub repository to share your code and data wrangling/modeling techniques, with a technical audience in mind
- Create a blog post to share your questions and insights with a non-technical audience
Your deliverables will be a Github repo and a blog post. Use the rubric here to assist in successfully completing this project!