test
The Basics of Employee Benefits
The Benefits of Cafeteria Plans
Heading the list of must-have benefits is medical insurance, but many job applicants also demand a retirement plan, disability insurance and more.
Benefit Basics
The law requires employers to provide employees with certain benefits. You must:
- Give employees time off to vote, serve on a jury and perform military service.
- Comply with all workers’ compensation requirements.
- Withhold FICA taxes from employees’ paychecks and pay your own portion of FICA taxes, providing employees with retirement and disability benefits.
- Pay state and federal unemployment taxes, thus providing benefits for unemployed workers.
- Contribute to state short-term disability programs in states where such programs exist.
- Comply with the Federal Family and Medical Leave (FMLA).
You are not required to provide:
- Retirement plans
- Health plans (except in Hawaii)
- Dental or vision plans
- Life insurance plans
- Paid vacations, holidays or sick leave
Expensive Errors
Providing benefits that meet employee needs and mesh with all the laws isn’t cheap–benefits probably add 30 to 40 percent to base pay for most employees–and that makes it crucial to get the most from these dollars. But this is exactly where many small businesses fall short because often their approach to benefits is riddled with costly errors that can get them in financial trouble with their insurers or even with their own employees. The most common mistakes:
Absorbing the entire cost of employee benefits. Fewer companies are footing the whole benefits bill these days. According to a survey of California companies by human resources management consulting firm William M. Mercer, 91 percent of employers require employee contributions toward health insurance, while 92 percent require employees to contribute toward the cost of insuring dependents. The size of employee contributions varies from a few dollars per pay period to several hundred dollars monthly, but one plus of any co-payment plan is it eliminates employees who don’t need coverage. Many employees are covered under other policies–a parent’s or spouses, for instance–and if you offer insurance for free, they’ll take it. But even small co-pay requirements will persuade many to skip it, saving you money.
Health Insurance
Health insurance is one of the most desirable benefits you can offer employees. There are several basic options for setting up a plan:
- A traditional indemnity plan, or fee for service. Employees choose their medical care provider; the insurance company either pays the provider directly or reimburses employees for covered amounts.
Managed care. The two most common forms of managed care are the Health Maintenance Organization (HMO) and the Preferred Provider Organization (PPO). An HMO is essentially a prepaid health-care arrangement, where employees must use doctors employed by or under contract to the HMO and hospitals approved by the HMO. Under a PPO, the insurance company negotiates discounts with the physicians and the hospitals. Employees choose doctors from an approved list, then usually pay a set amount per office visit (typically $10 to $25); the insurance company pays the rest. - Self insurance. When you absorb all or a significant portion of a risk, you are essentially self-insuring. An outside company usually handles the paperwork, you pay the claims and sometimes employees help pay premiums. The benefits include greater control of the plan design, customized reporting procedures and cash-flow advantages. The drawback is that you are liable for claims, but you can limit liability with “stop loss” insurance–if a claim exceeds a certain dollar amount, the insurance company pays it.
- Archer Medical Savings Account. : Under this program, an employee of a small employer (50 or fewer employees) or a self-employed person can set up an Archer MSA to help pay health-care expenses. The accounts are set up with a U.S. financial institution and allow you to save money exclusively for medical expenses. When used in conjunction with a high-deductible insurance policy, accounts are funded with employee’s pretax dollars. Under the Archer MSA program, disbursements are tax-free if used for approved medical expenses. Unused funds in the account can accumulate indefinitely and earn tax-free interest. Health-savings accounts (HSAs), available as of January 2004, are similar to MSAs but are not restricted to small employers.
- Vol/30 Avg Vol: $\displaystyle \frac{Total \space volume \space today}{the \space average \space volume \space in \space the \space past \space 30 \space days}$, reflecting the active degree of stock.
- Vol/10 Avg Vol: $\displaystyle \frac{Total \space volume \space today}{the \space average \space volume \space in \space the \space past \space 10 \space days}$, reflecting the active degree of stock.
- P/H: $\displaystyle \frac{Current \space price}{highest \space price \space in \space the \space past \space 52 weeks}$
- PE/PEH: $\displaystyle \frac{Current \space P/E}{highest \space P/E \space in \space the \space past \space 52 \space weeks}$.
- P/L: $\displaystyle \frac{Current \space price}{lowest \space price \space in \space the \space past \space 52 weeks}$
- PE/PEL: $\displaystyle \frac{Current \space P/E}{lowest \space P/E \space in \space the \space past \space 52 \space weeks}$.
- H/P: $\displaystyle \frac{highest \space price \space in \space the \space past \space 52 weeks}{Current \space price}$
- PEH/PE: $\displaystyle \frac{highest \space P/E \space in \space the \space past \space 52 \space weeks}{Current \space P/E}$.
- L/P: $\displaystyle \frac{lowest \space price \space in \space the \space past \space 52 weeks}{Current \space price}$
- PEL/PE: $\displaystyle \frac{lowest \space P/E \space in \space the \space past \space 52 \space weeks}{Current \space P/E}$
- P Position: $\displaystyle \frac{Current \space price -lowest \space Price \space in \space the \space past \space 52 \space weeks}{highest \space Price \space in \space the \space past \space 52 \space weeks -lowest \space Price \space in \space the \space past \space 52 \space weeks}$
- P/E Position: $\displaystyle \frac{Current \space P/E -lowest \space P/E \space in \space the \space past \space 52 \space weeks}{highest \space P/E \space in \space the \space past \space 52 \space weeks -lowest \space P/E \space in \space the \space past \space 52 \space weeks}$
“It is important to understand the strengths and limitations of the data because rarely is there an exact match with the problem“
This is the best description of data science. Most times you have to consider which way do you prefer: making a goal first then find the solutions; Or try to exploring more details first then set a target. I know the latter is difficult to understand, especially for the one who is not work in data science. It seems ridiculous. Just like let someone buy a flight ticket first then decide the destination. However, in the data science field, sometimes you have no choice. For example, here is a table describing the relationships between tips and other variables. Assume you are the owner of the restaurant, you may wonder when and which kind of customers would like to pay more tips.
1 | import plotly.express as px |

Through only the observation of this table, it is impossible to extract valuable information. Which gender is more generous? When is the best time to earn tips? Does a higher total bill mean a higher proportion of the tips? Would the smoker like to pay more?
1 | import plotly.express as px |
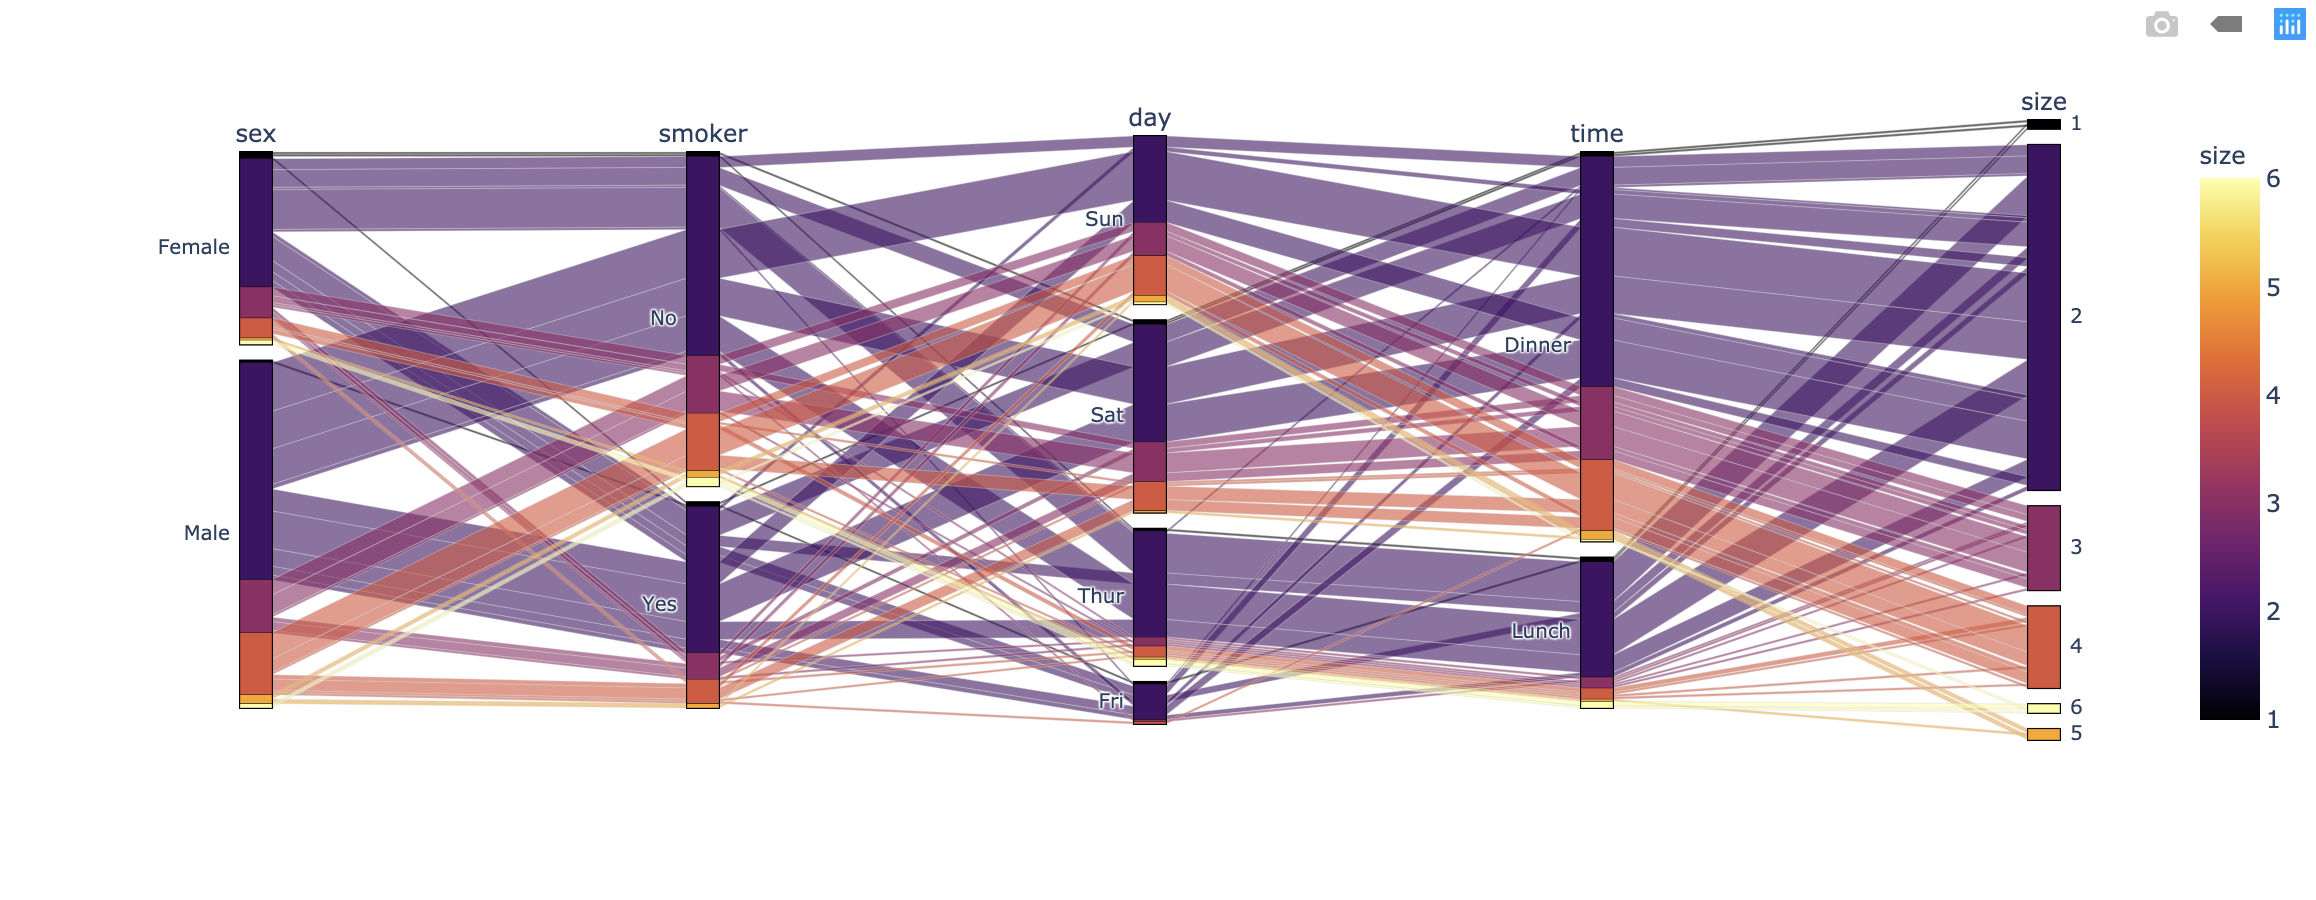
However, only after making one chart. We can have a clear recognition of the data set. This example is intended to illustrate the importance of the CRISP data mining process. Most of the time, even for not really complex data, we need to repeat the first two stages of the CRISP model several times. While understanding which of data is required, we can also deepen the understanding of the data set at the same time. This process is iterative with CRISP-DM.
For securities trading, there are many factors that may affect the stock price, such as trading volume, related news, financial statements, and various securities companies’ research reports on future stock prices. If you want to develop a quantitative trading program, I think the easiest step is to extract the historical stock price and the research report at the corresponding point in time. These data can be obtained very easily through public channels. Then by analyzing the content of the transaction report, a basic model for predicting stock prices is established. It is very clever to stand on the shoulders of giants.
In my opinion, for Machine Learning, data preparation is essential. In the data preparation phase, Data Cleansing, and Data Formatting are very important. In Python data preparation, Indexing, slicing, and filtering are three commonly used techniques. If necessary, Data Formatting must be done last. Usually, we have to clean the dataset.
Data Cleansing: If the data set has some null values, it usually appears as an empty string, null, or N / A. In most cases, we need to delete the entire row of data or replace it with a specific number, such as 0 or -1. It is also possible to keep the value empty. Then you need to retain the data, delete the unwanted data, or create new variables for the required data, which is beneficial for our subsequent data analysis. Sometimes we even need to add new data ourselves.
Data Formatting: We must convert nominal data to ordinal data. Because machine learning does not accept string types. If the variance between different columns is very large, we must perform standardization or normalization. Otherwise, it will seriously affect the experimental results of ML. They are a technique for projecting raw data to the same scale. Many people cannot understand the difference between the two, we just need to keep in mind that standardization is the better choice in most cases.
My name is Danlin(Zacks) Shen, and I currently enrolled in the last term at Northeastern University in Boston. The expected graduation date is the end of June. I am finishing my major Analytics and ultimately seeking a career in the data science field.
“Follow excellence, and success will chase me.” Passion, self-control, curiosity, and integrity are the most precious qualities that I have. Every time I got attracted by anything unusual, I spend all of my spare time to learn it, understand it, and record my learning experience on my decent blog. https://zacks.one is a personal technology blog, which is my dream starting point. As a perfectionist, I cannot stand I am ignorant of the attractive fields. Therefore, I started over and built a strong fundament of each academic area and technique for becoming an insightful data scientist. Then one mind just came up: I need a clear plan to manage all of the knowledge that I should learn and connect them together.
- Statistics, the necessary knowledge reserve for machine learning
- Programming skills, the method of applying in the real world
- Visualization, the way to present the value of the data
- Database, the data warehouse storing our valuable wealth
- Network techniques and Linux, the fundamental part of cloud computing.
- Analytics, the critical ability for digging out the essence of the data
- Cloud Computing, the crucial tools for big data and artificial intelligence
However, knowledge and techniques are not targets. They are methods that help me achieve my goals. They are the bridge that connects individuals and the world. Hence, I always try to apply the knowledge and techniques mentioned above for every creative project and record them on my blog. Recently, I have a valuable experience of the project named BosBot, which contains the real dataset from the BOS:311 - a Boston government department. I learned a lot from this project. How to effective teamwork; how to quickly study a new technique and apply it; what does never give up mean; what is keep improving. Basically, BOS:311 gathers the complaints from the Boston citizens, such as illegal parking and street lights broke down, then handle them. I led the team in constructing the blueprint of the program and building a chatbot based on Amazon Lex. And I developed a Python program to simulate the BOS:311 background system, which could manipulate the new and existing cases. Finally, I analyzed the dataset in 2020 and built an insightful data visualization on a real map with animation based on the case open date. Our project is terrific enough to earn an opportunity - a special presentation. We presented it for the Boston mayor office, the BOS:311 company, and staff from different companies. And we received unanimous praise and recognition. I really appreciate my professor for providing this opportunity, which improves me a lot. But I cannot show any technical detail because of the limited space. If you are interested in it, please visit https://zacks.one/2020/02/06/BOS311/
(https://zacks.one/bos311/
Above all, I am willing to work with a creative and passionate team. It is exciting to discover what hidden under the surface of the data. Just thinking about it makes me excited. I will try my best to continuously improve myself and apply my abilities to help the team achieve more excellent achievements.
Attached is my résumé for your reference. I will be available to work from early April and will be responsible for my own transportation to/from campus and housing.
I appreciate your time and consideration. I look forward to hearing from you or your staff at your earliest convenience.
Metadata is a data that describe other data. For example, you have a book, and the index is a kind of “metadata”. Or for a website, the website index is “metadata” too. Sometimes when we analyze some datasets, there is always a metadata to describe the dataset, such as the definition of each variable. Taka the dataset iris as an example.

Also, in Python, you can print the help information for a module. Or use dir method to print the available functions.


They are all metadata, which you may ignored in the real life but they are important.
And there are 5 categories of metadata:
- Descriptive metadata: An information describes the resource, such as title, description, and introduction.
- Structural metadata: An information describes the structure of the data, such as index, relationship, and order.
- Administrative metadata: An information describes the management of a resource, such as permission, created date, and created way.
- Reference metadata is information about the contents and quality of statistical data.
- Statistical metadata: An information describes how a statistical data be collected, preprocessing, and analyzing.
How accurate are these alerts in terms of true/false positives and negatives of the alerts as fired by atomic indicators or heat scores?
From the files:
- Indicators may fire more than once for an alert. We do not know how many times it fired.
- Obfuscate: 1 alert may have many indicators
I think it could be improved. Otherwise, there will not be so many obfuscated data records.

How can you evaluate/quantify them?
I would like to devide 2356(obfuscated data rows) by 65534(indicator_data rows). 3.5% is not a huge number. However, I am not sure if it is the whole datasets in a specific period.
How can they be improved (i.e., heat scores and alert threshold)?
I think it is better to reduce some variables. Also, assigning less workload to empolyee may deduct the obscute data.

Flow
graph TD
A[Hard] -->|Text| B(Round)
B --> C{Decision}
C -->|One| D[Result 1]
C -->|Two| E[Result 2]
Sequence
sequenceDiagram
Alice->>John: Hello John, how are you?
loop Healthcheck
    John->>John: Fight against hypochondria
end
Note right of John: Rational thoughts!
John-->>Alice: Great!
John->>Bob: How about you?
Bob-->>John: Jolly good!
Gantt
gantt
section Section
Completed :done,    des1, 2014-01-06,2014-01-08
Active        :active,  des2, 2014-01-07, 3d
Parallel 1   :         des3, after des1, 1d
Parallel 2   :         des4, after des1, 1d
Parallel 3   :         des5, after des3, 1d
Parallel 4   :         des6, after des4, 1d
Class
classDiagram
Class01 <|-- AveryLongClass : Cool
<<interface>> Class01
Class09 --> C2 : Where am i?
Class09 --* C3
Class09 --|> Class07
Class07 : equals()
Class07 : Object[] elementData
Class01 : size()
Class01 : int chimp
Class01 : int gorilla
class Class10 {
  <<service>>
  int id
  size()
}
State
stateDiagram
stateDiagram
[*] --> Still
Still --> [*]
Still --> Moving
Moving --> Still
Moving --> Crash
Crash --> [*]
Pie
pie
pie
"Dogs" : 386
"Cats" : 85
"Rats" : 15
ITC6460 Cloud Analytics Final Project - Proposal
According to the BOS:311 work process.
Here, we have four status of the closed case. We need to filter the valid case then analyze them. This process is data preprocessing. Then we will classify them by location.
- Case Noted
- Case Invalid
- Case Resolved
- Duplicate of Existing Case

After data preprocessing, our target is to dig out more information underneath the data. For example, what cause the different frequency based on the location.
Then we may design a chatbot for the opened case. There are may be two situations.
- There is no enough detail of the case. The chatbot will guide the user to provide more information. For example, if a violated parking car existed but no picture, the chatbot may require a photo about the car. Also, we may let the Amazon Rekognition to check the photo.
- There is enough detail of the case. Our background program should inform the user and update the status of the case on time. Once the case closed, it should update the final status.
show variables like “secure_file_priv”;
show variables like “local_infile”;