Tableau Tutorial
Getting Started
Getting Started
Data Sets
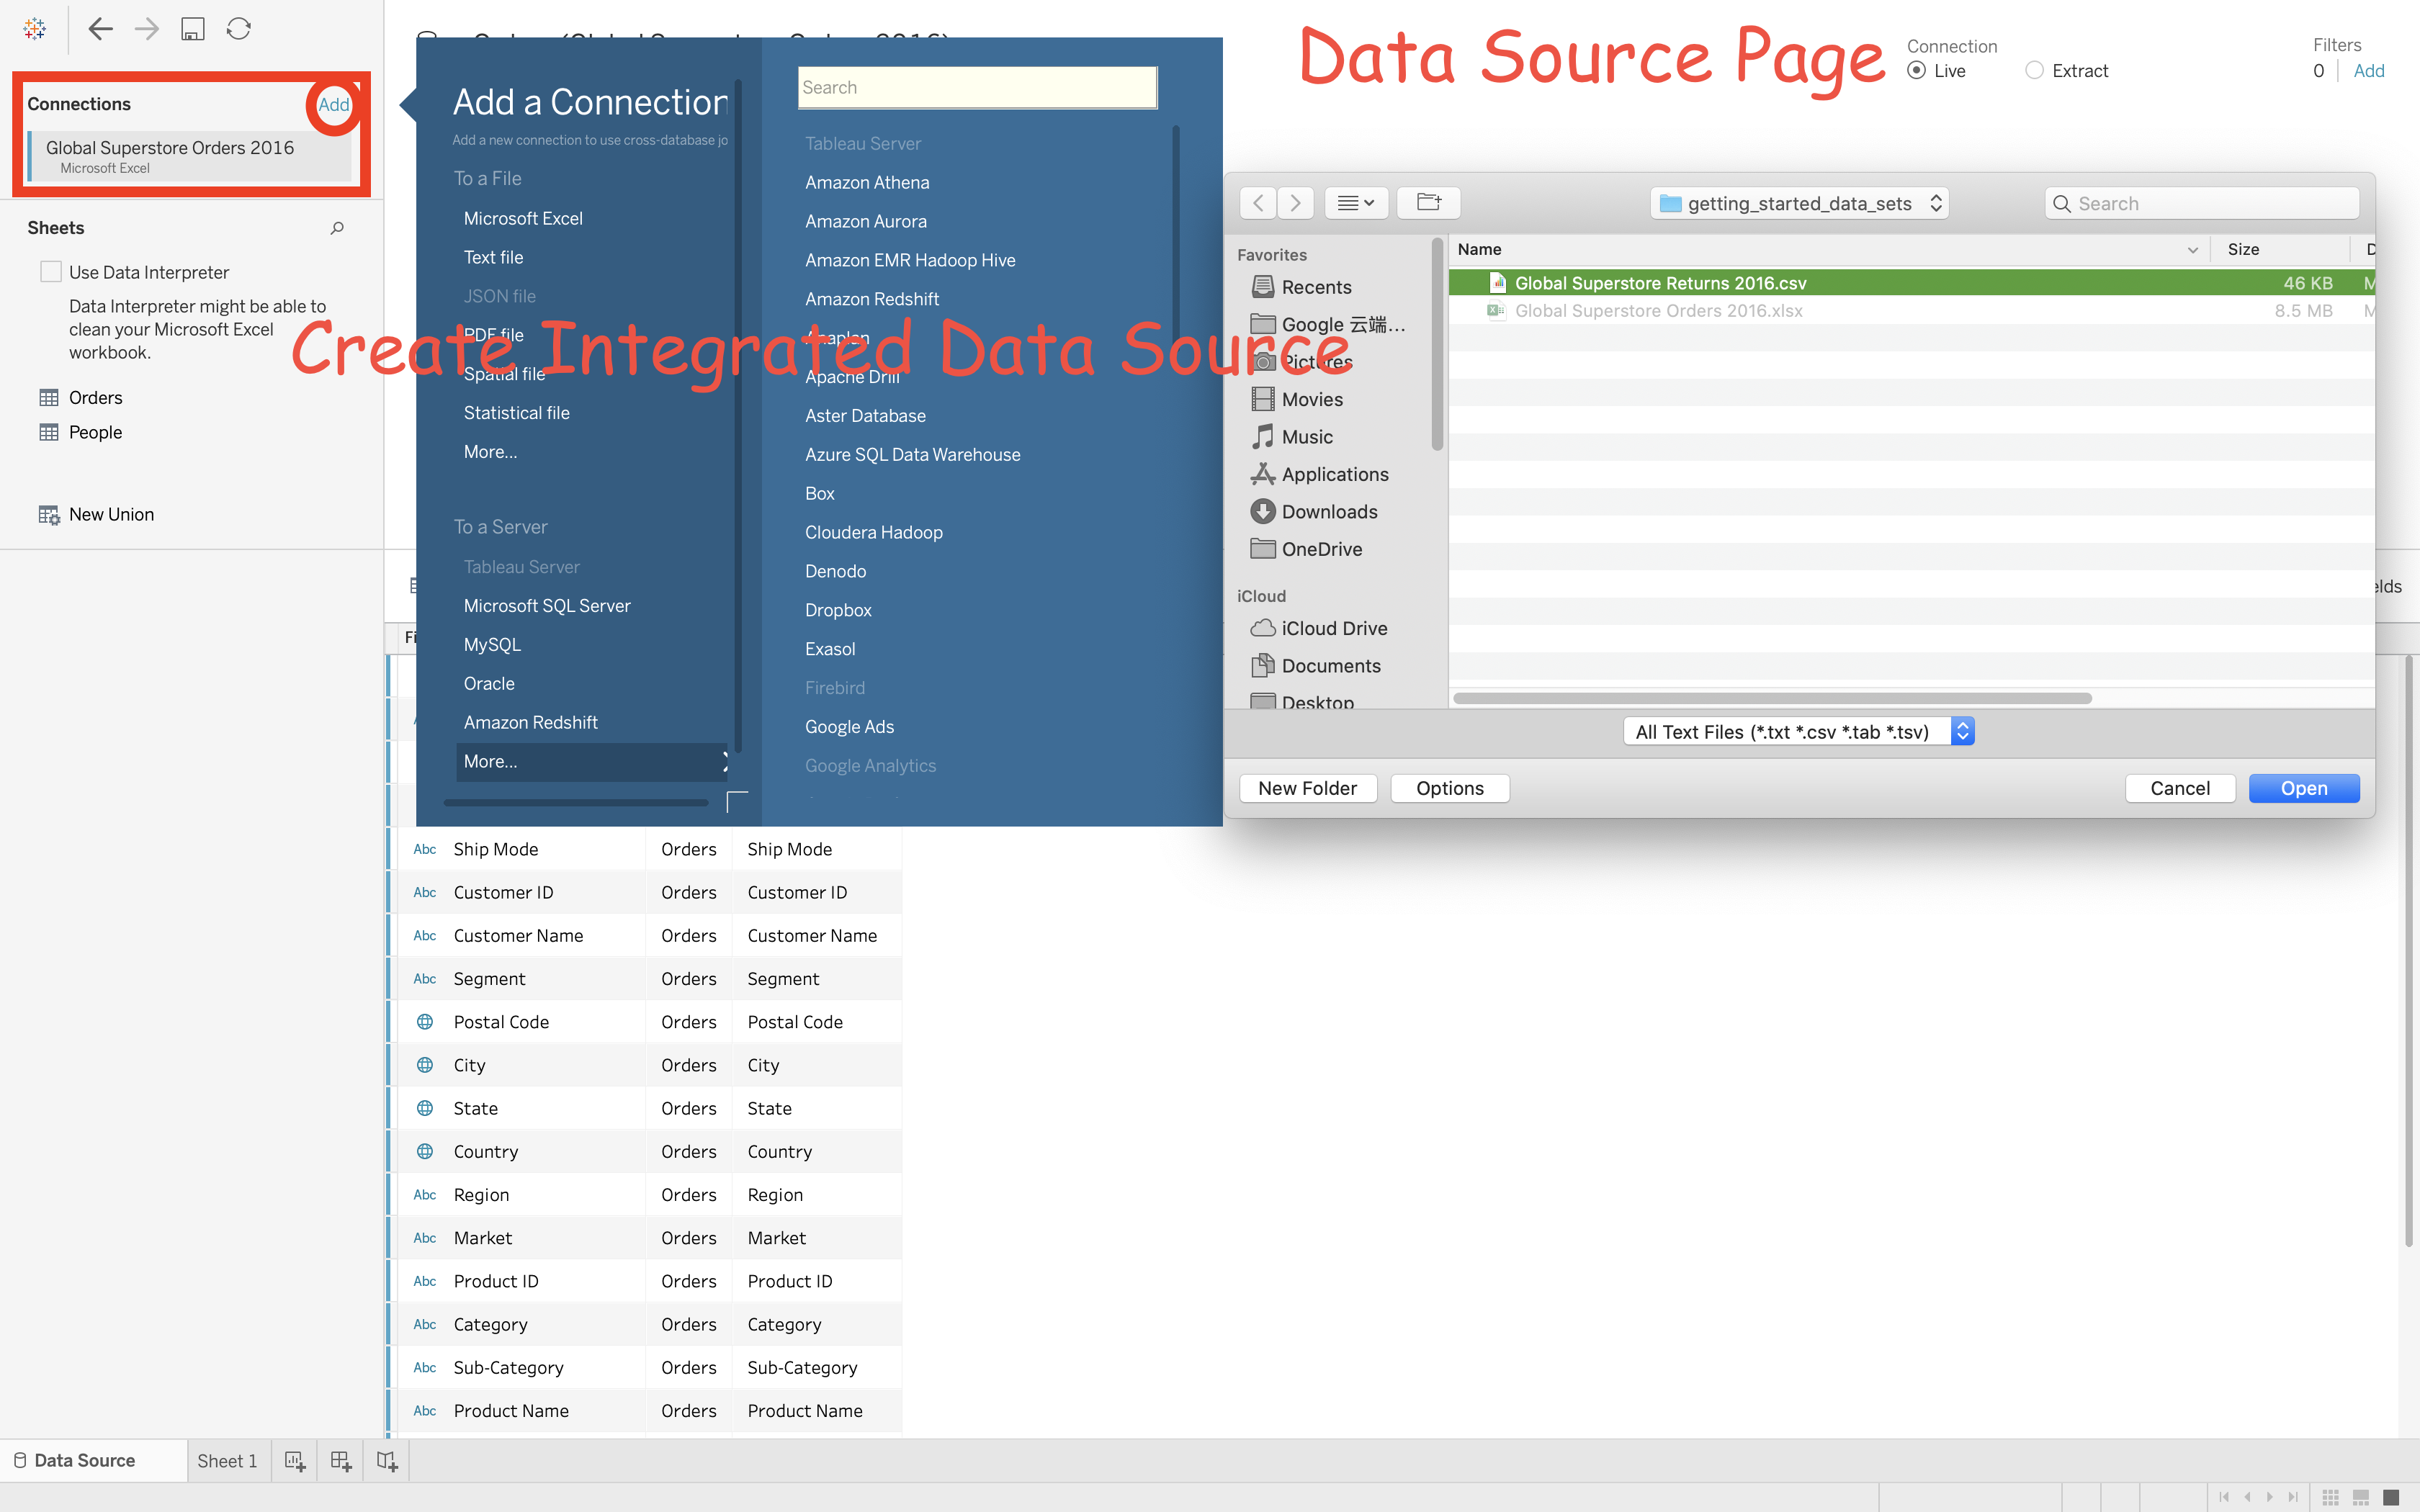
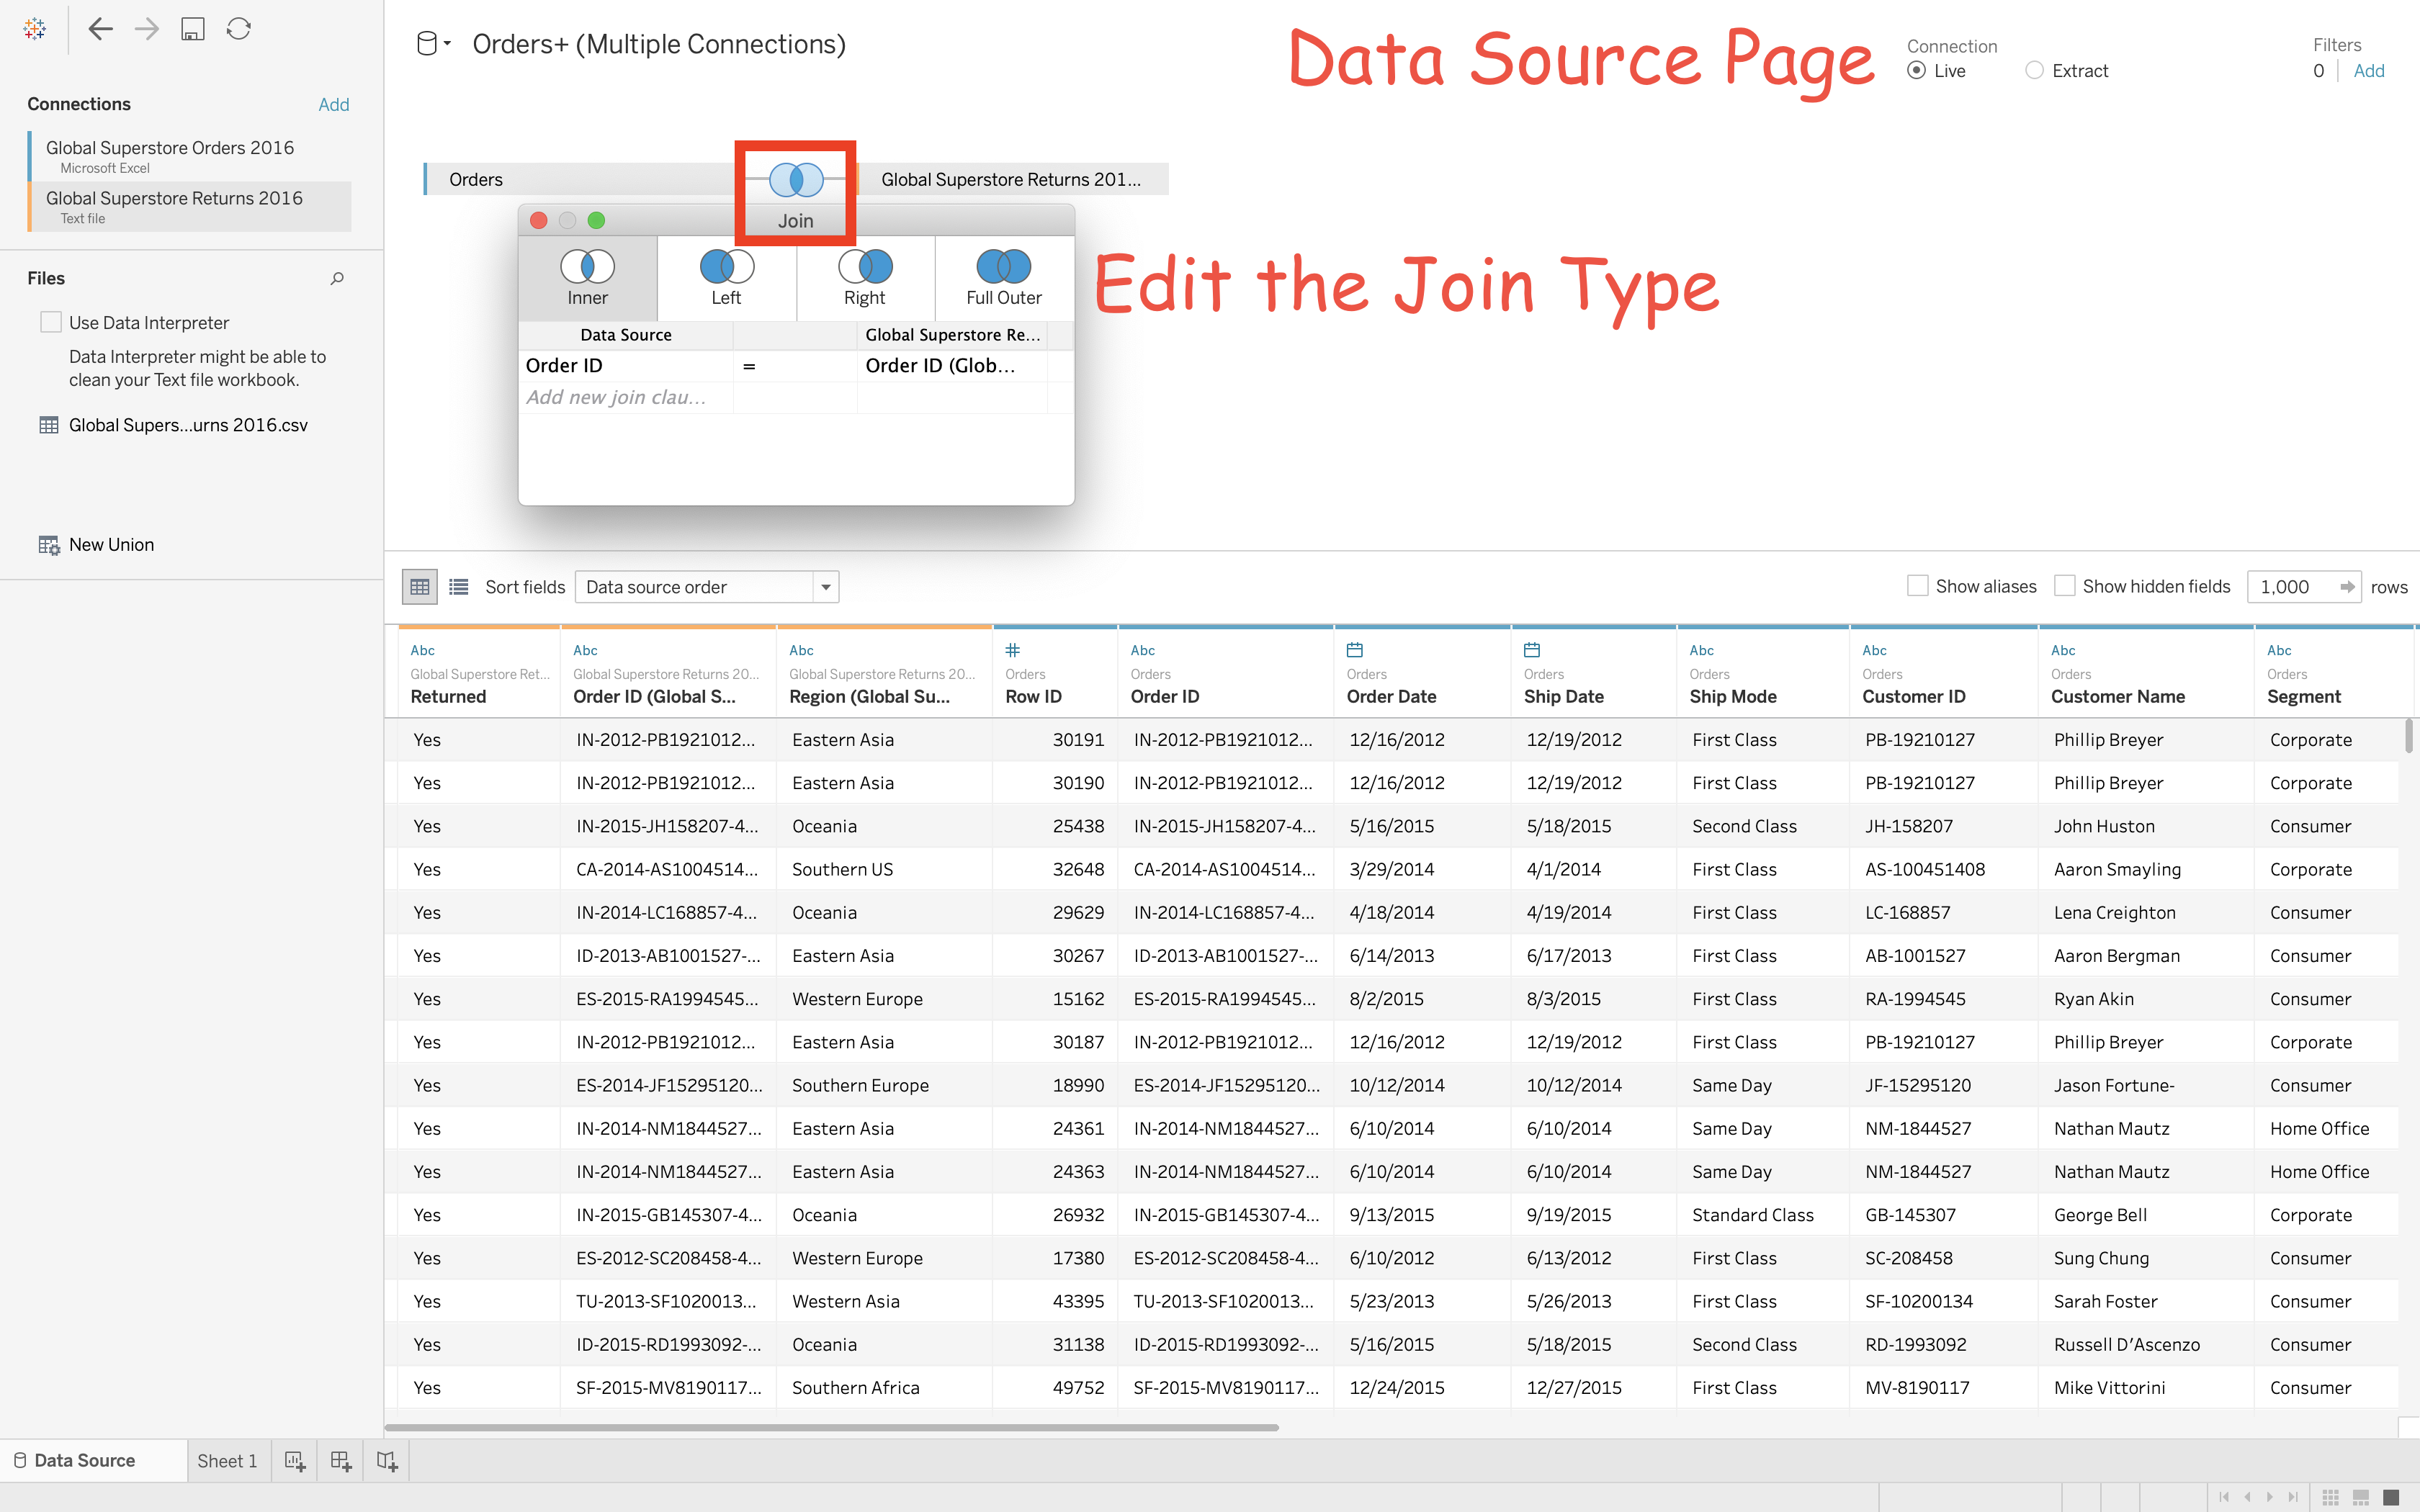
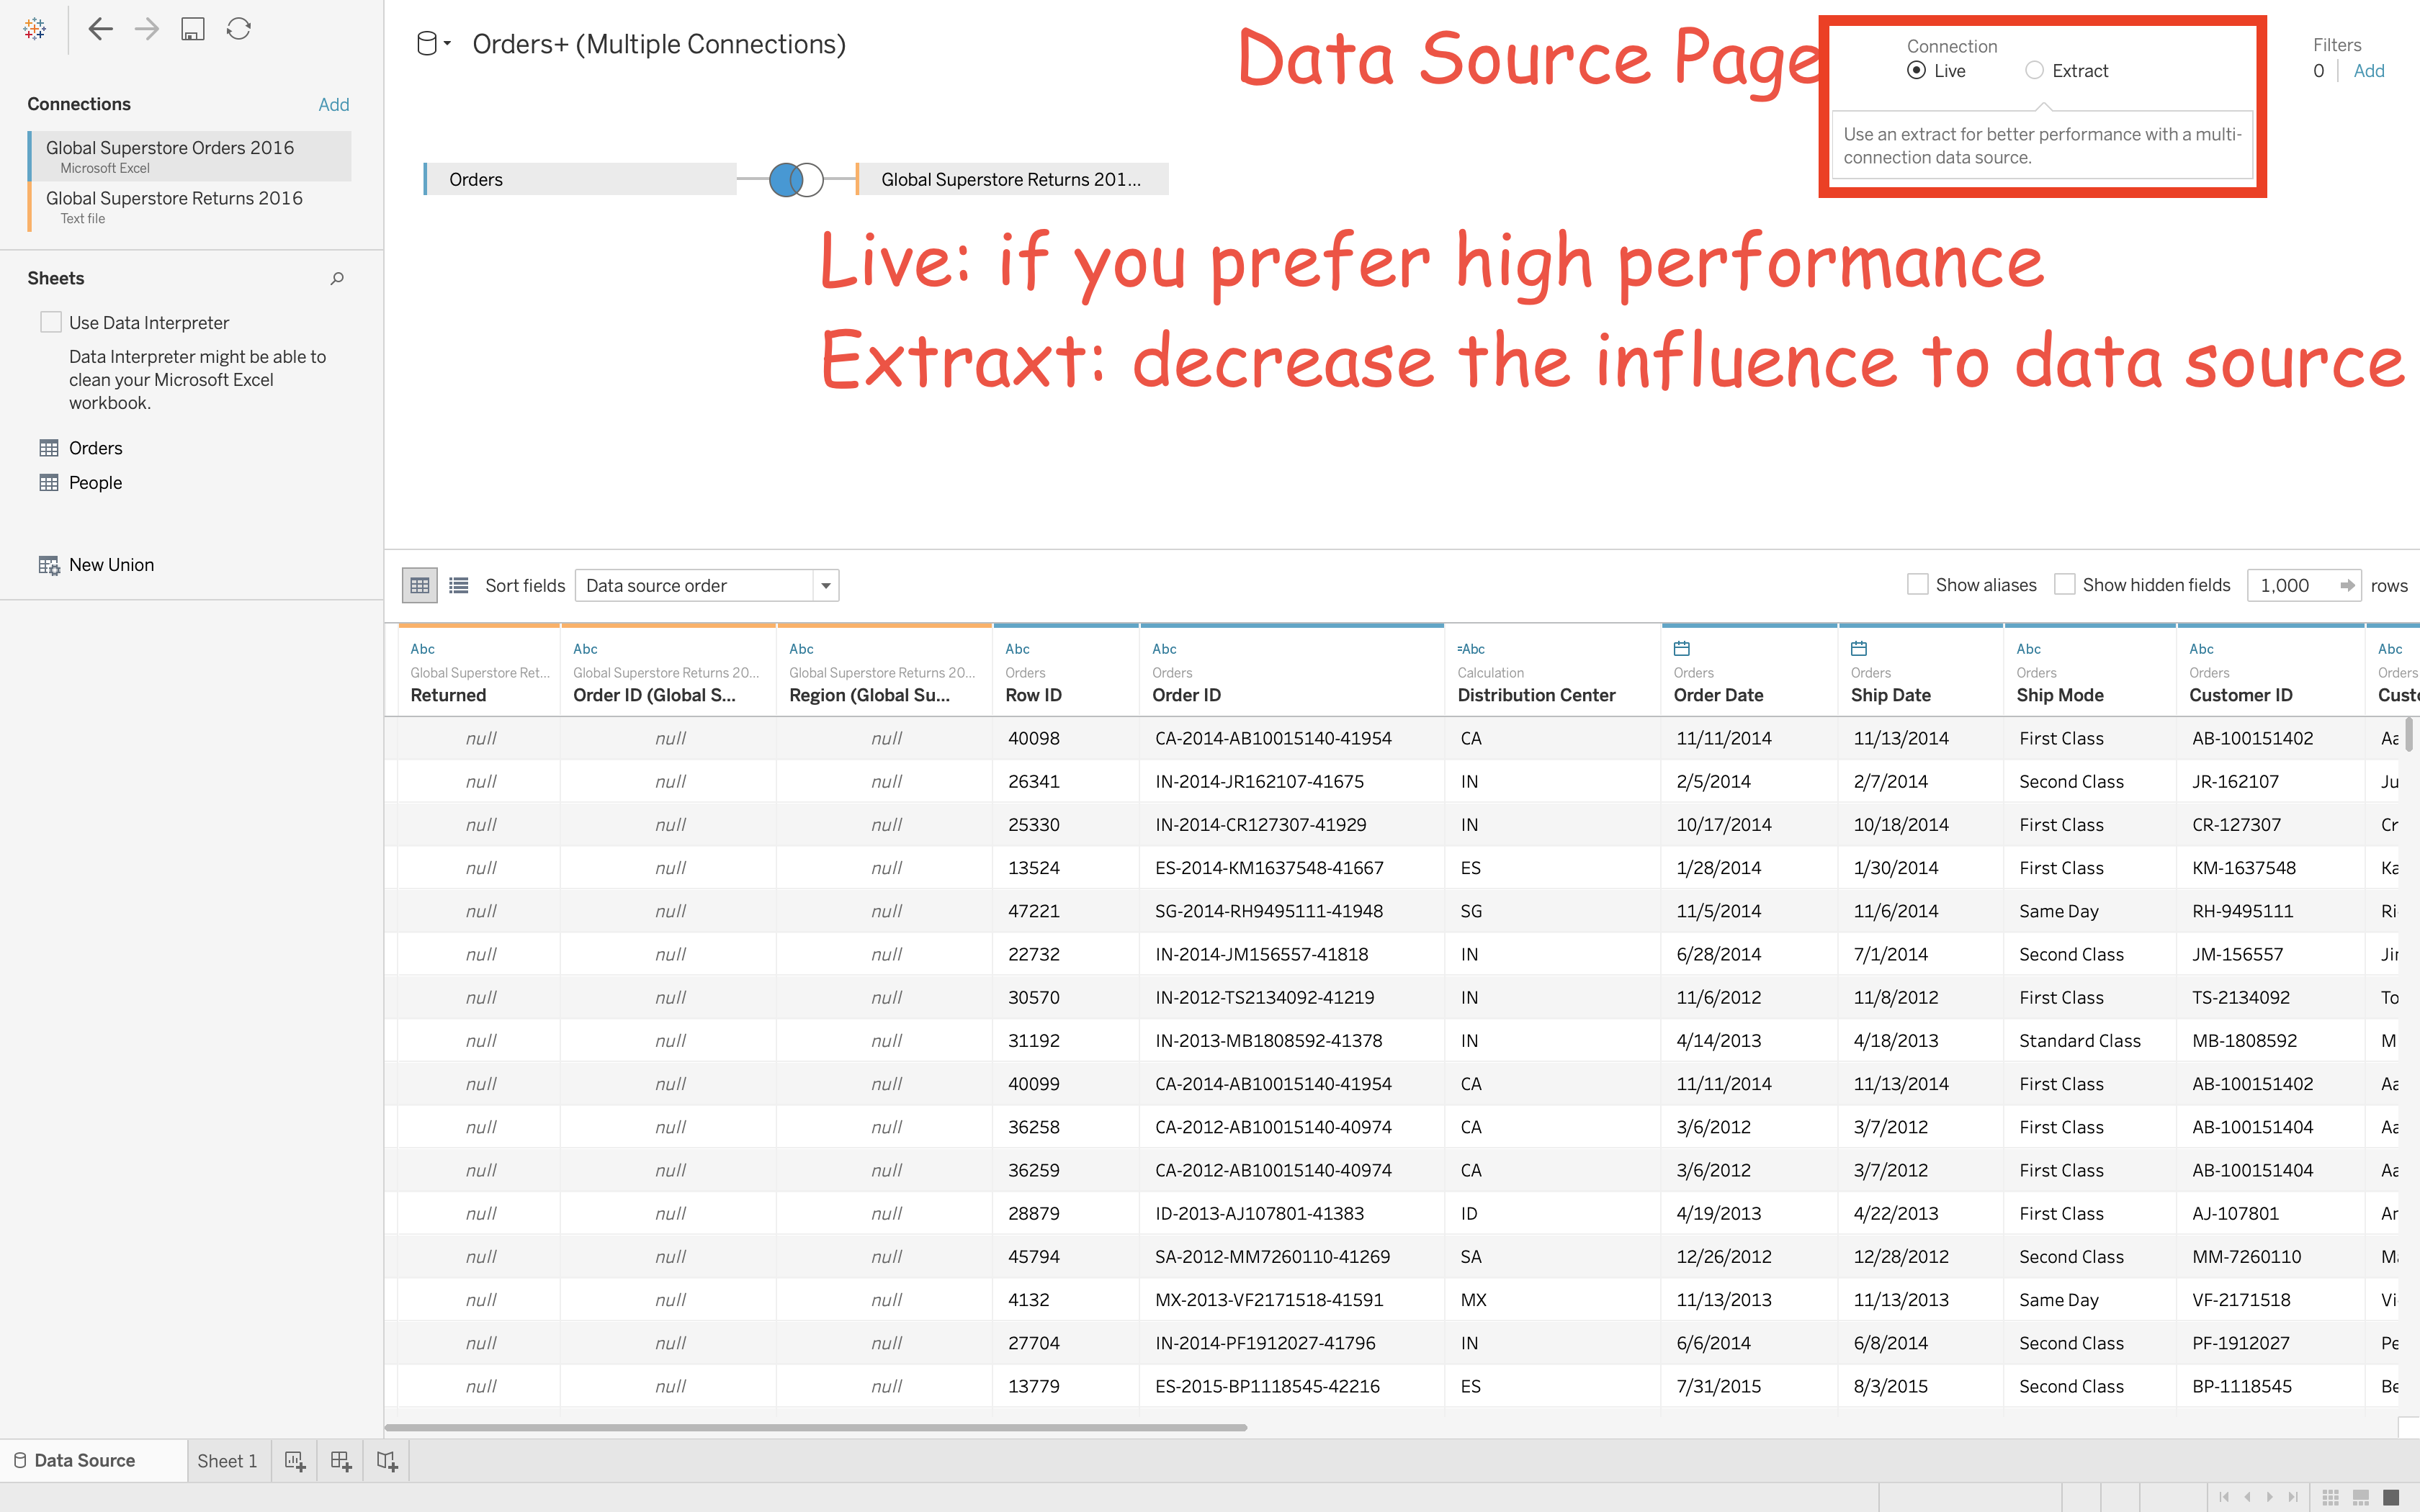
The difference between the two files is .xlsx contains most of the information; instead, the .csv file only contains the “Region” and “Returned” information. However, they all use “Order ID” as the unique identifier. Therefore, it is a good example to show how to connect two files in one sheet which have some relationship.
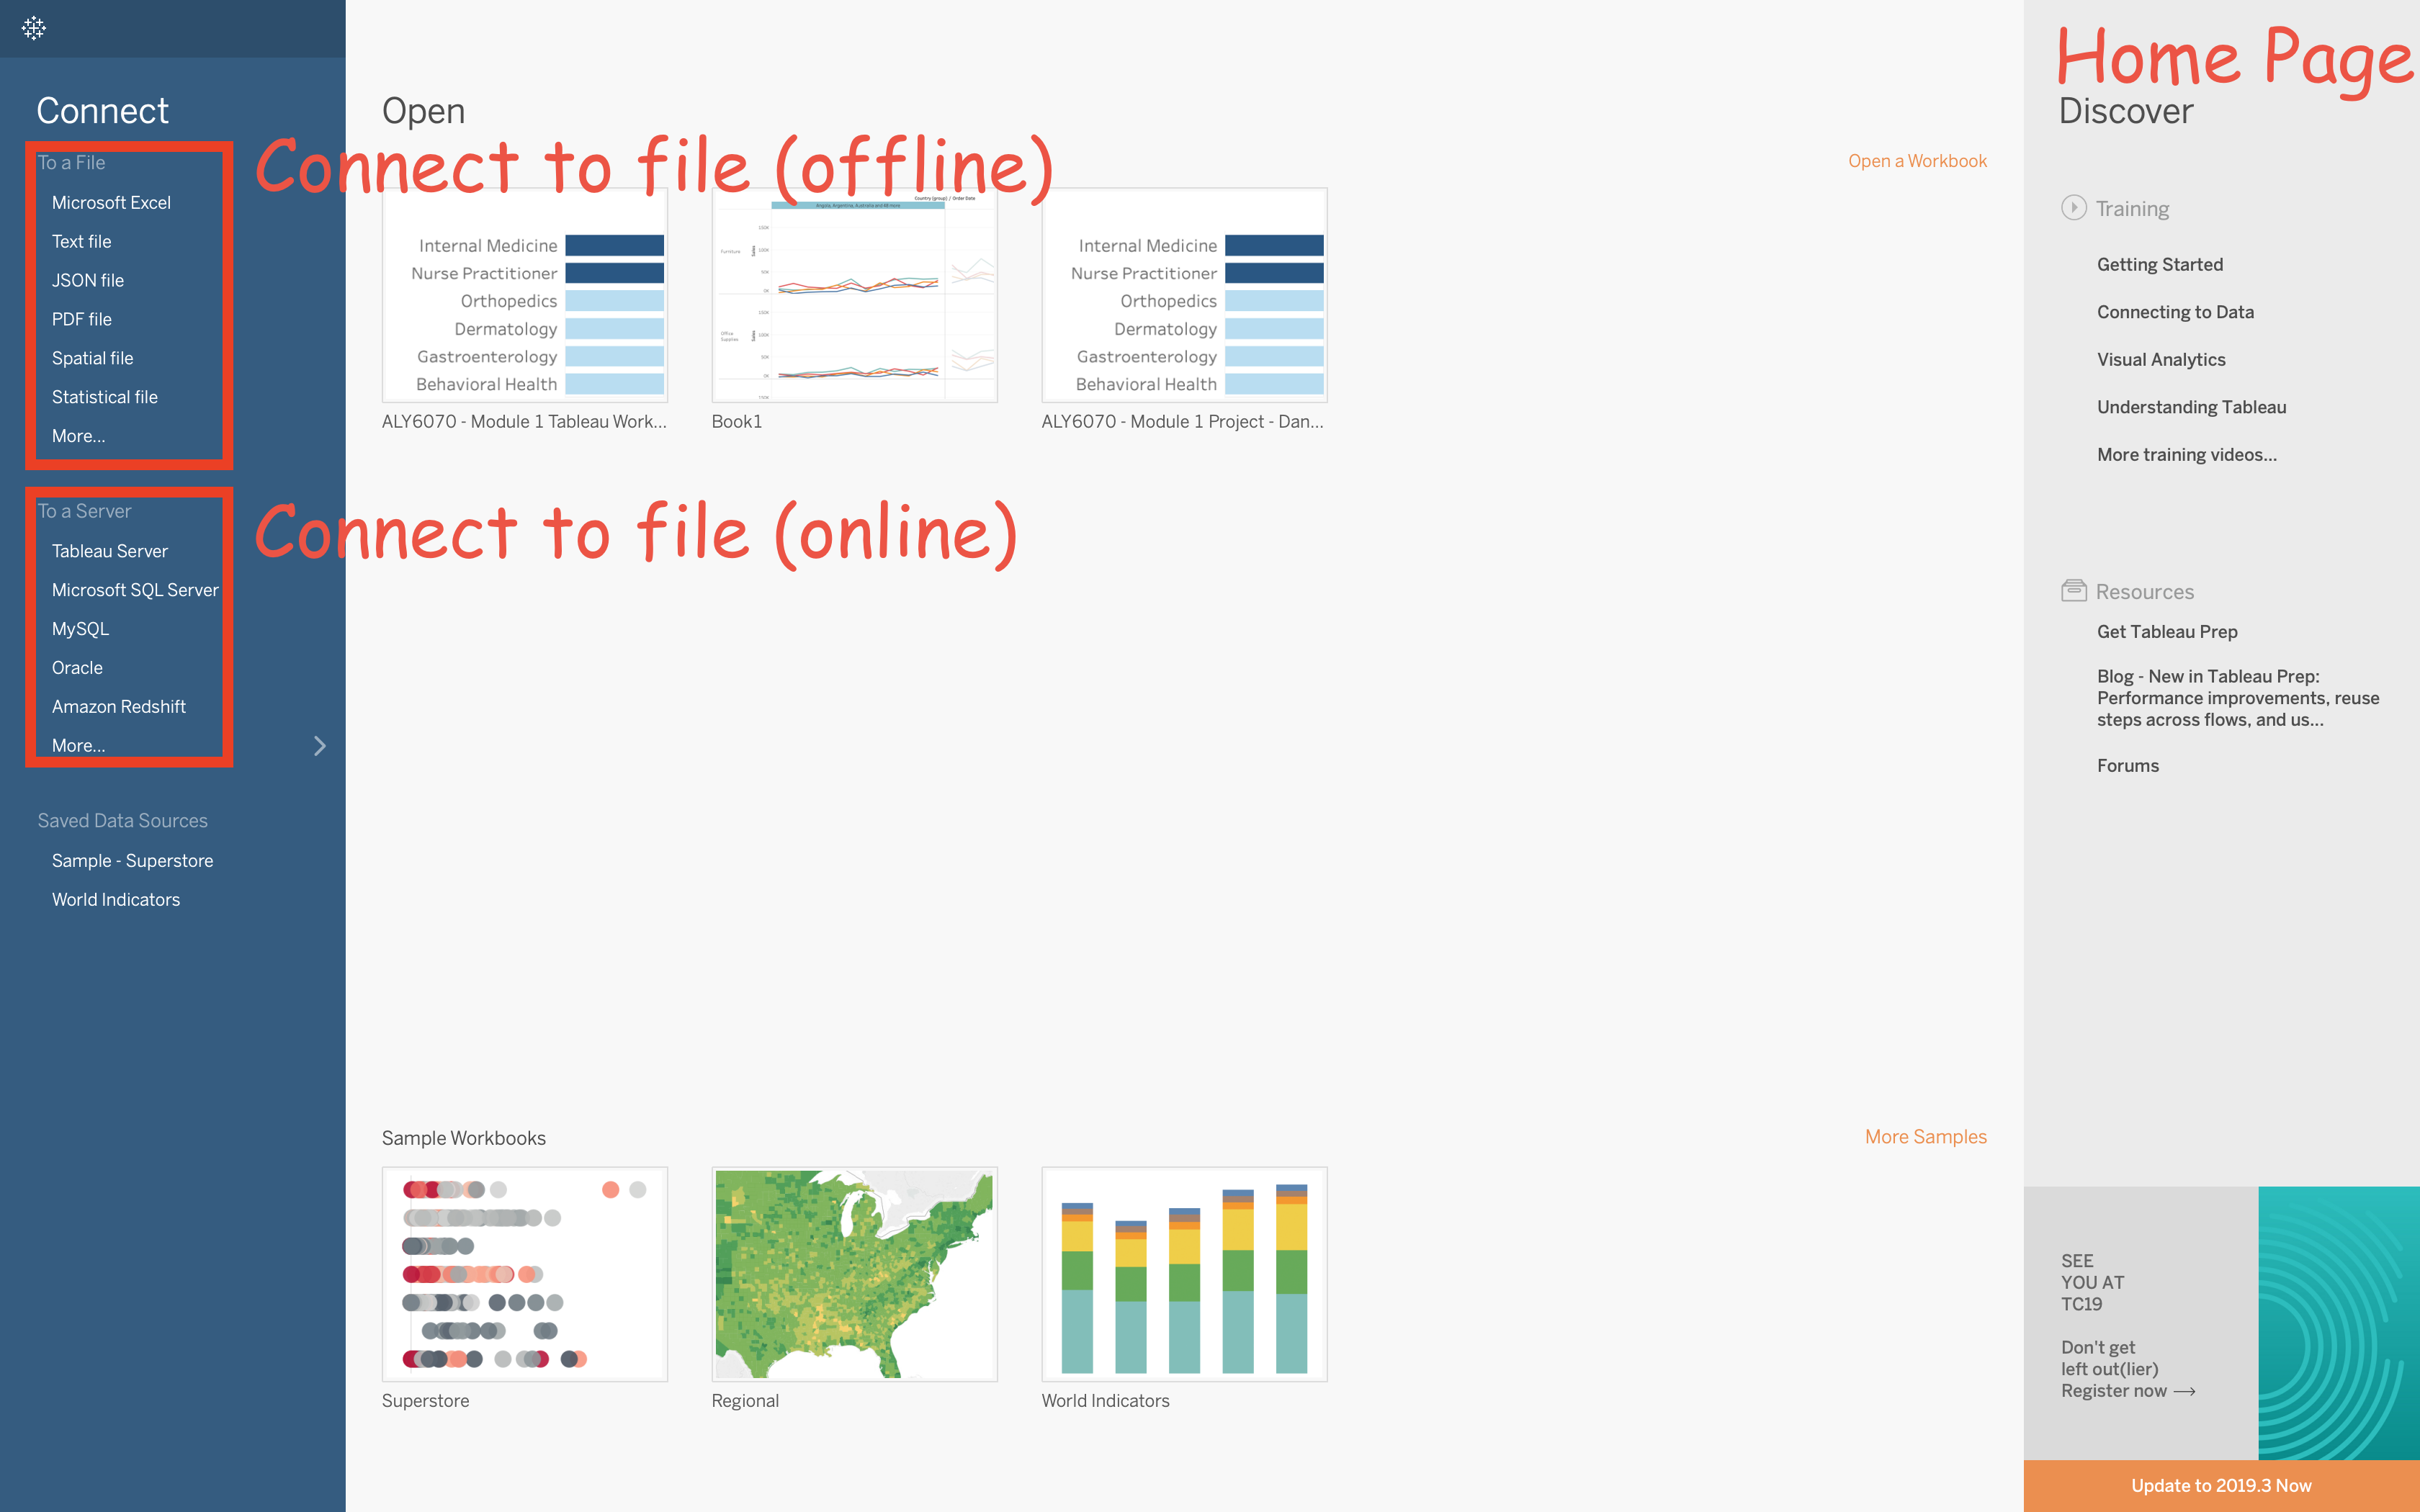
Home Page
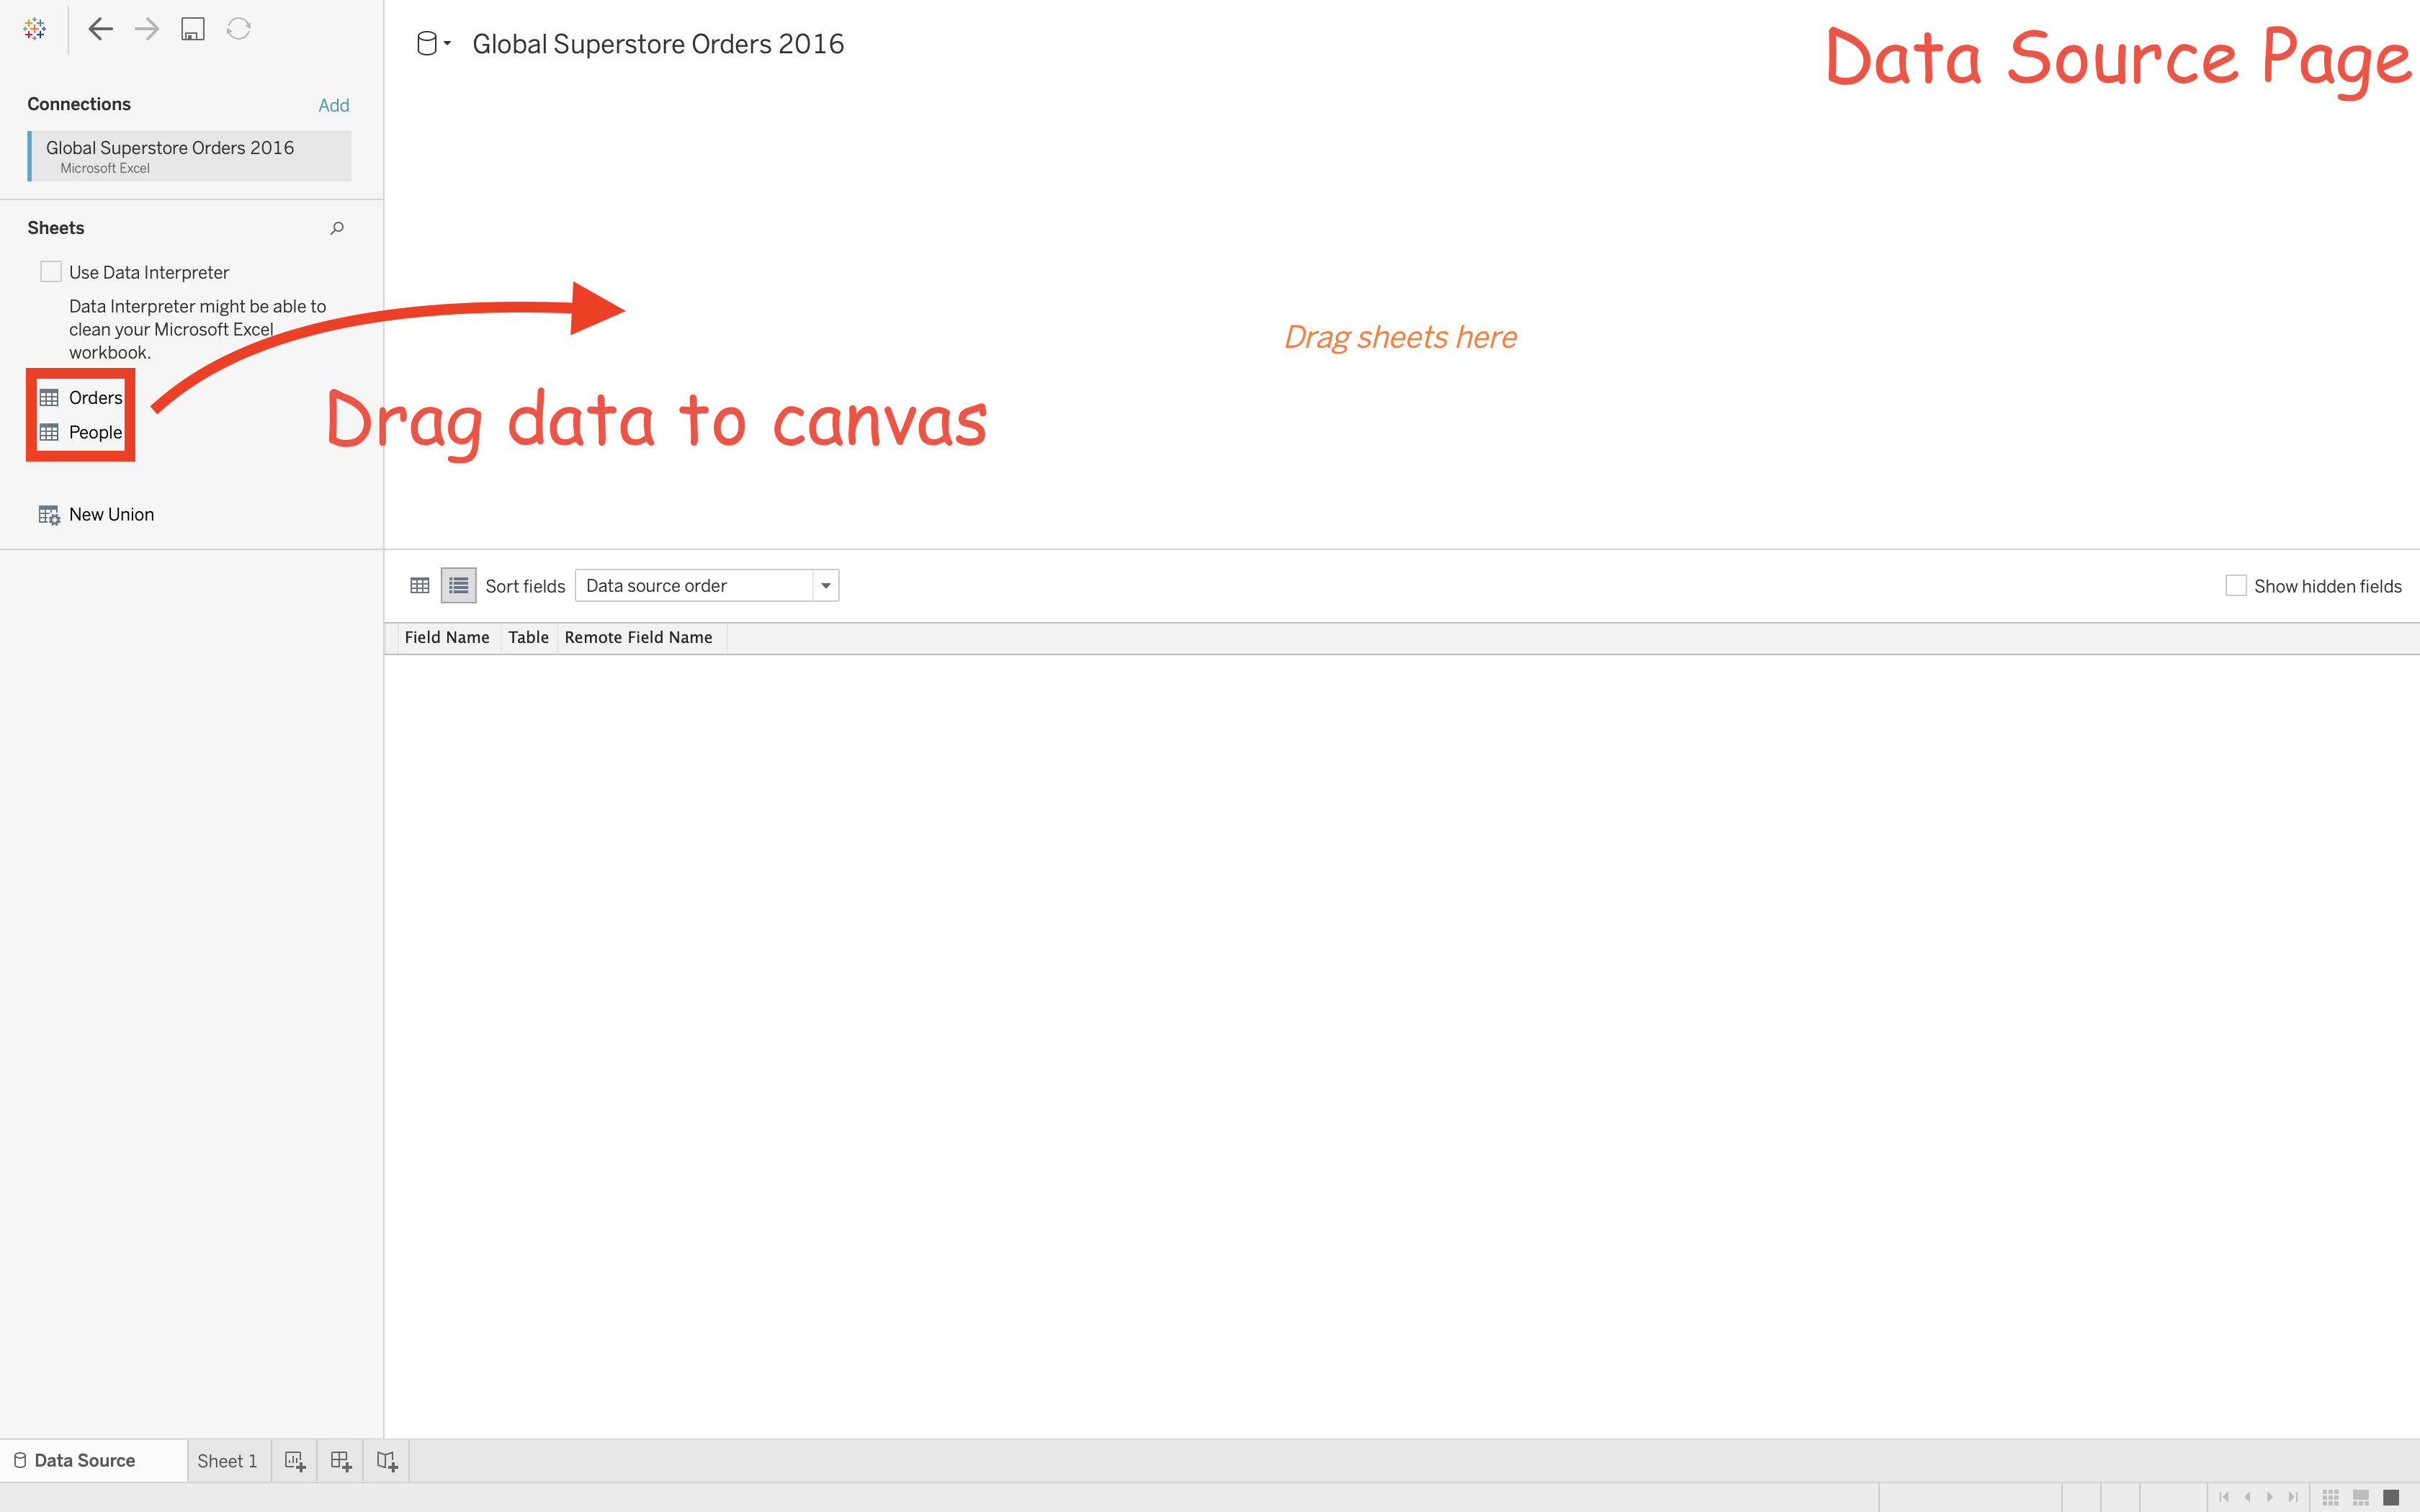
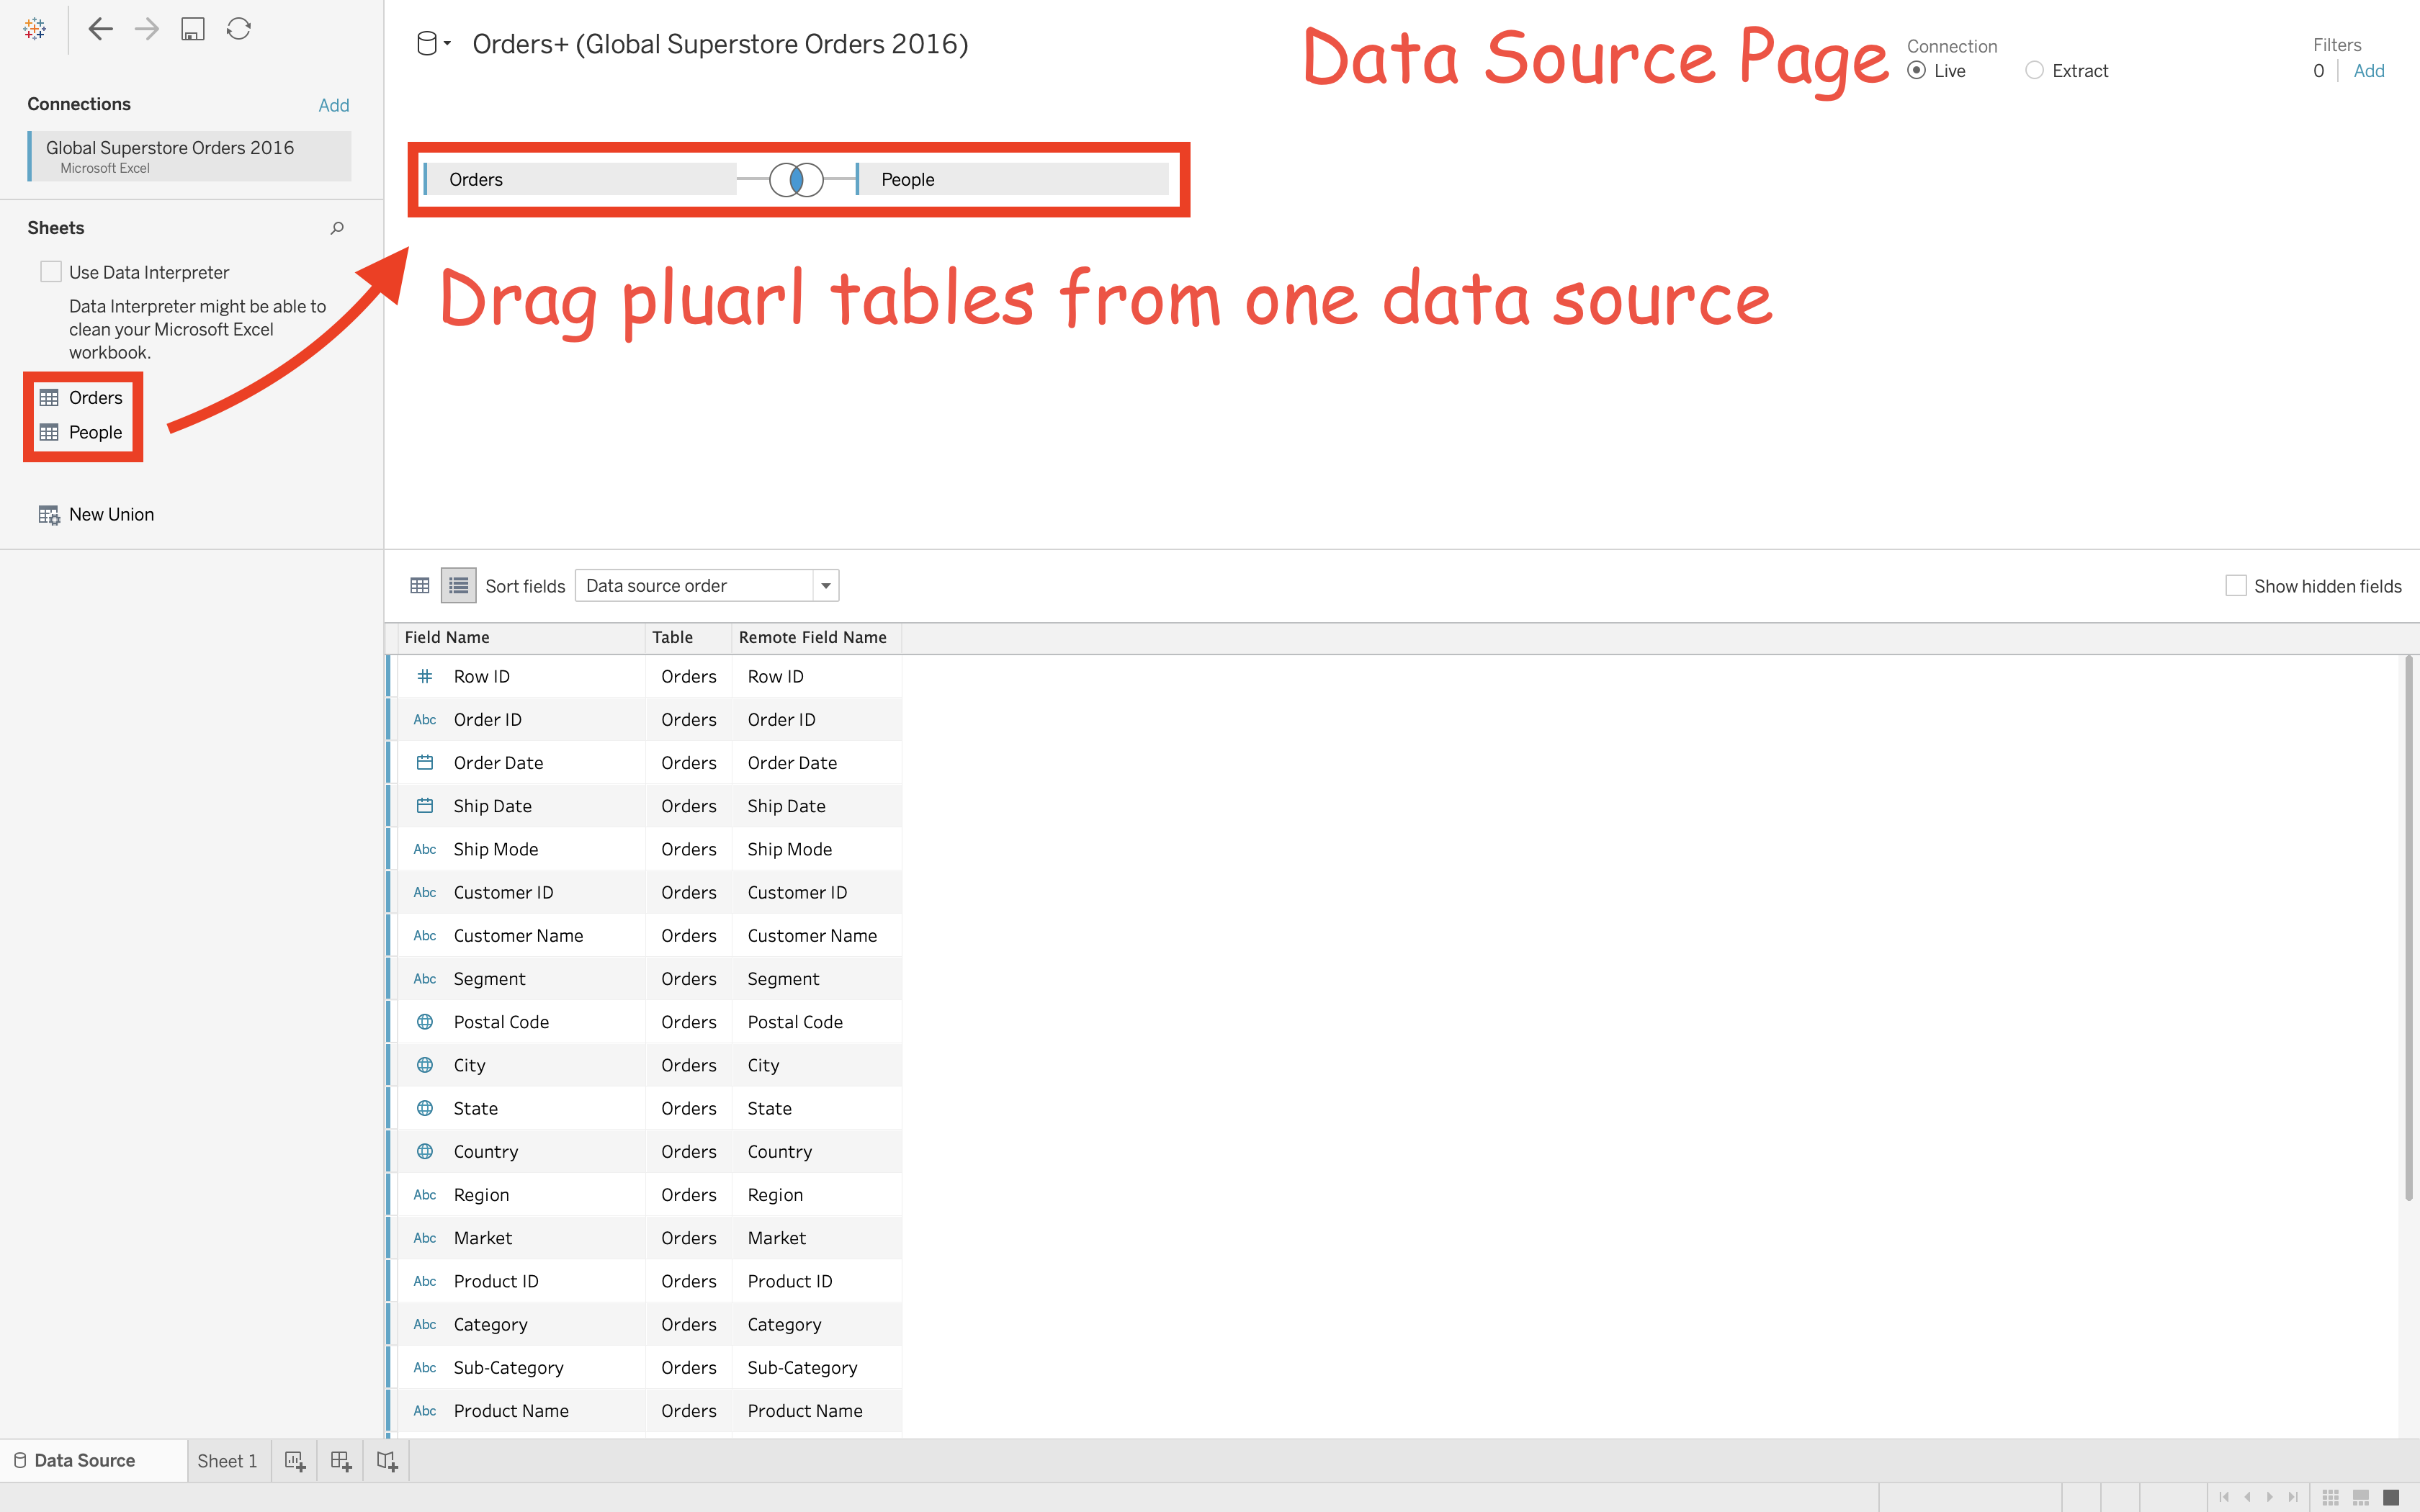
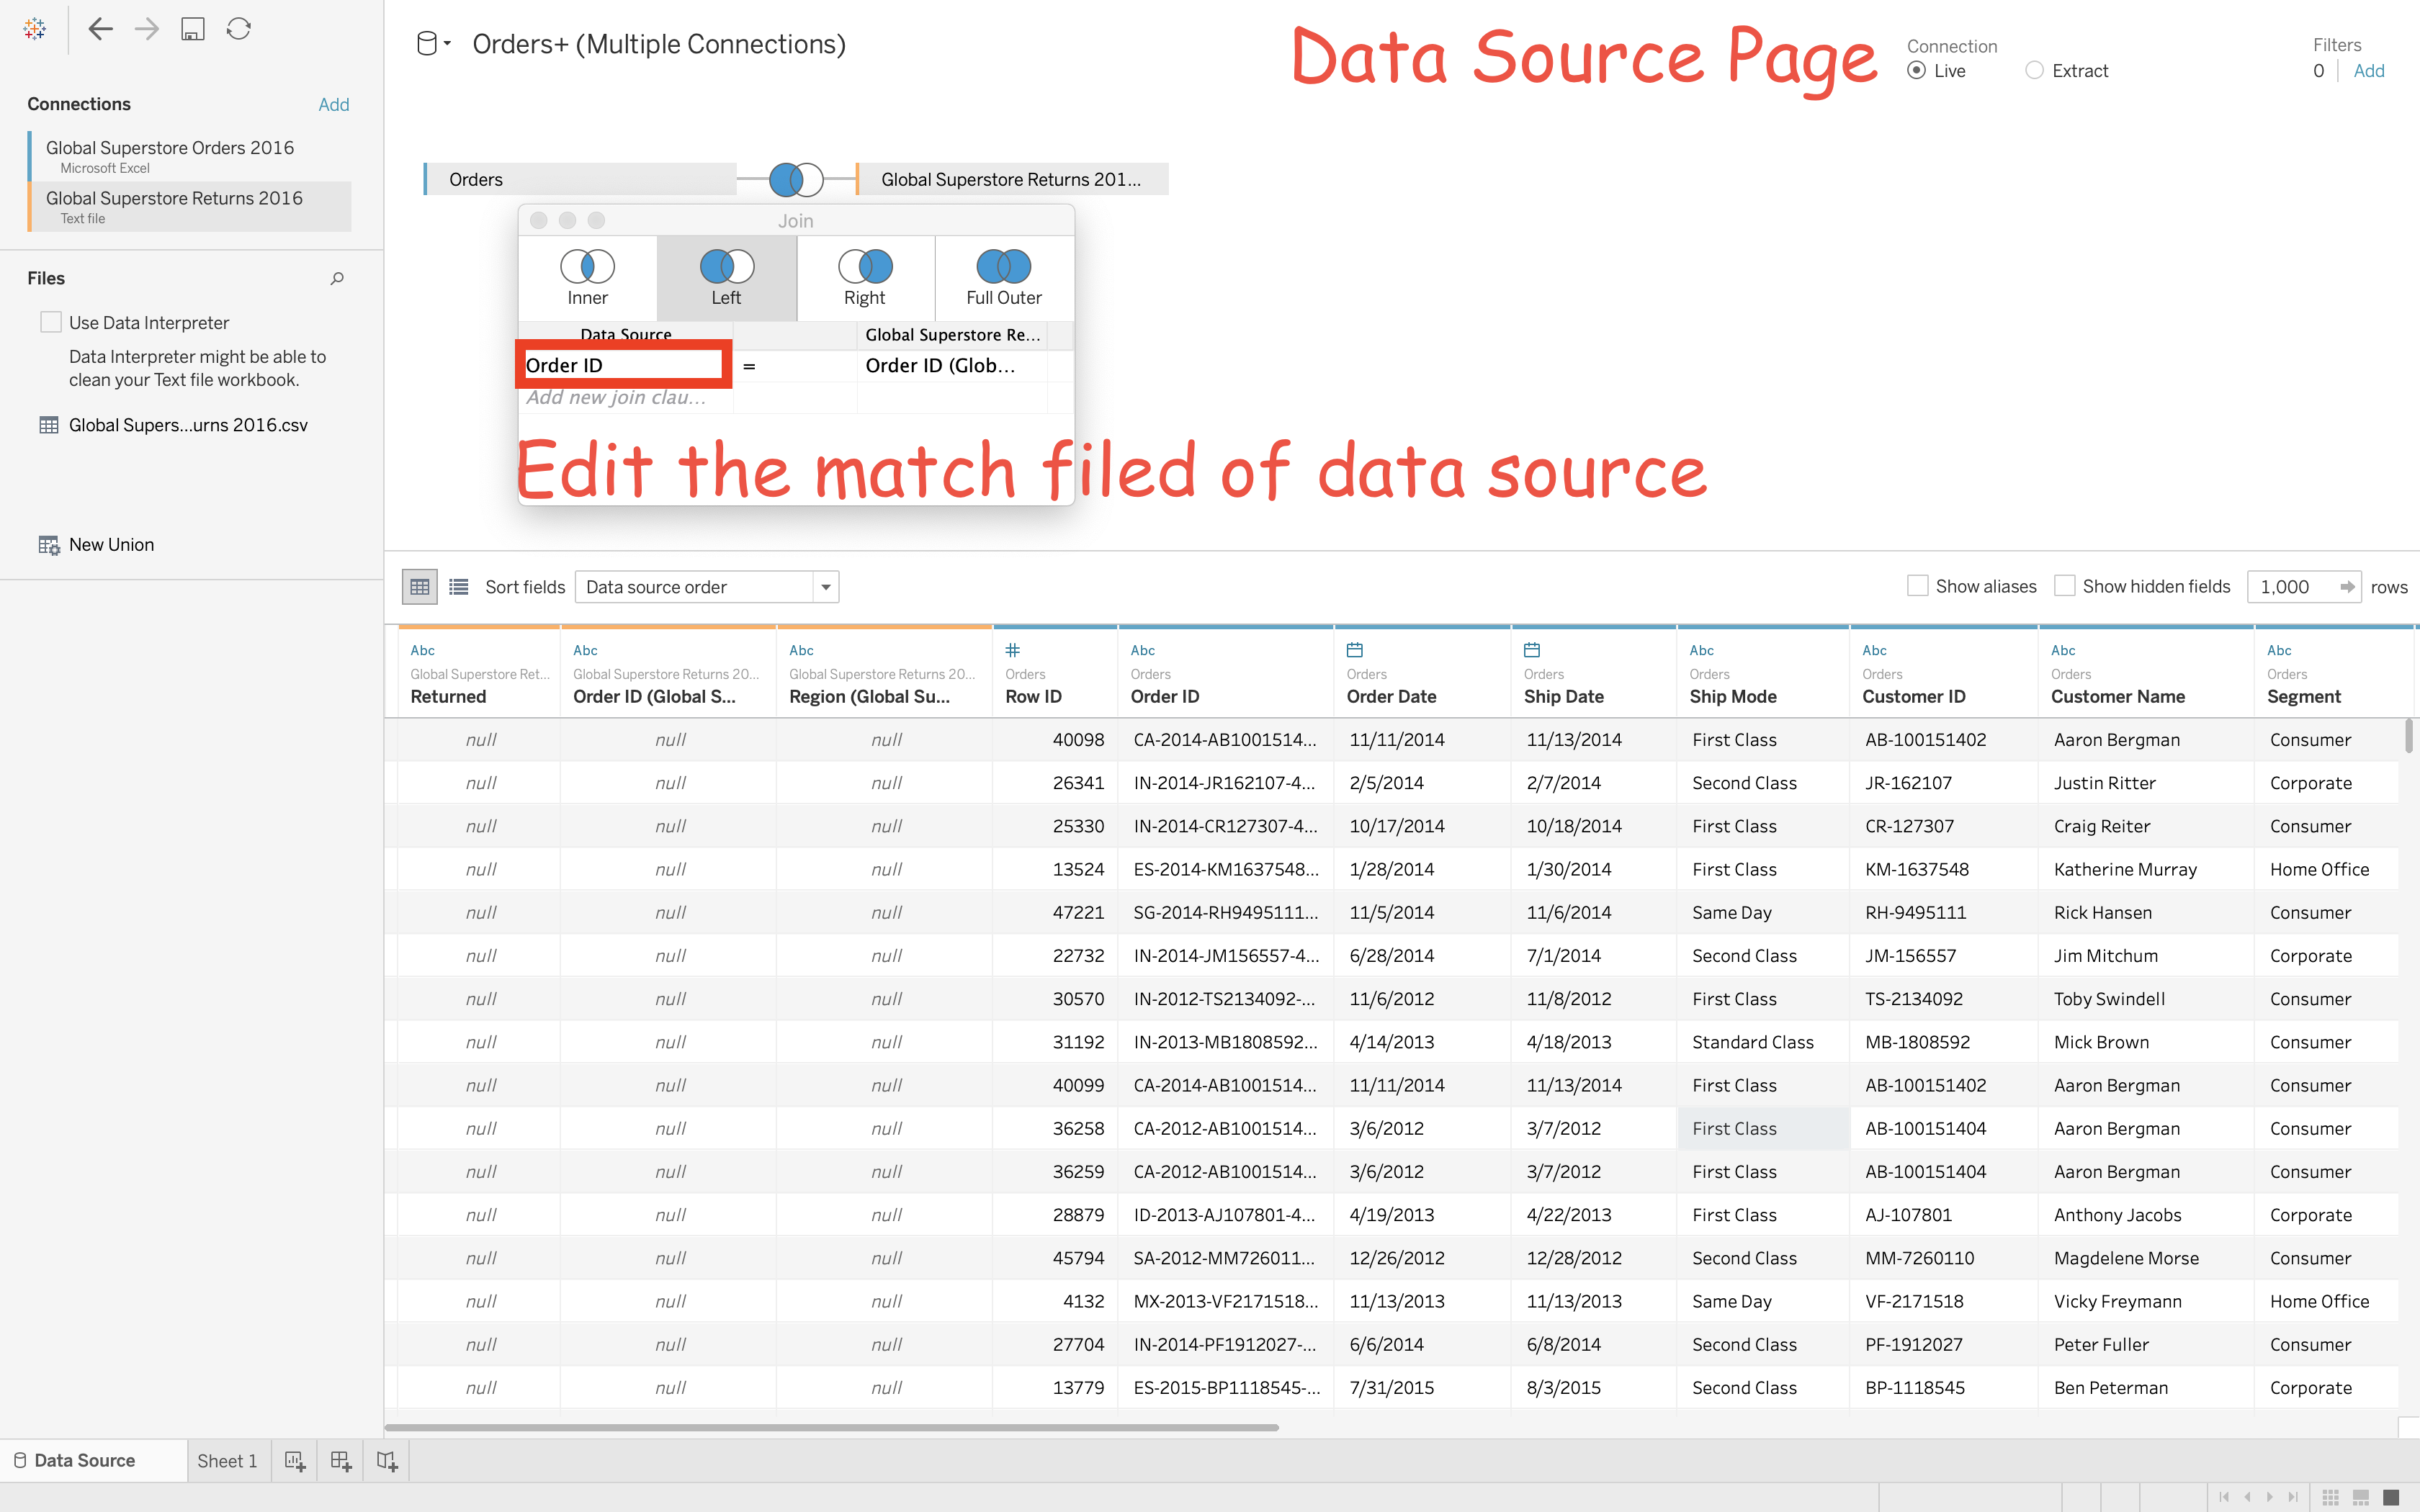
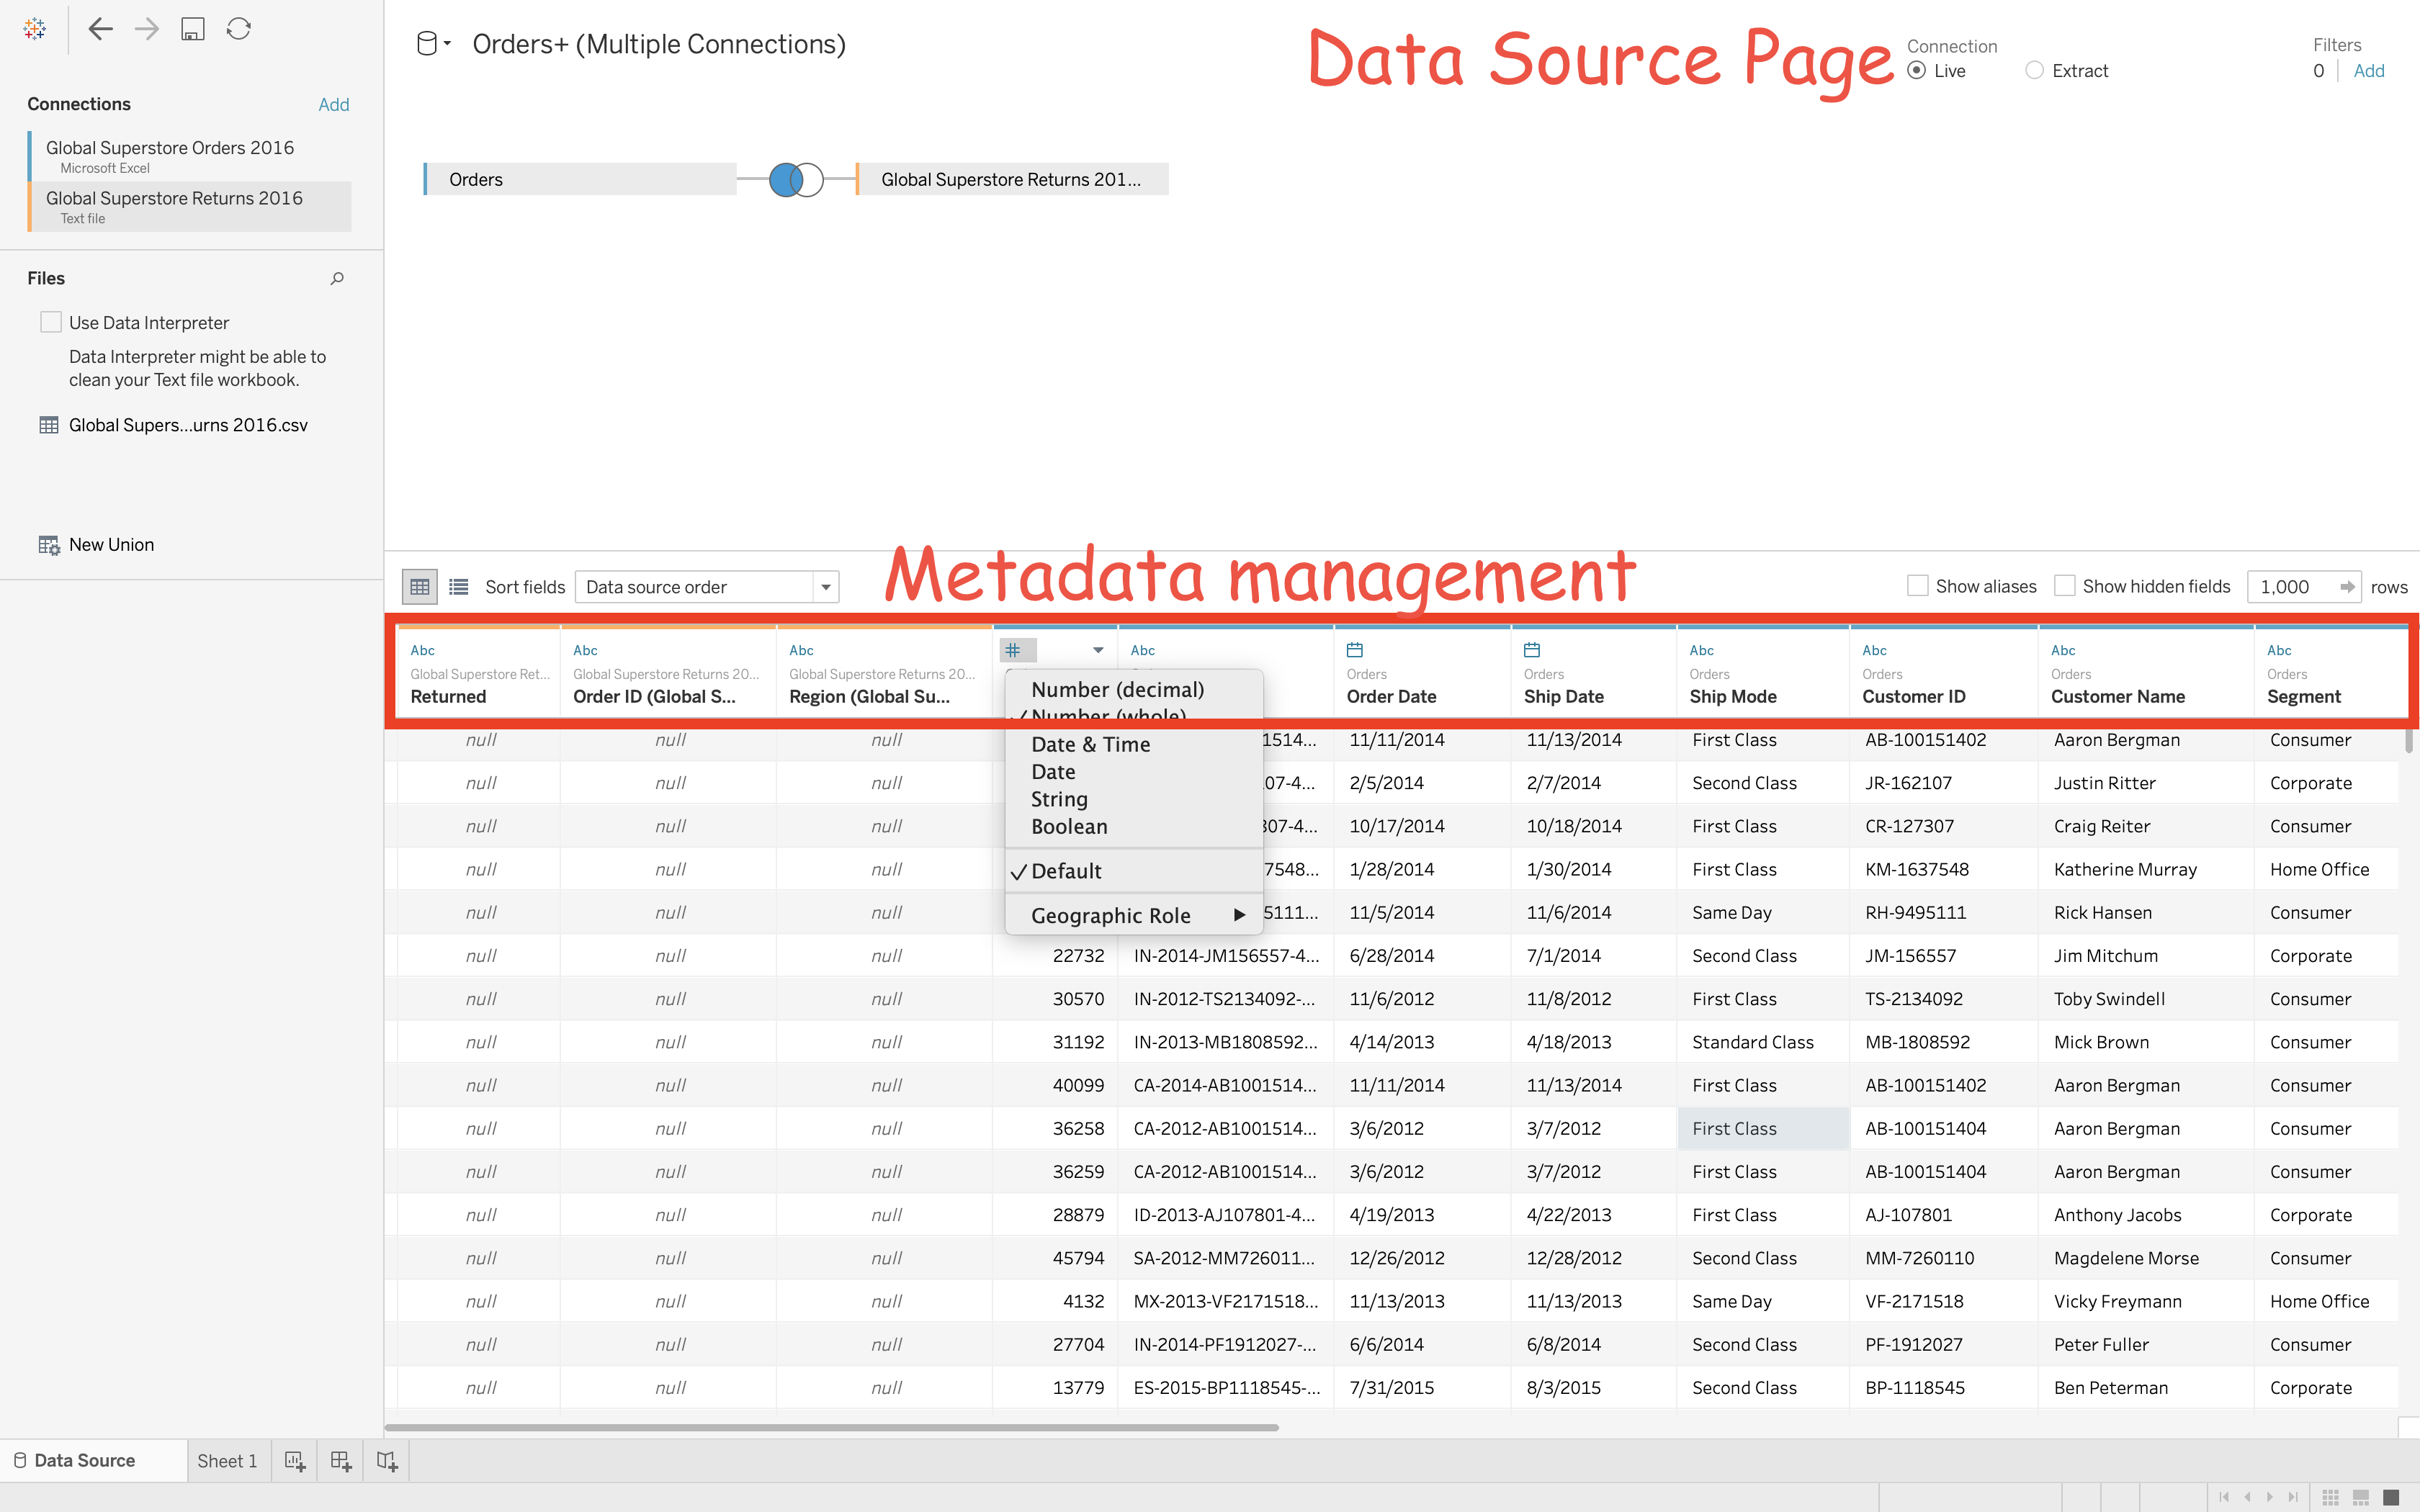
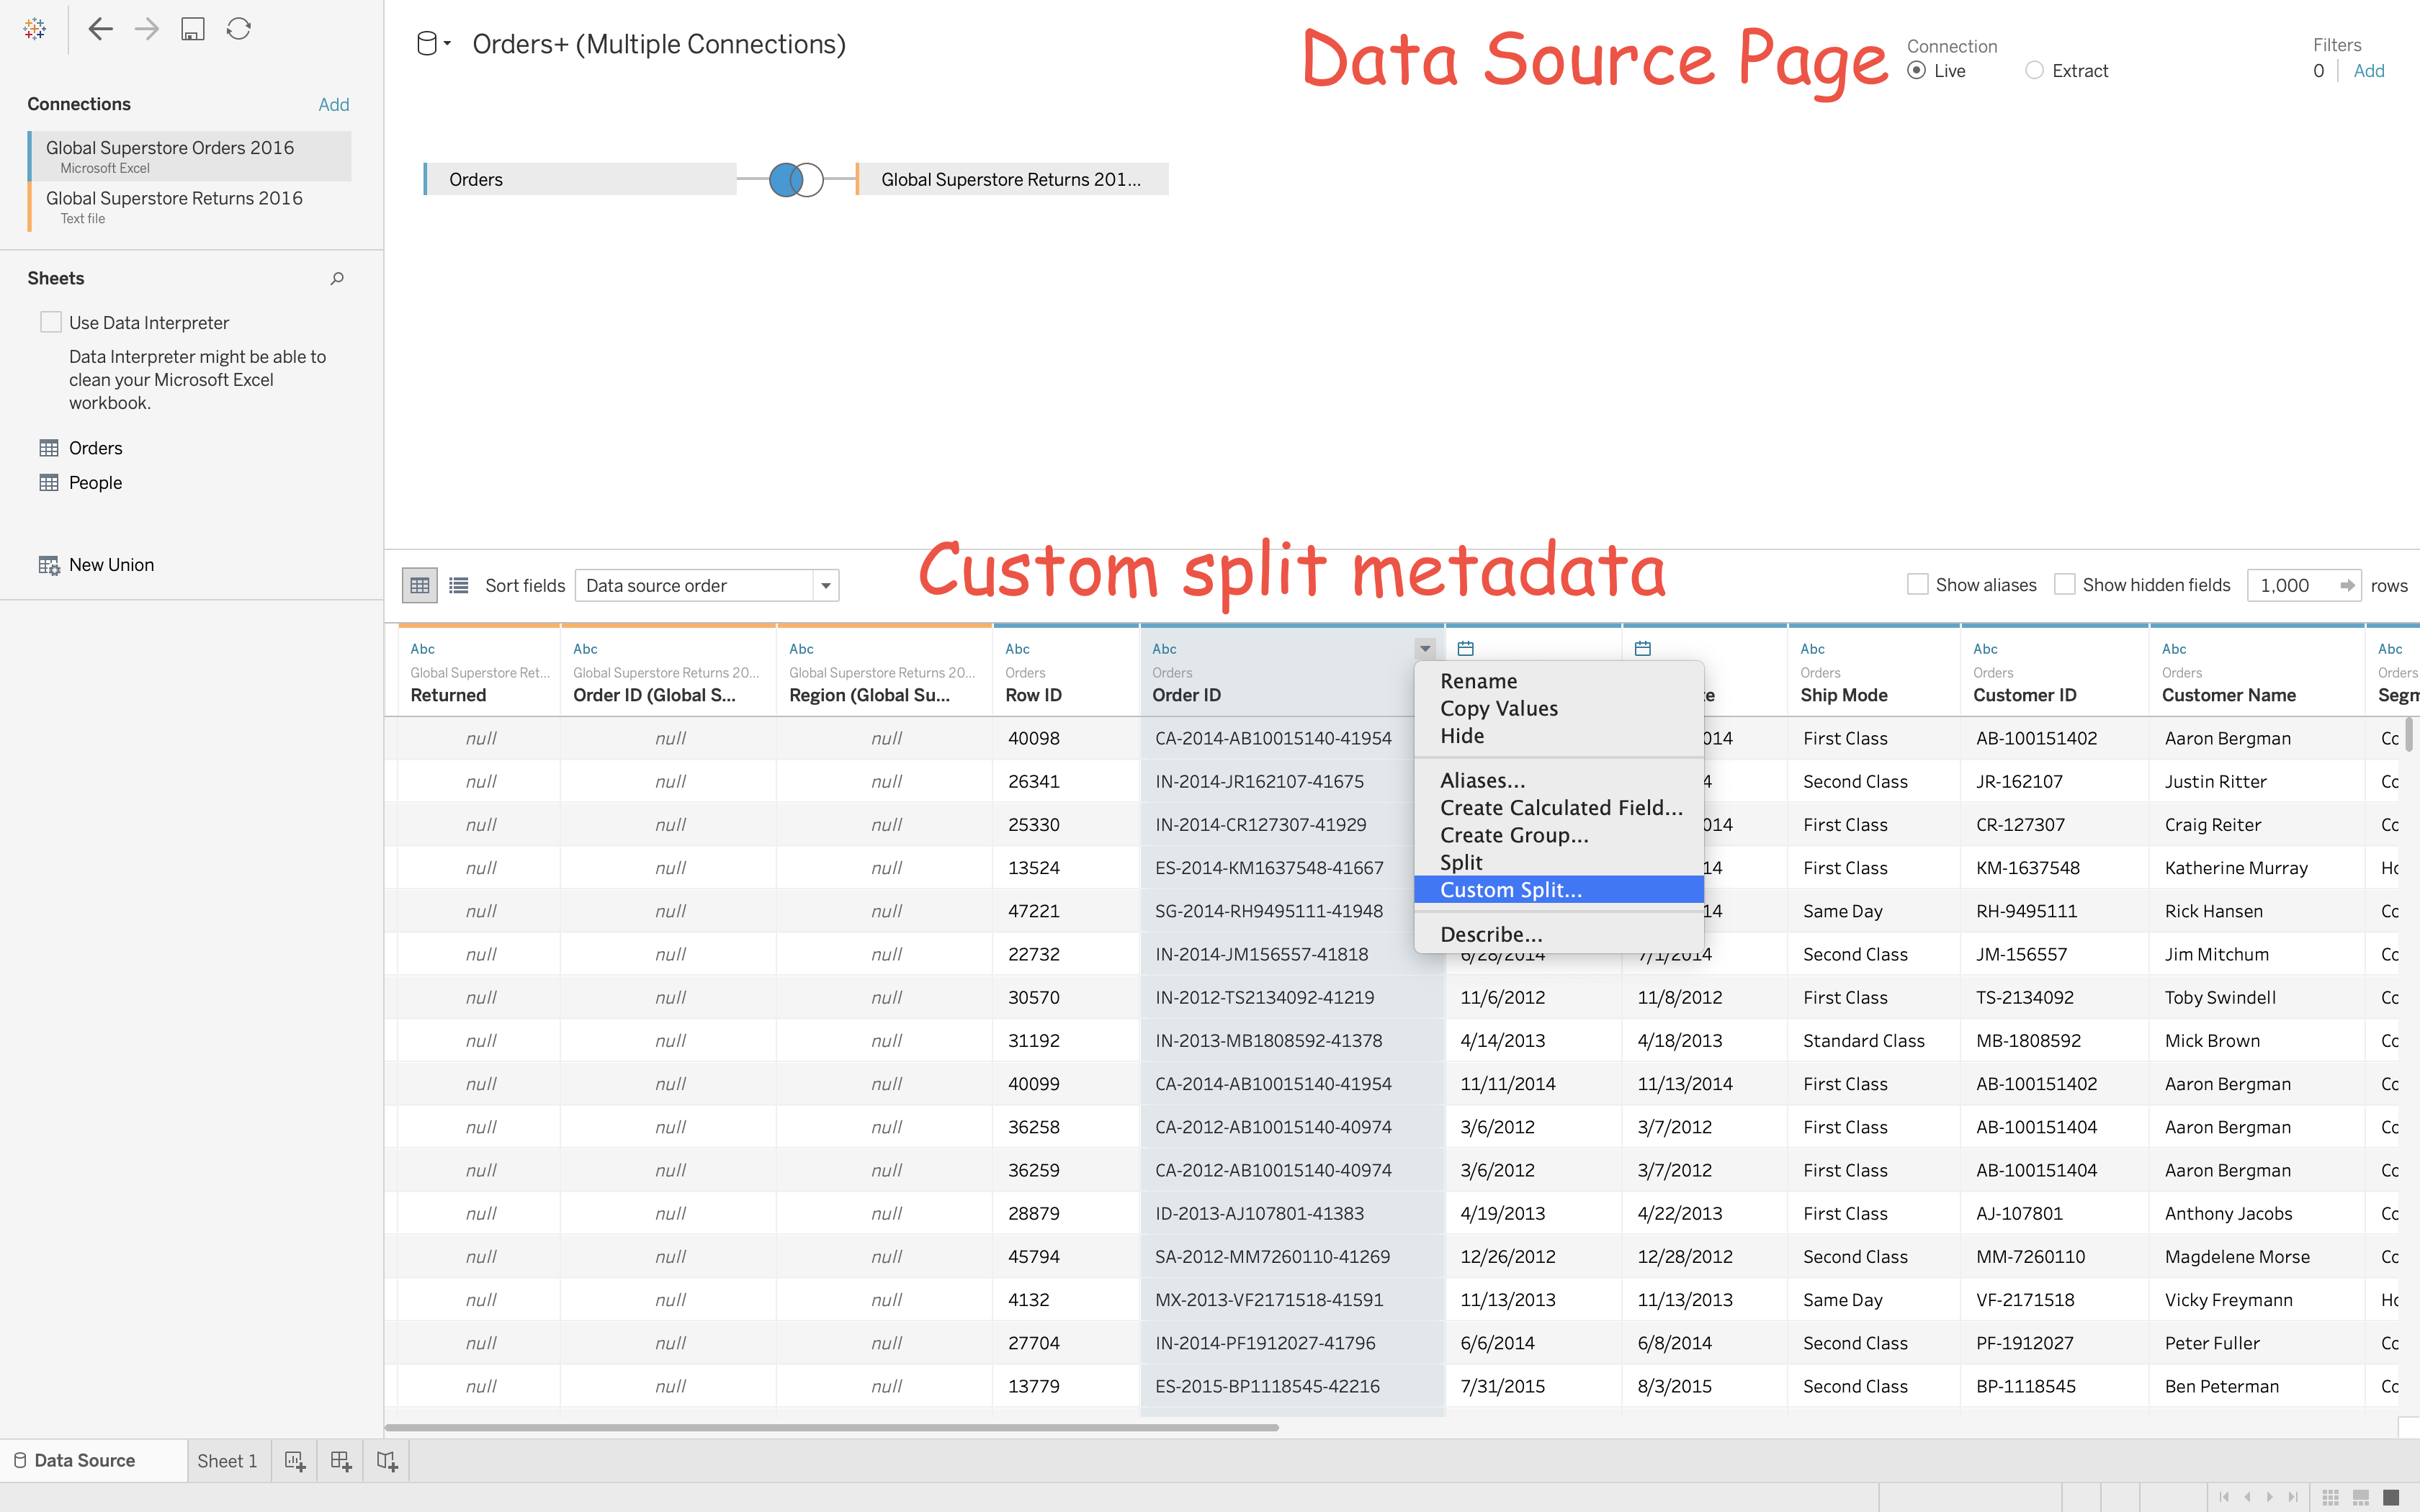
Data Source Page
Metadata Management
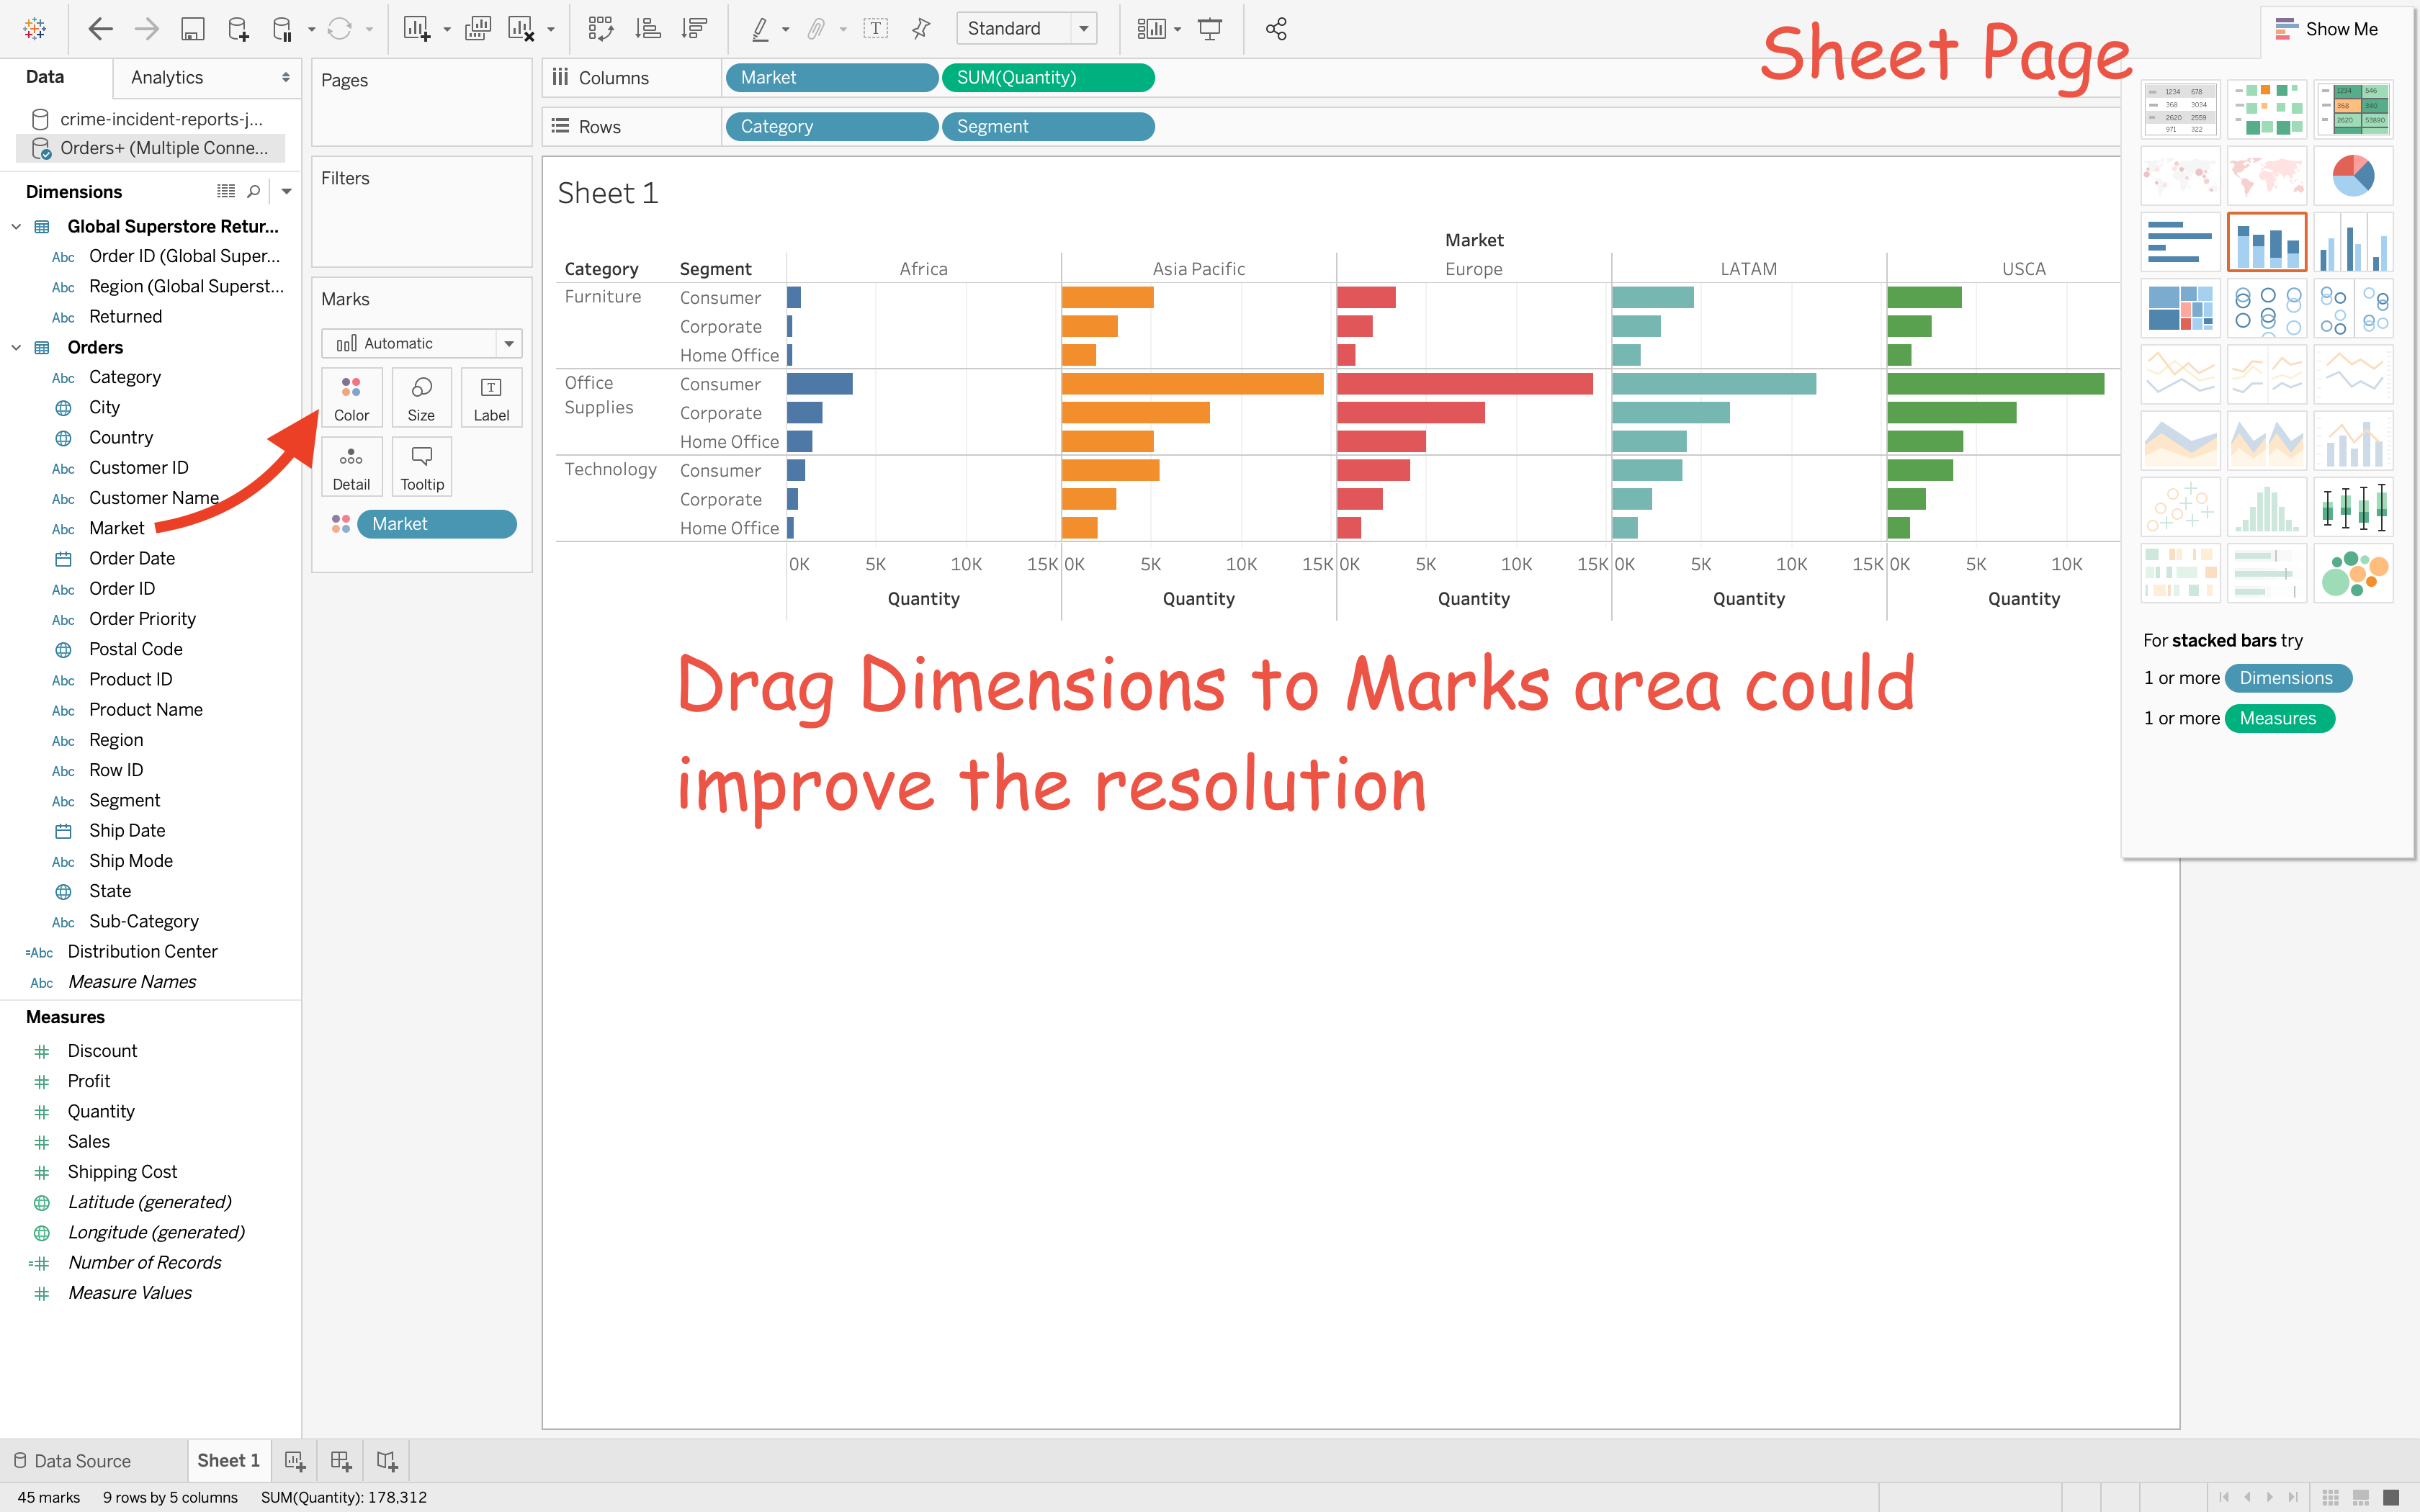
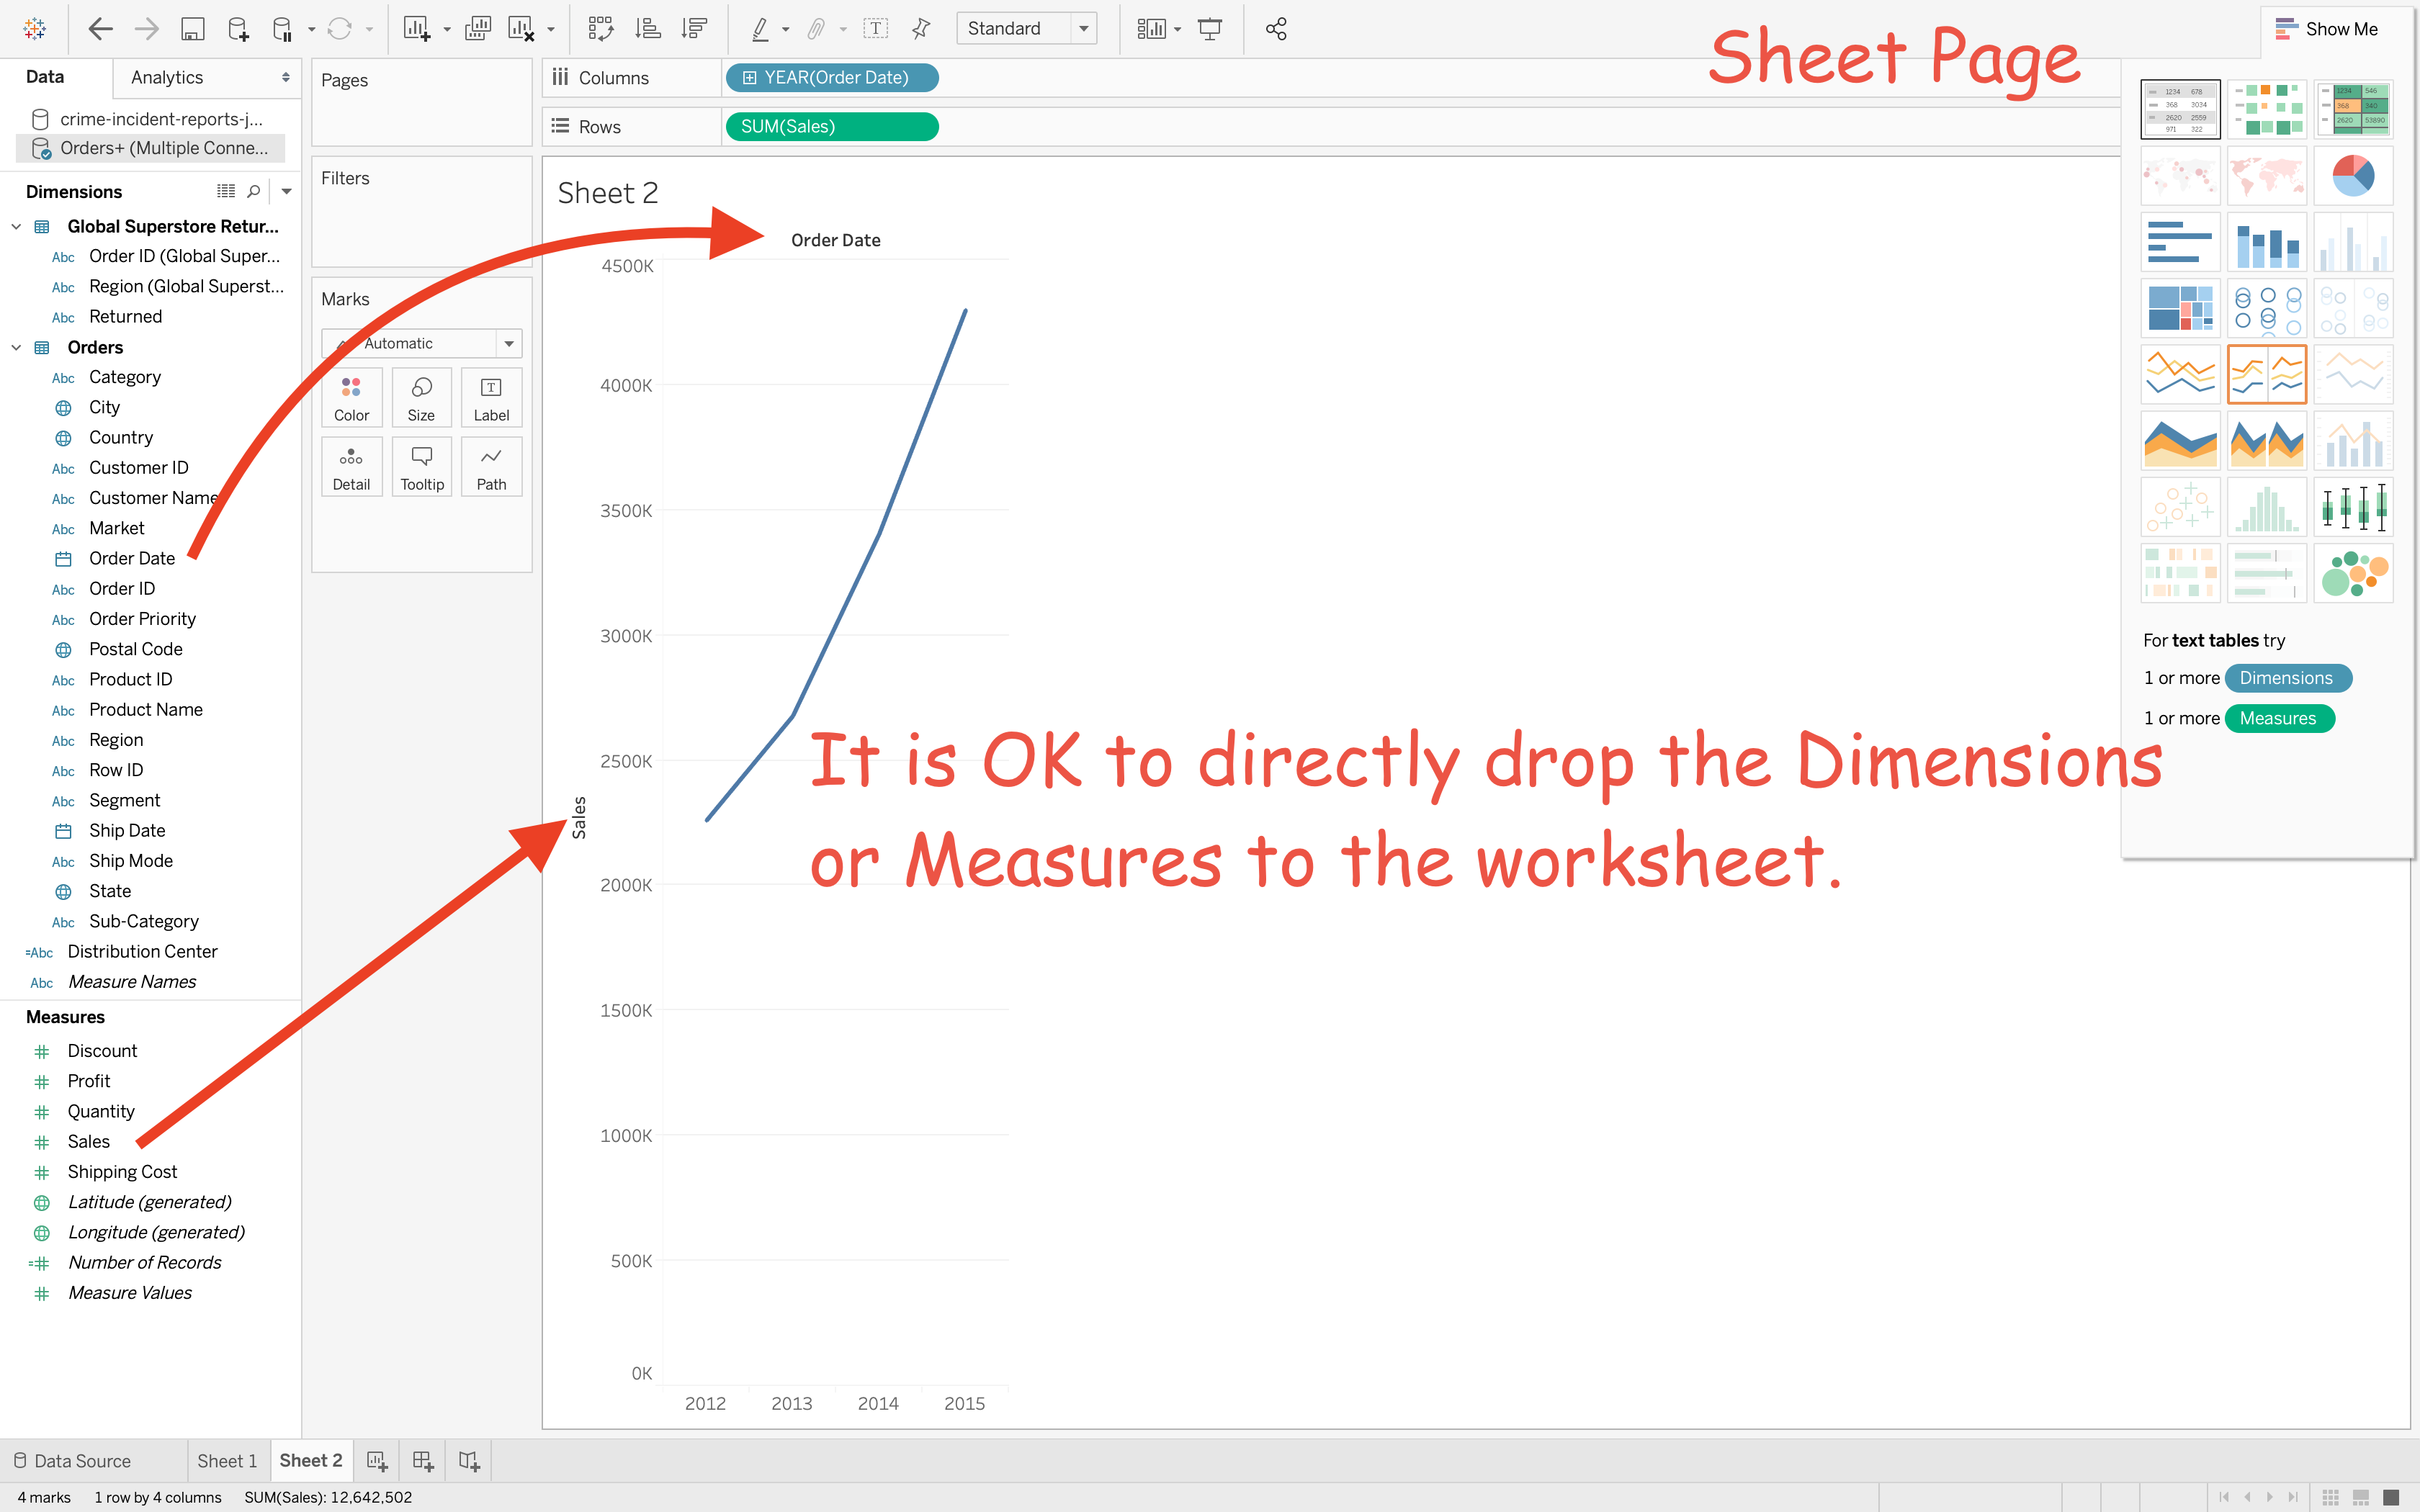
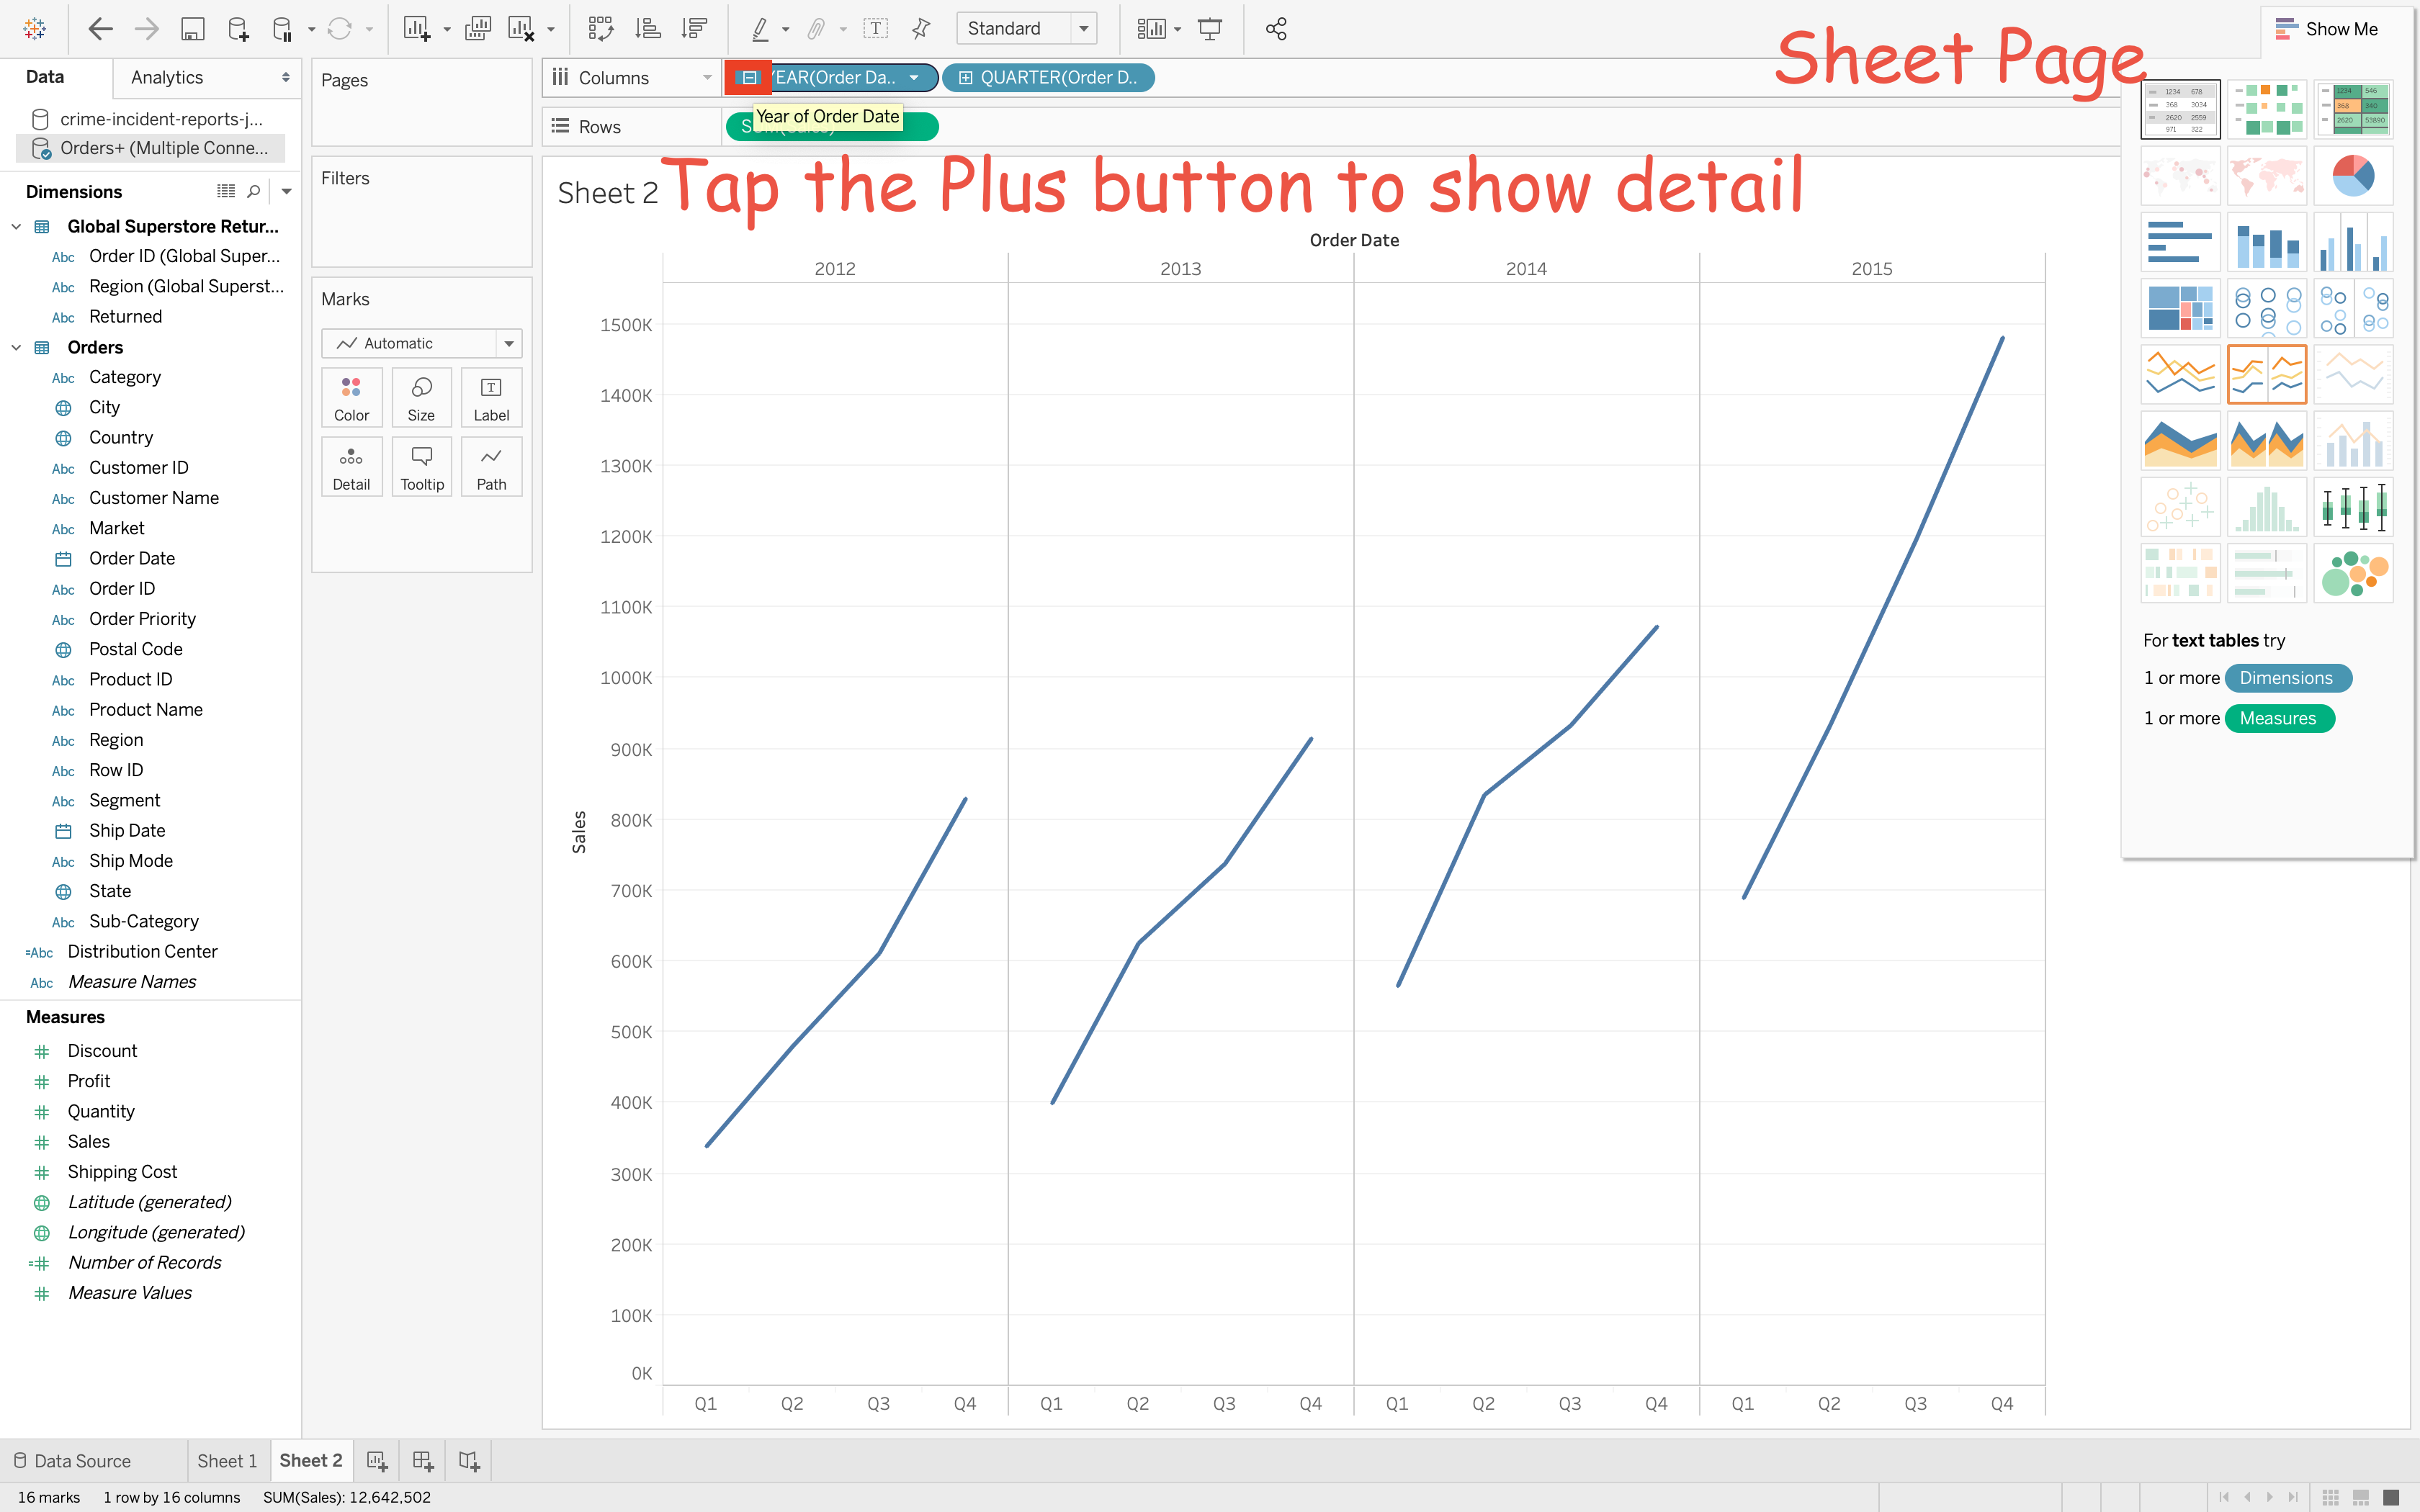
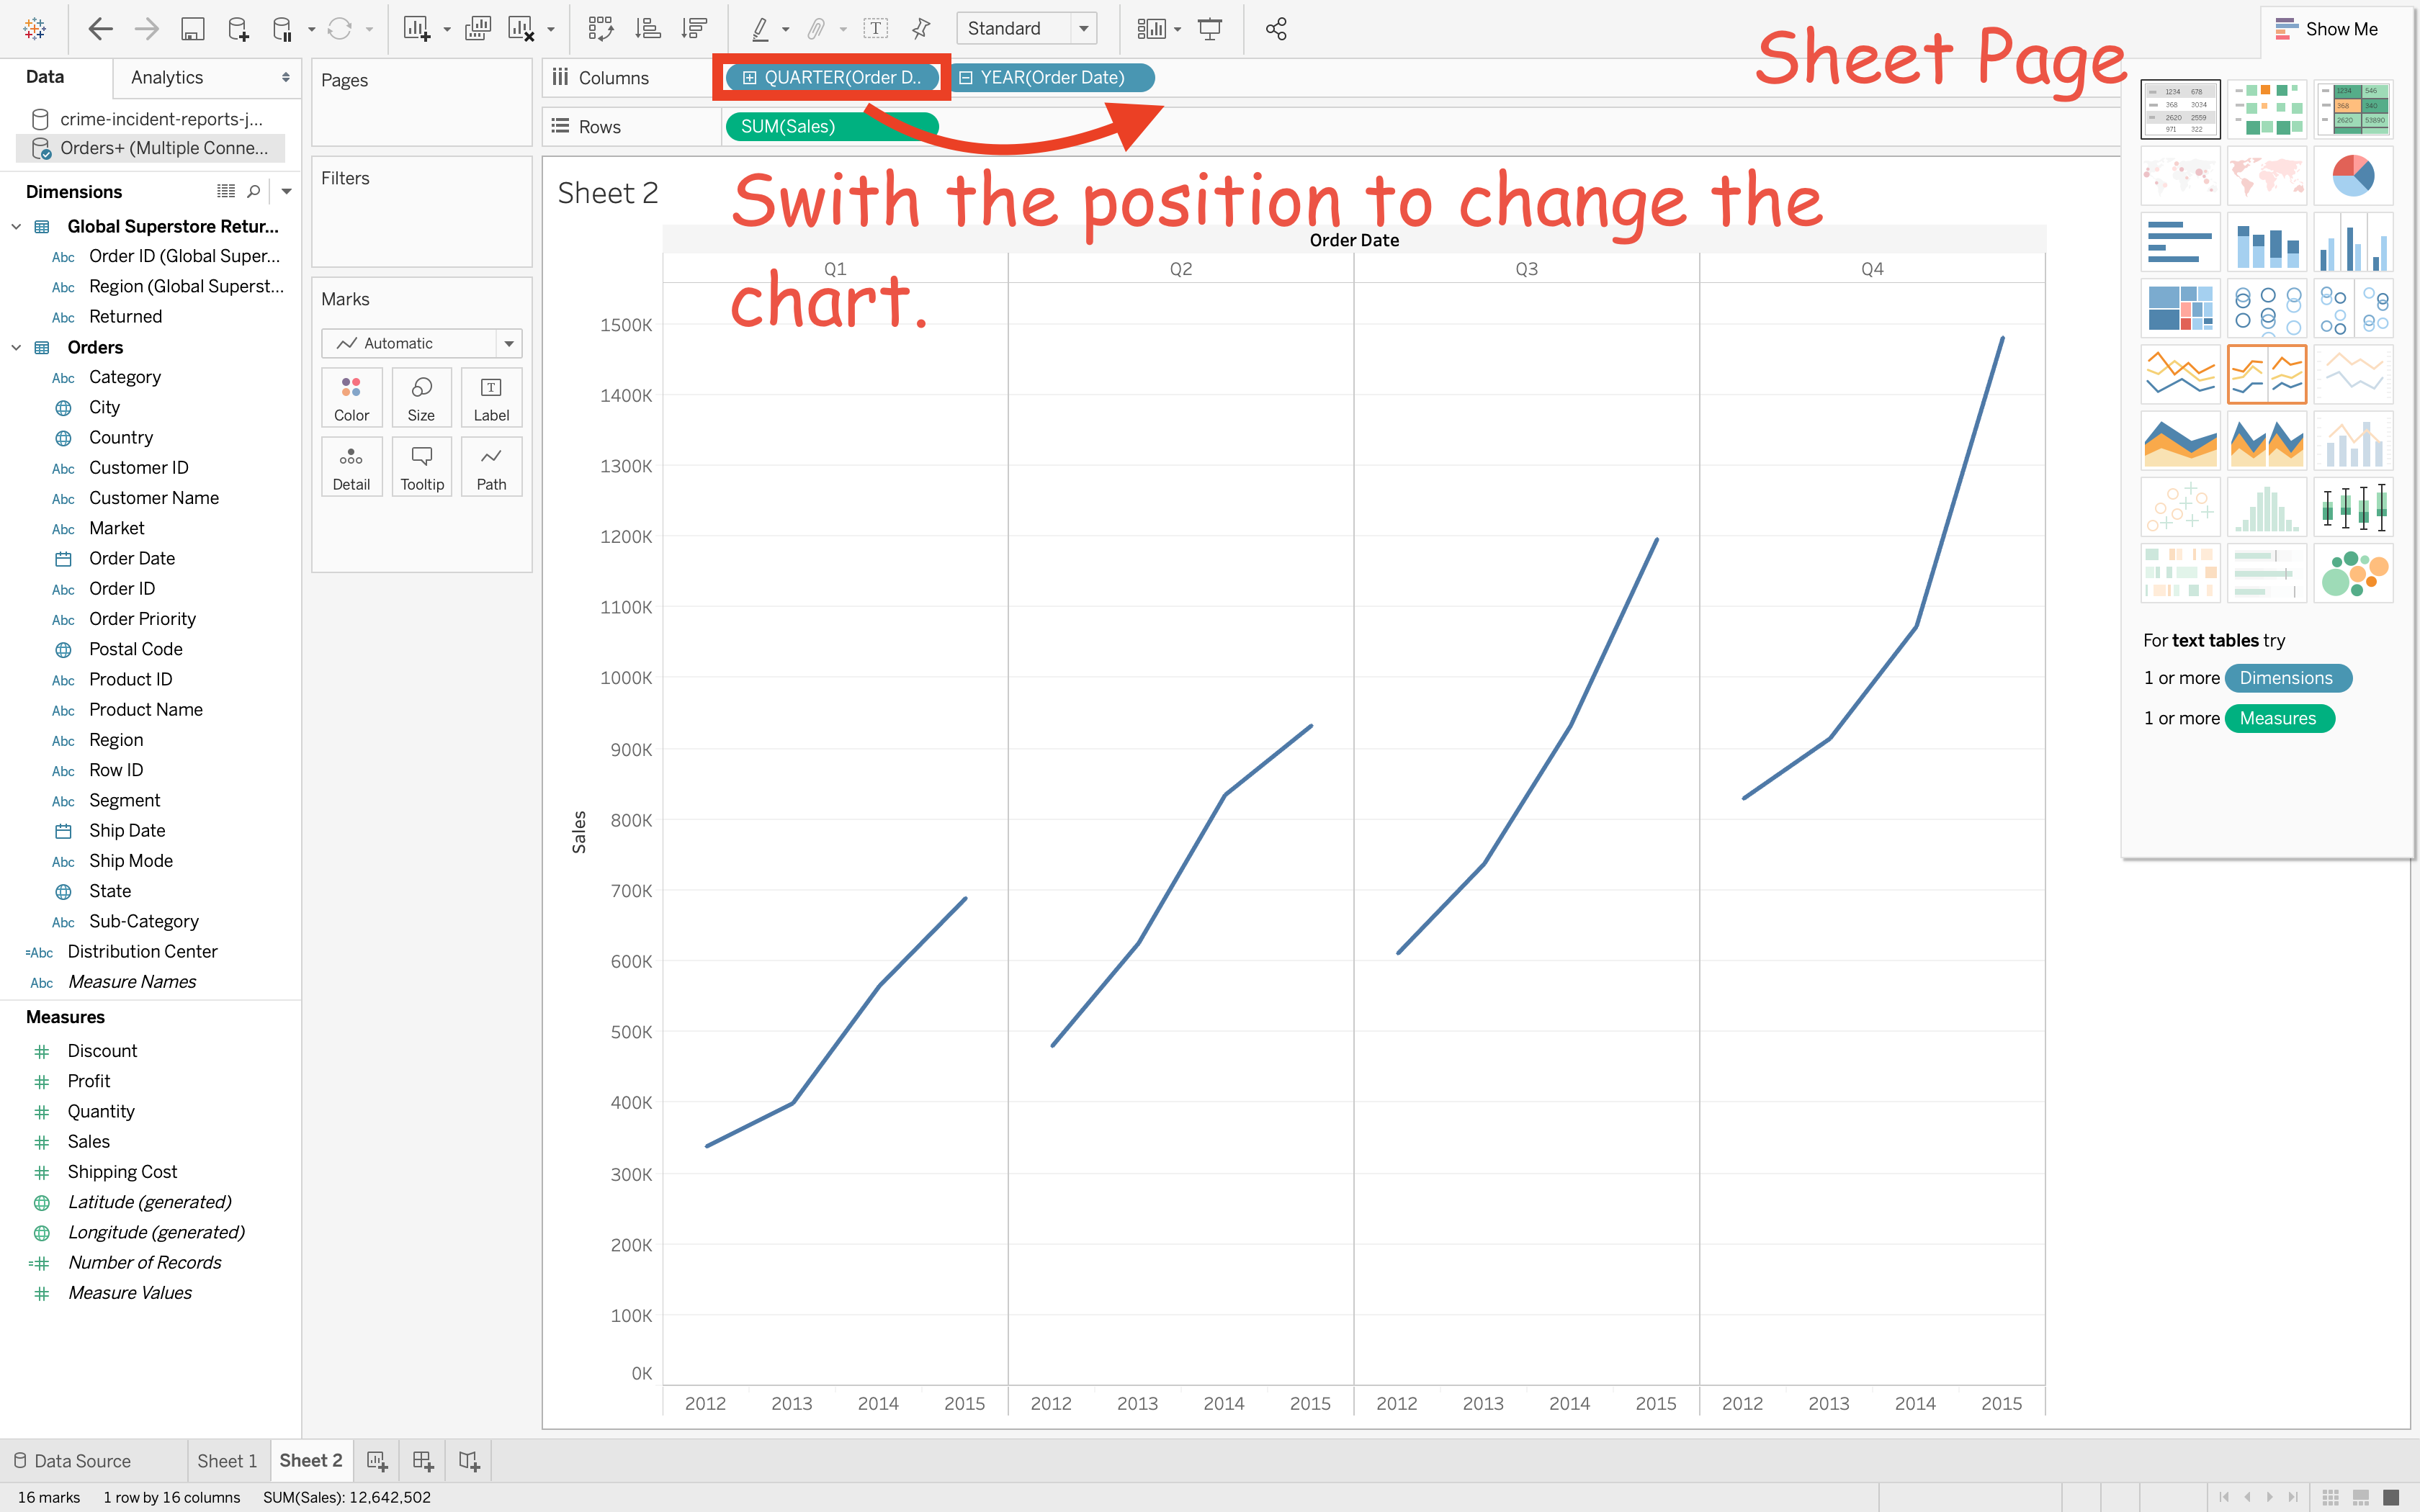
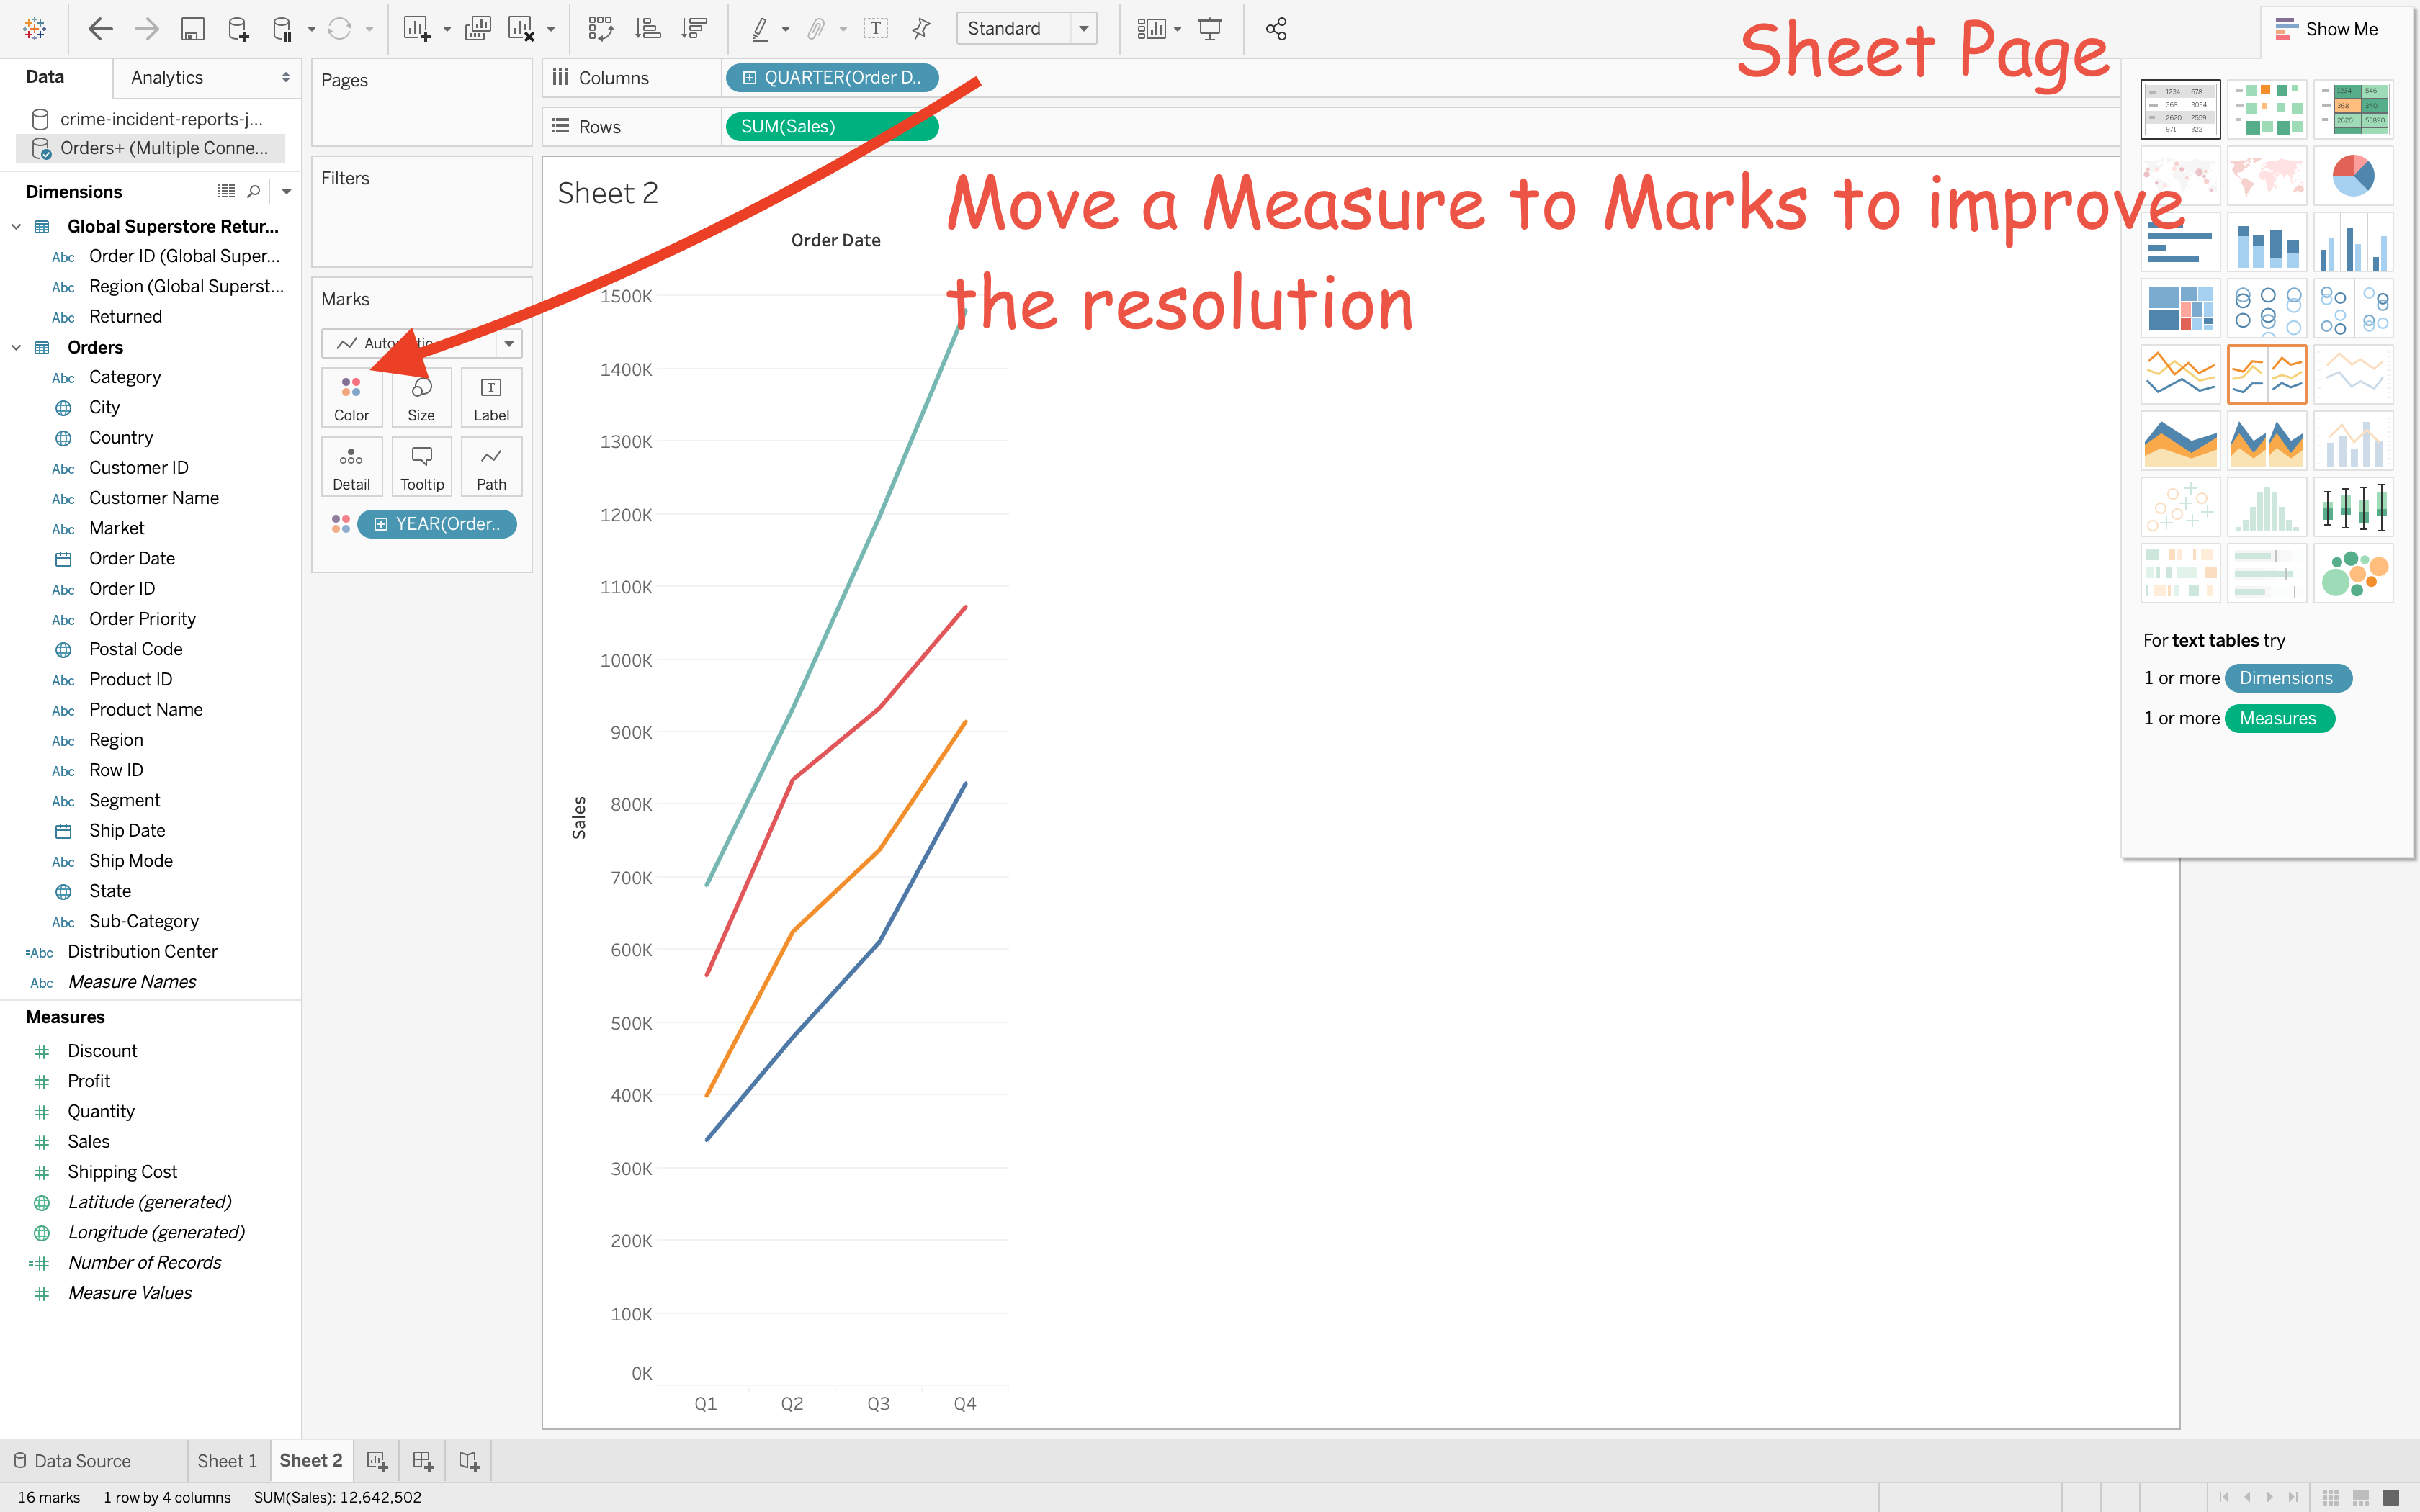
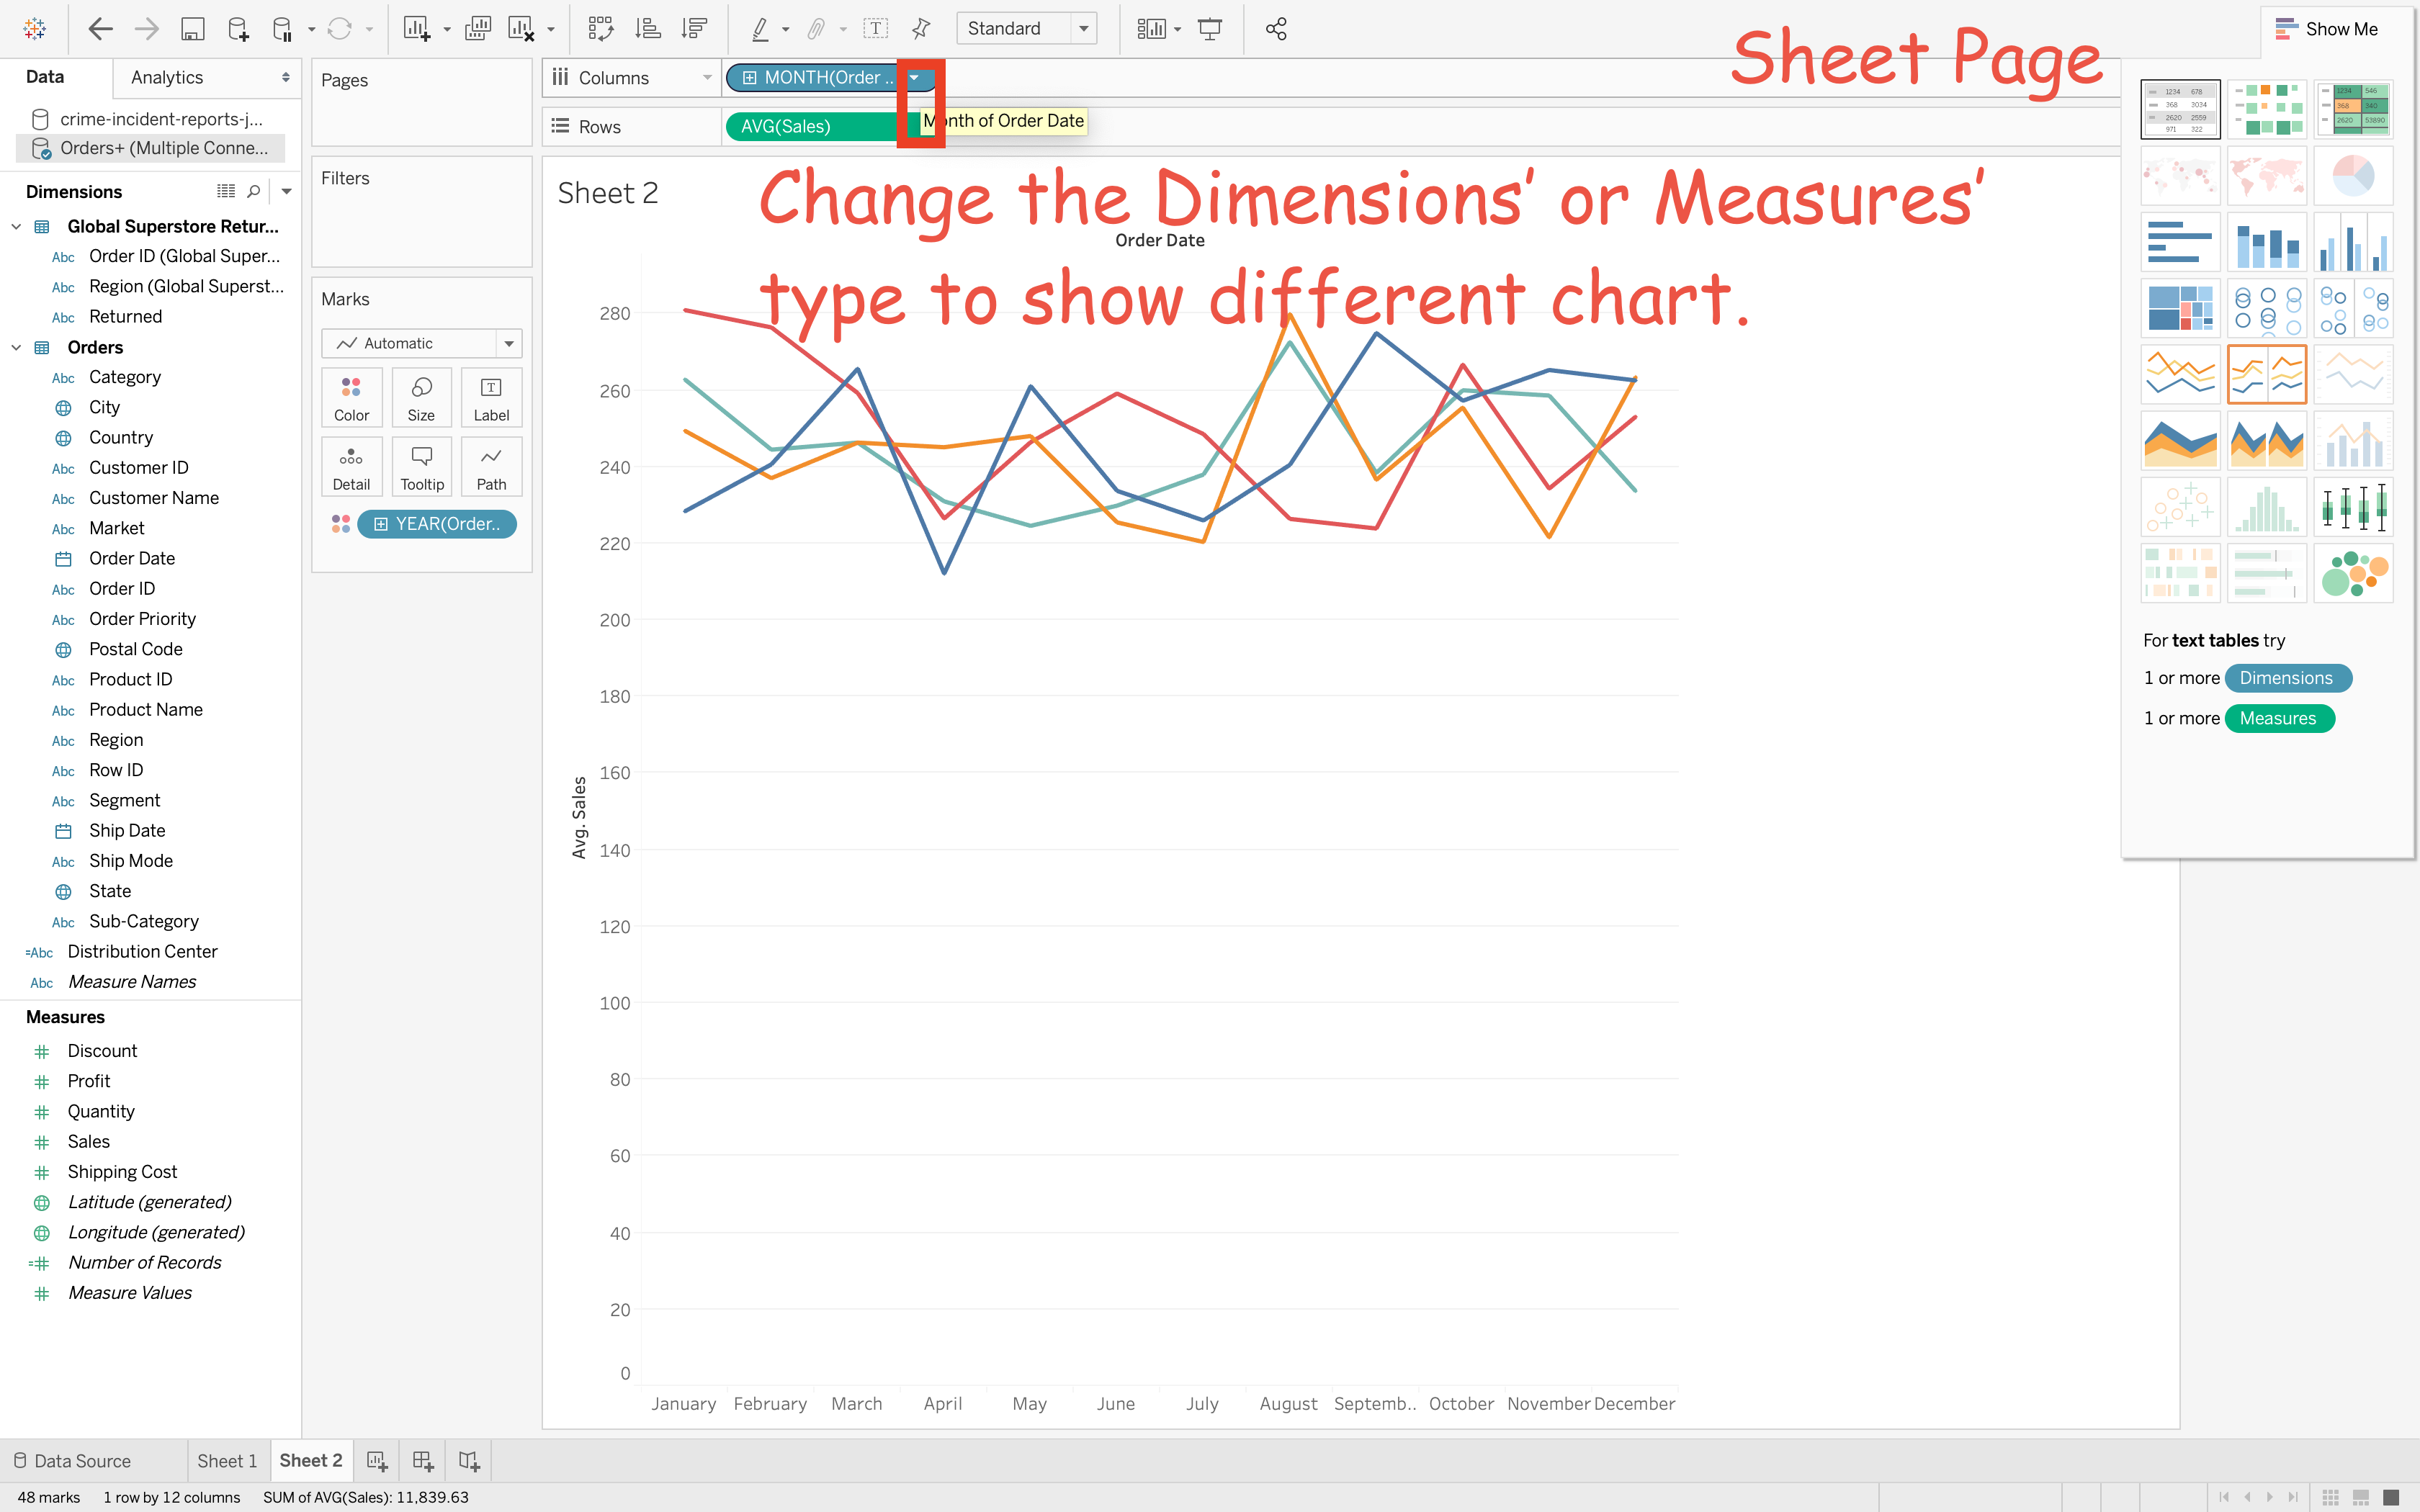
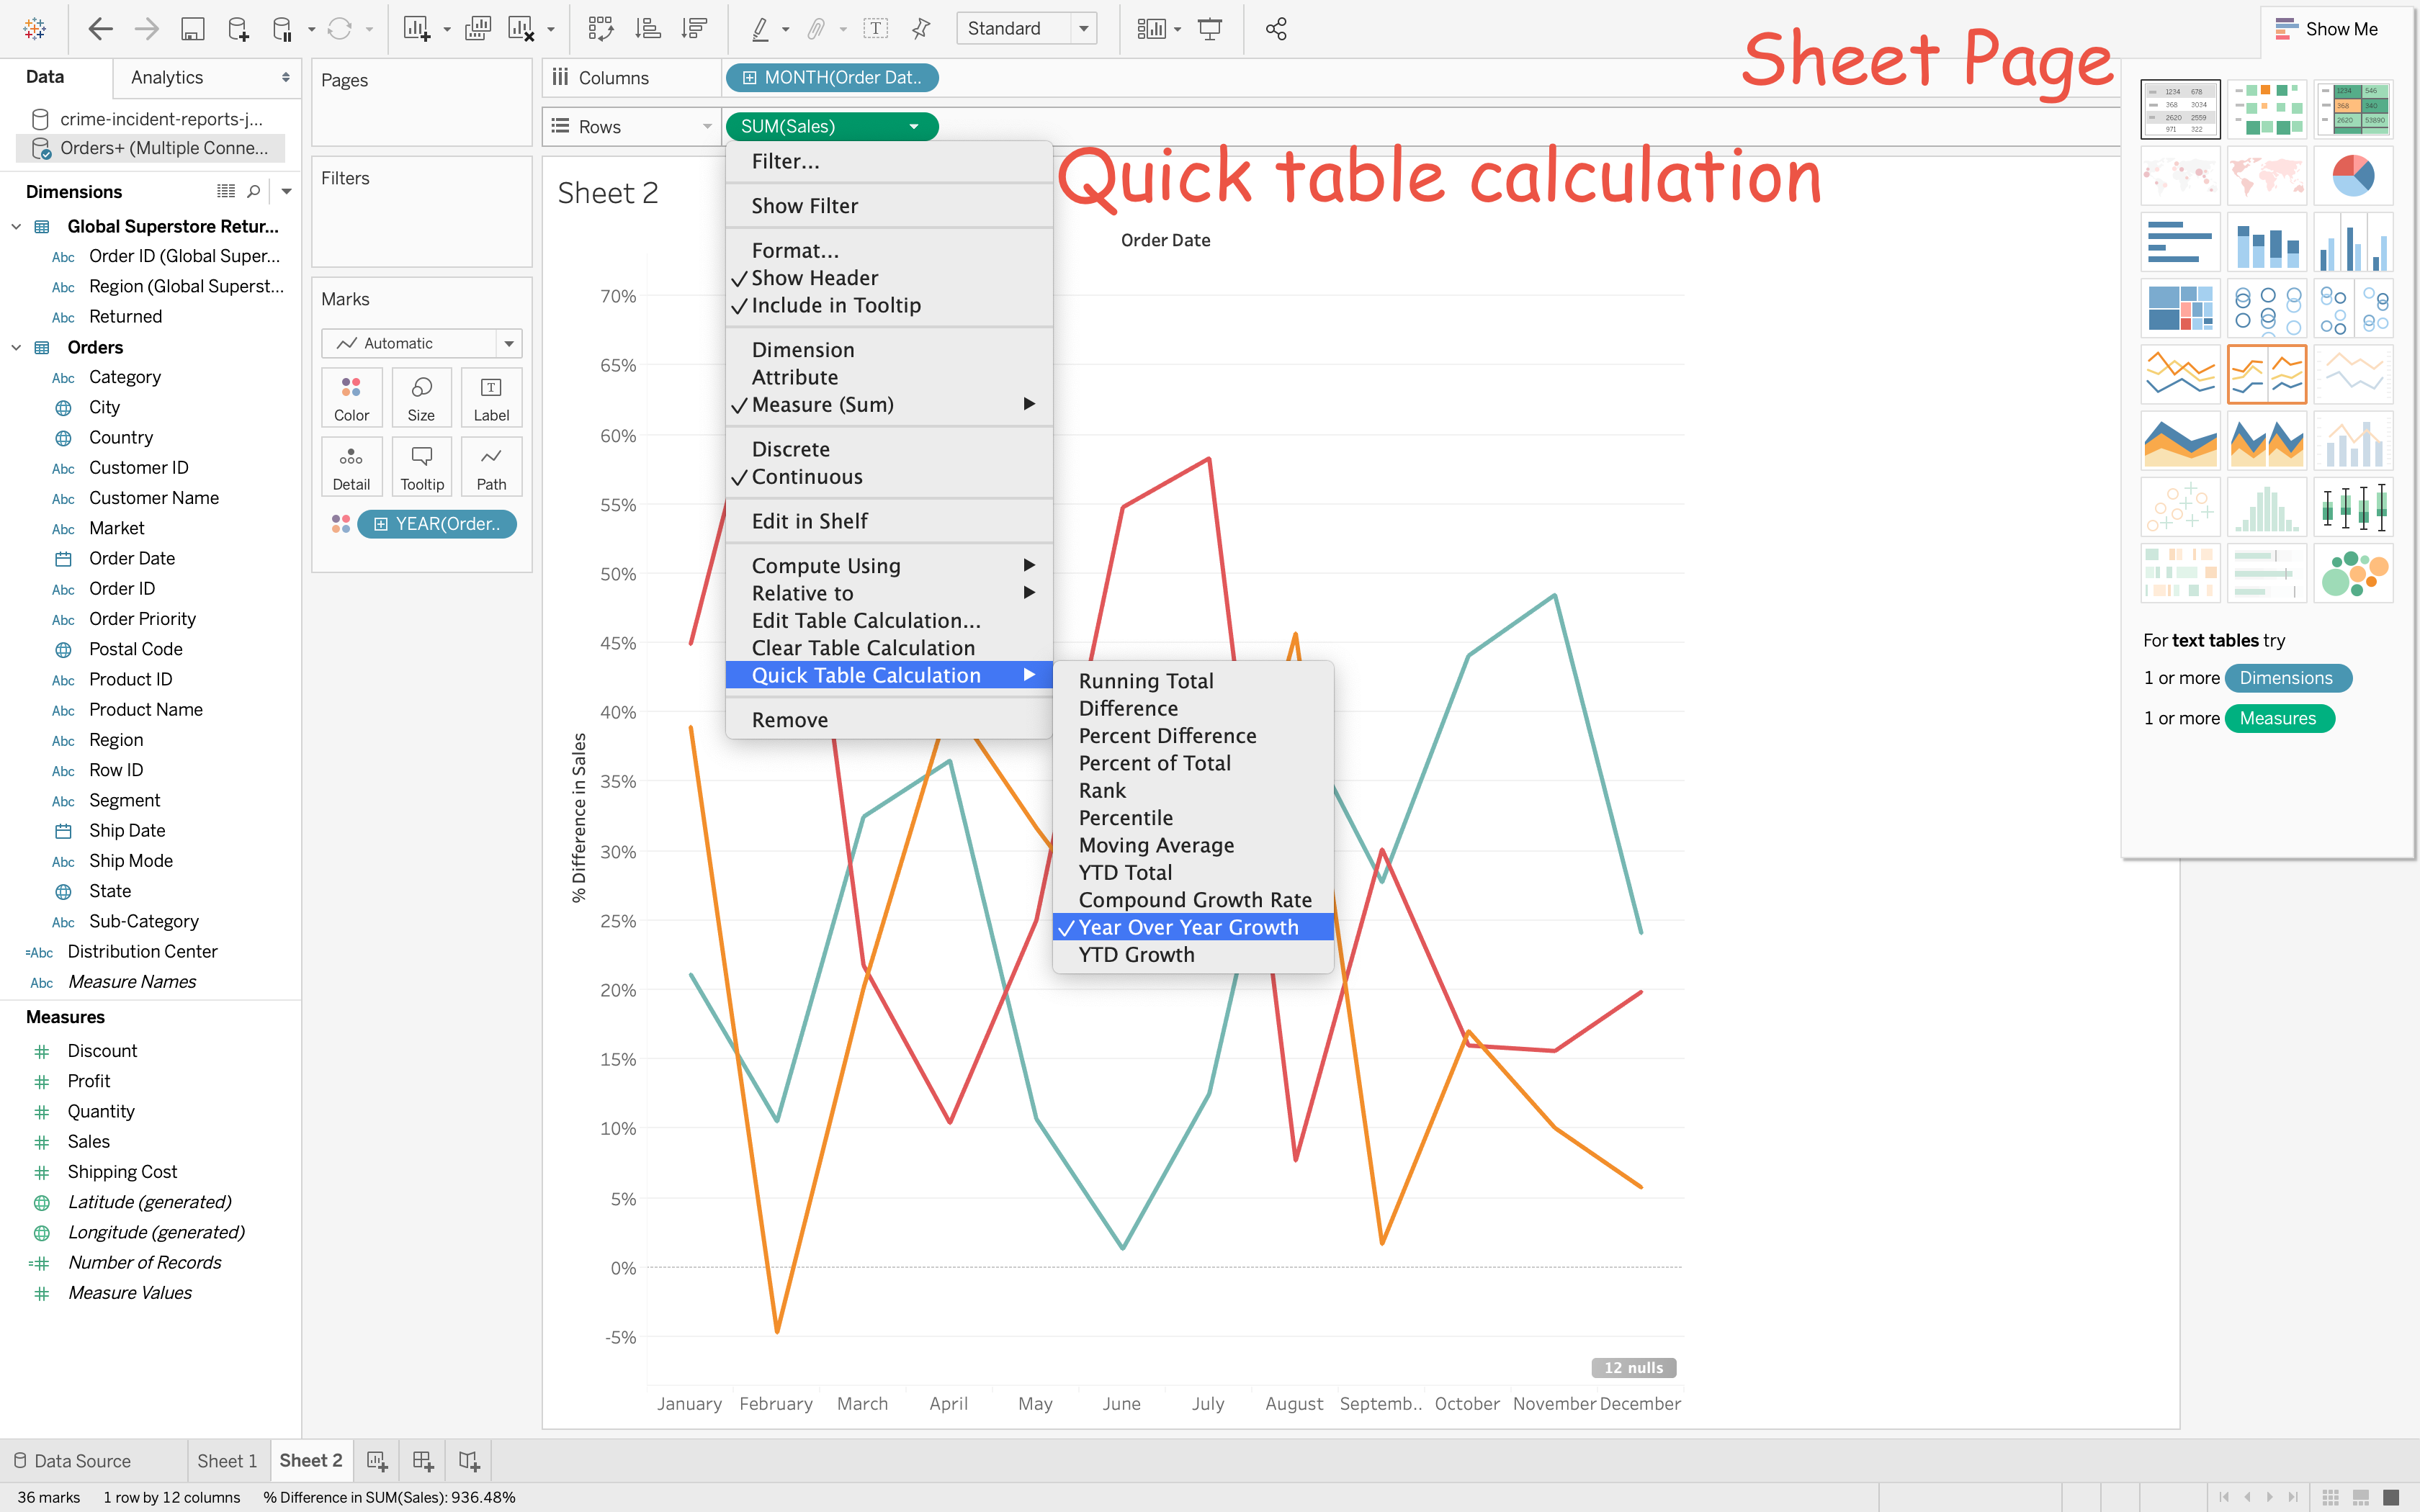
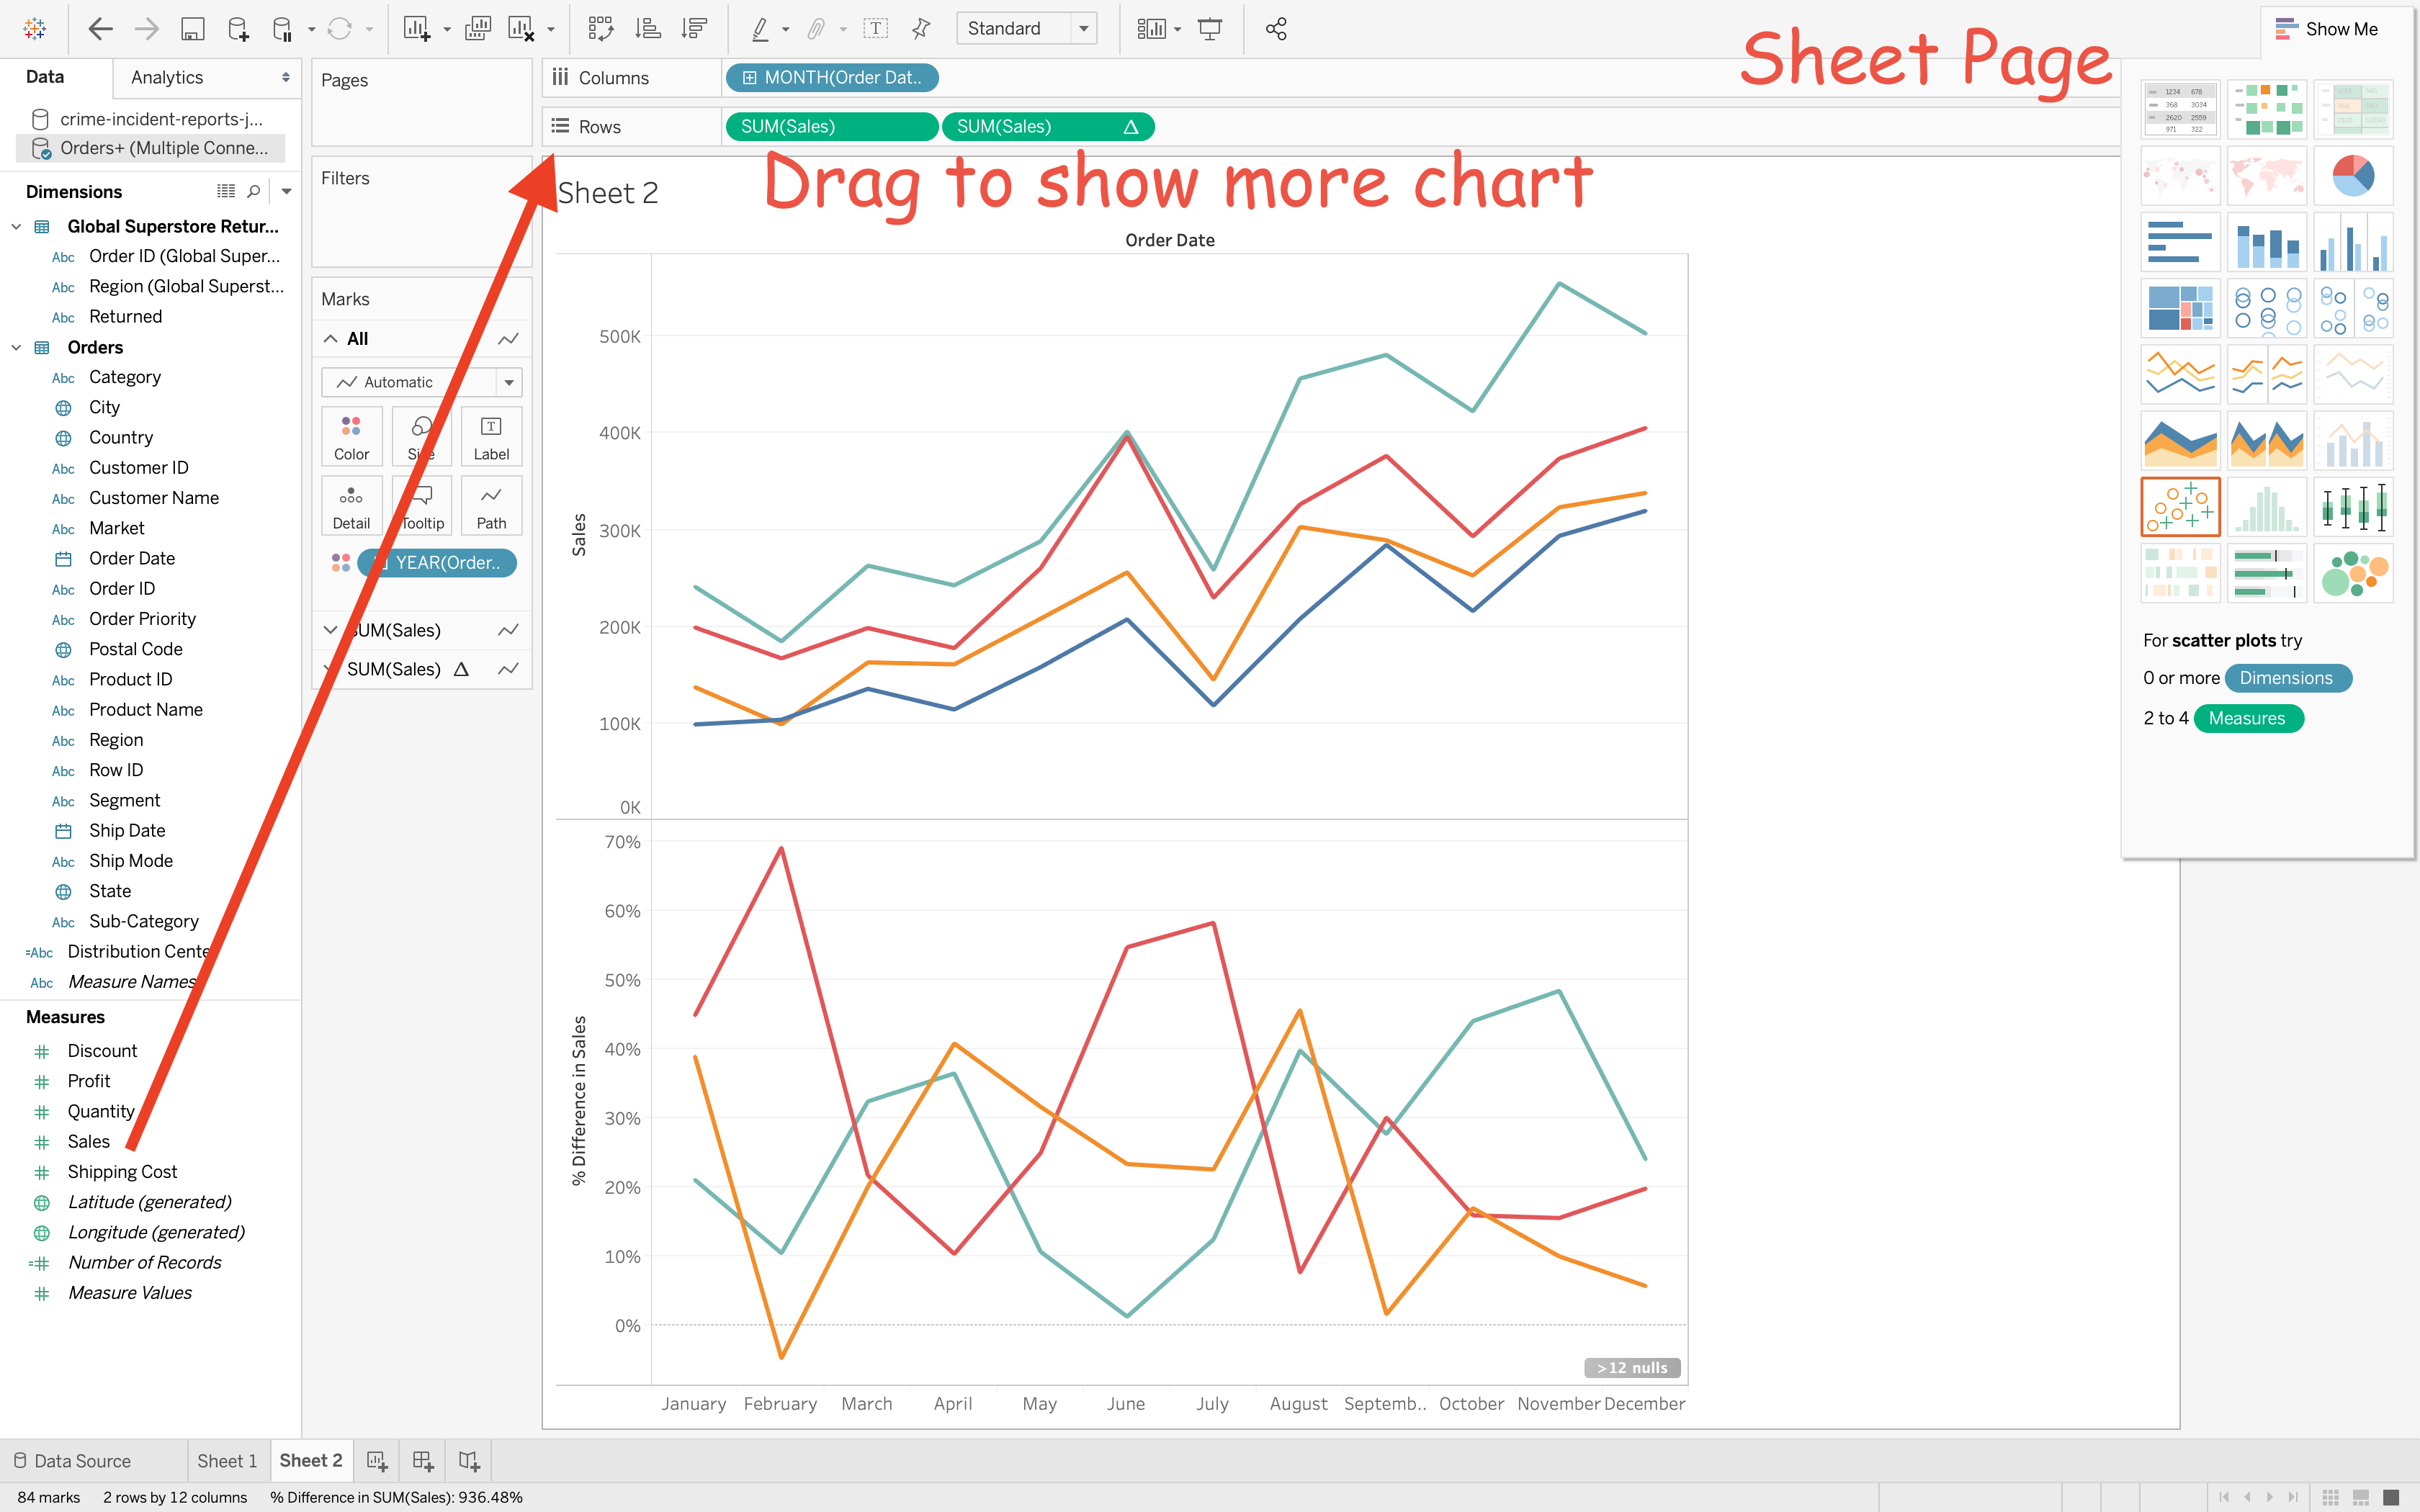
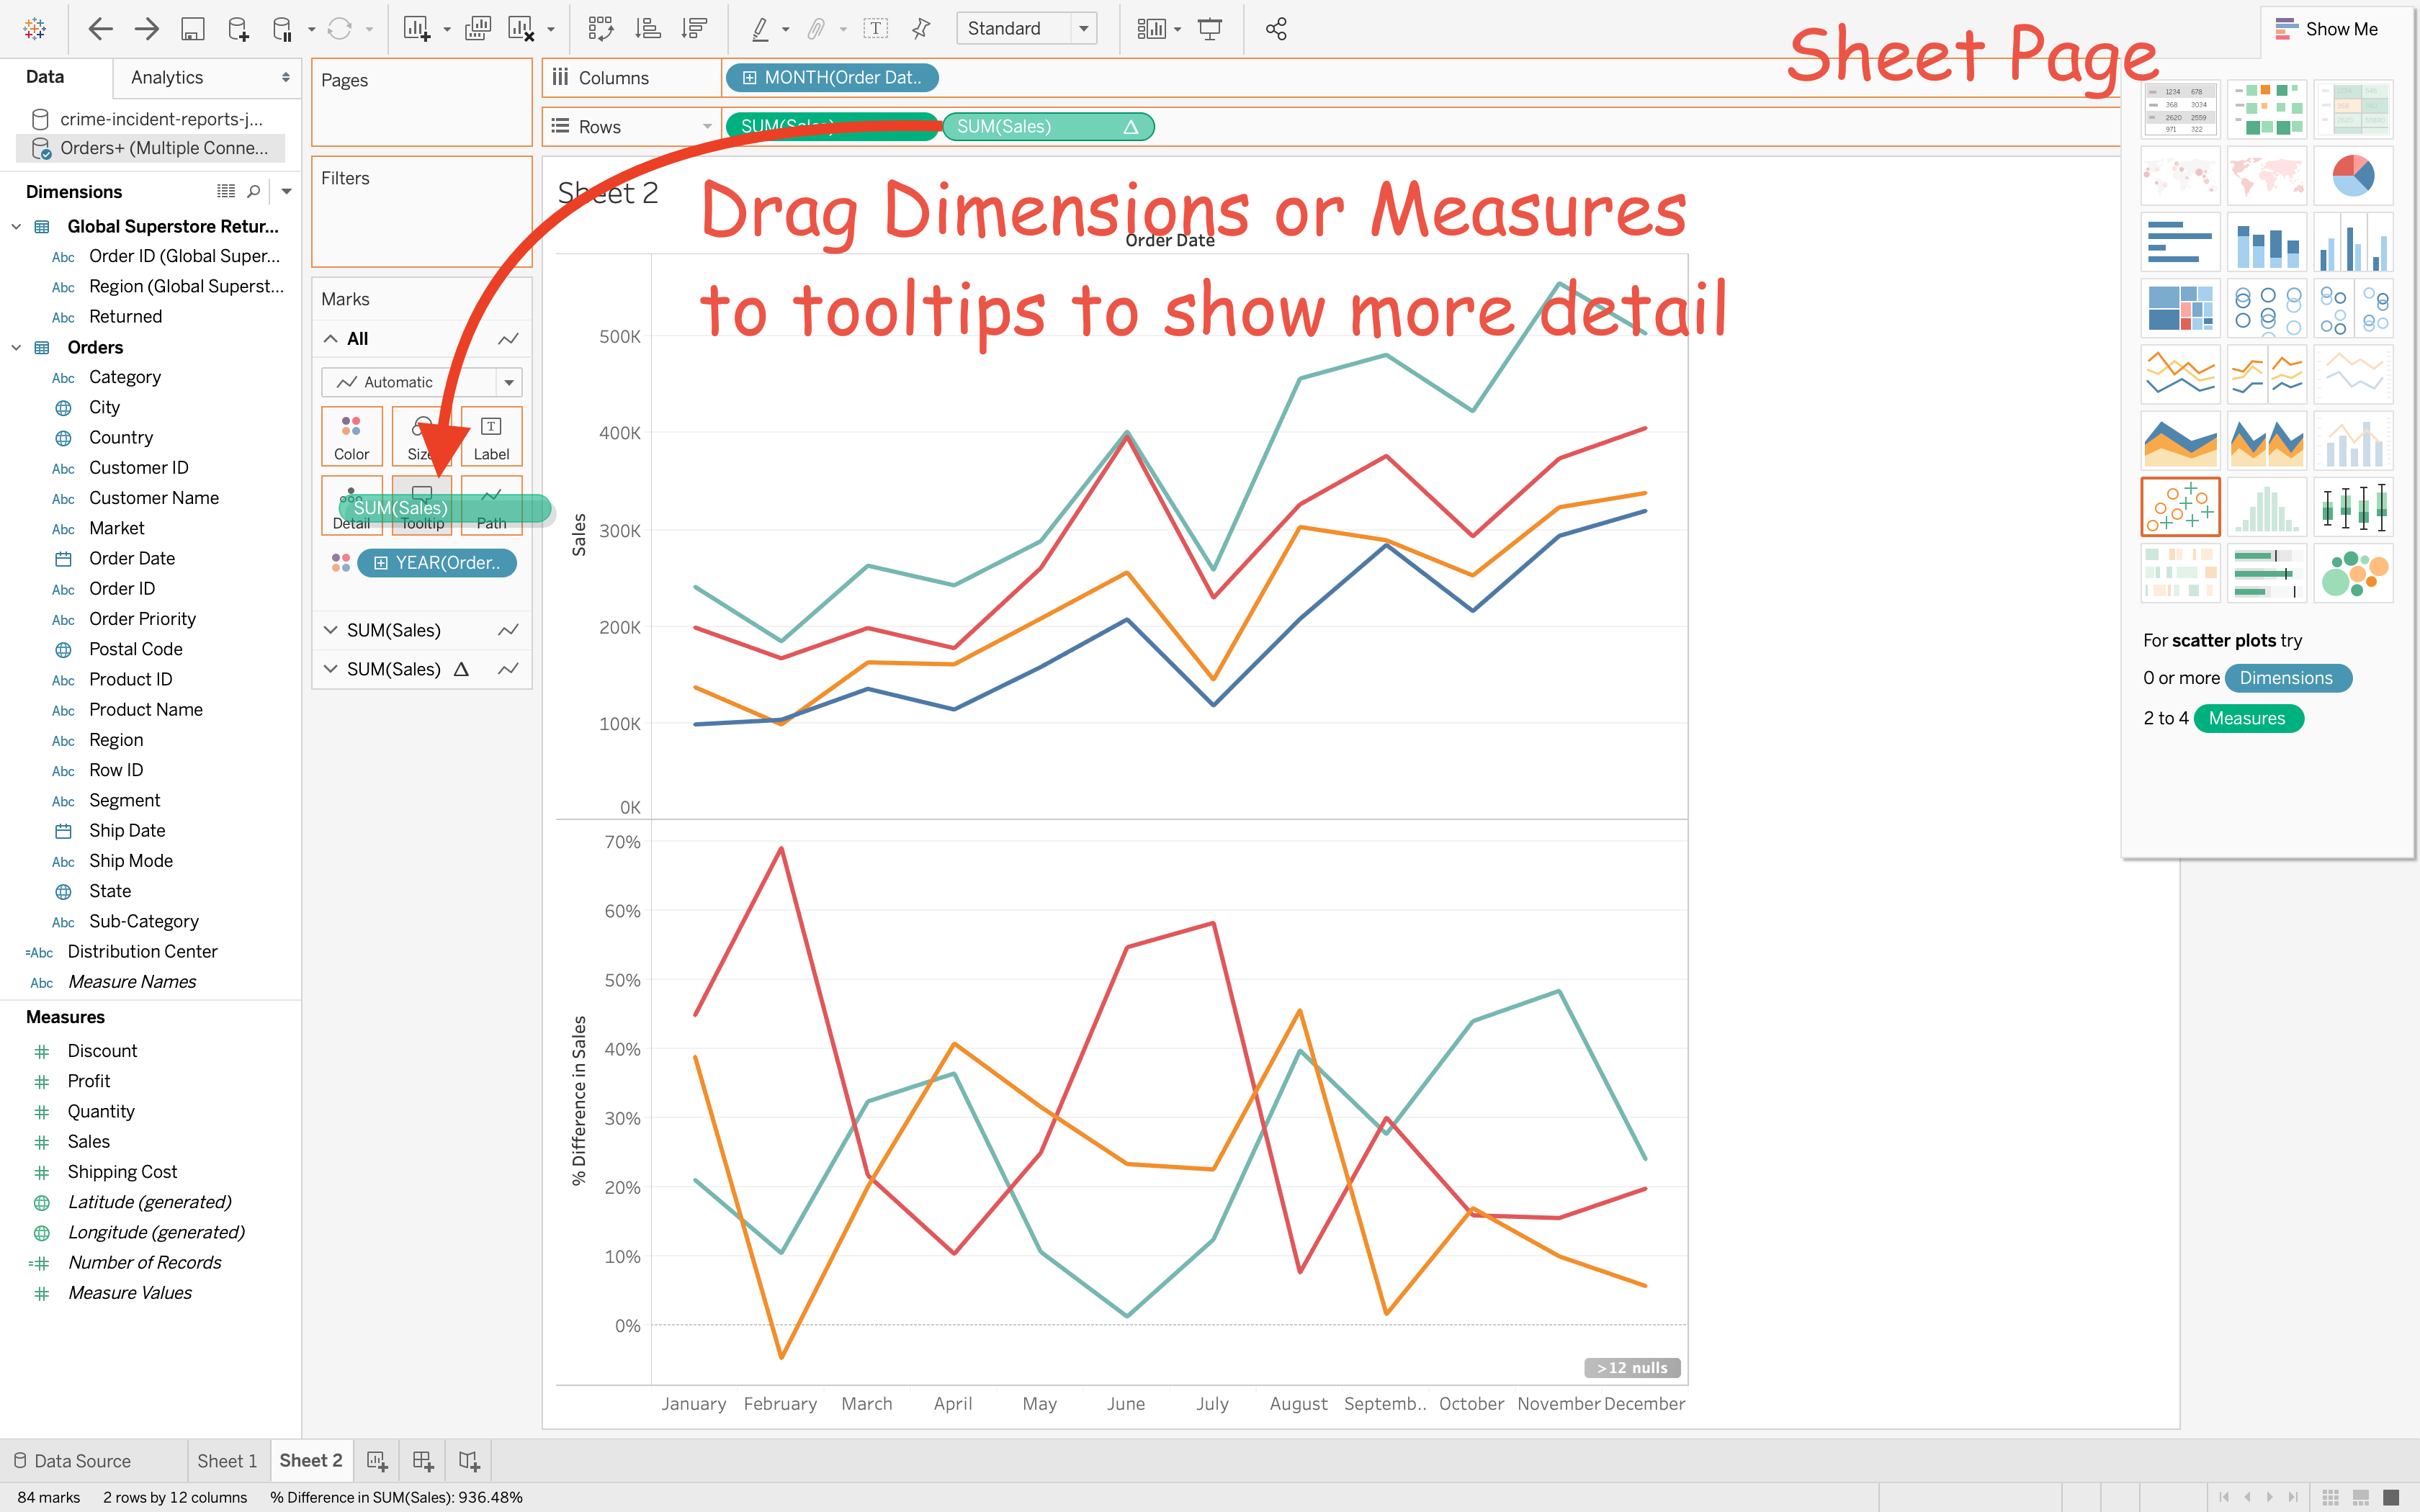
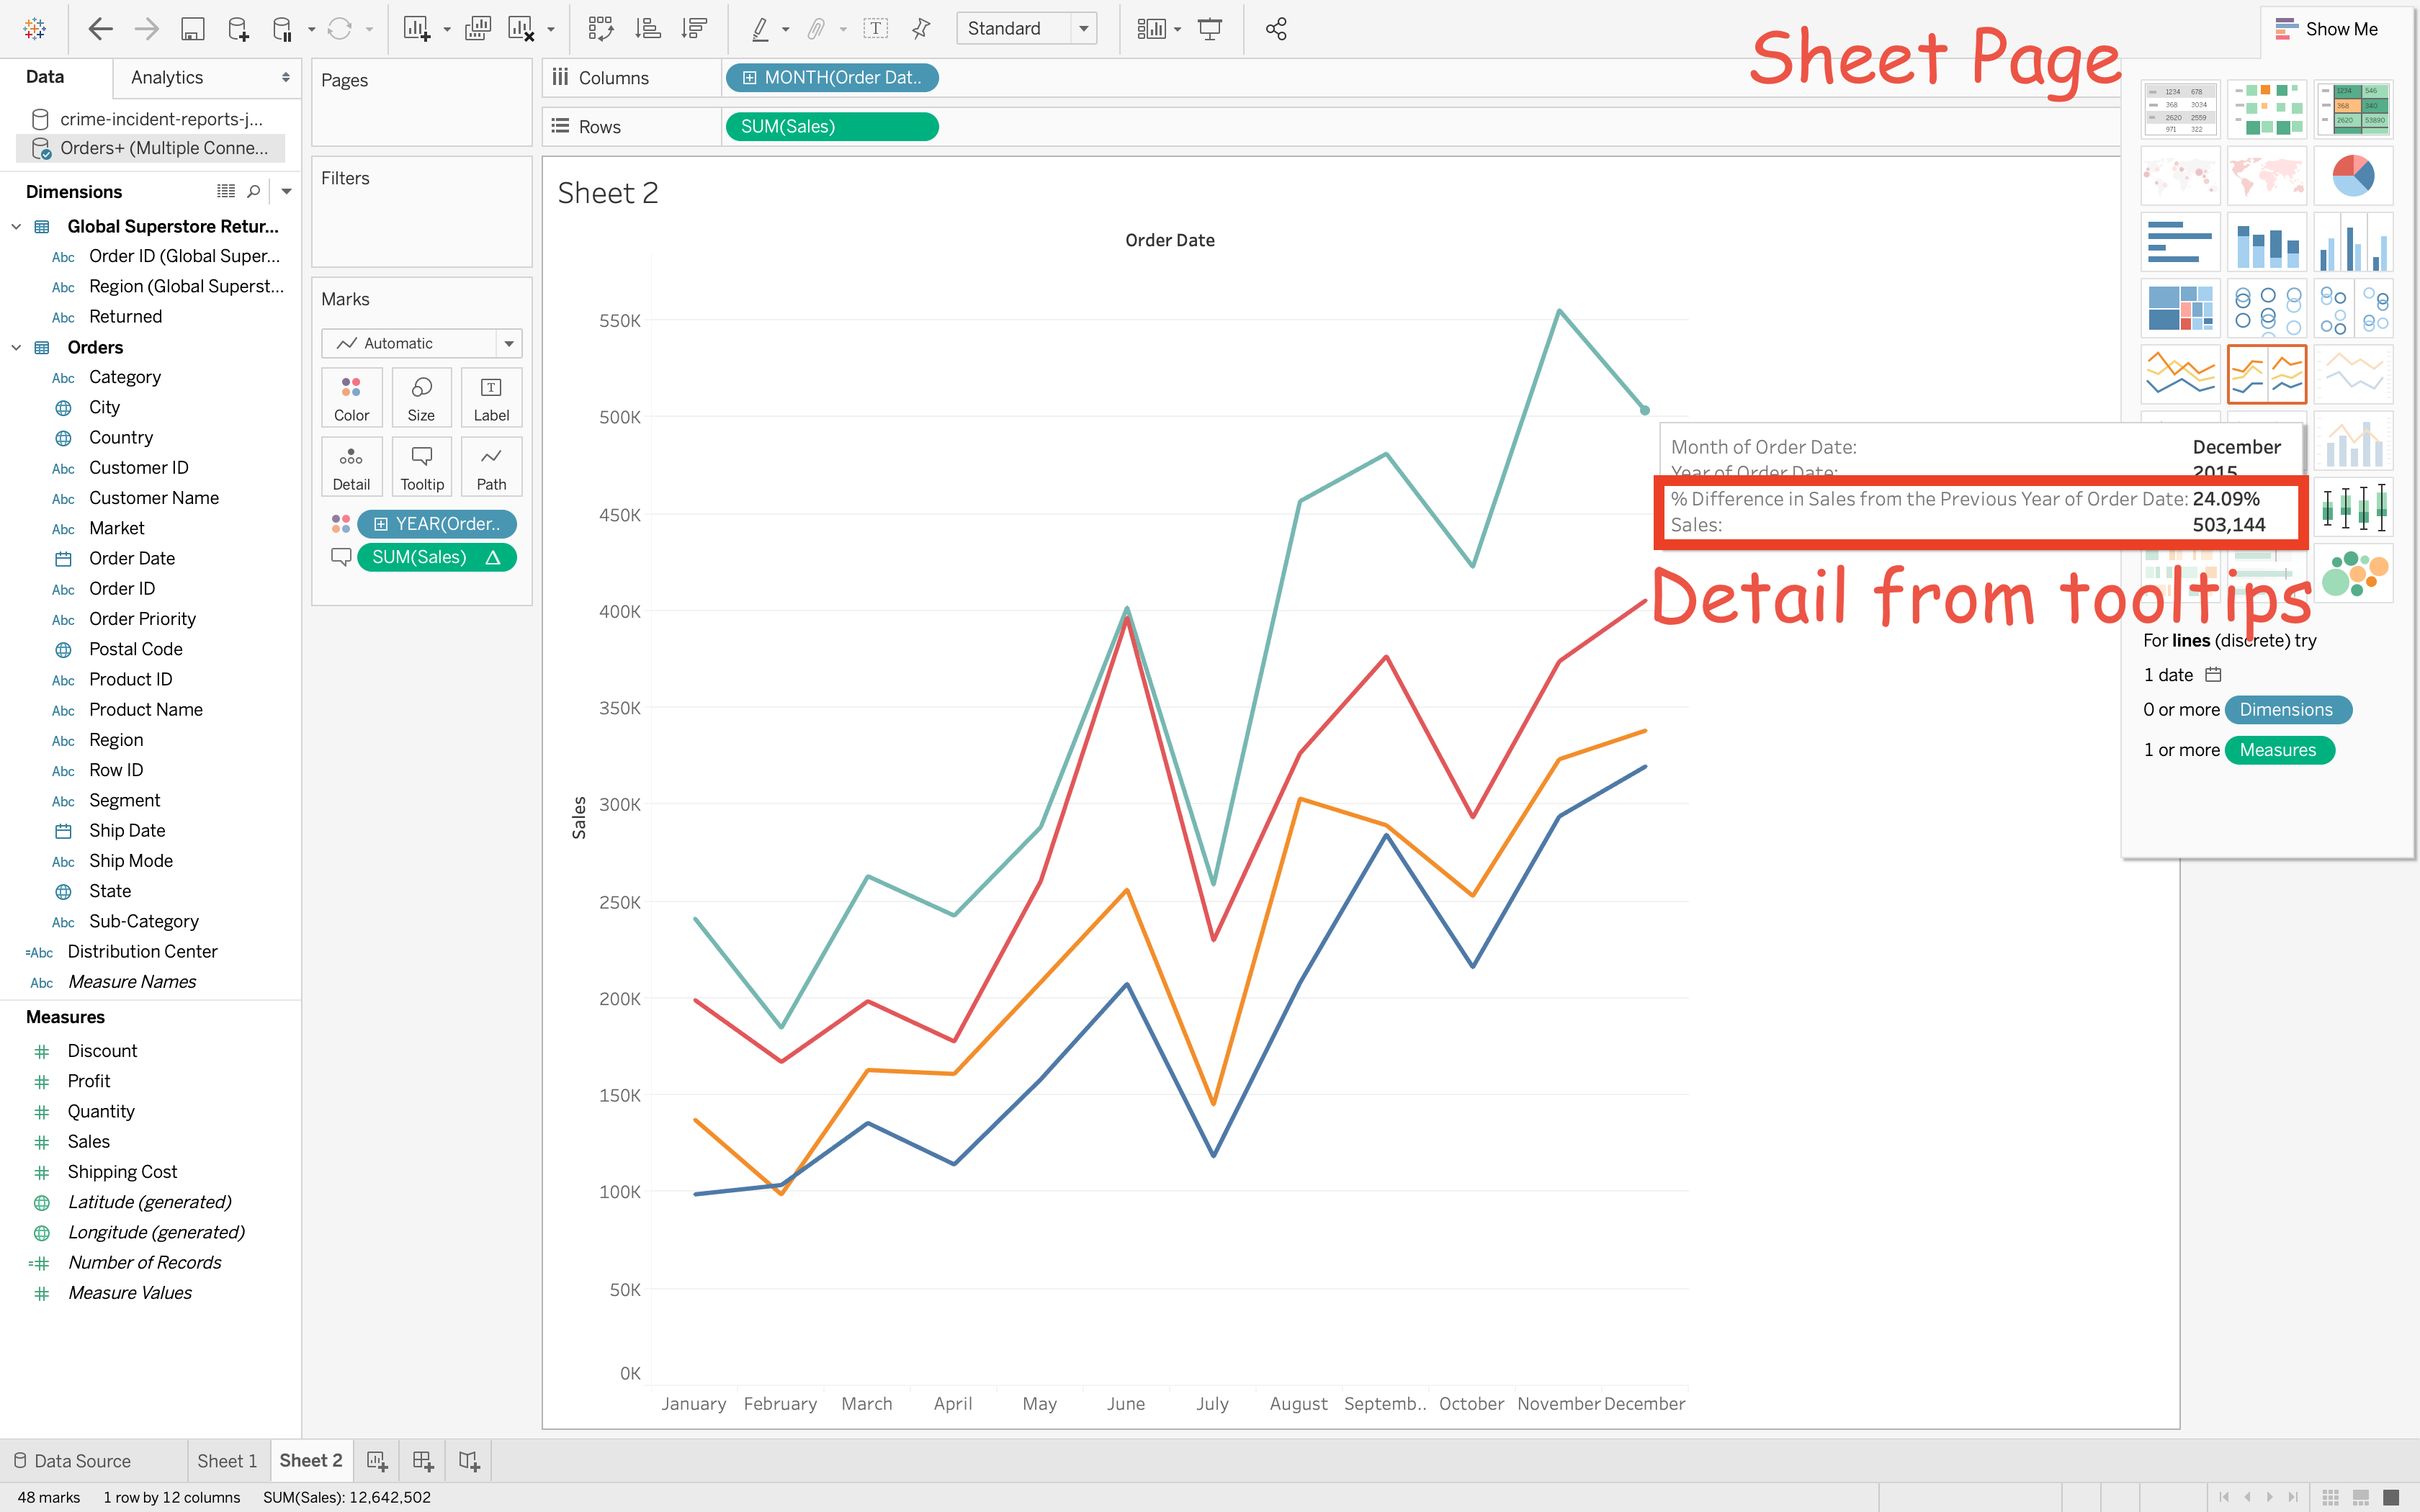
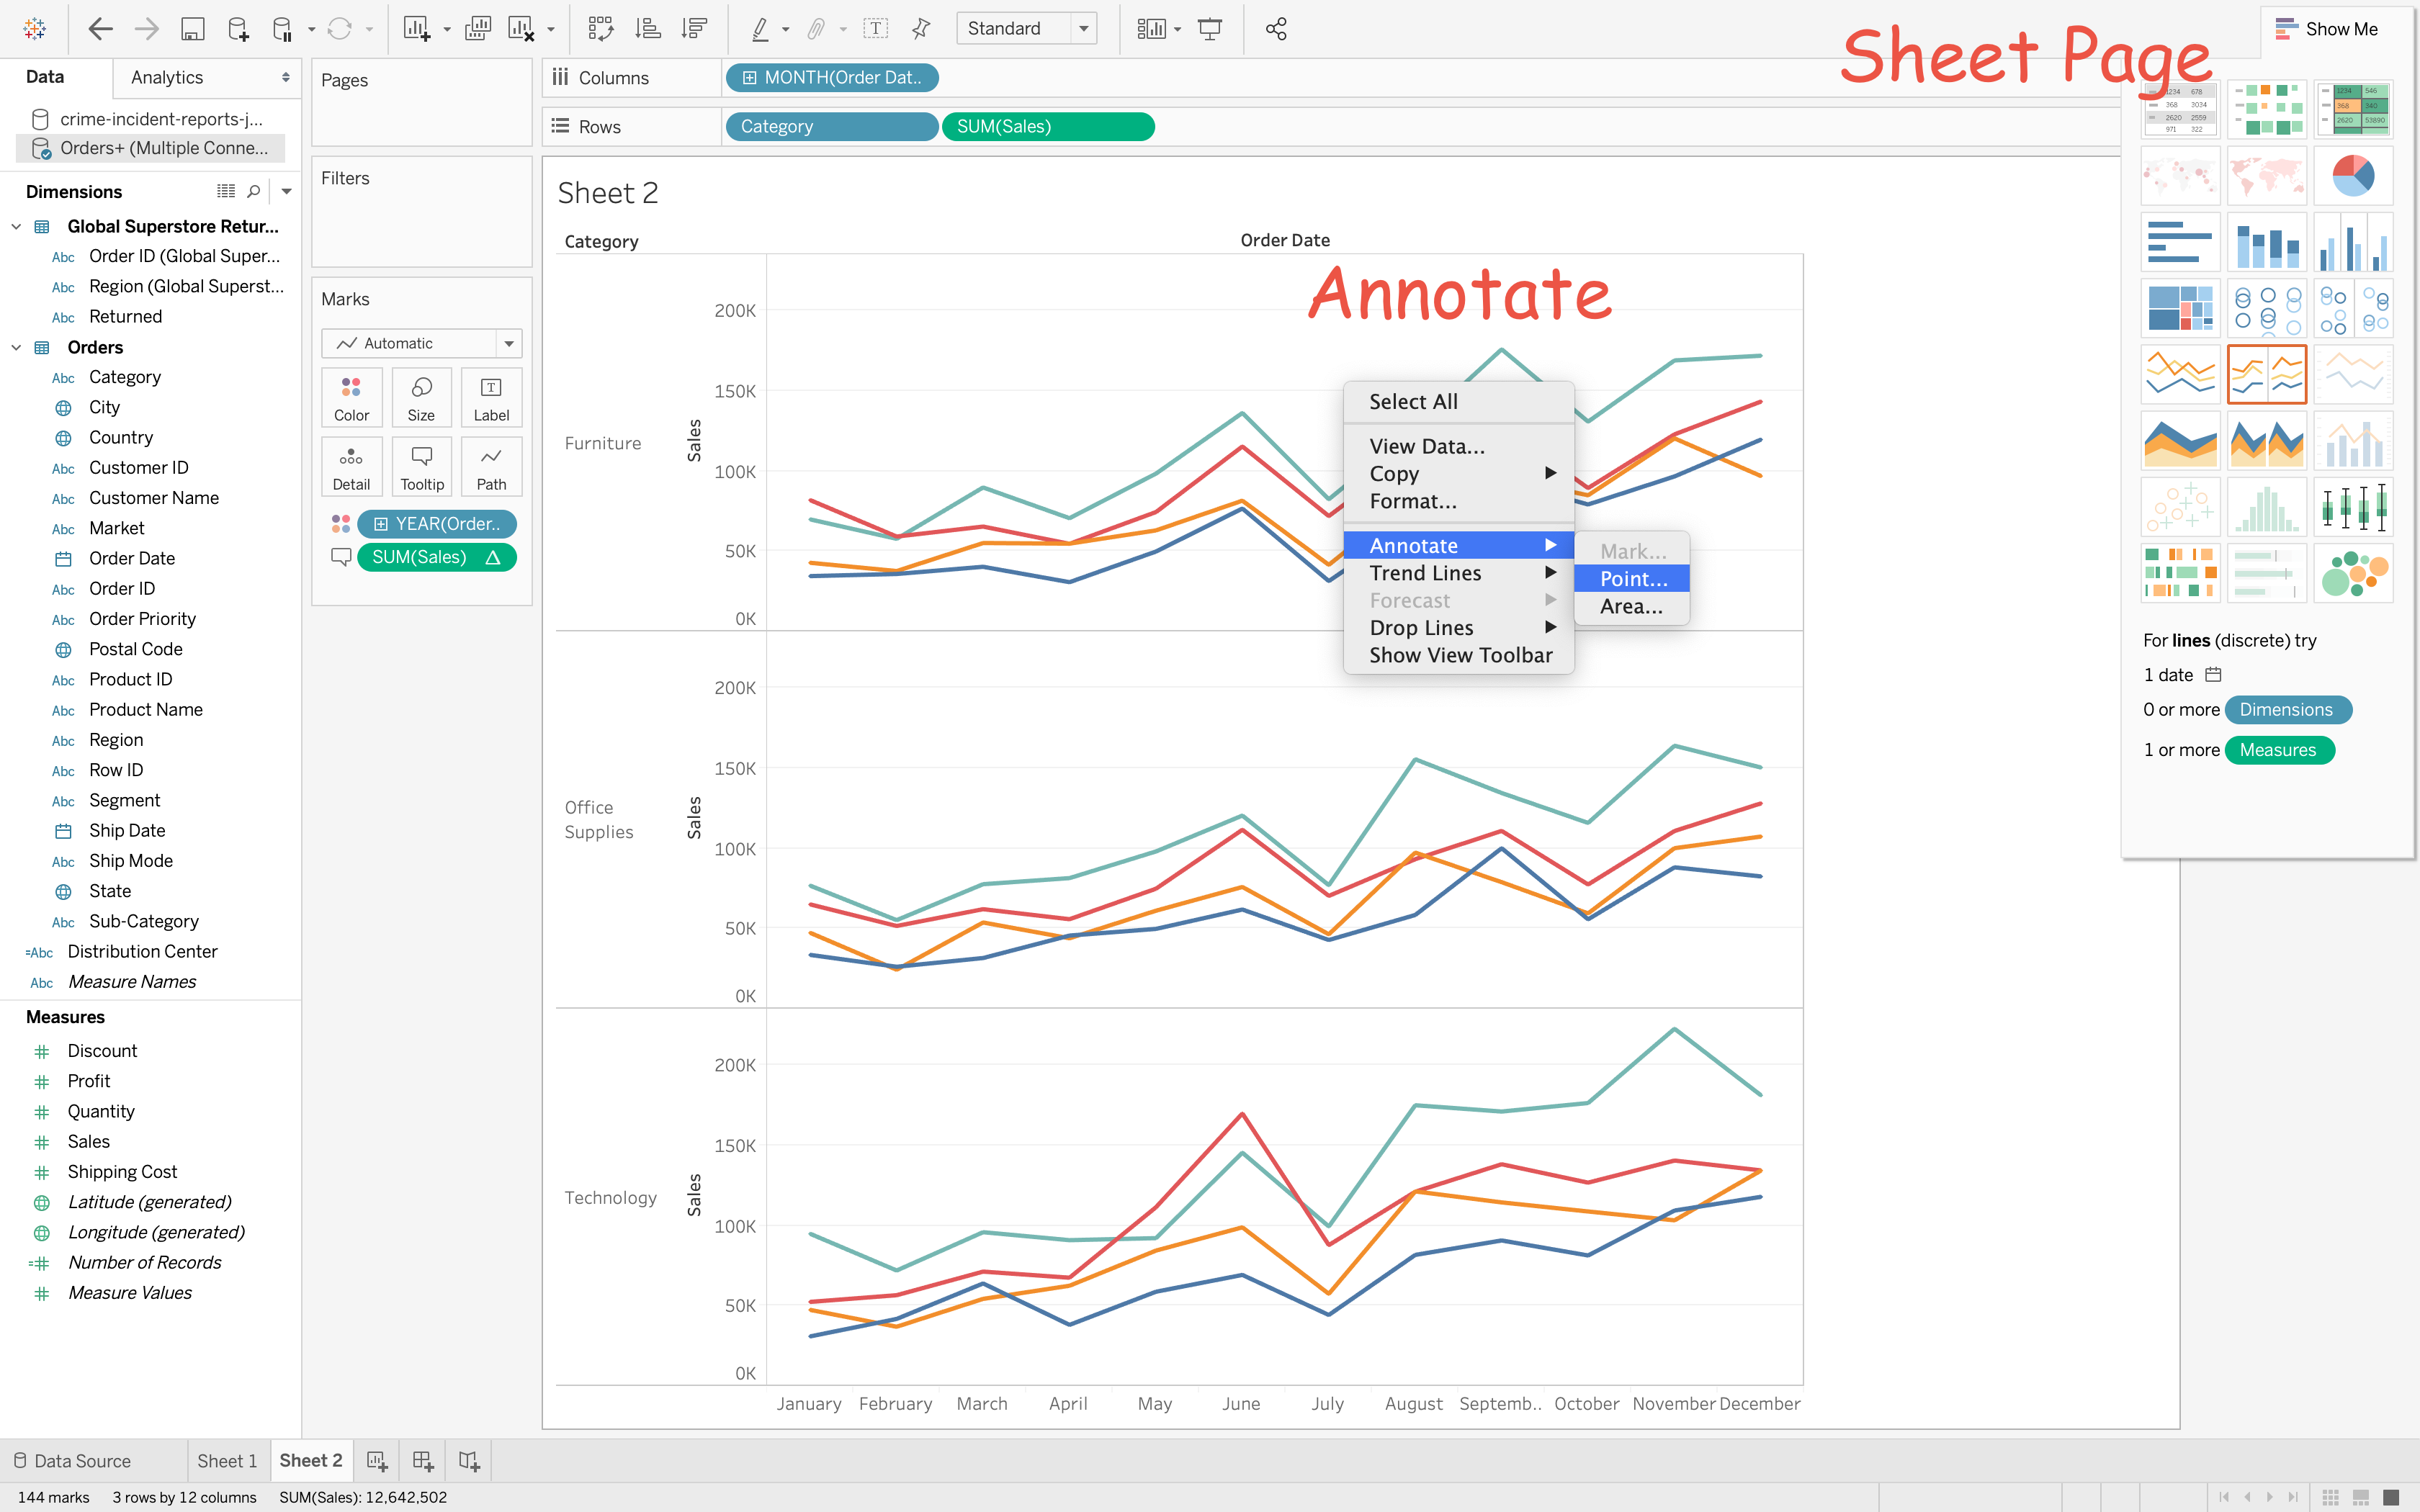
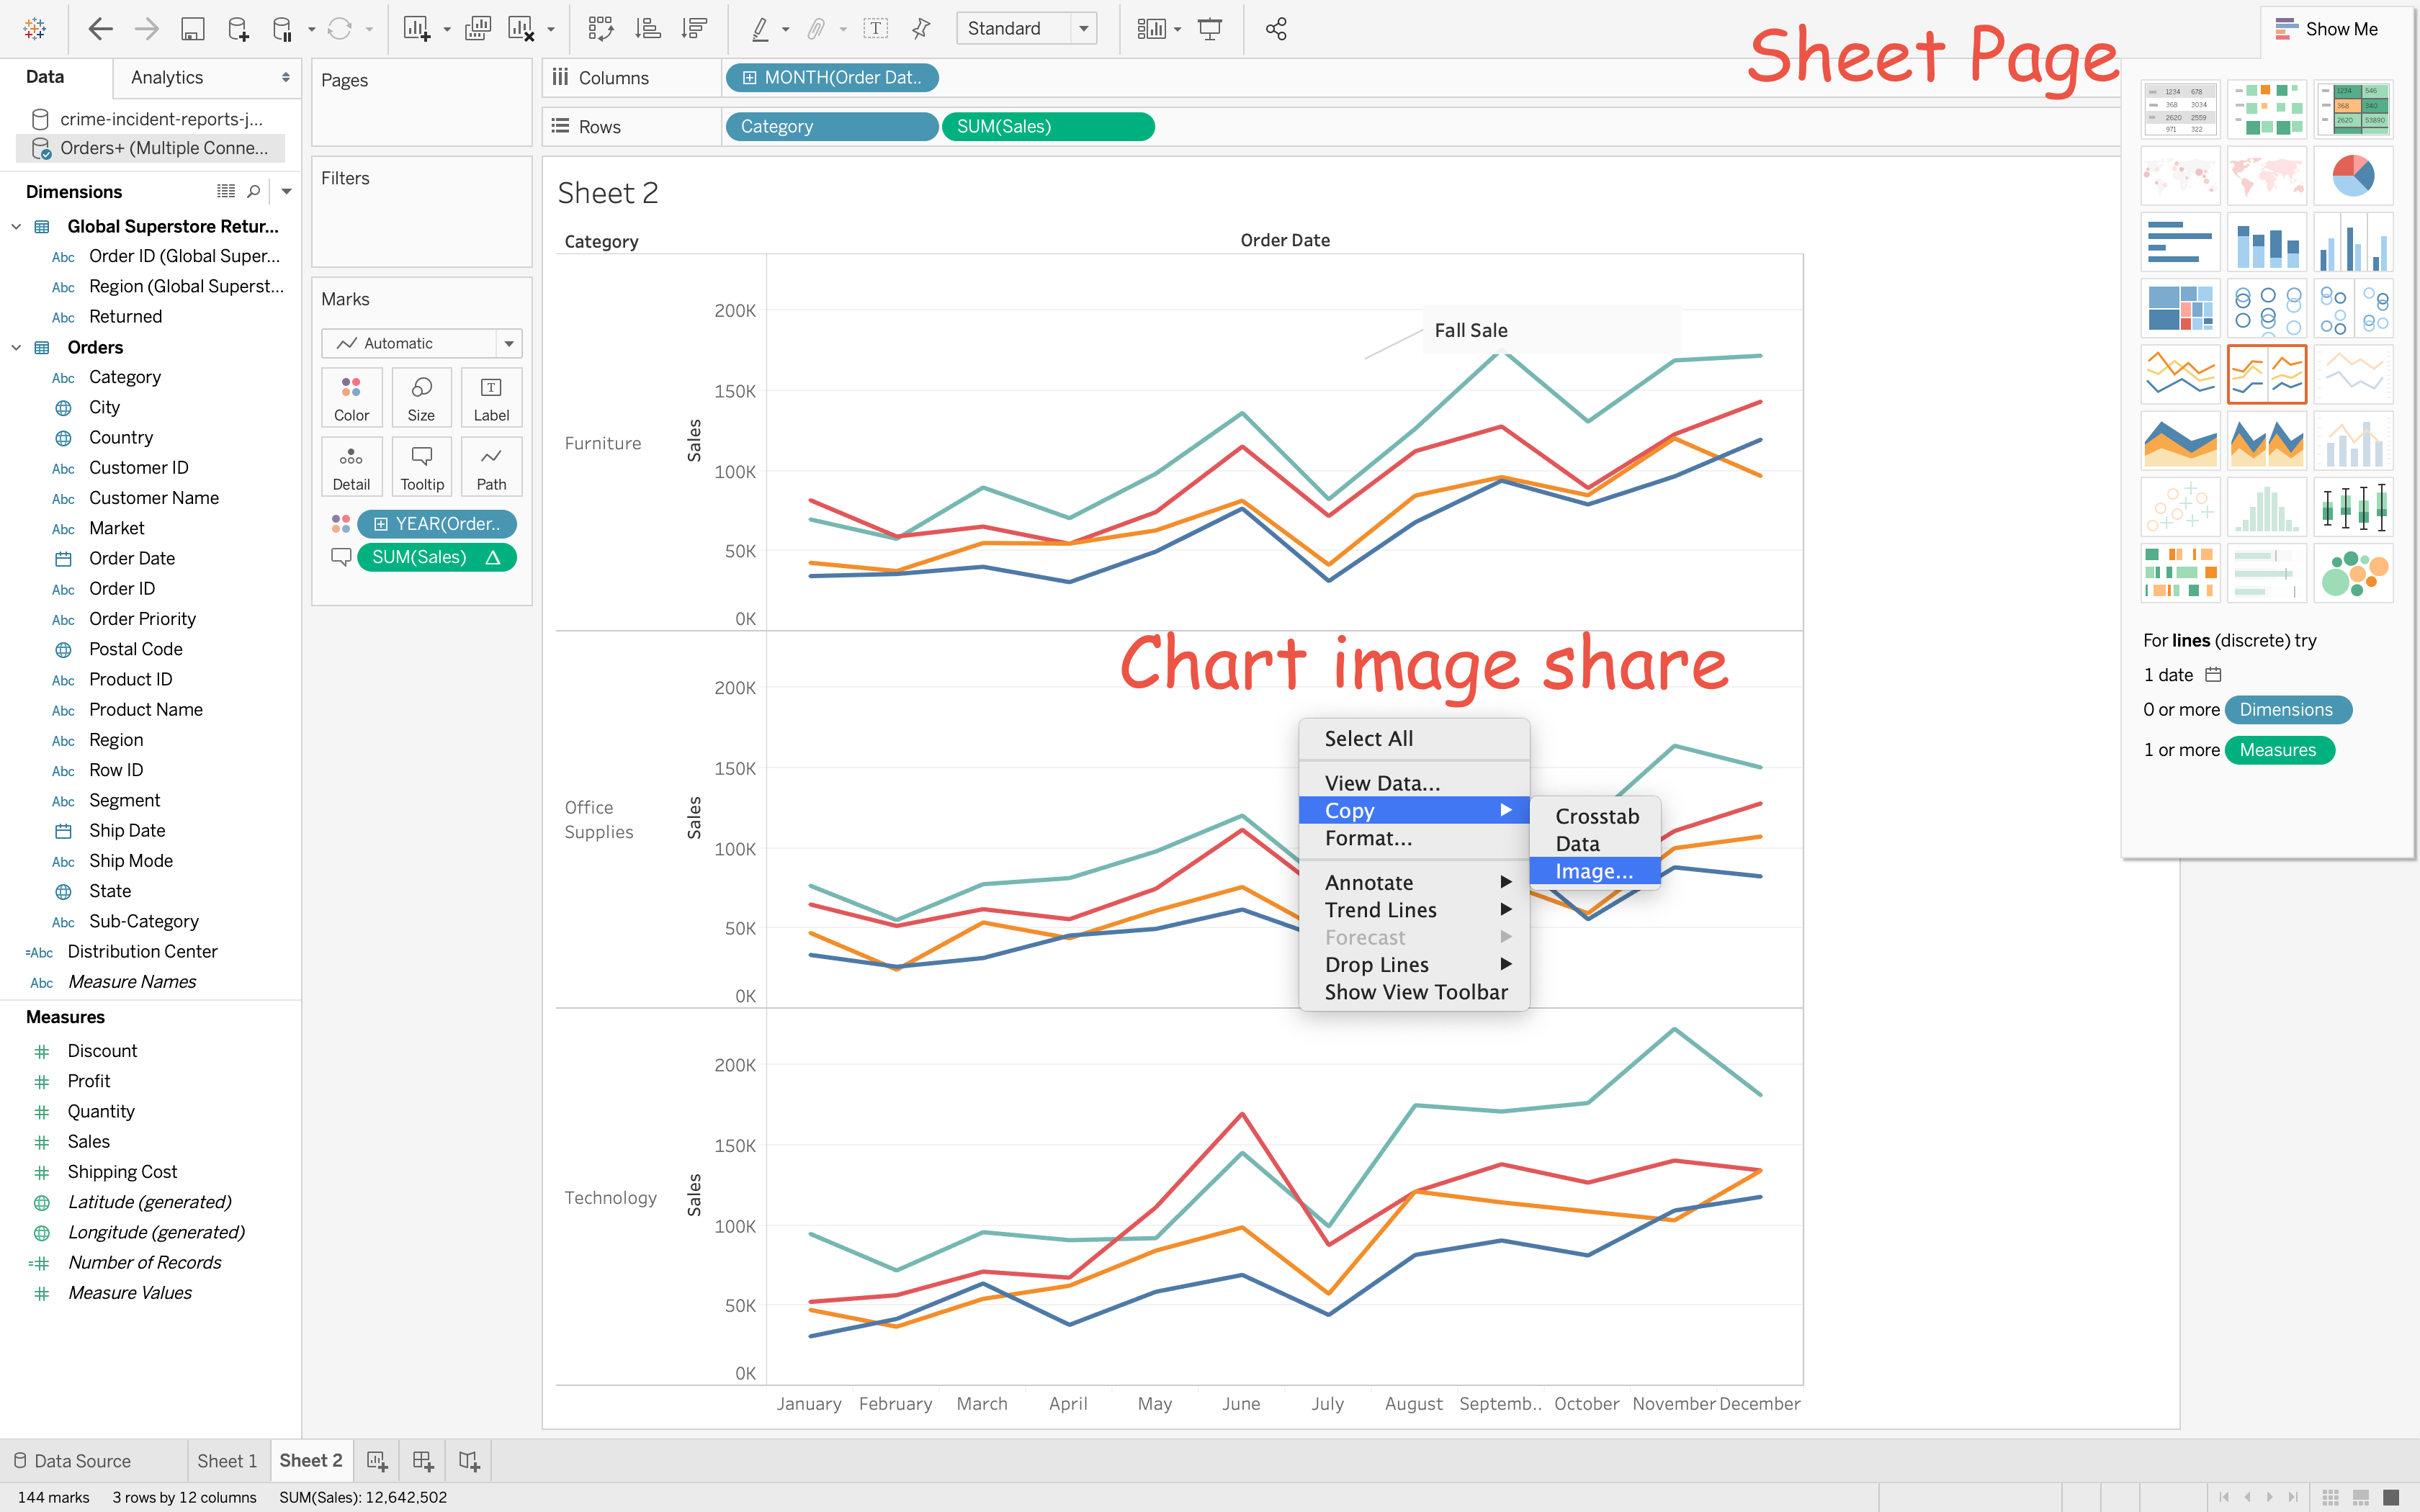
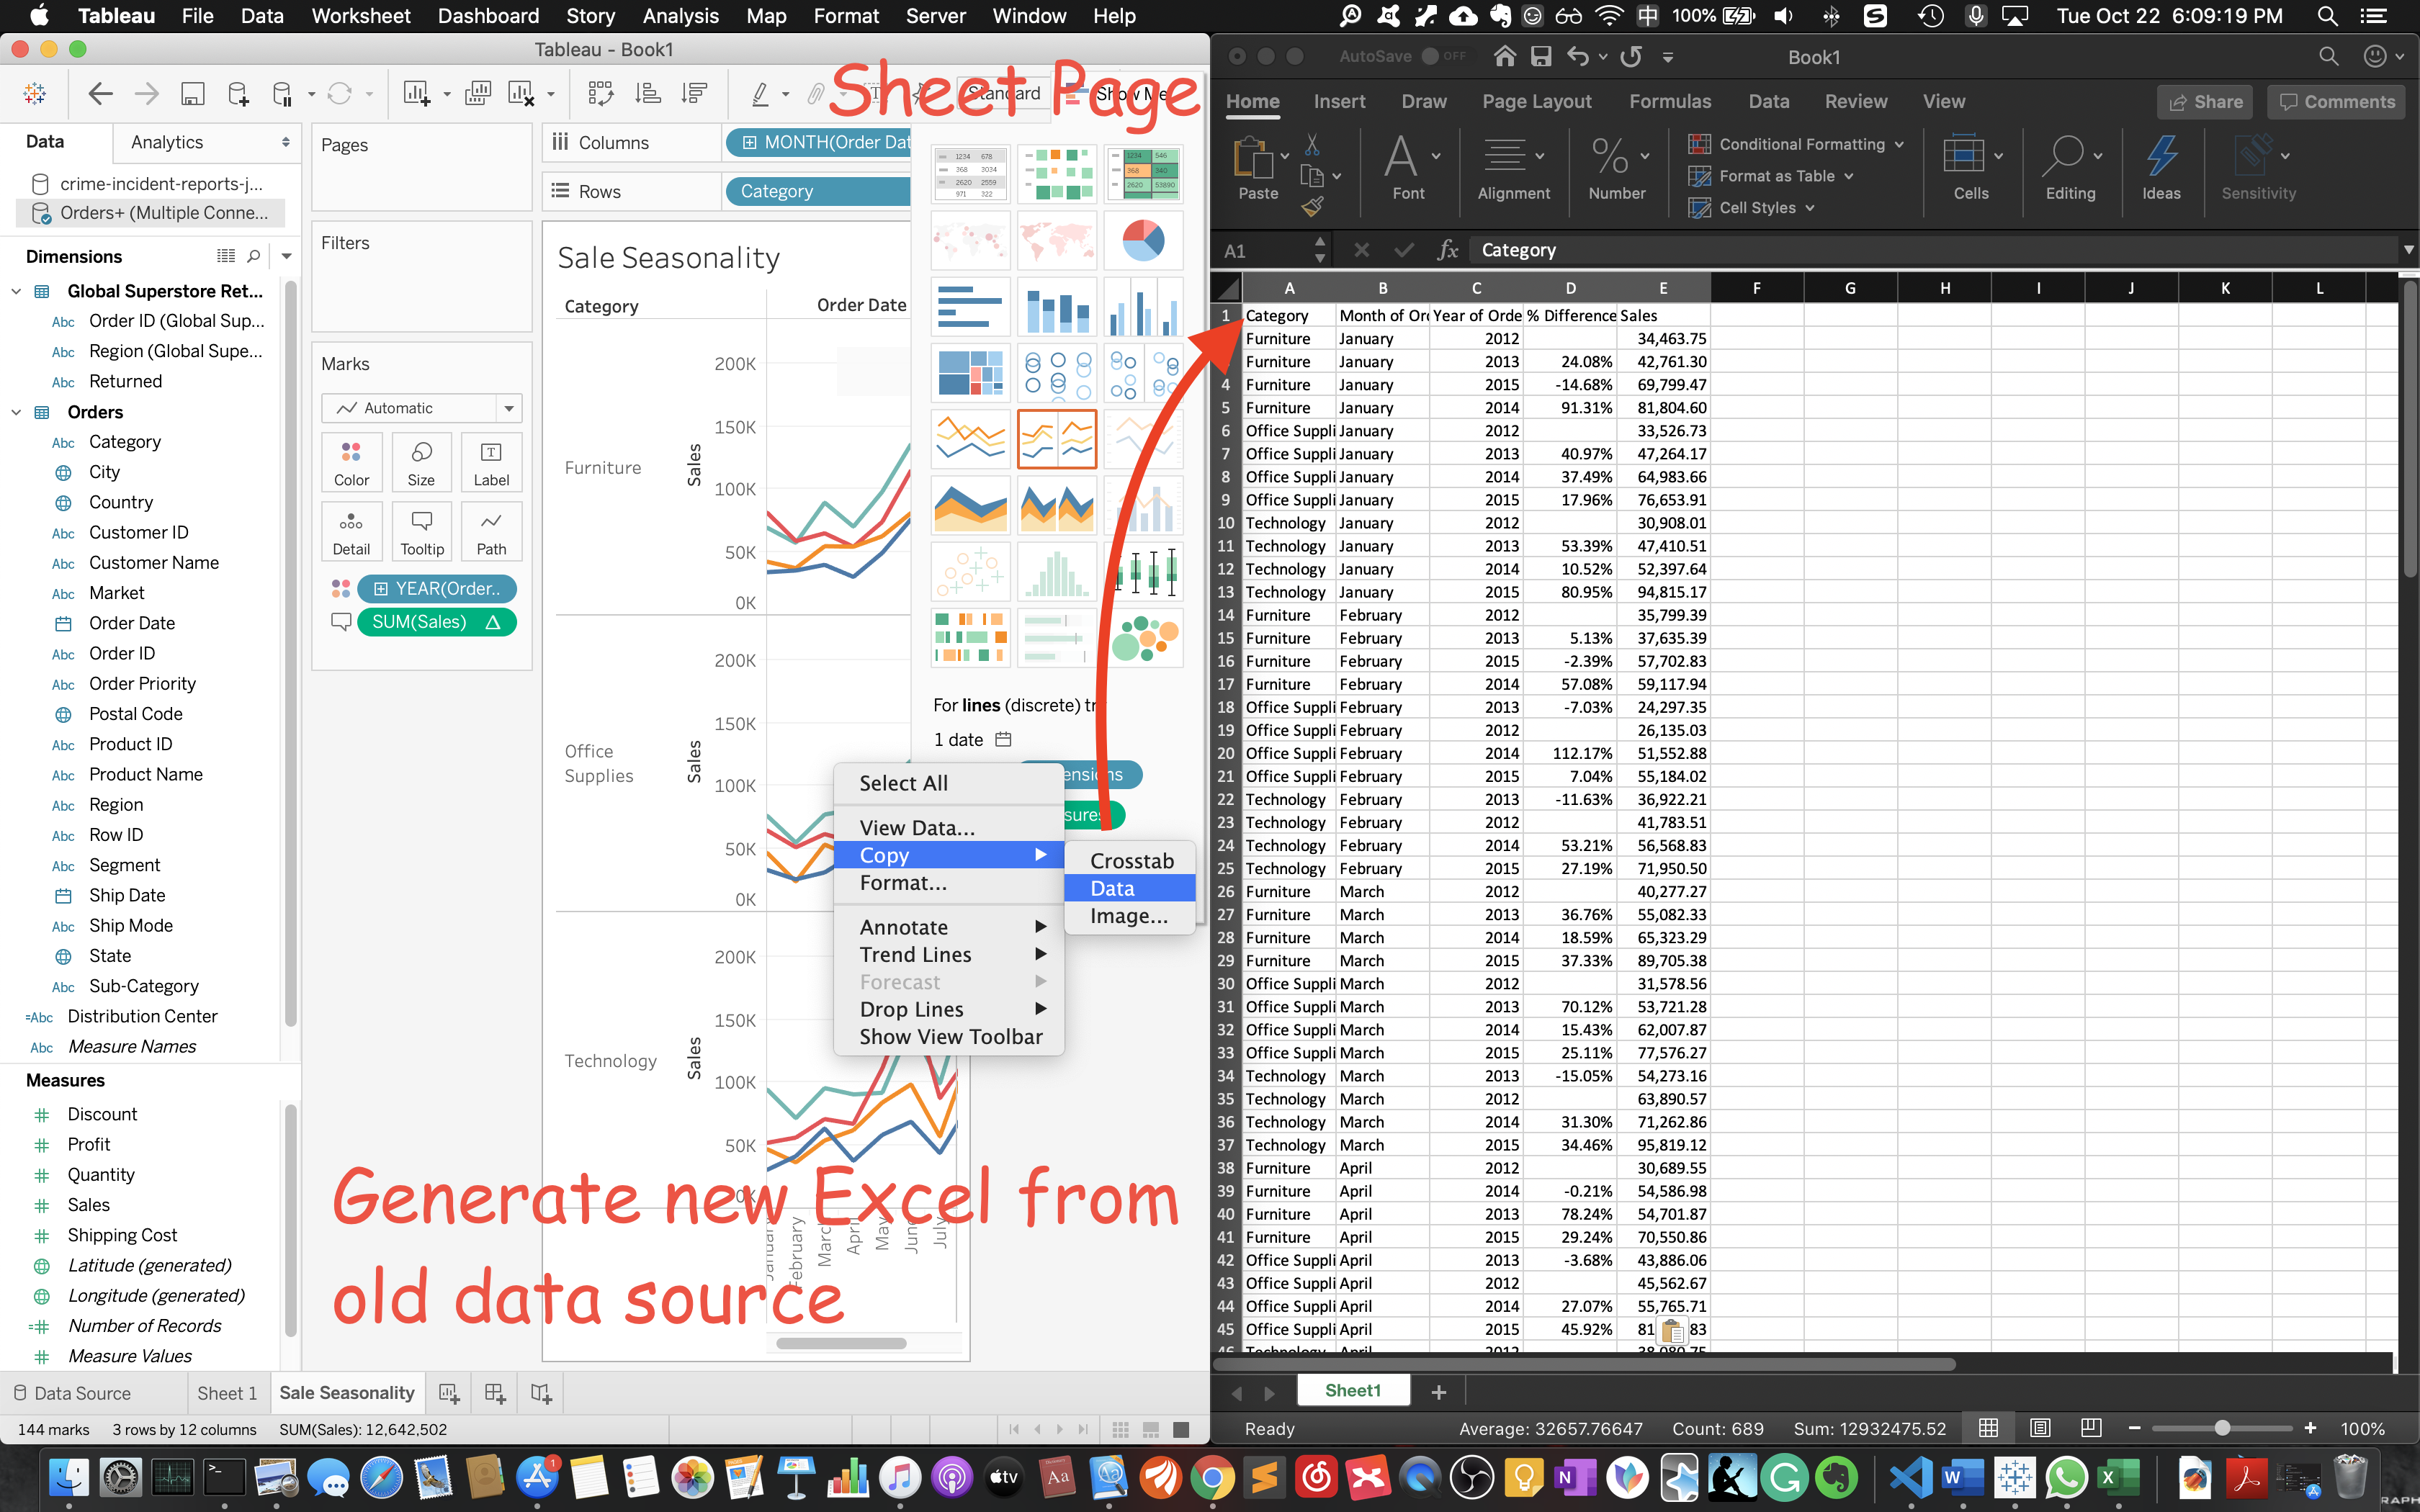
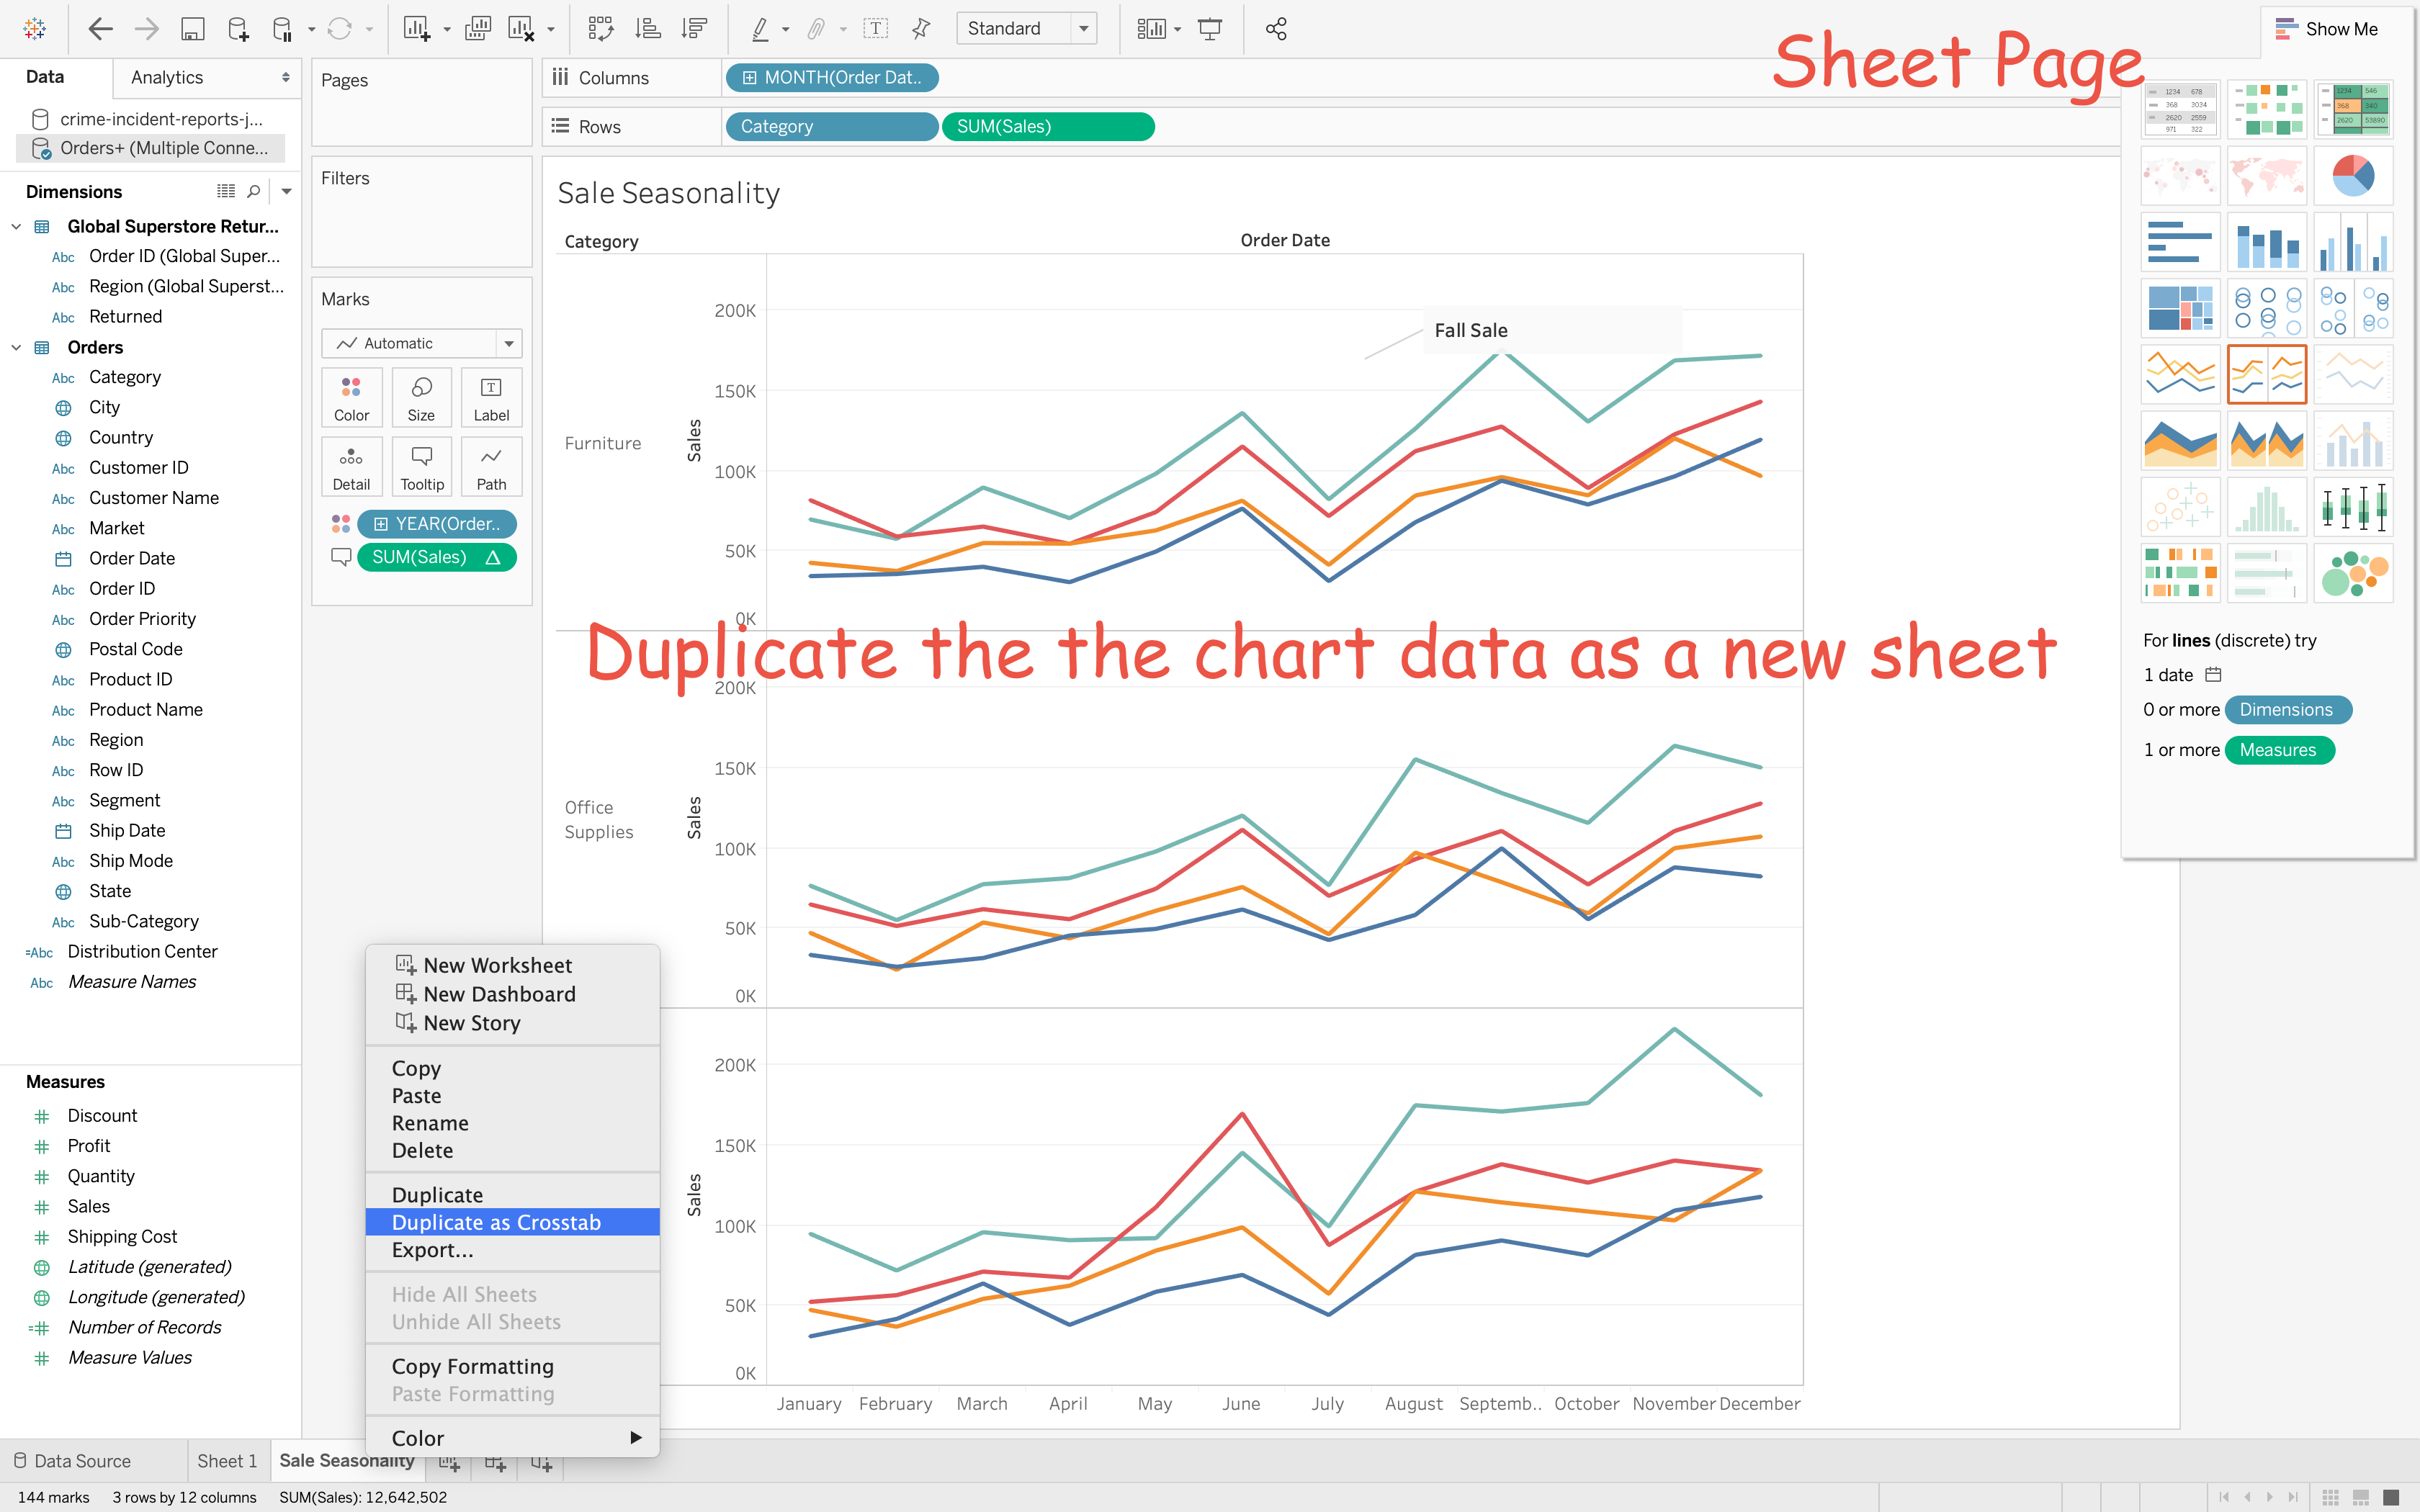
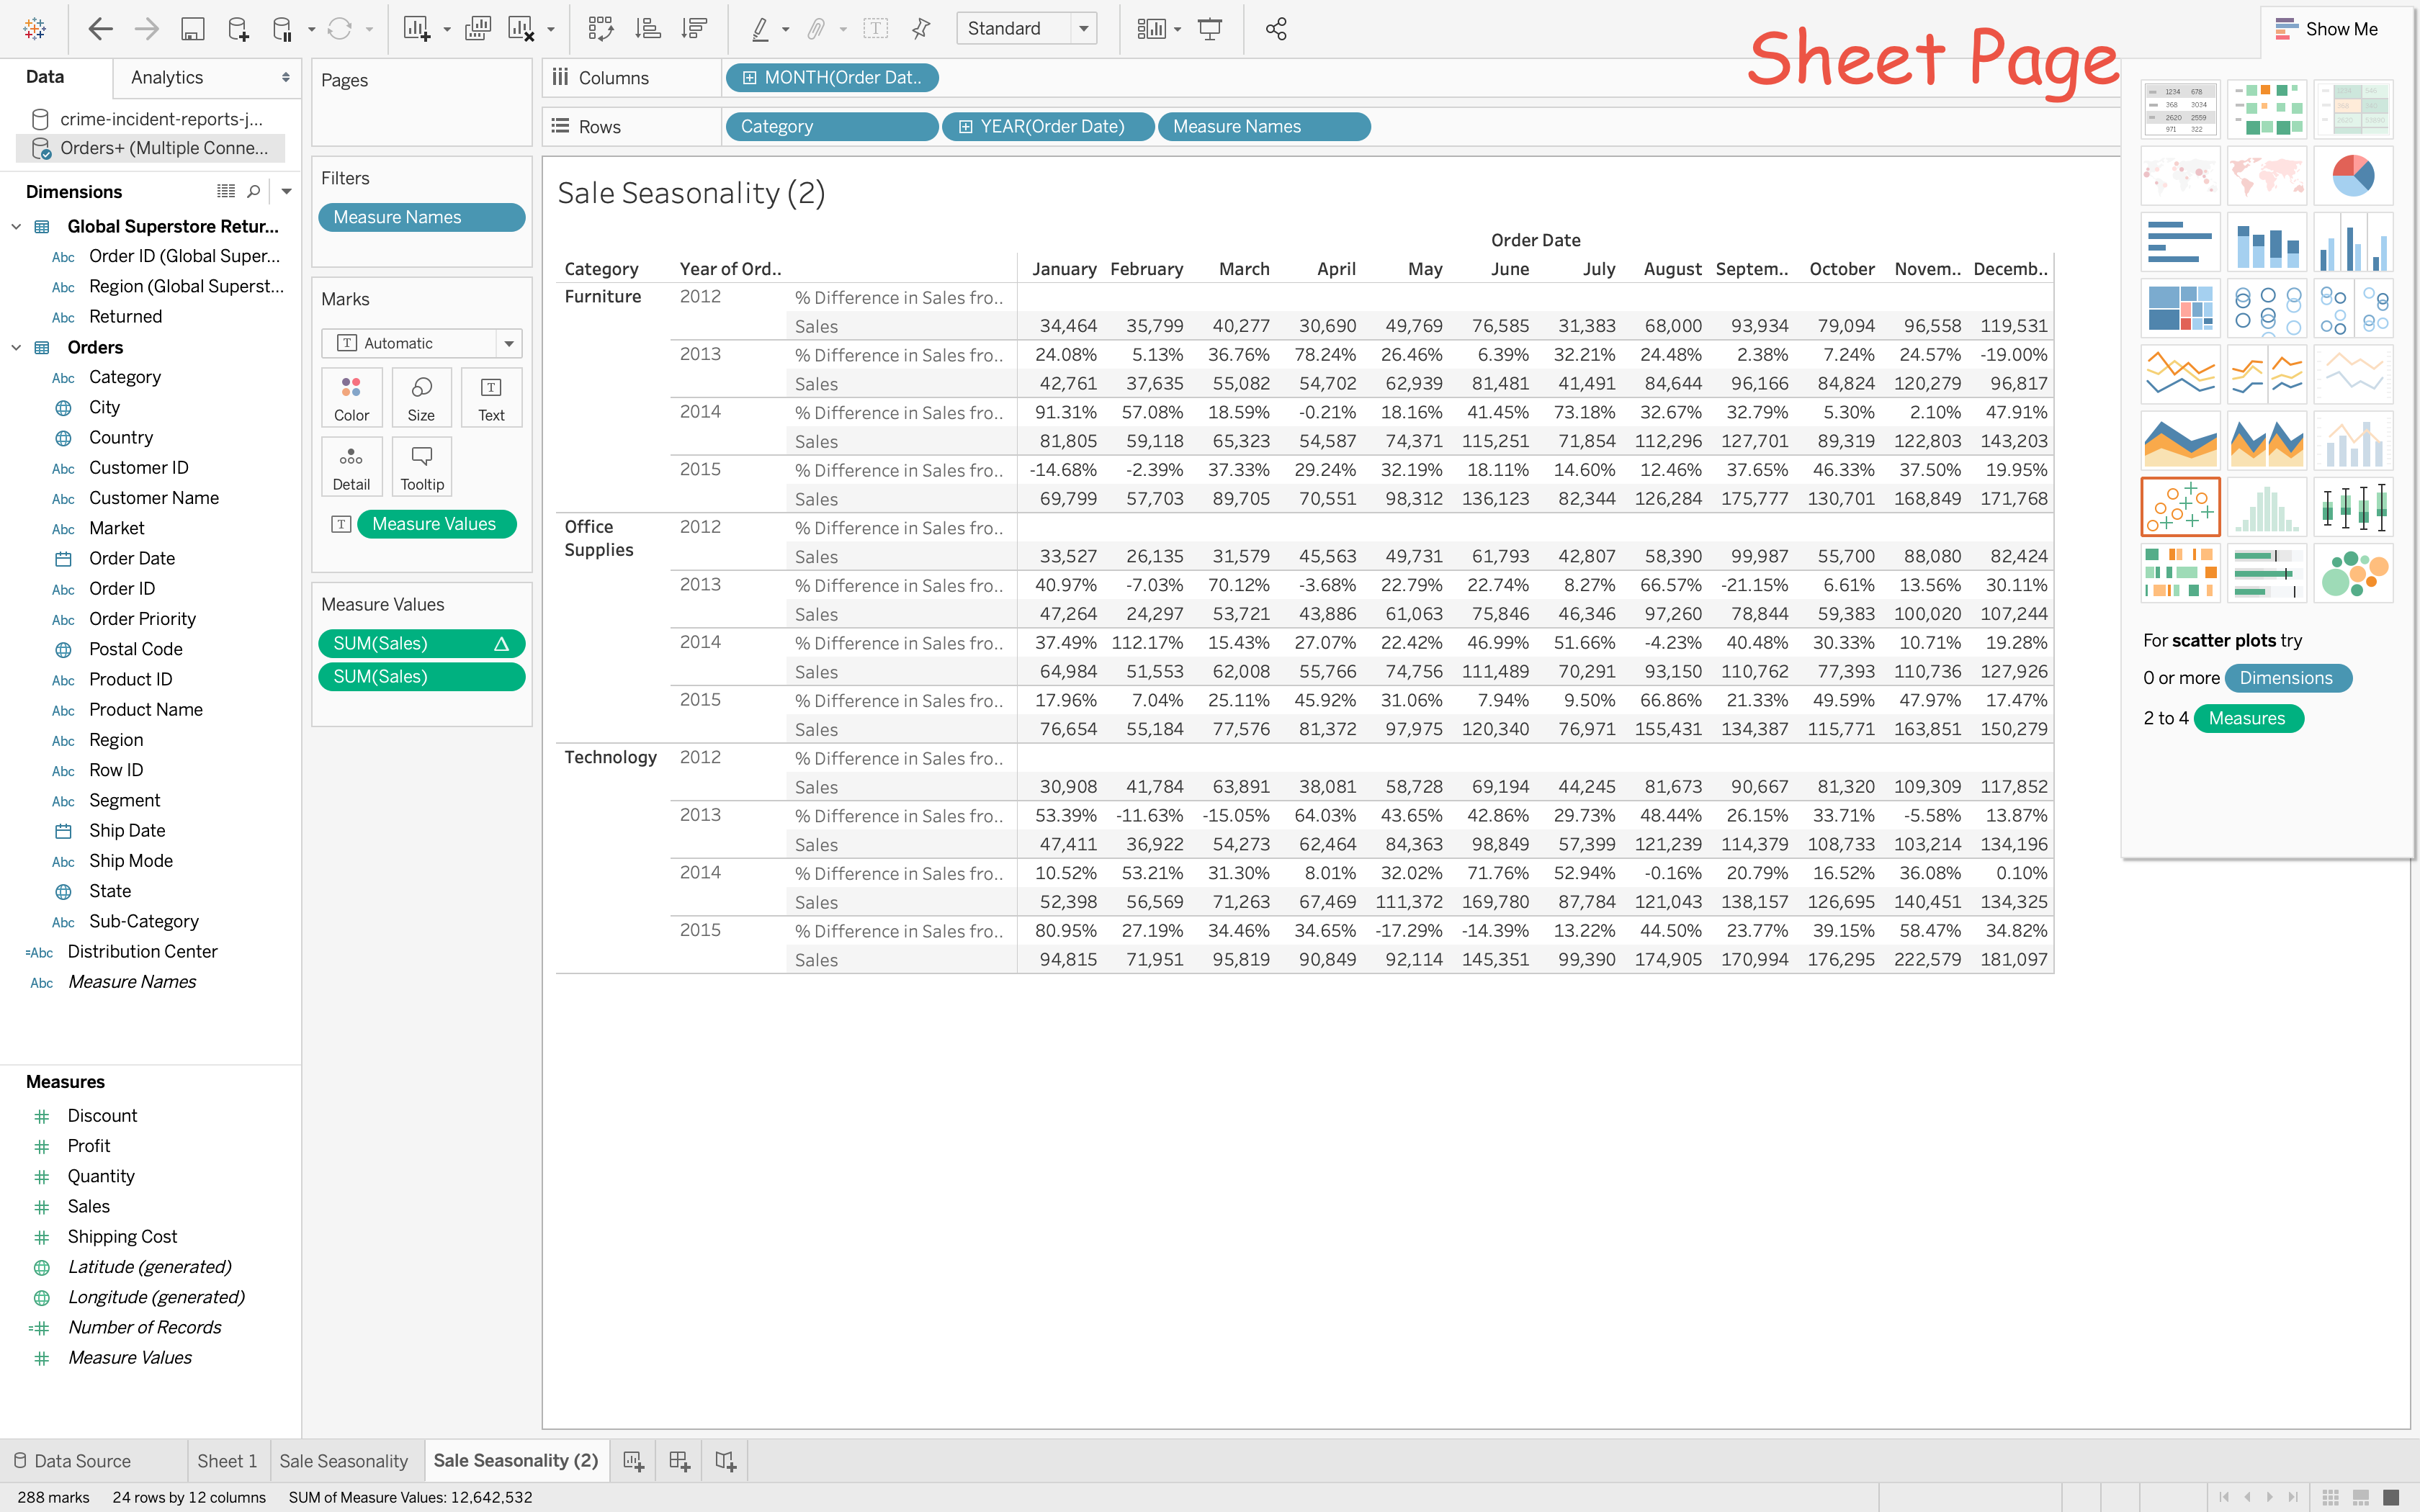
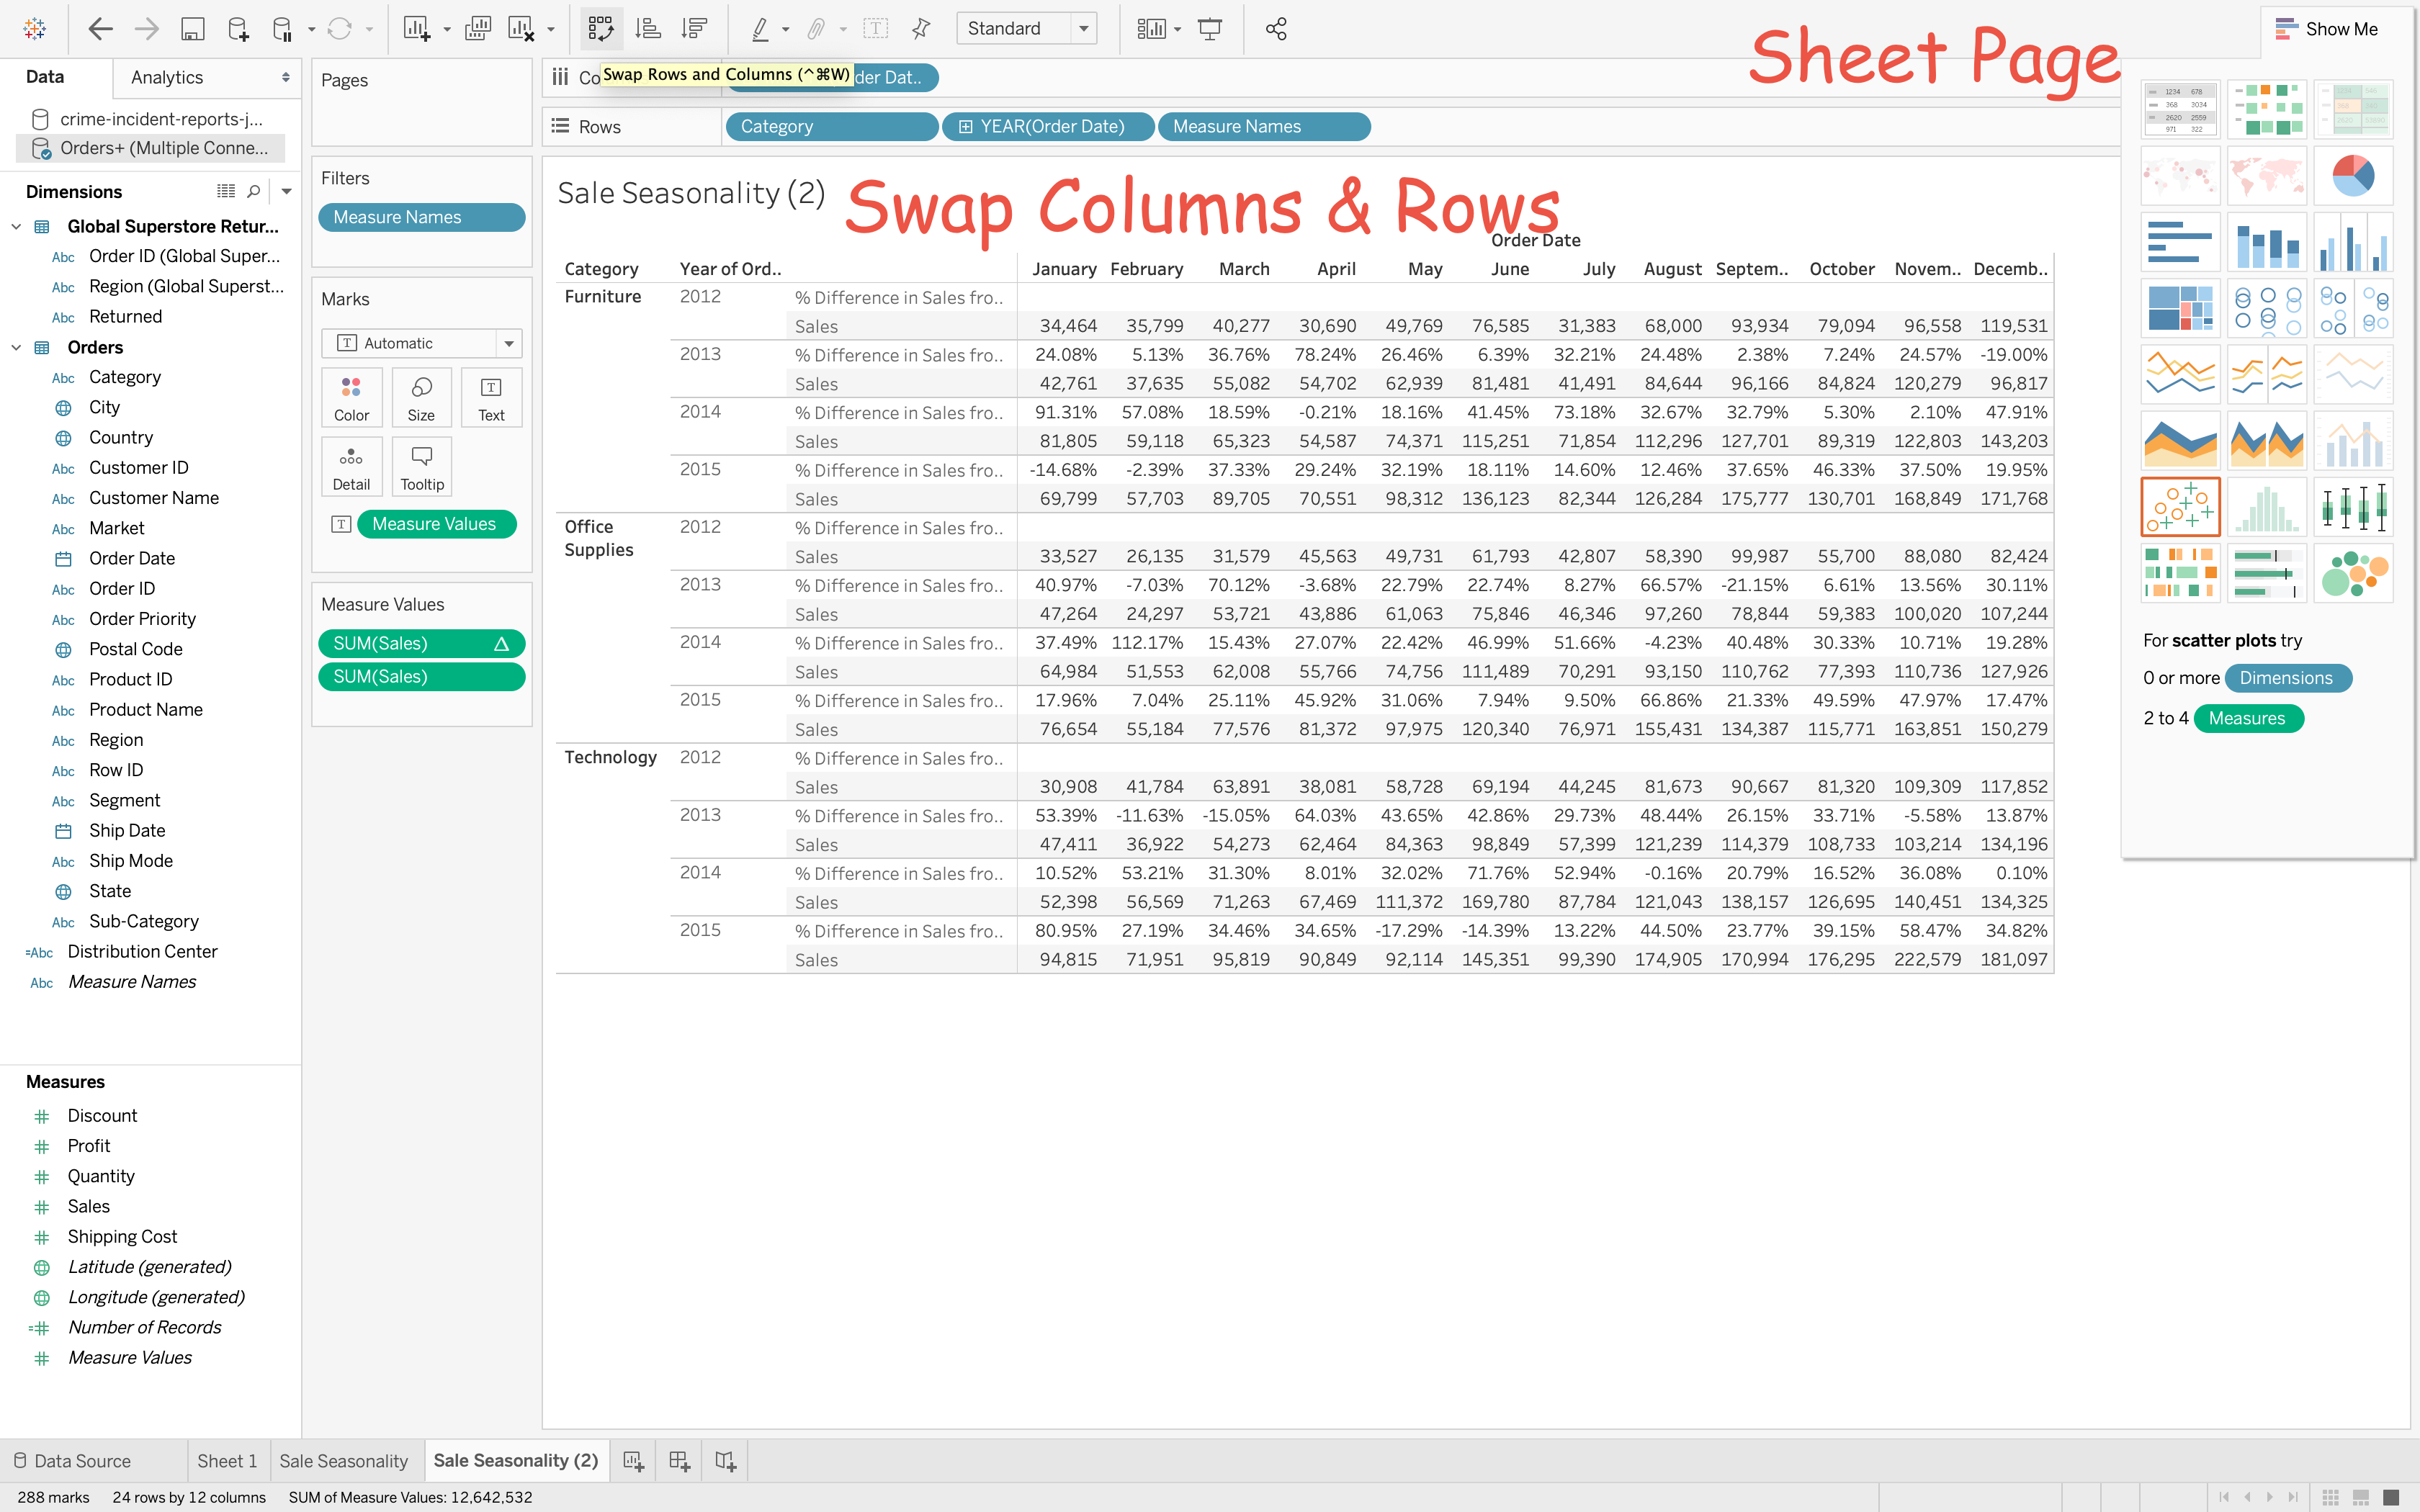
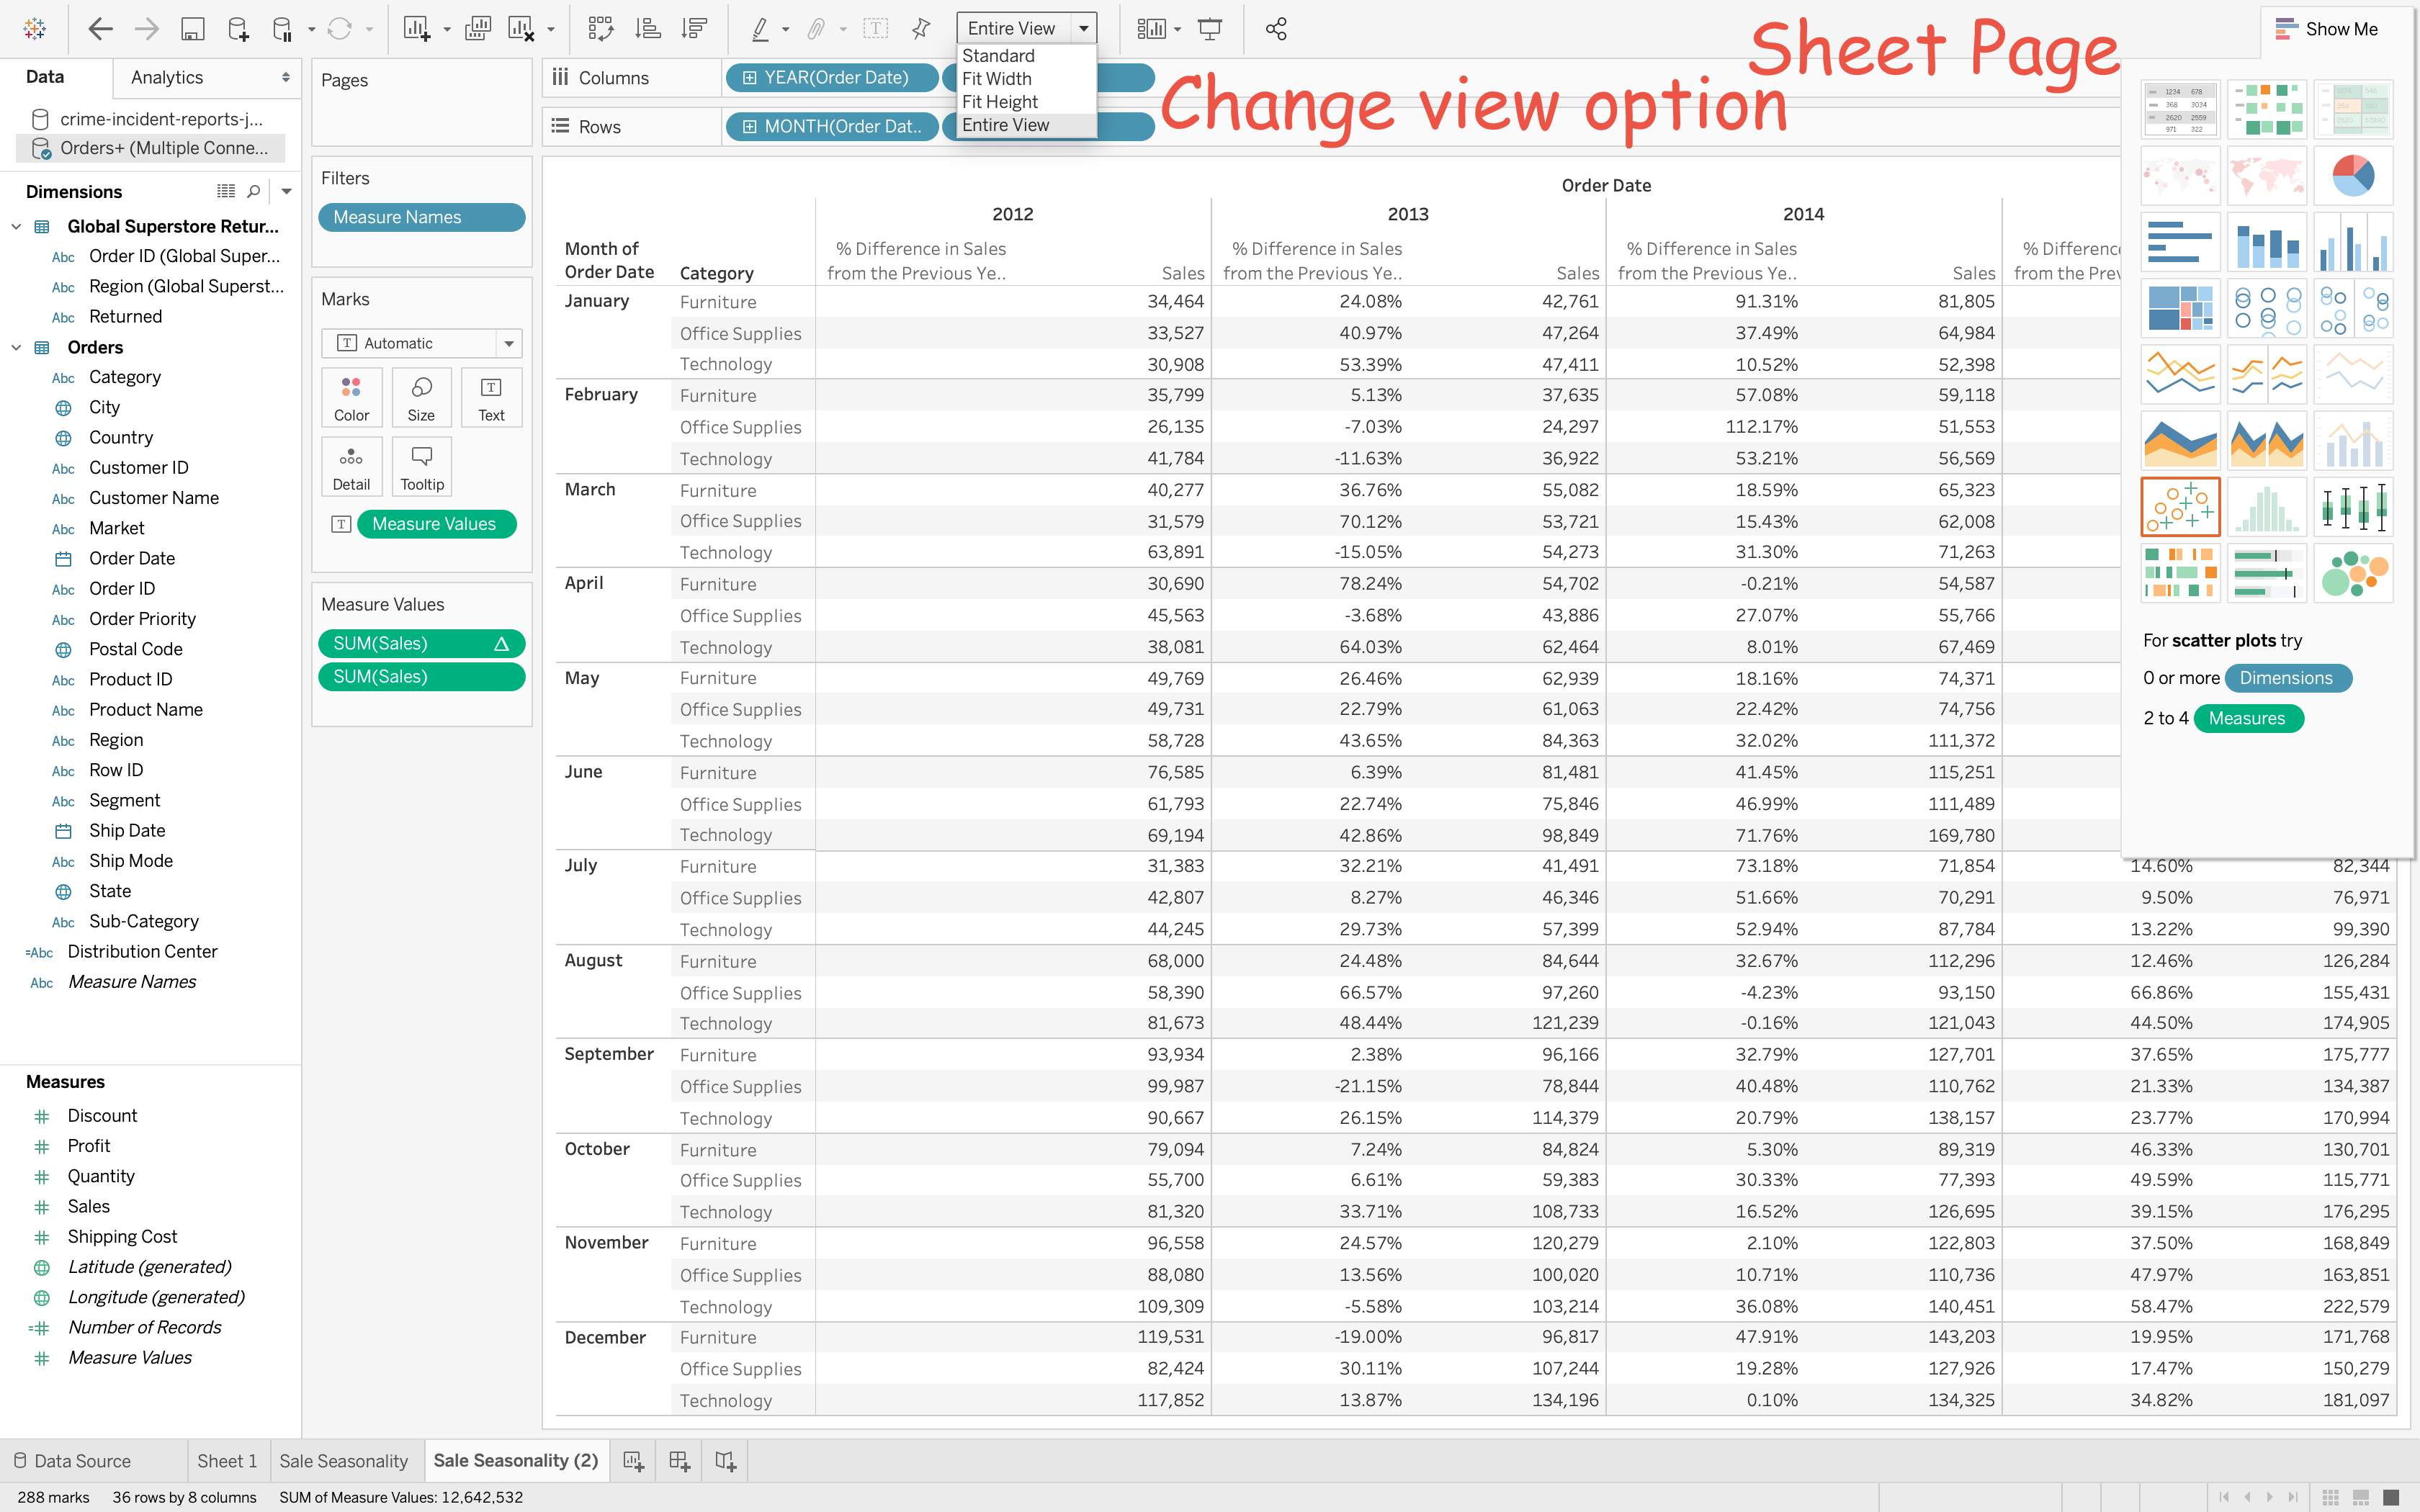
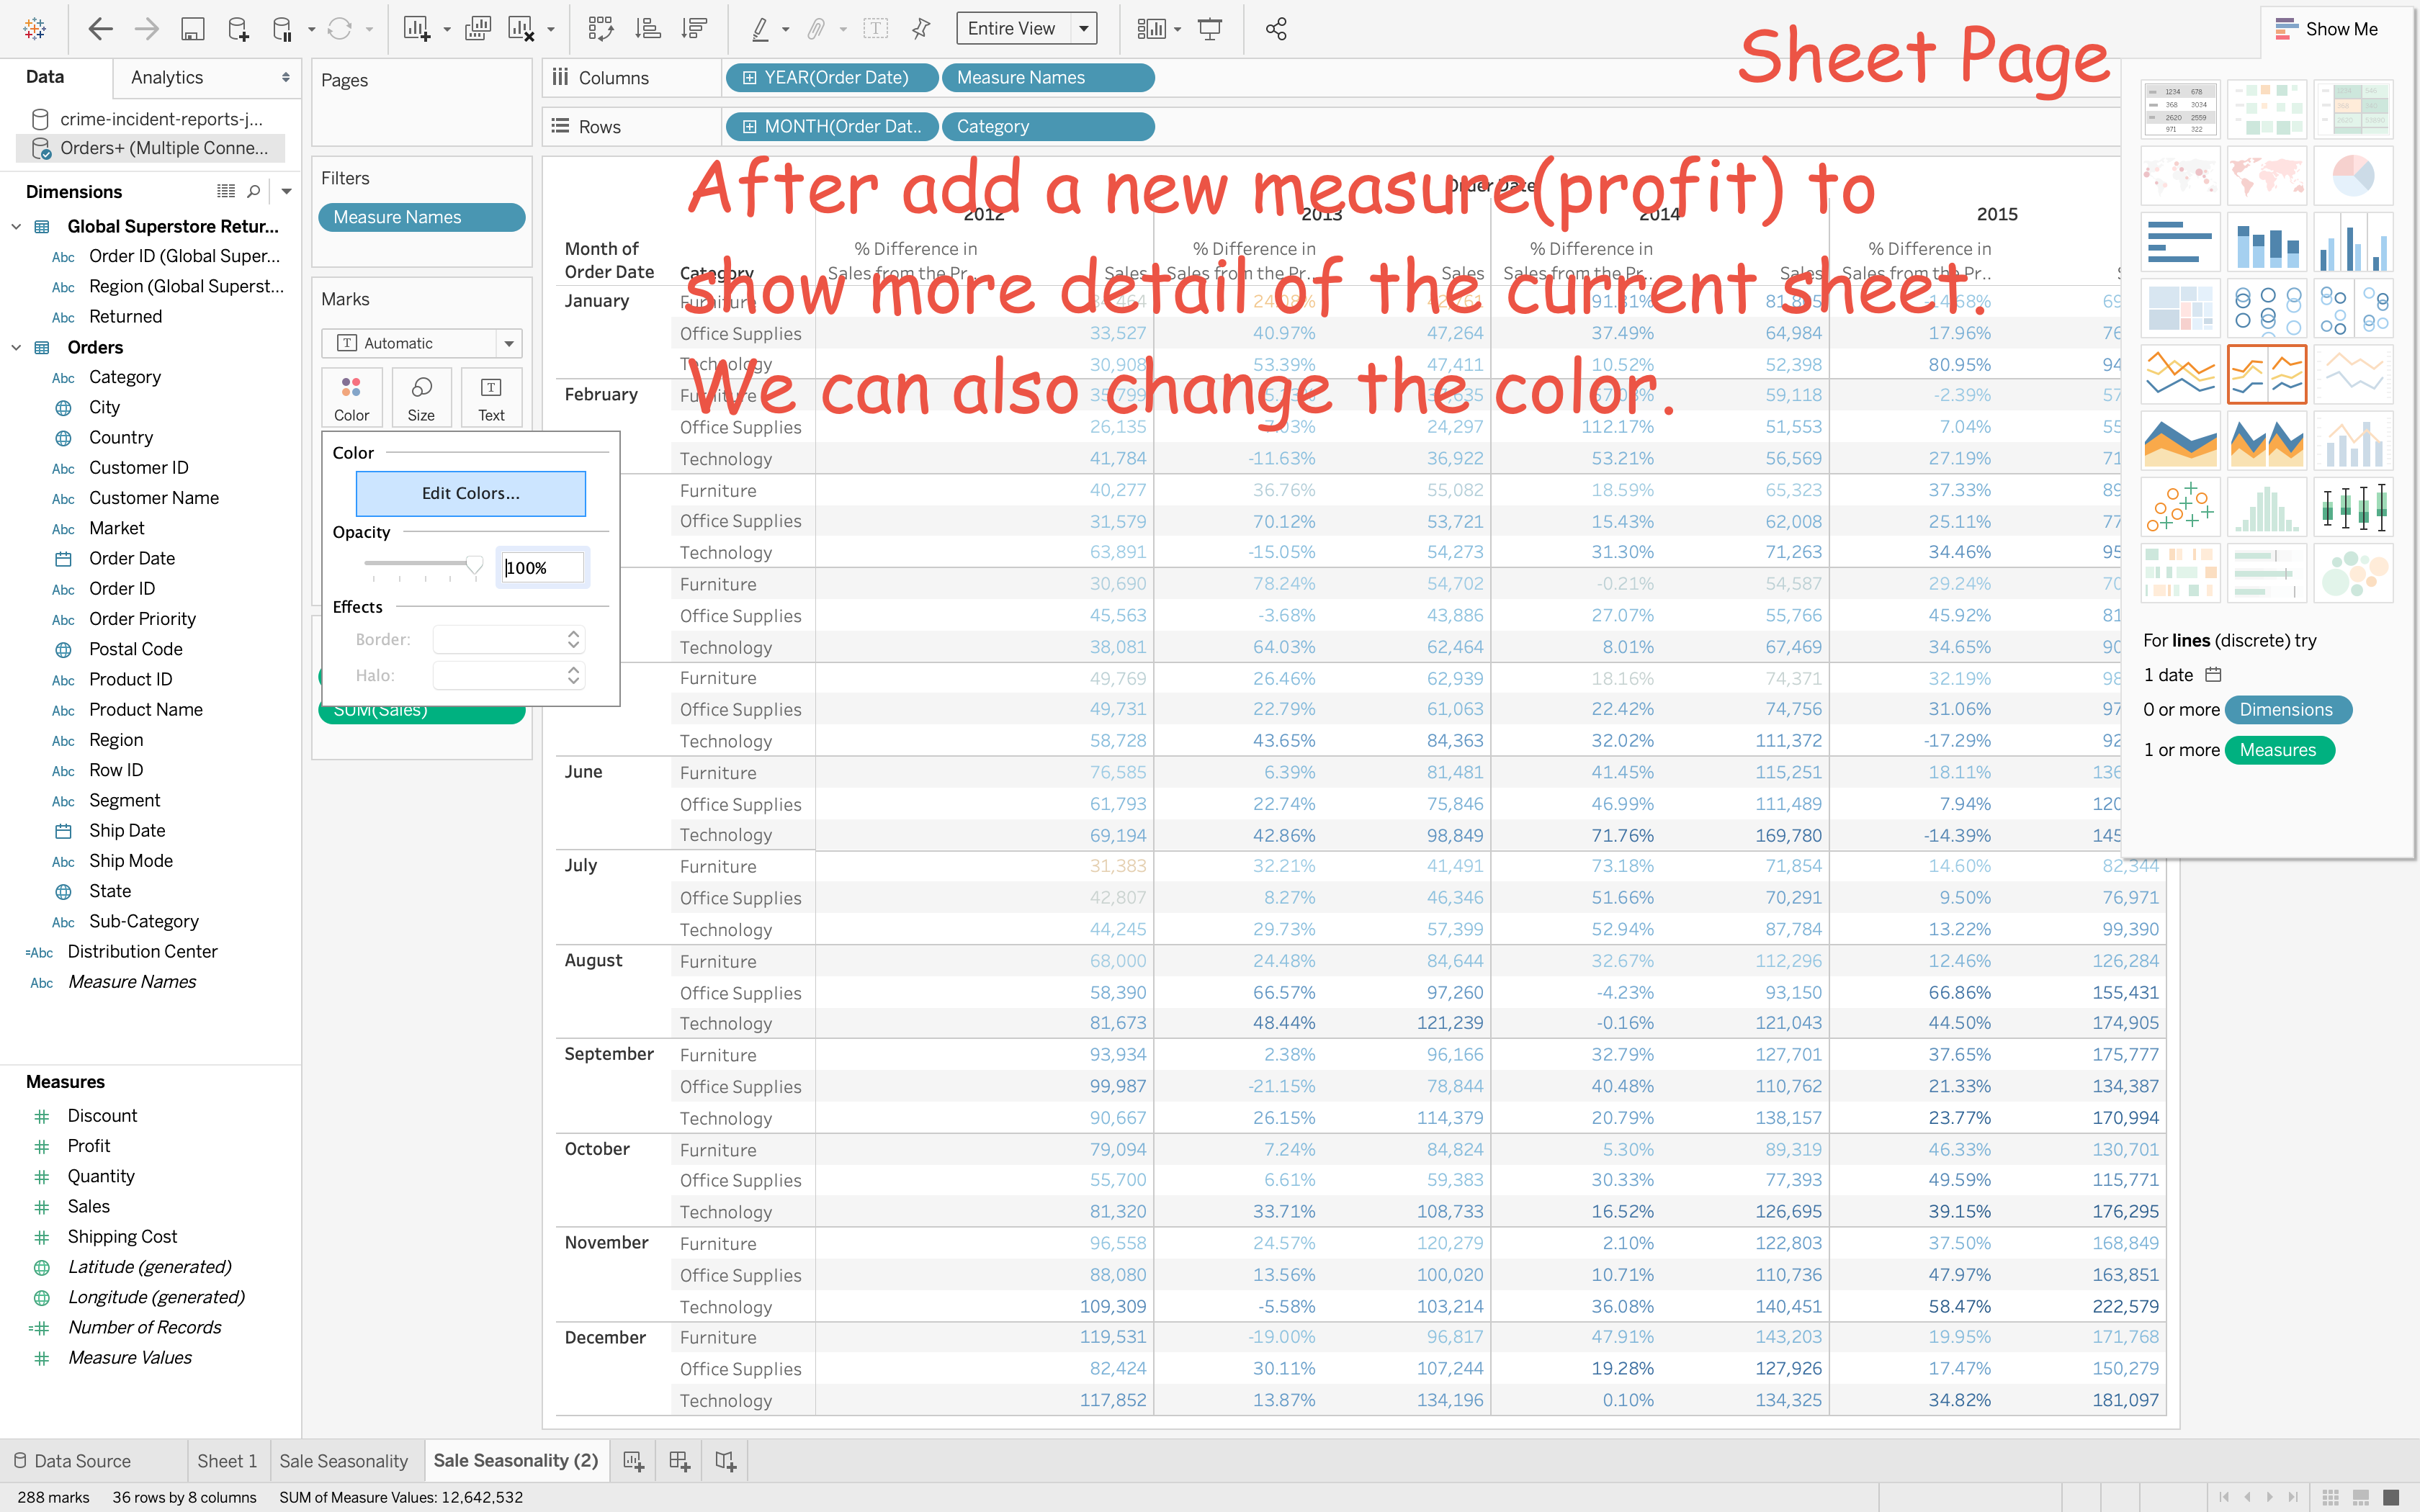
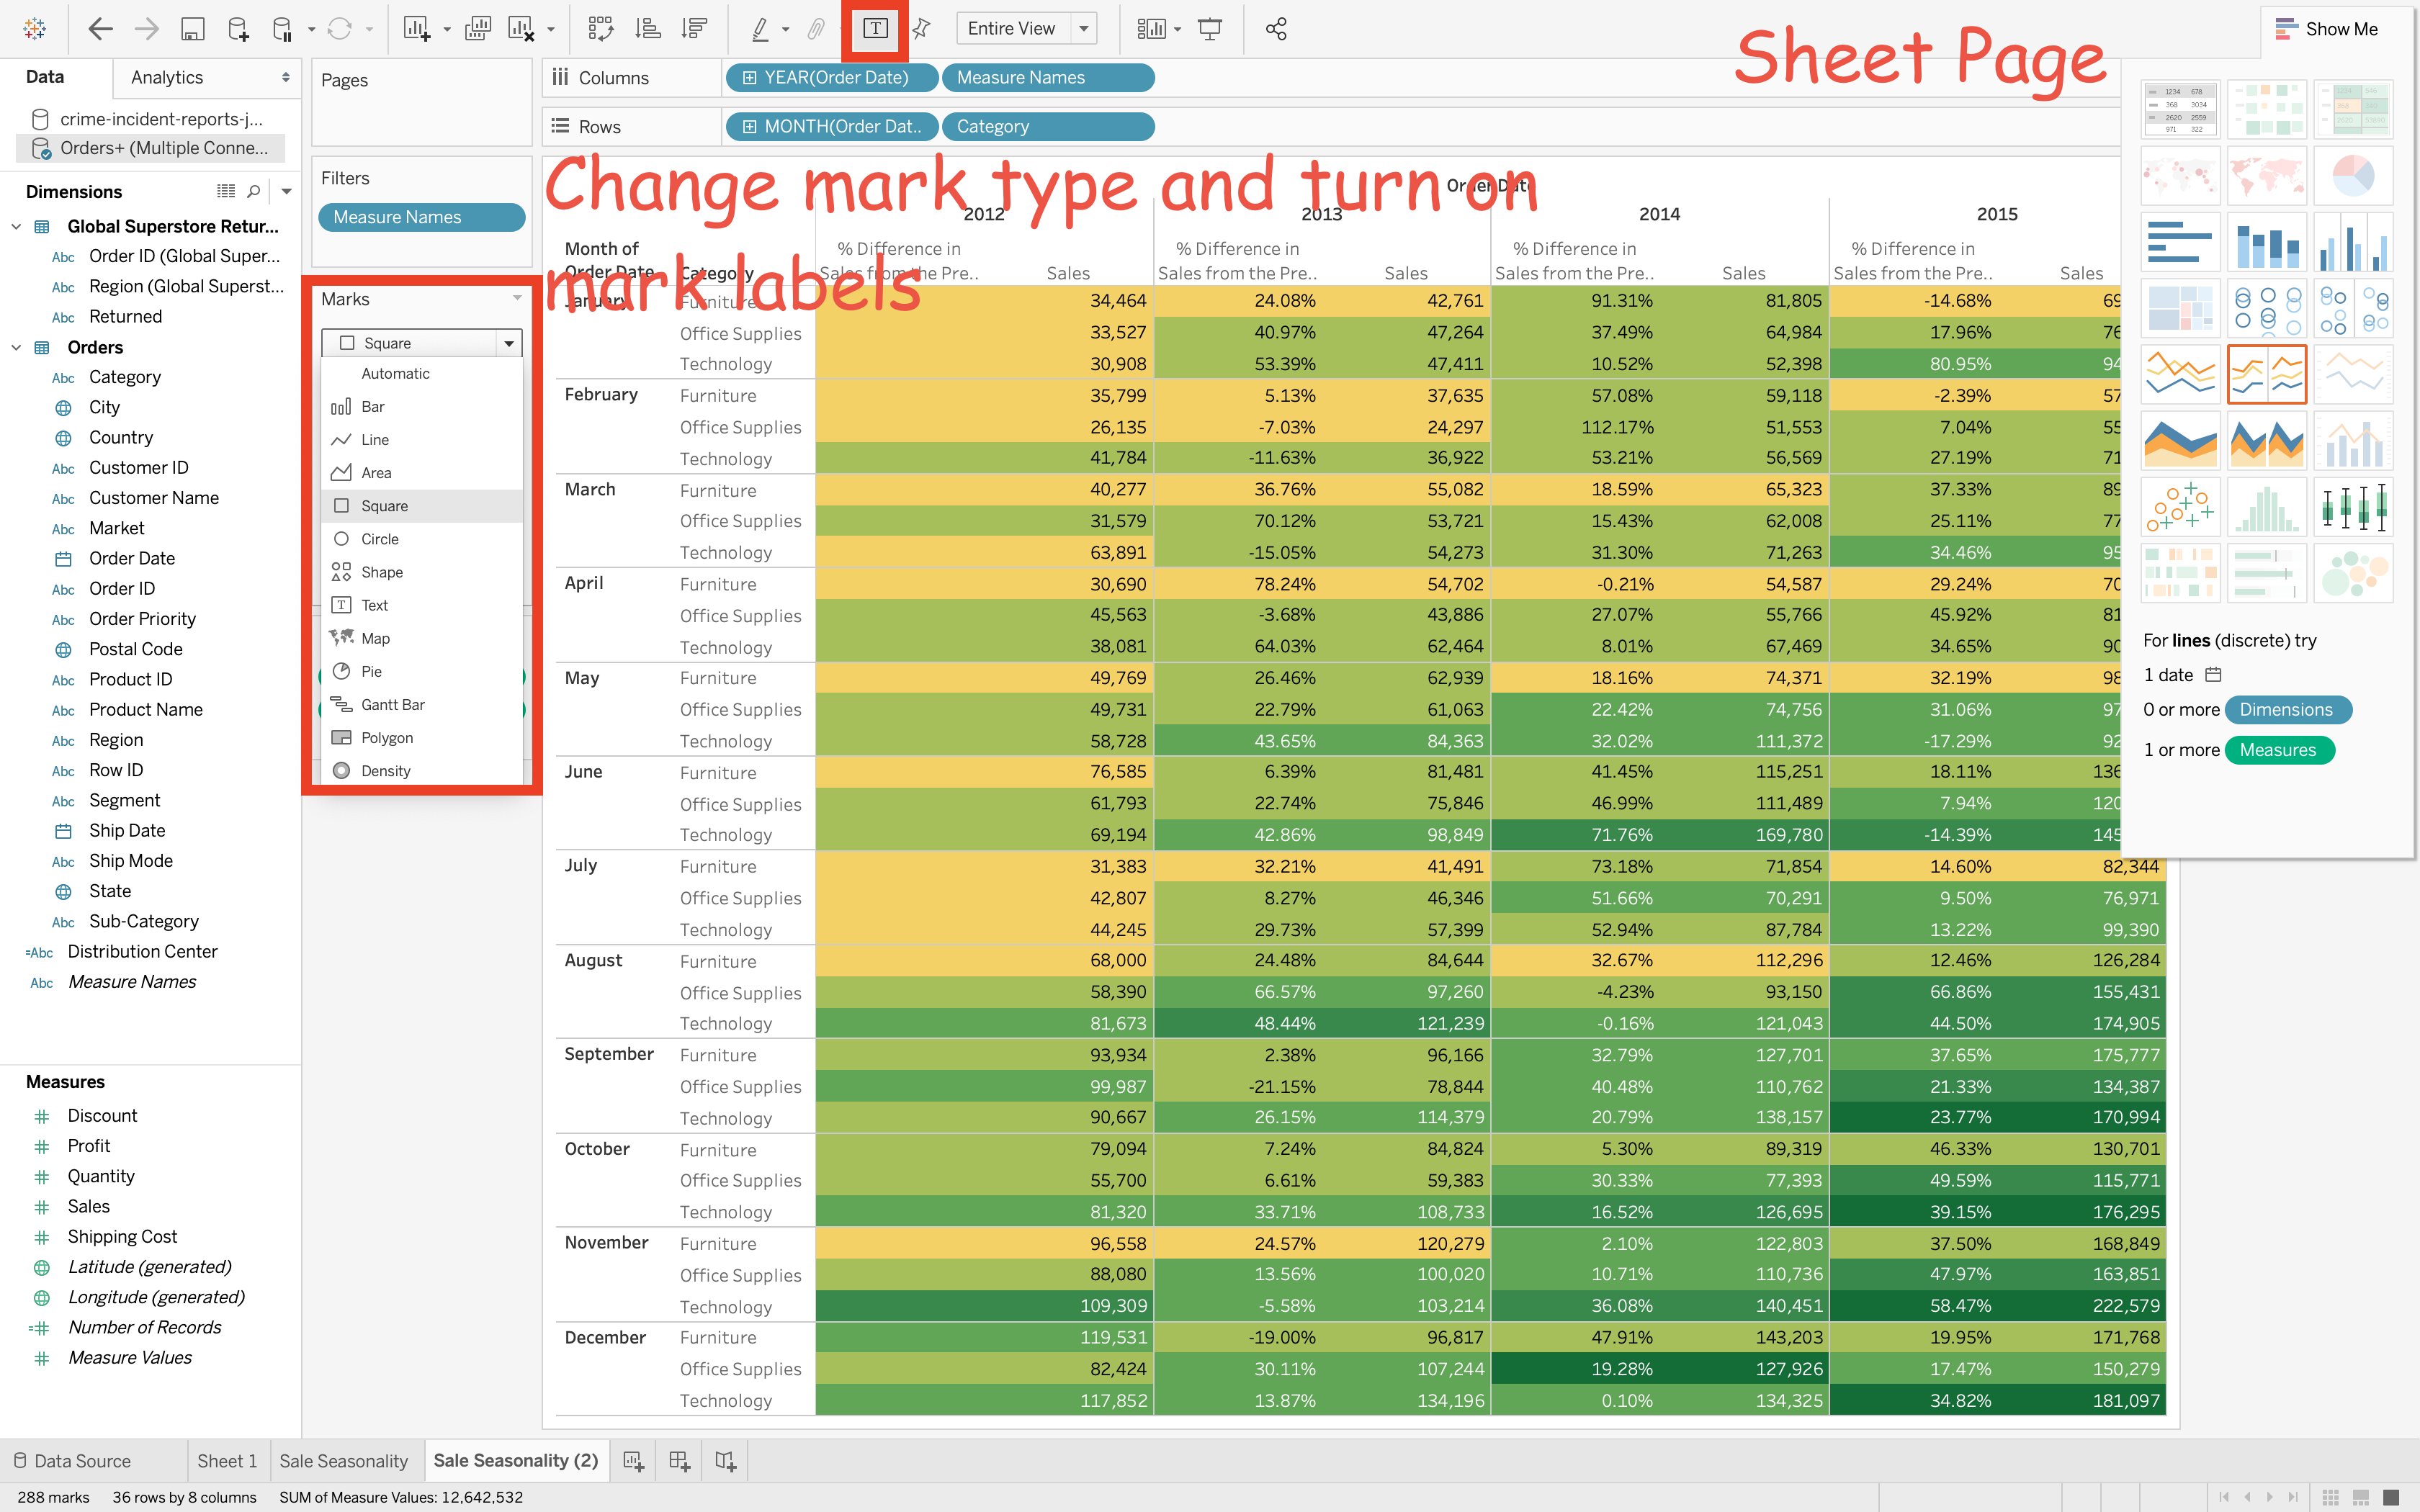
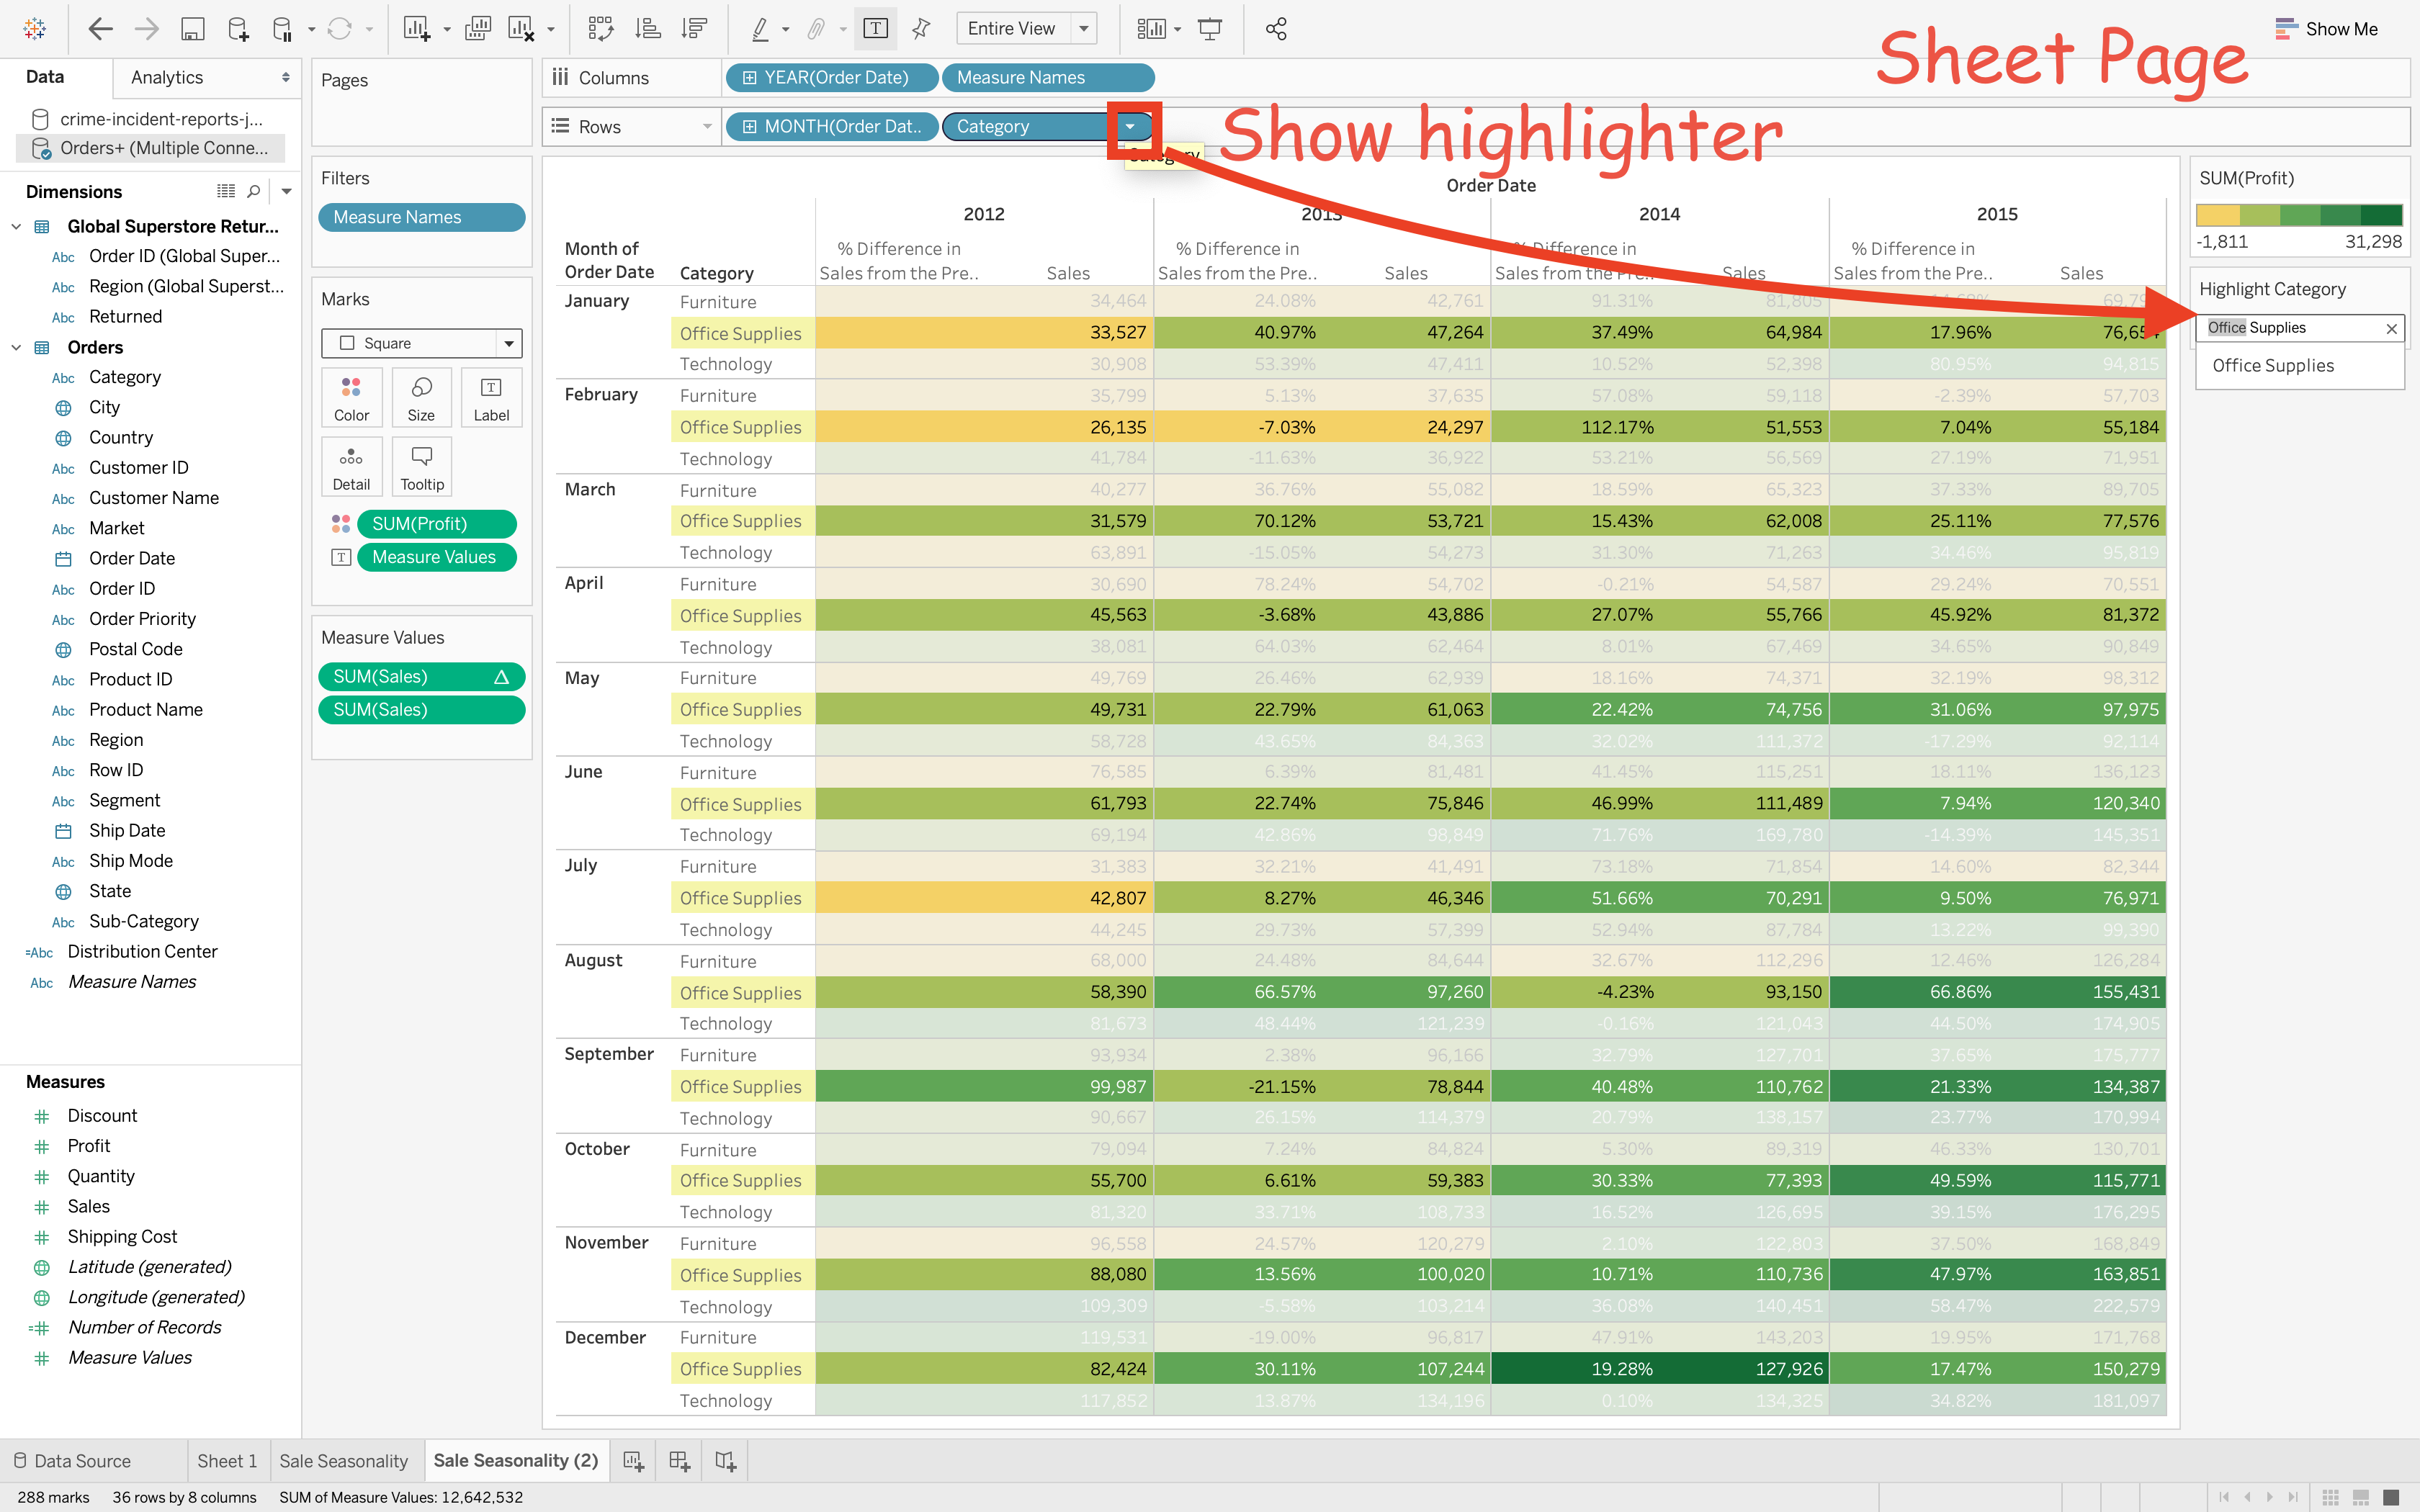
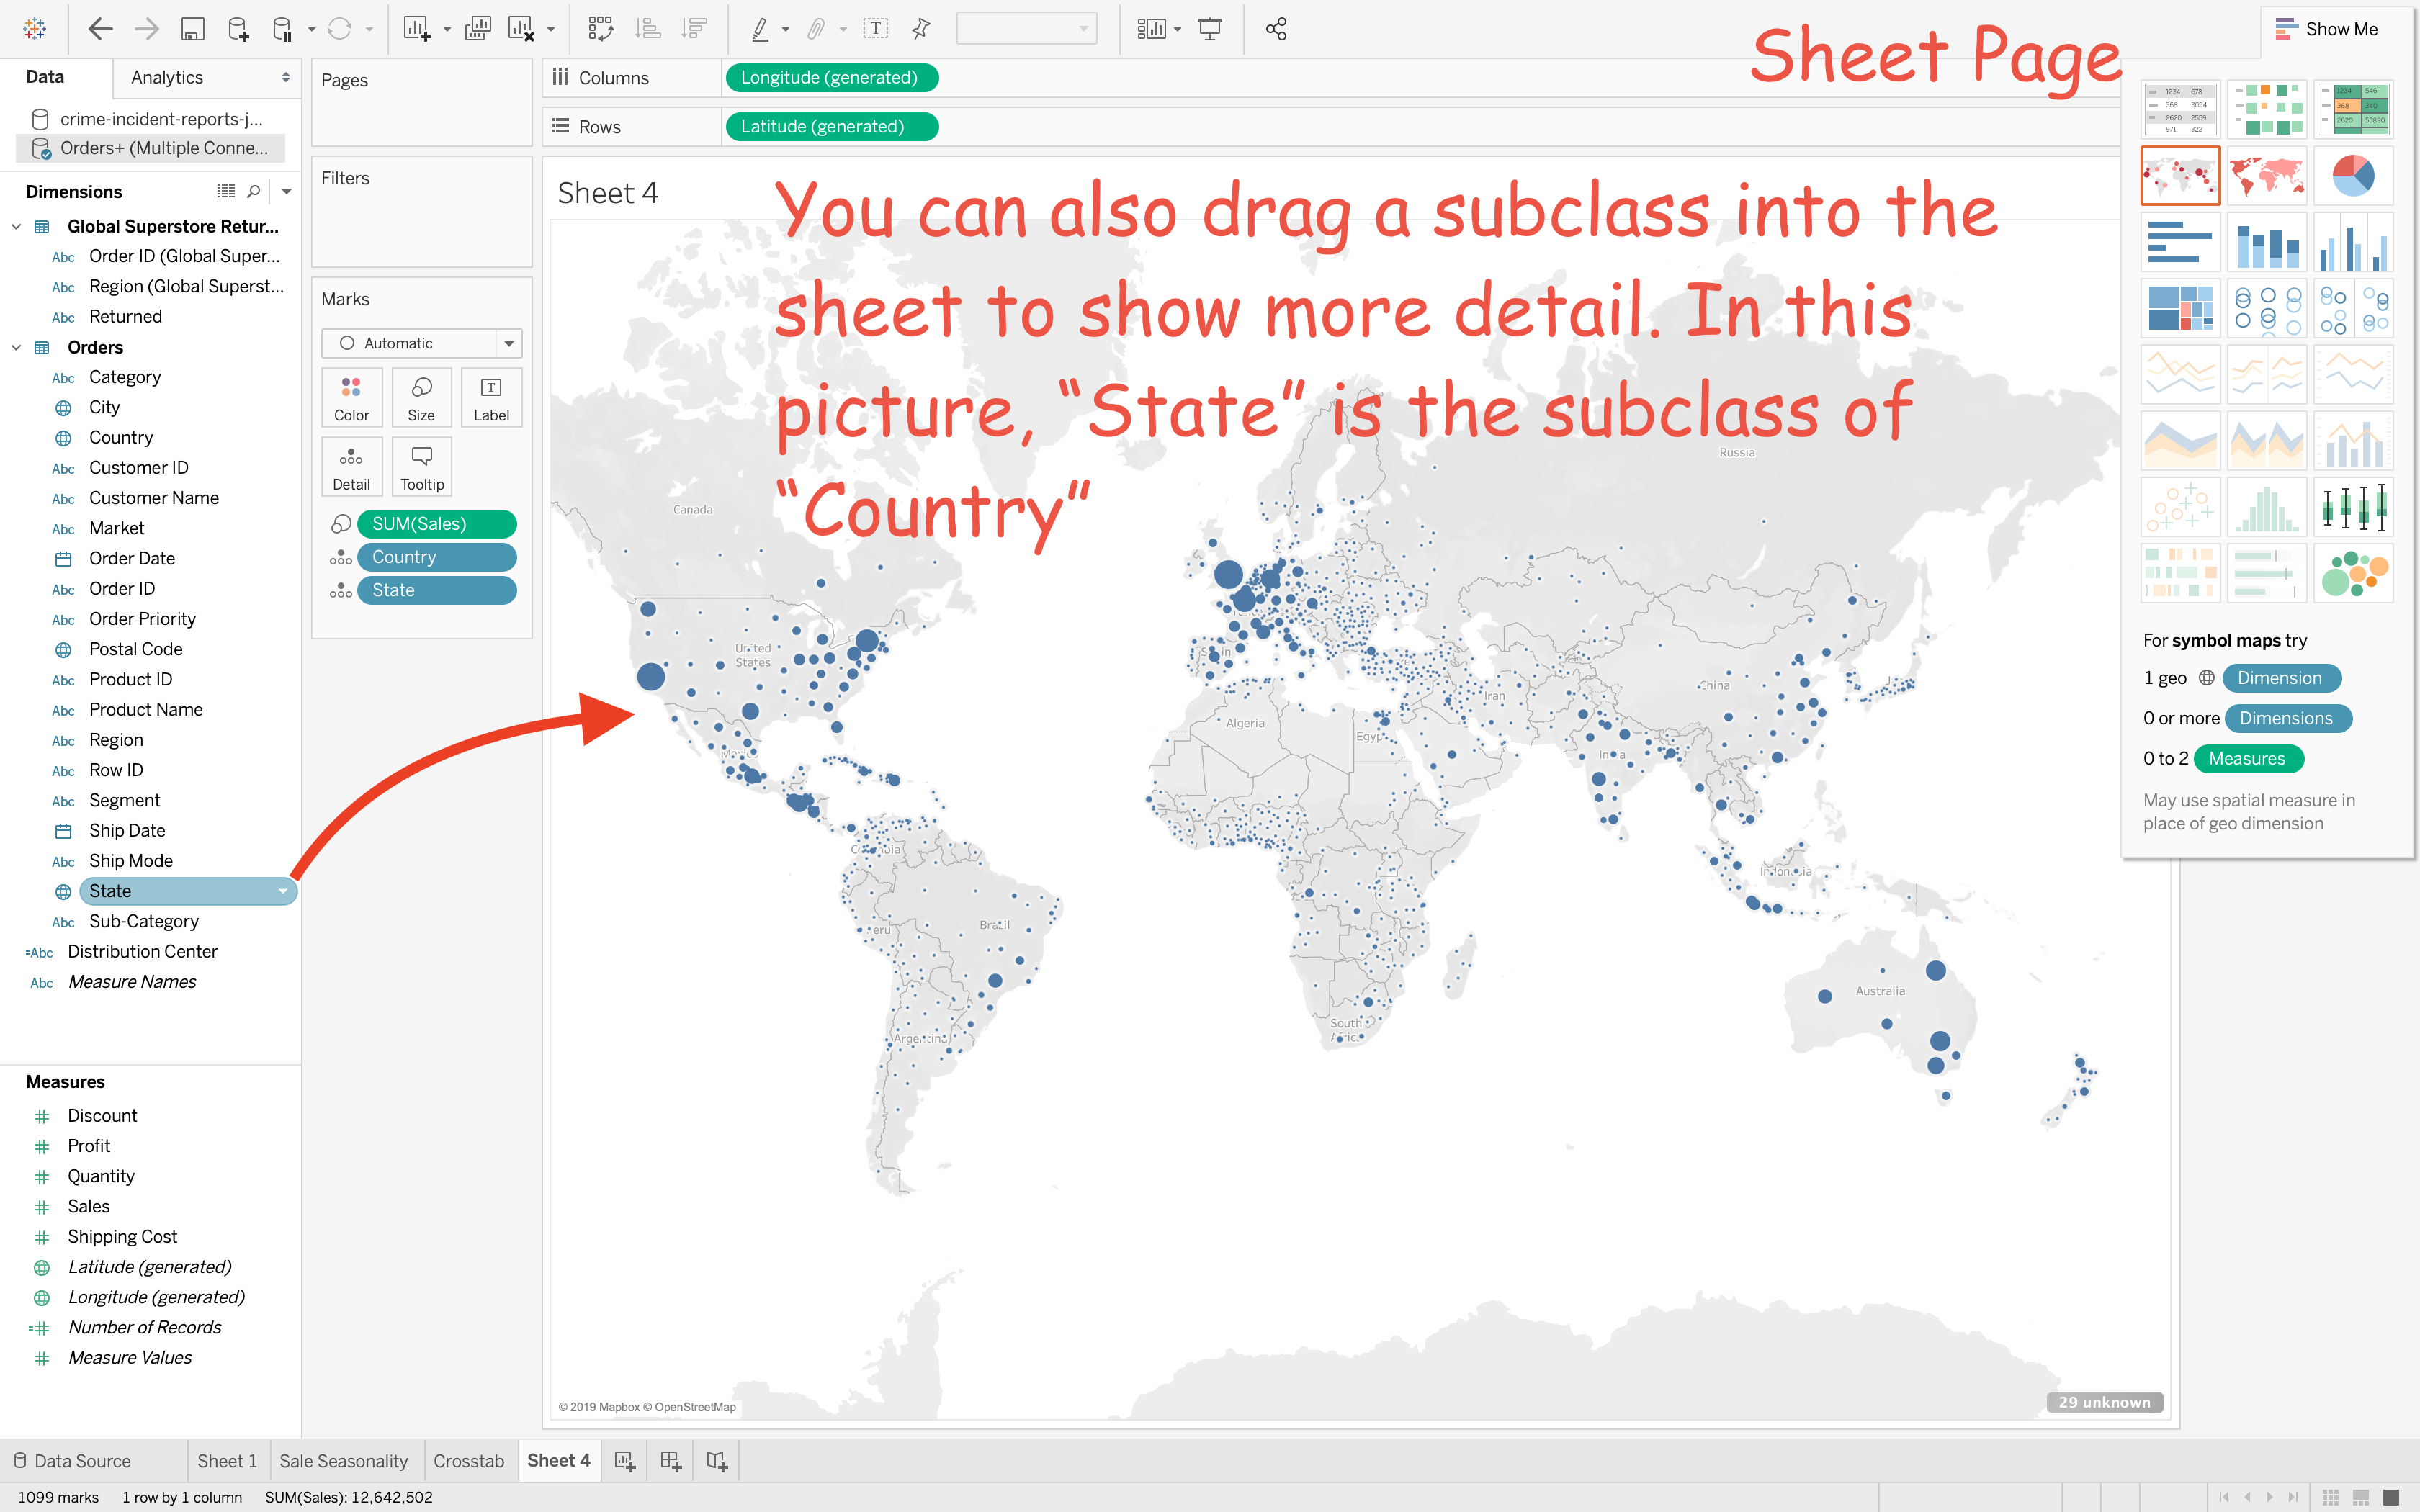
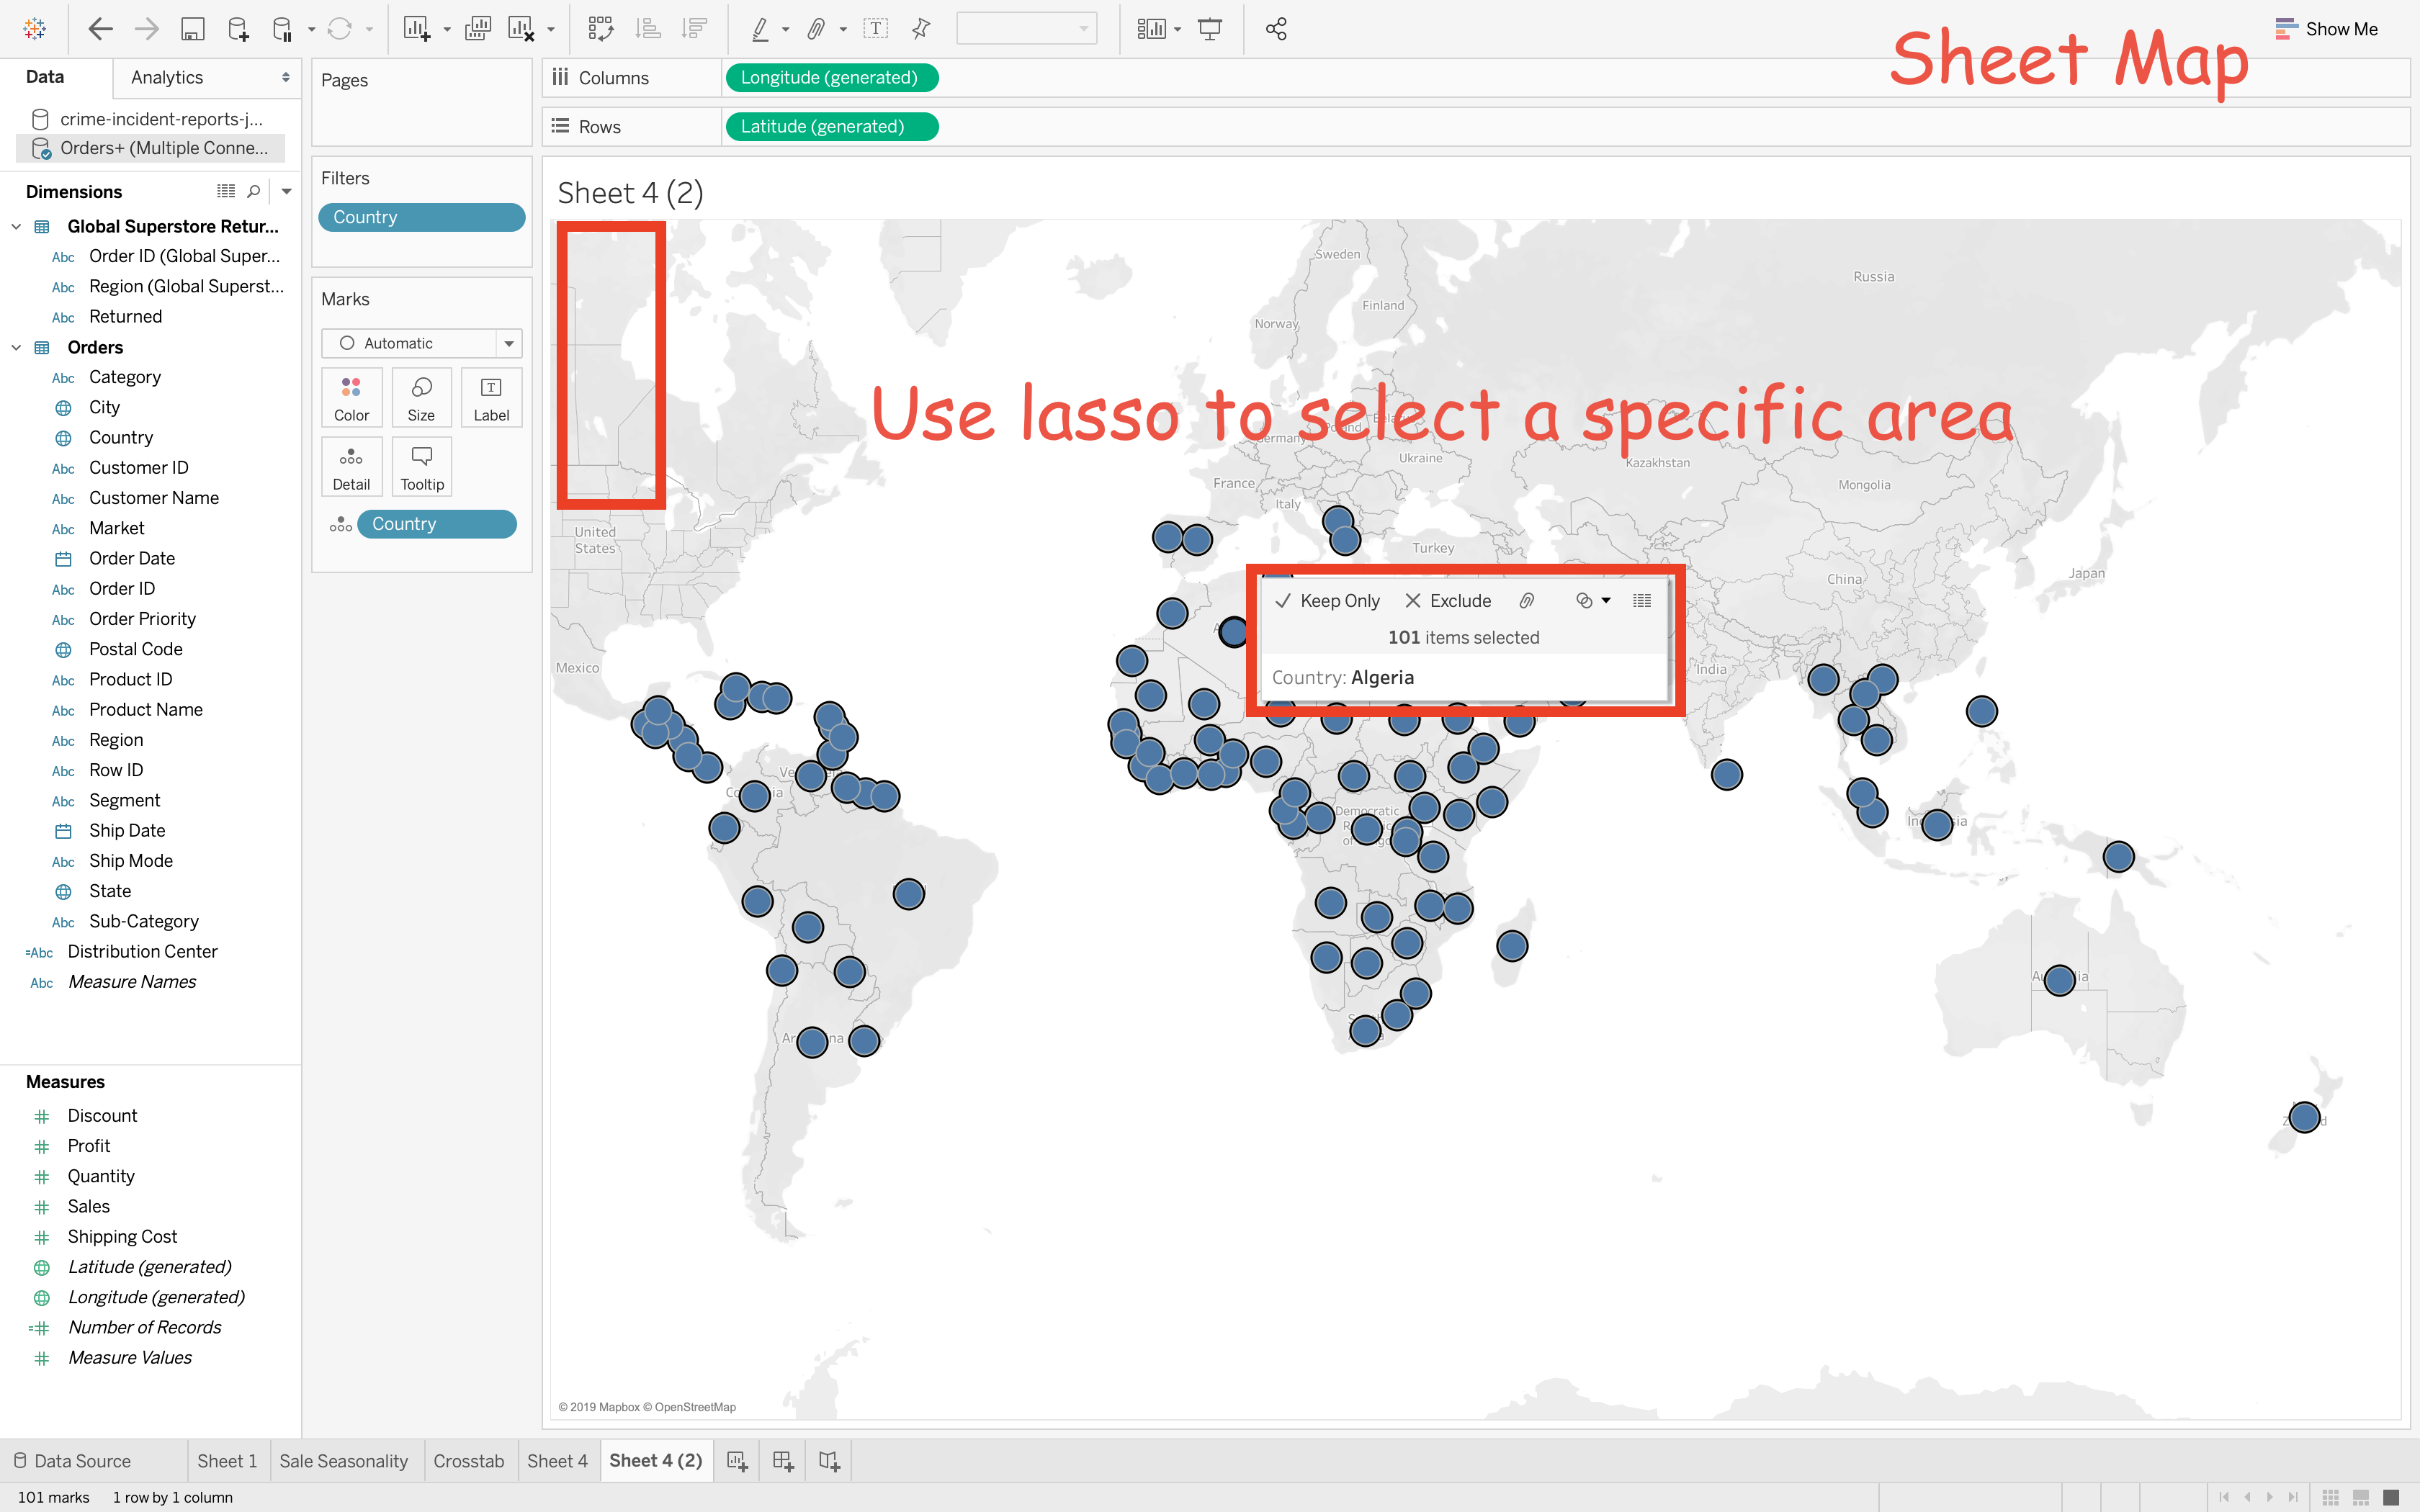
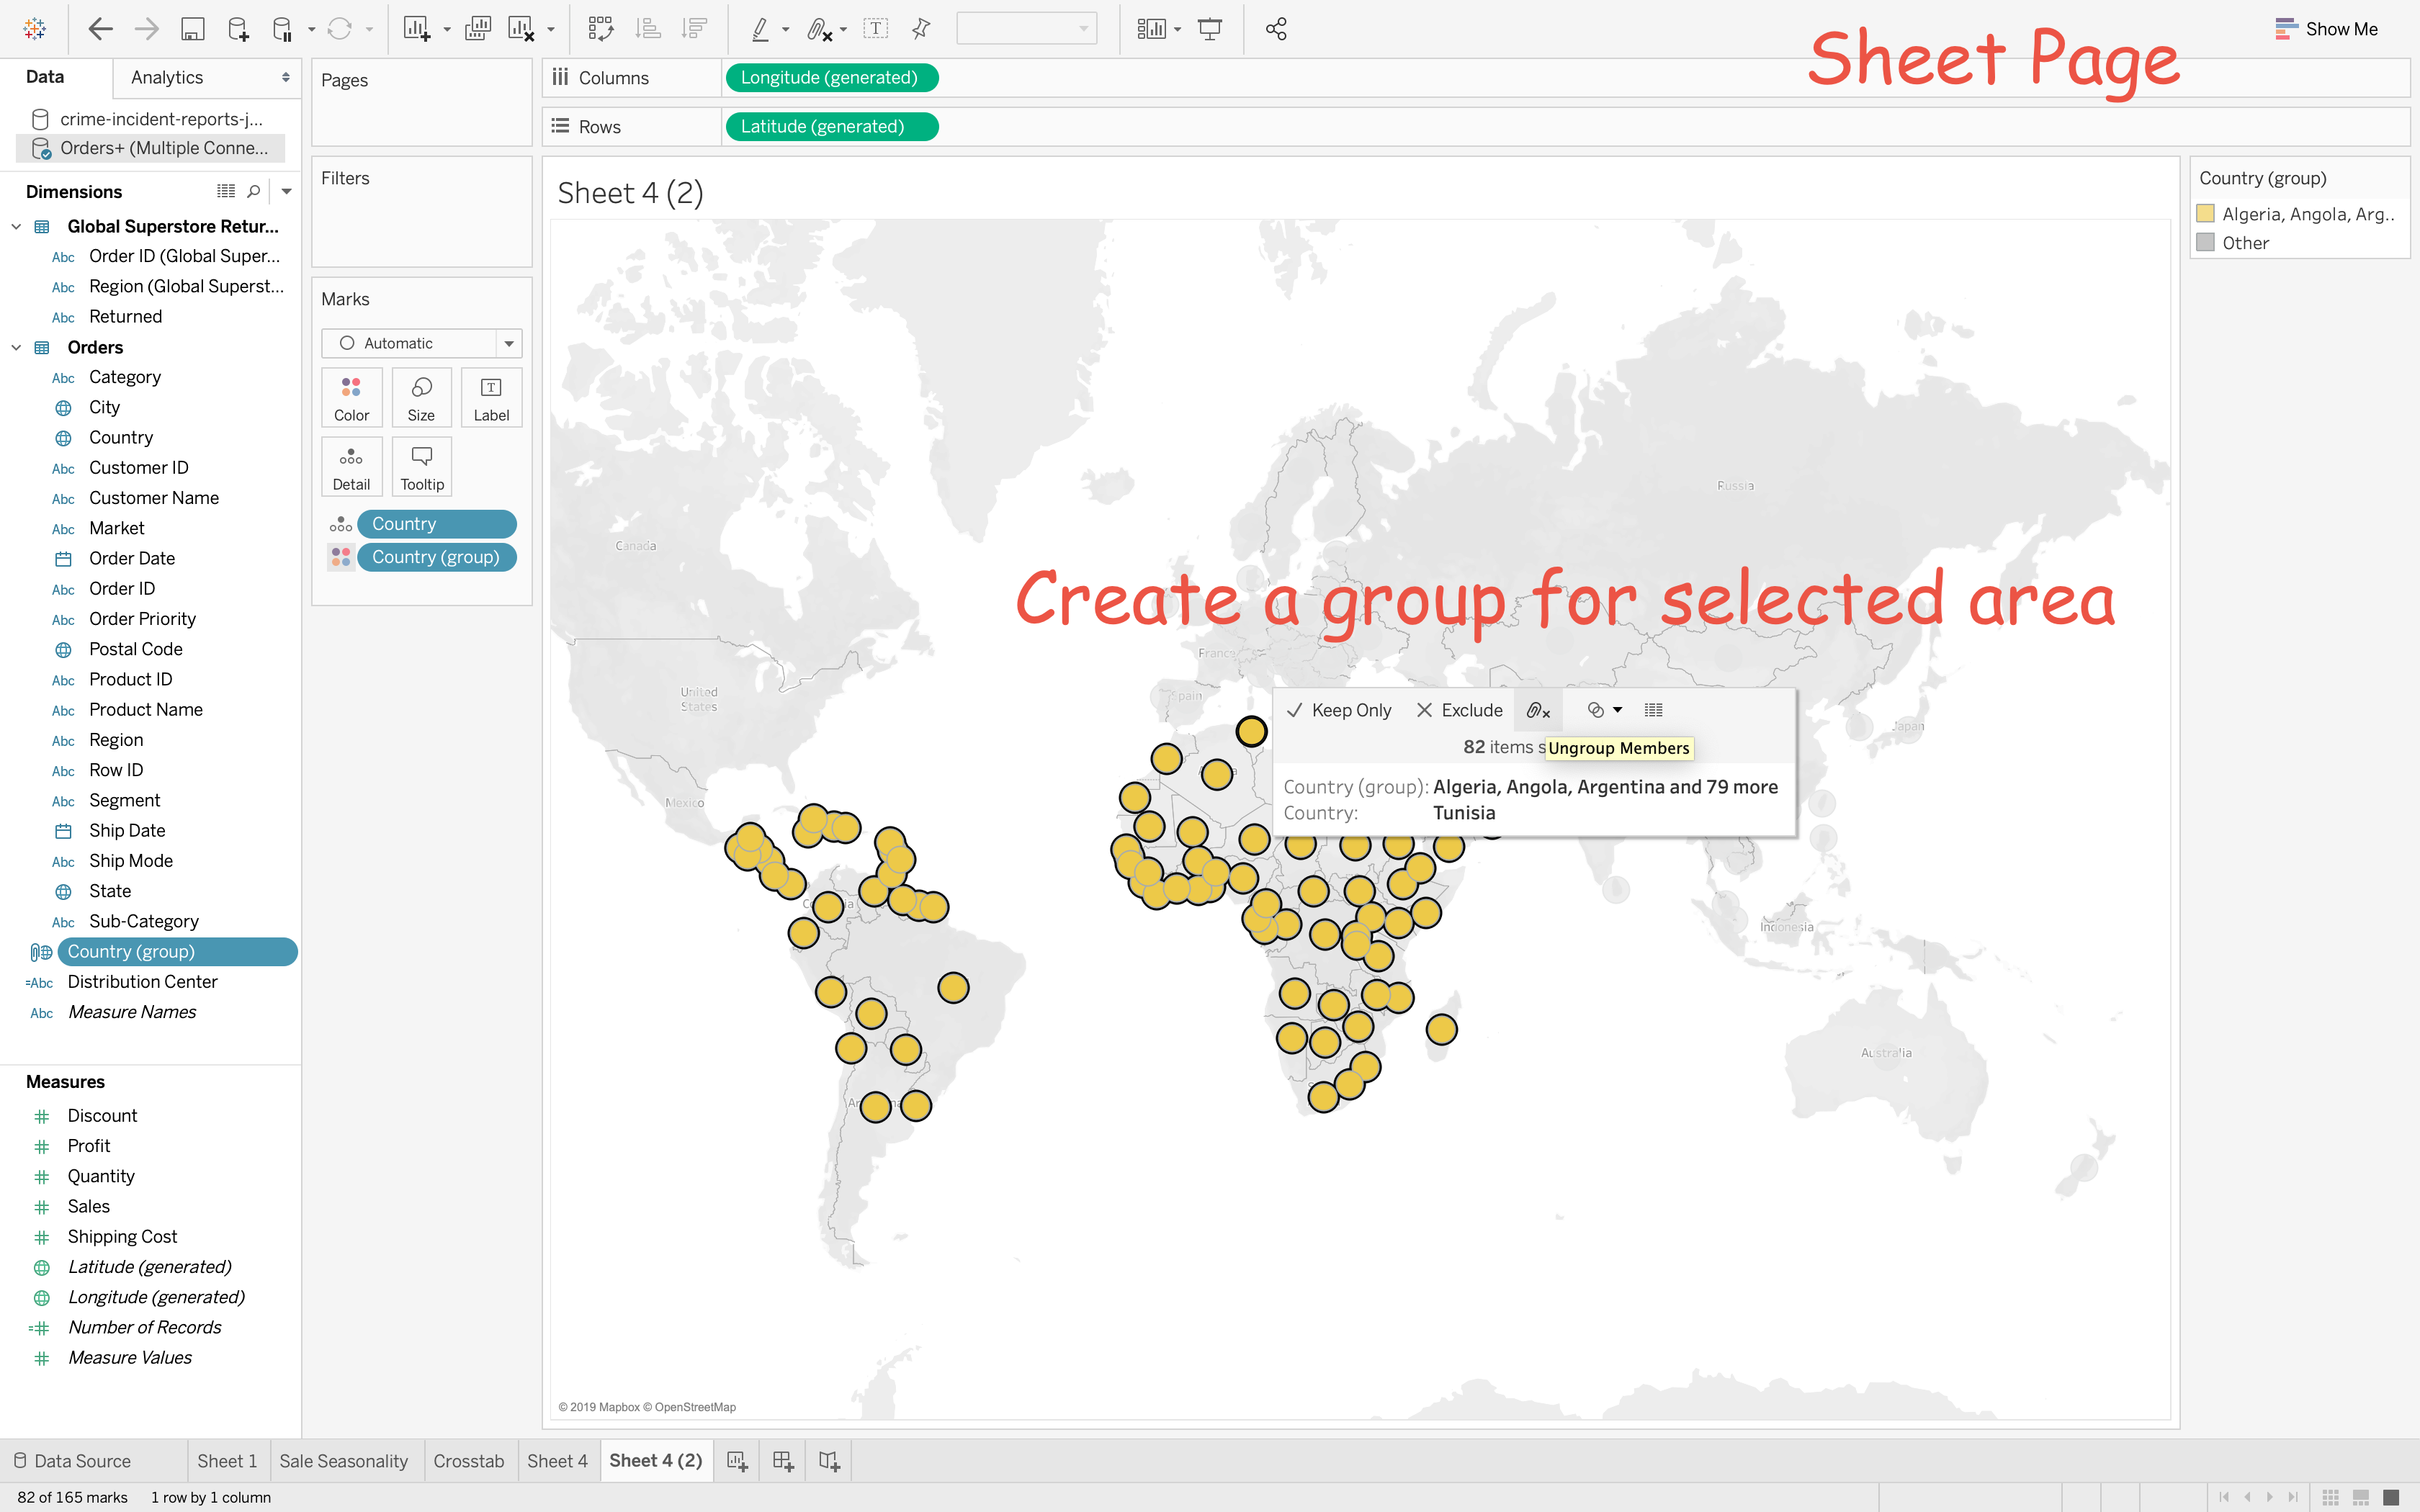
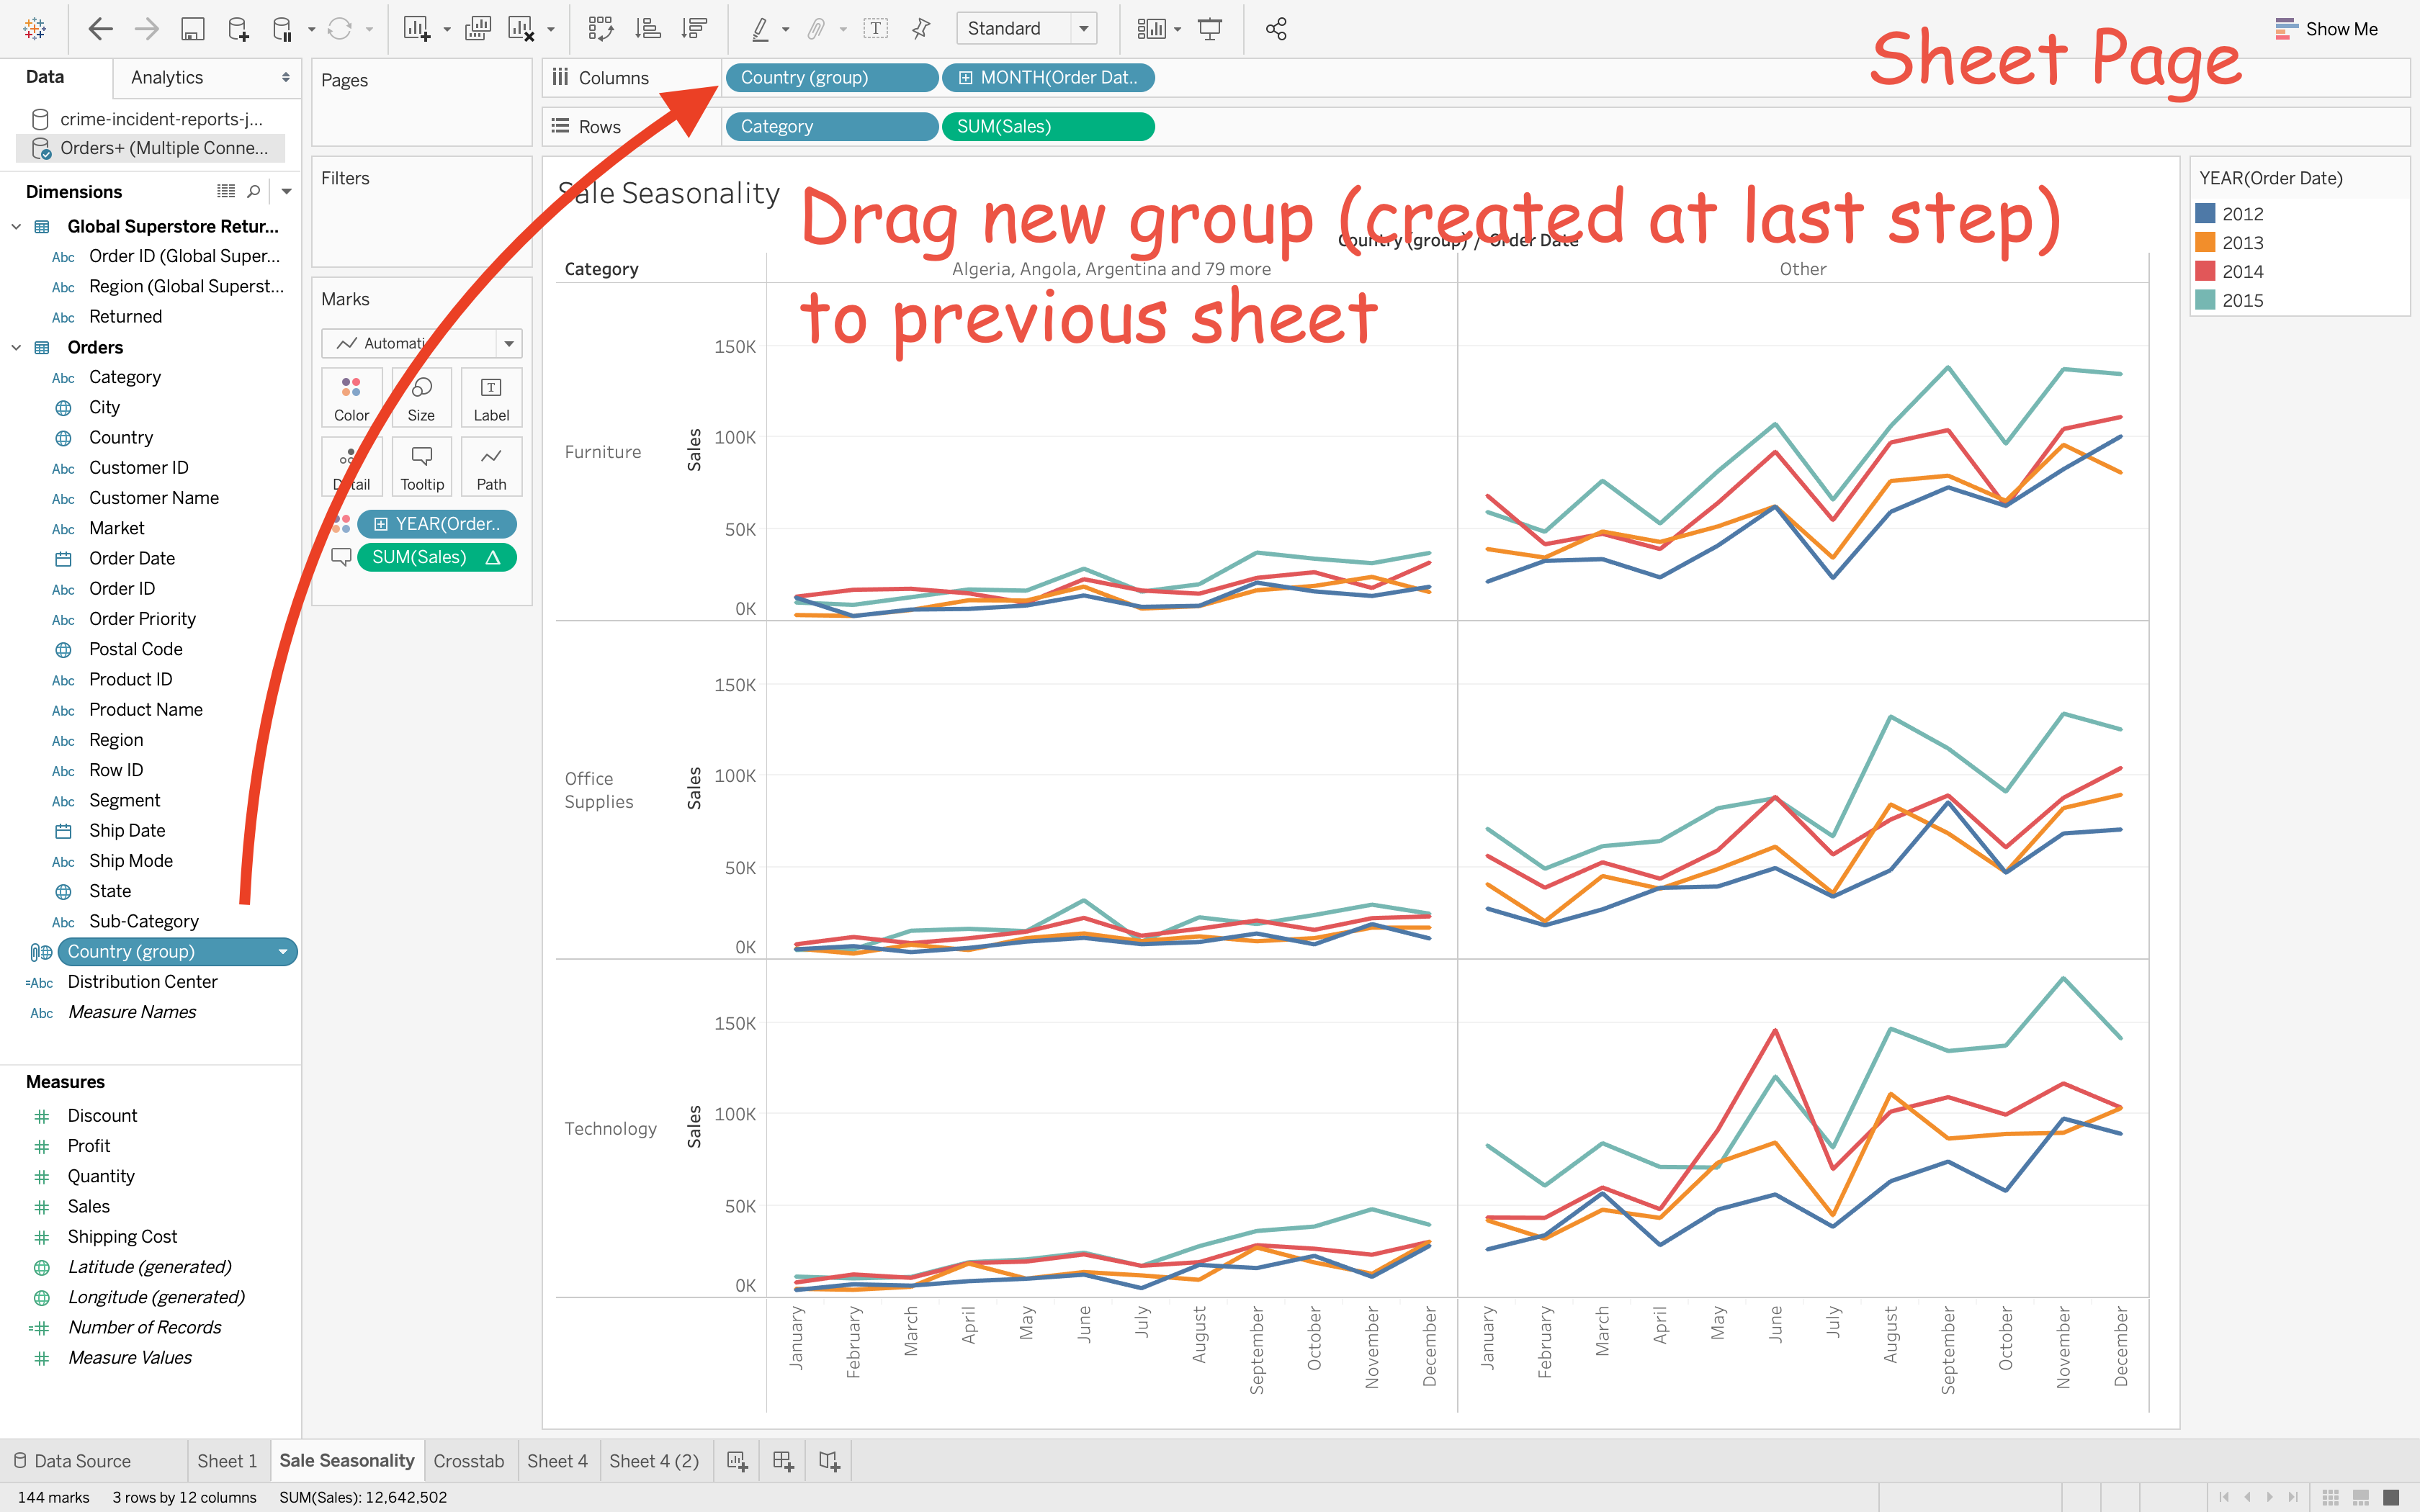
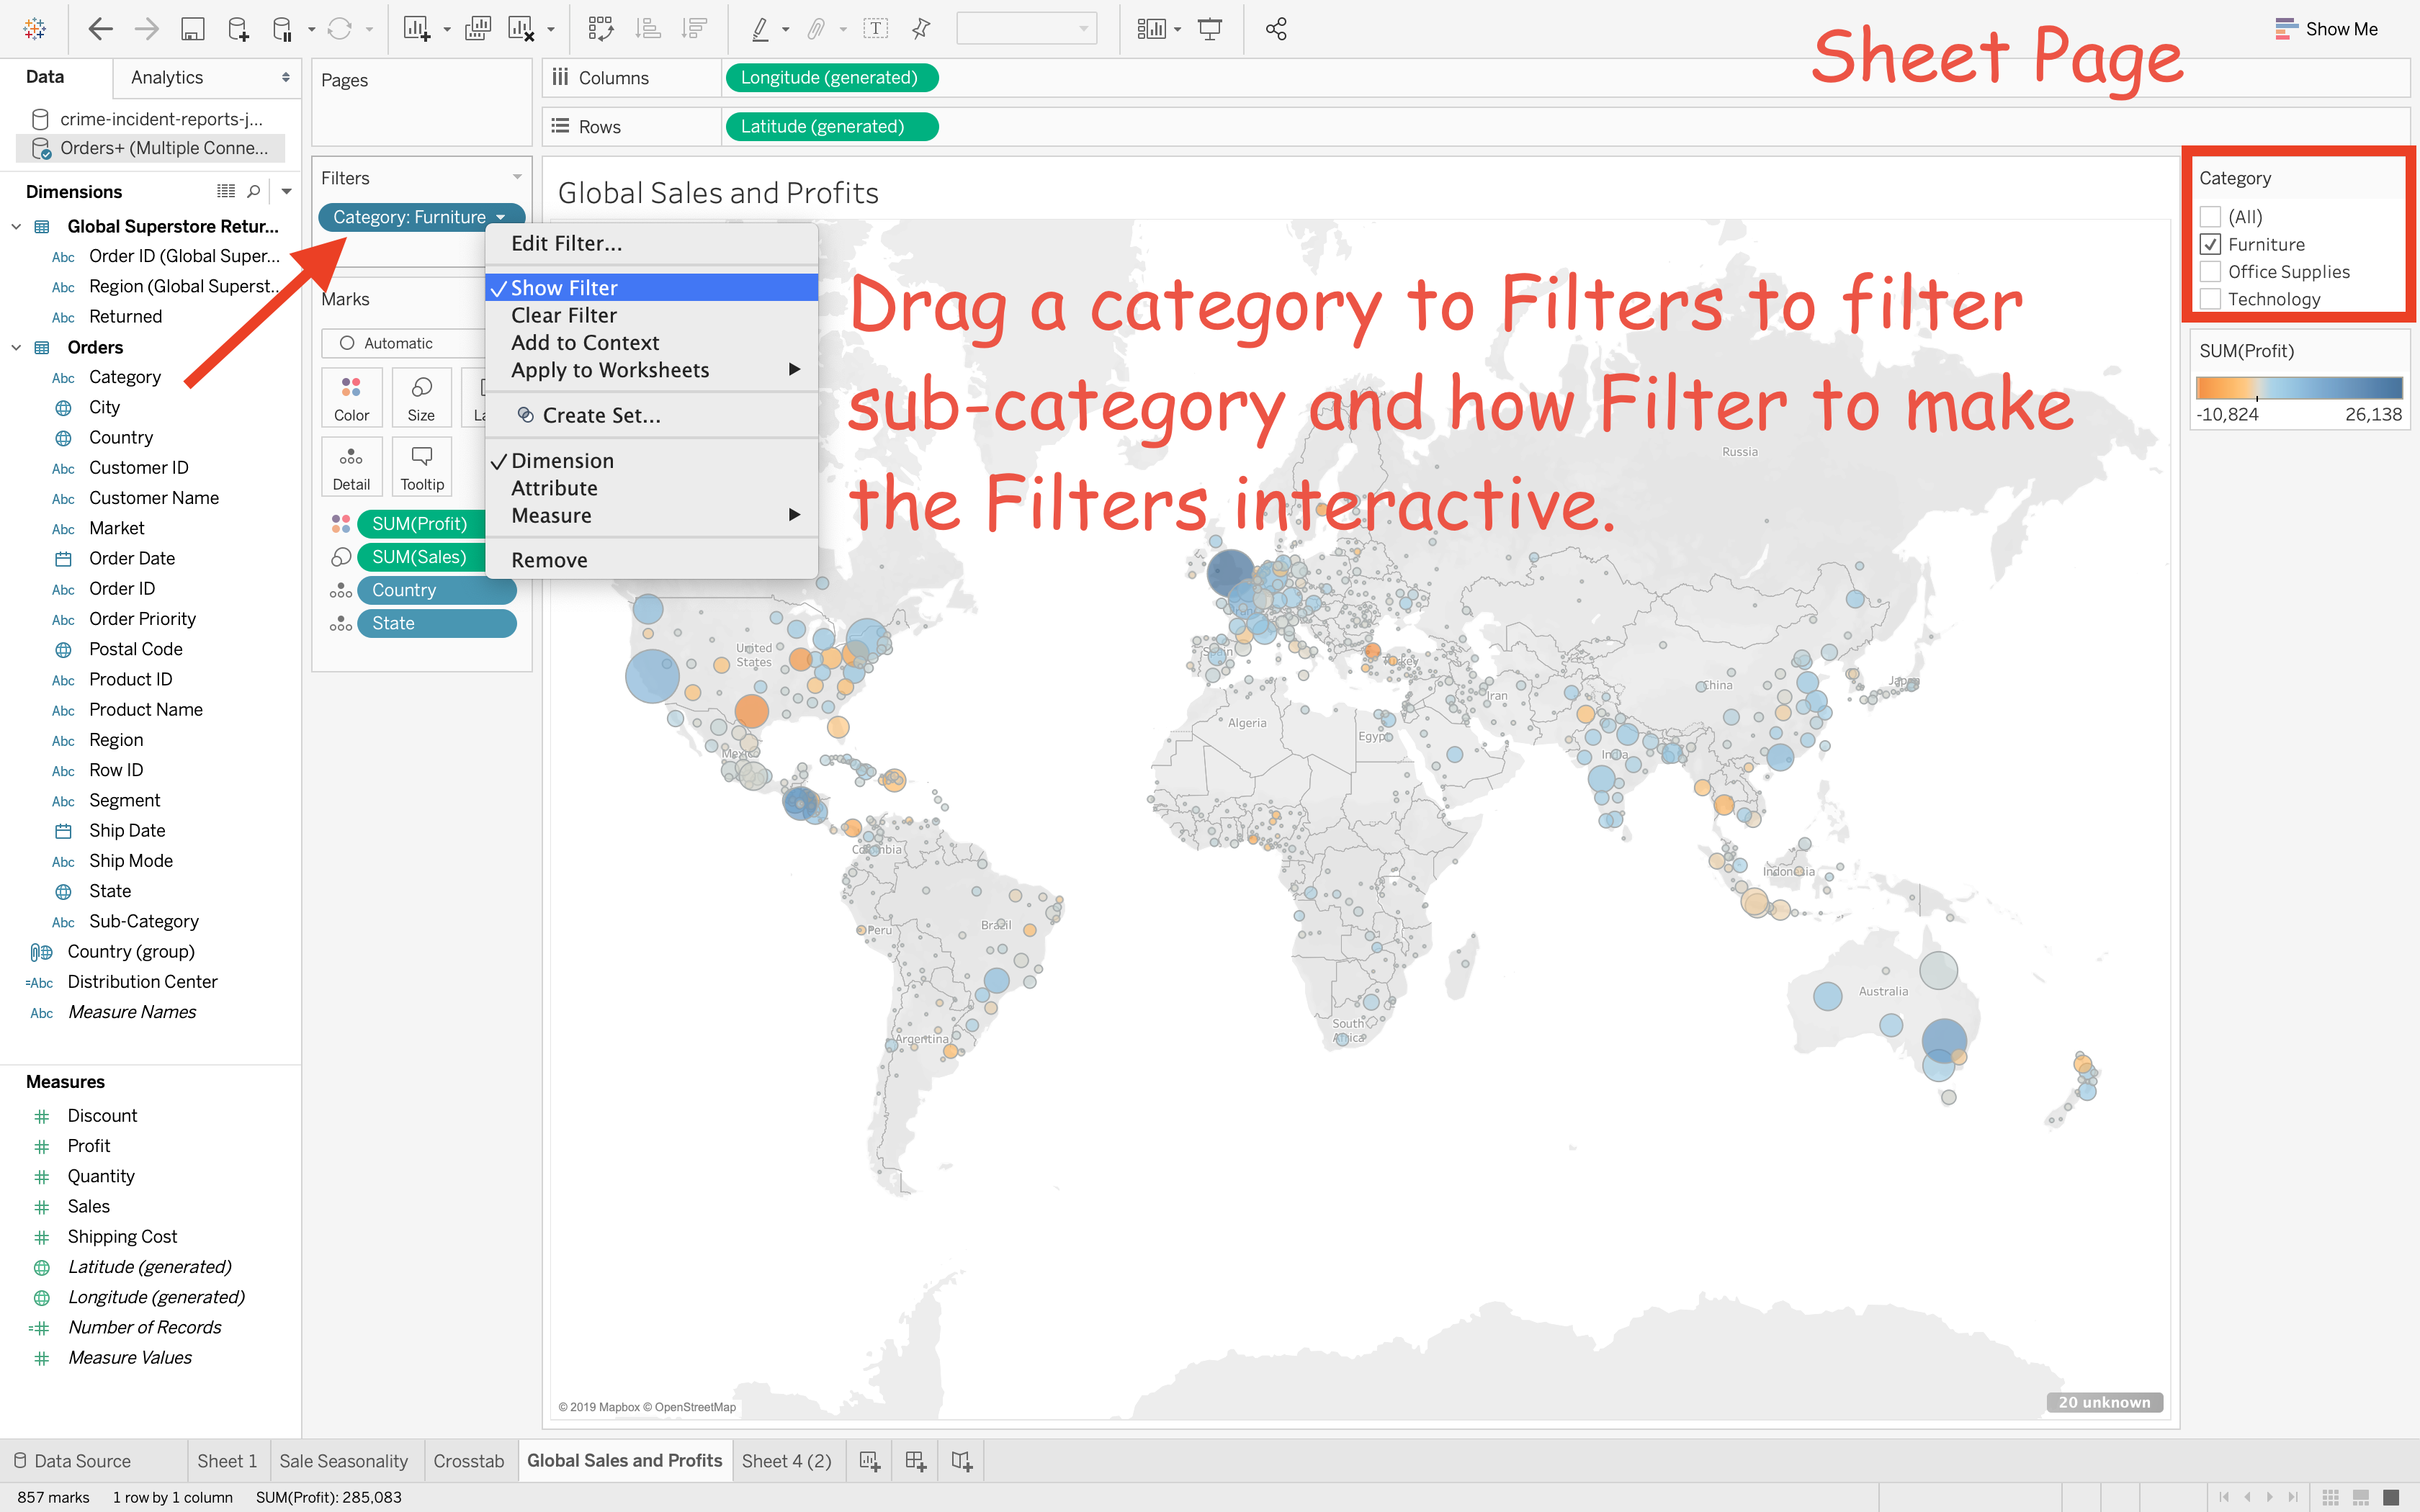
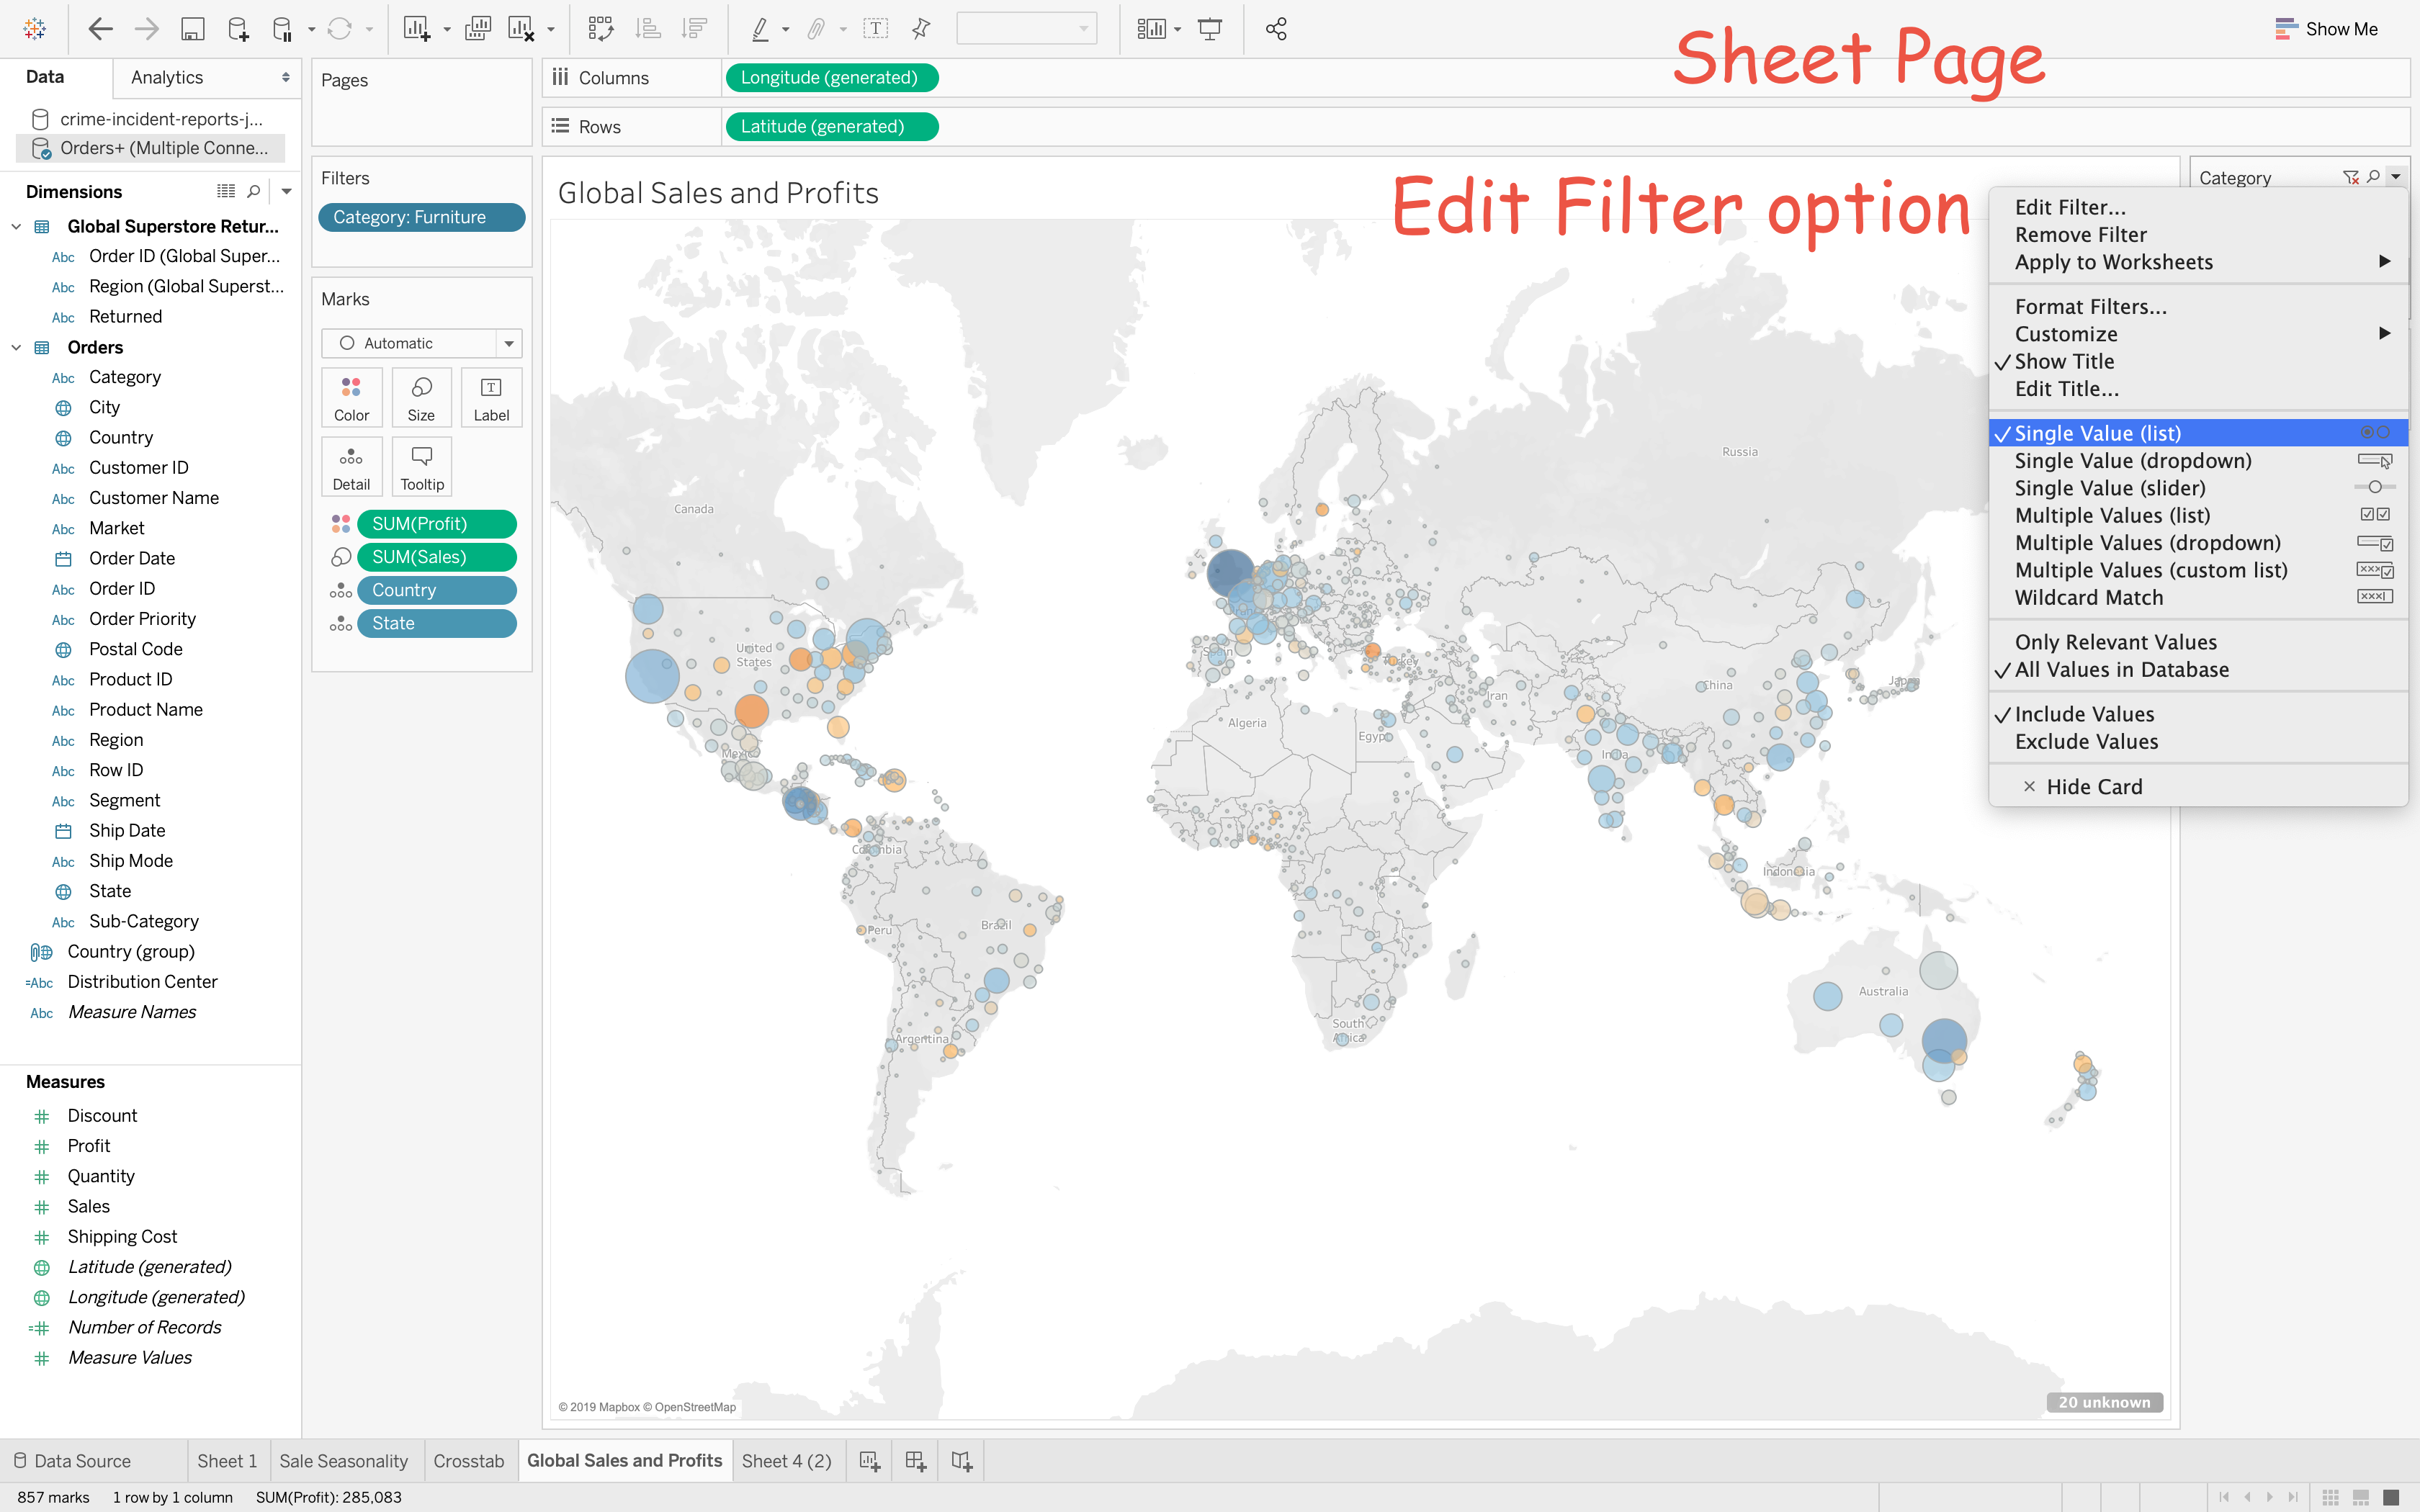
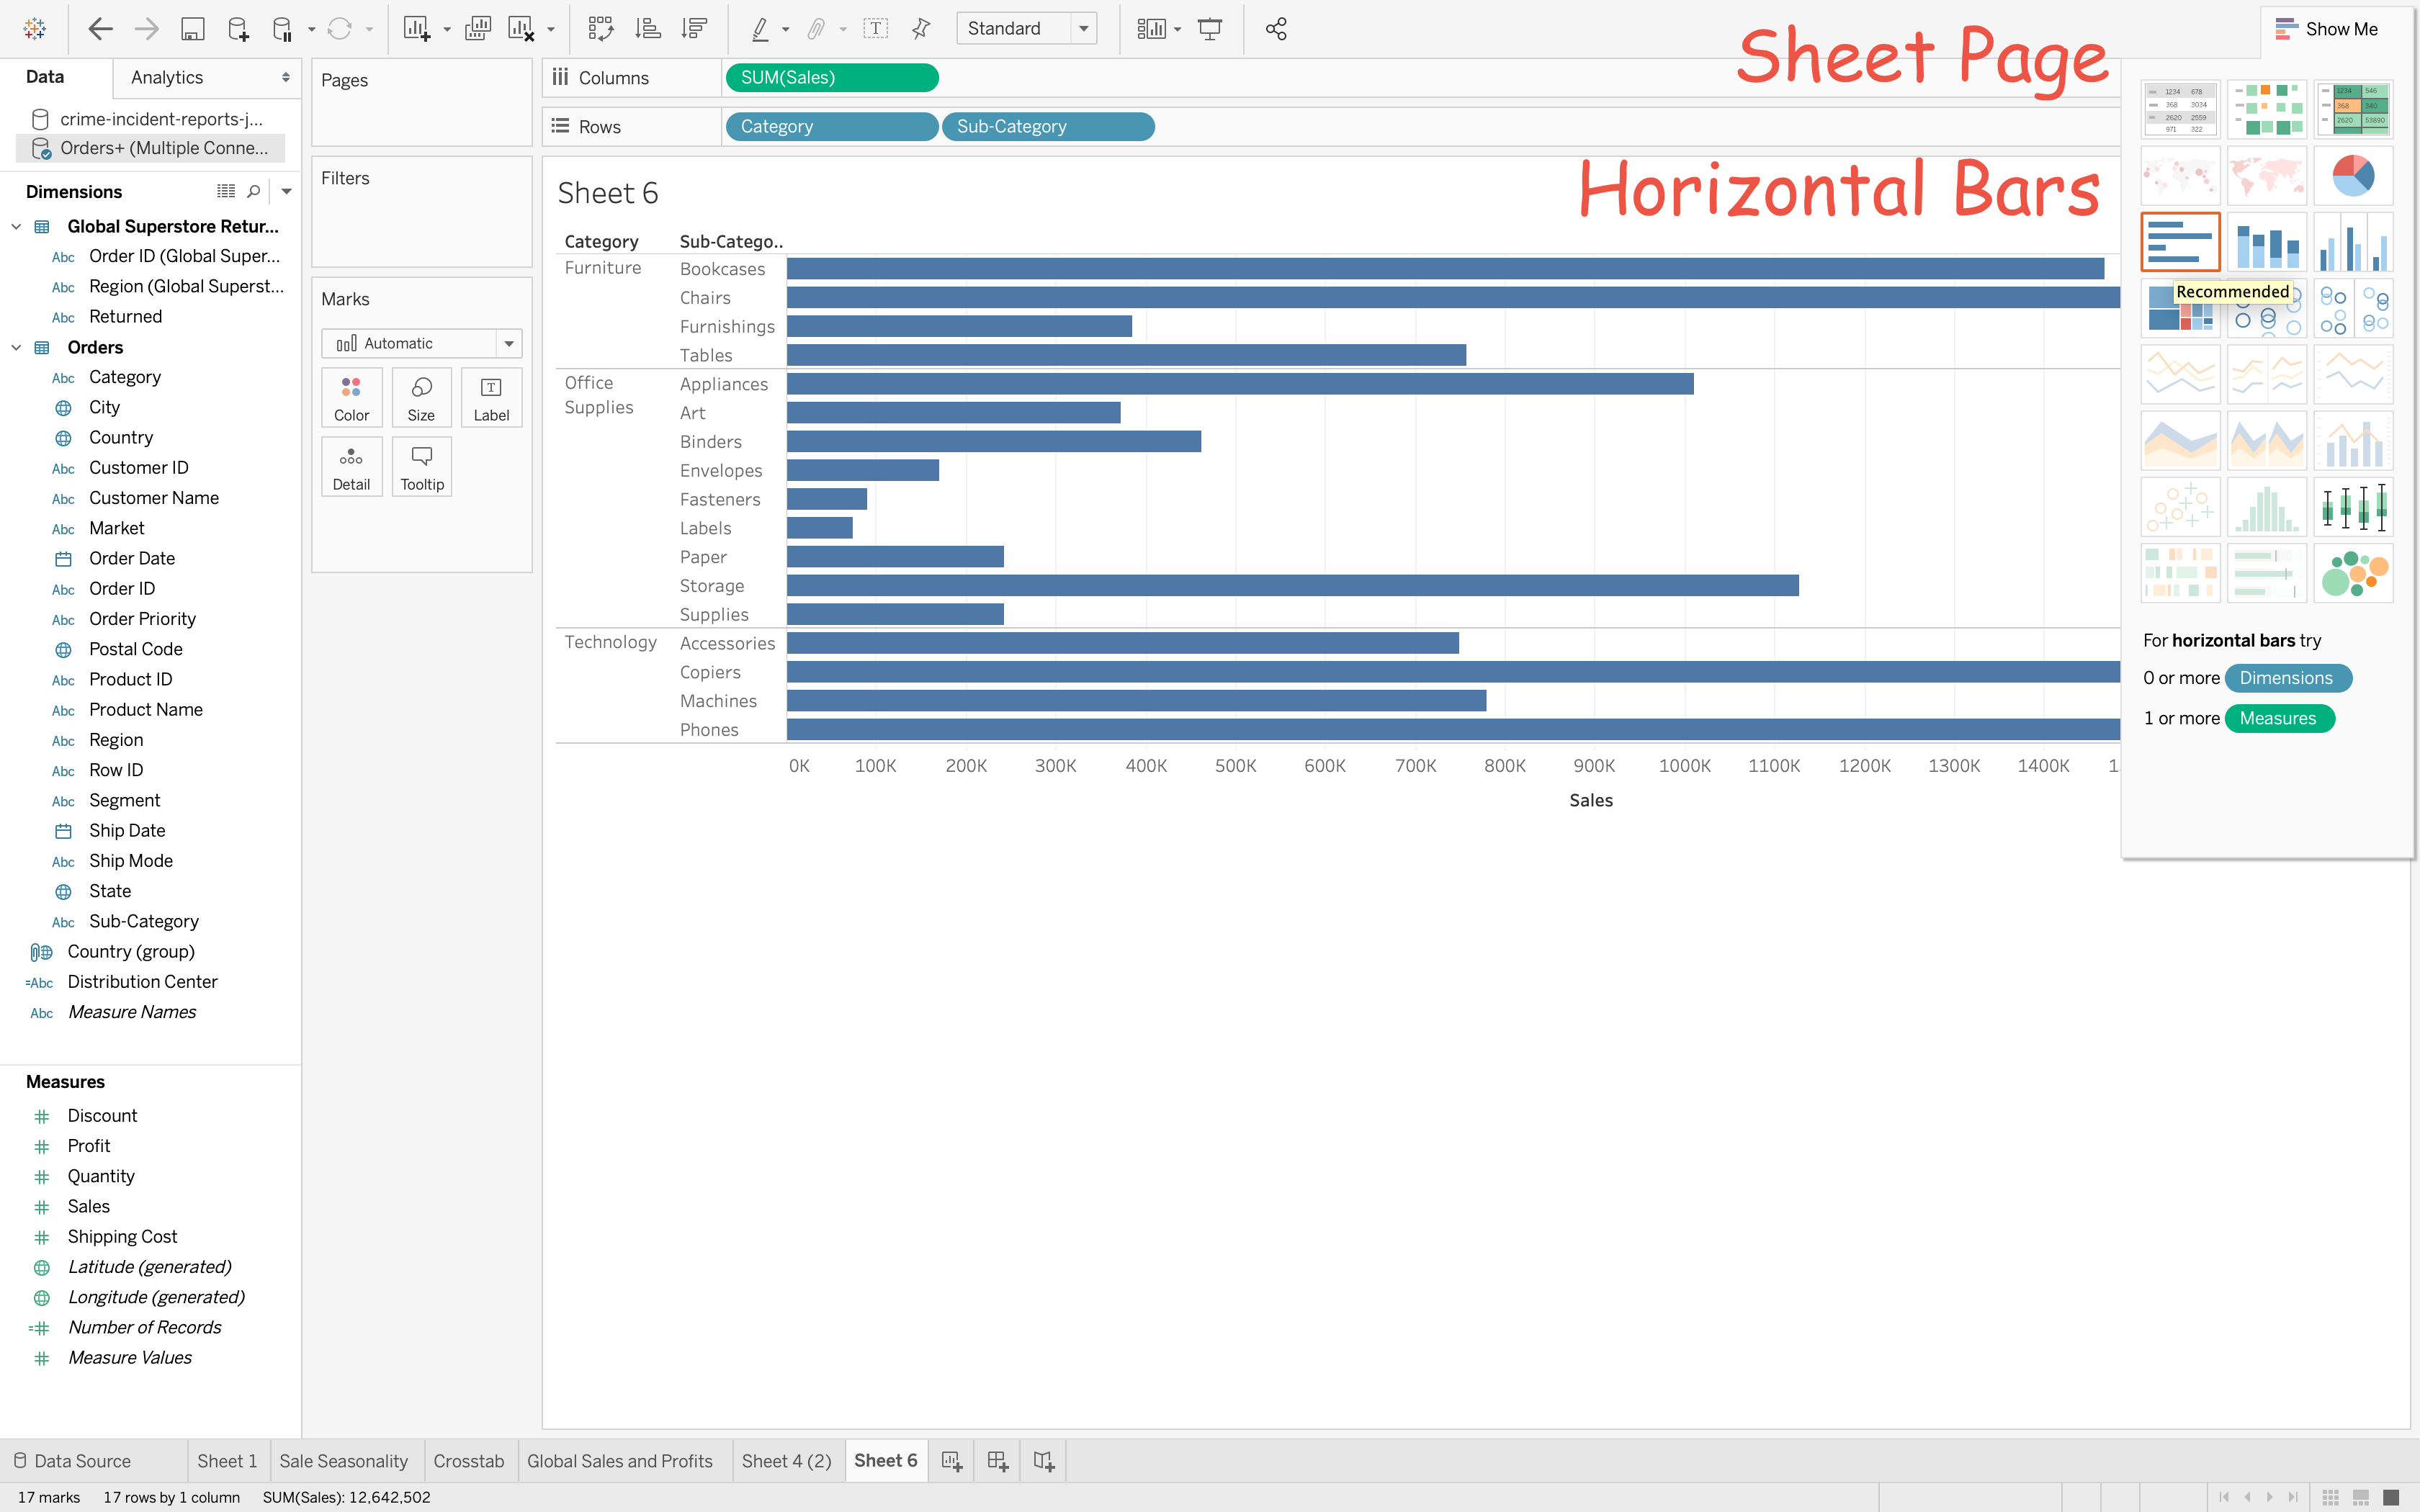
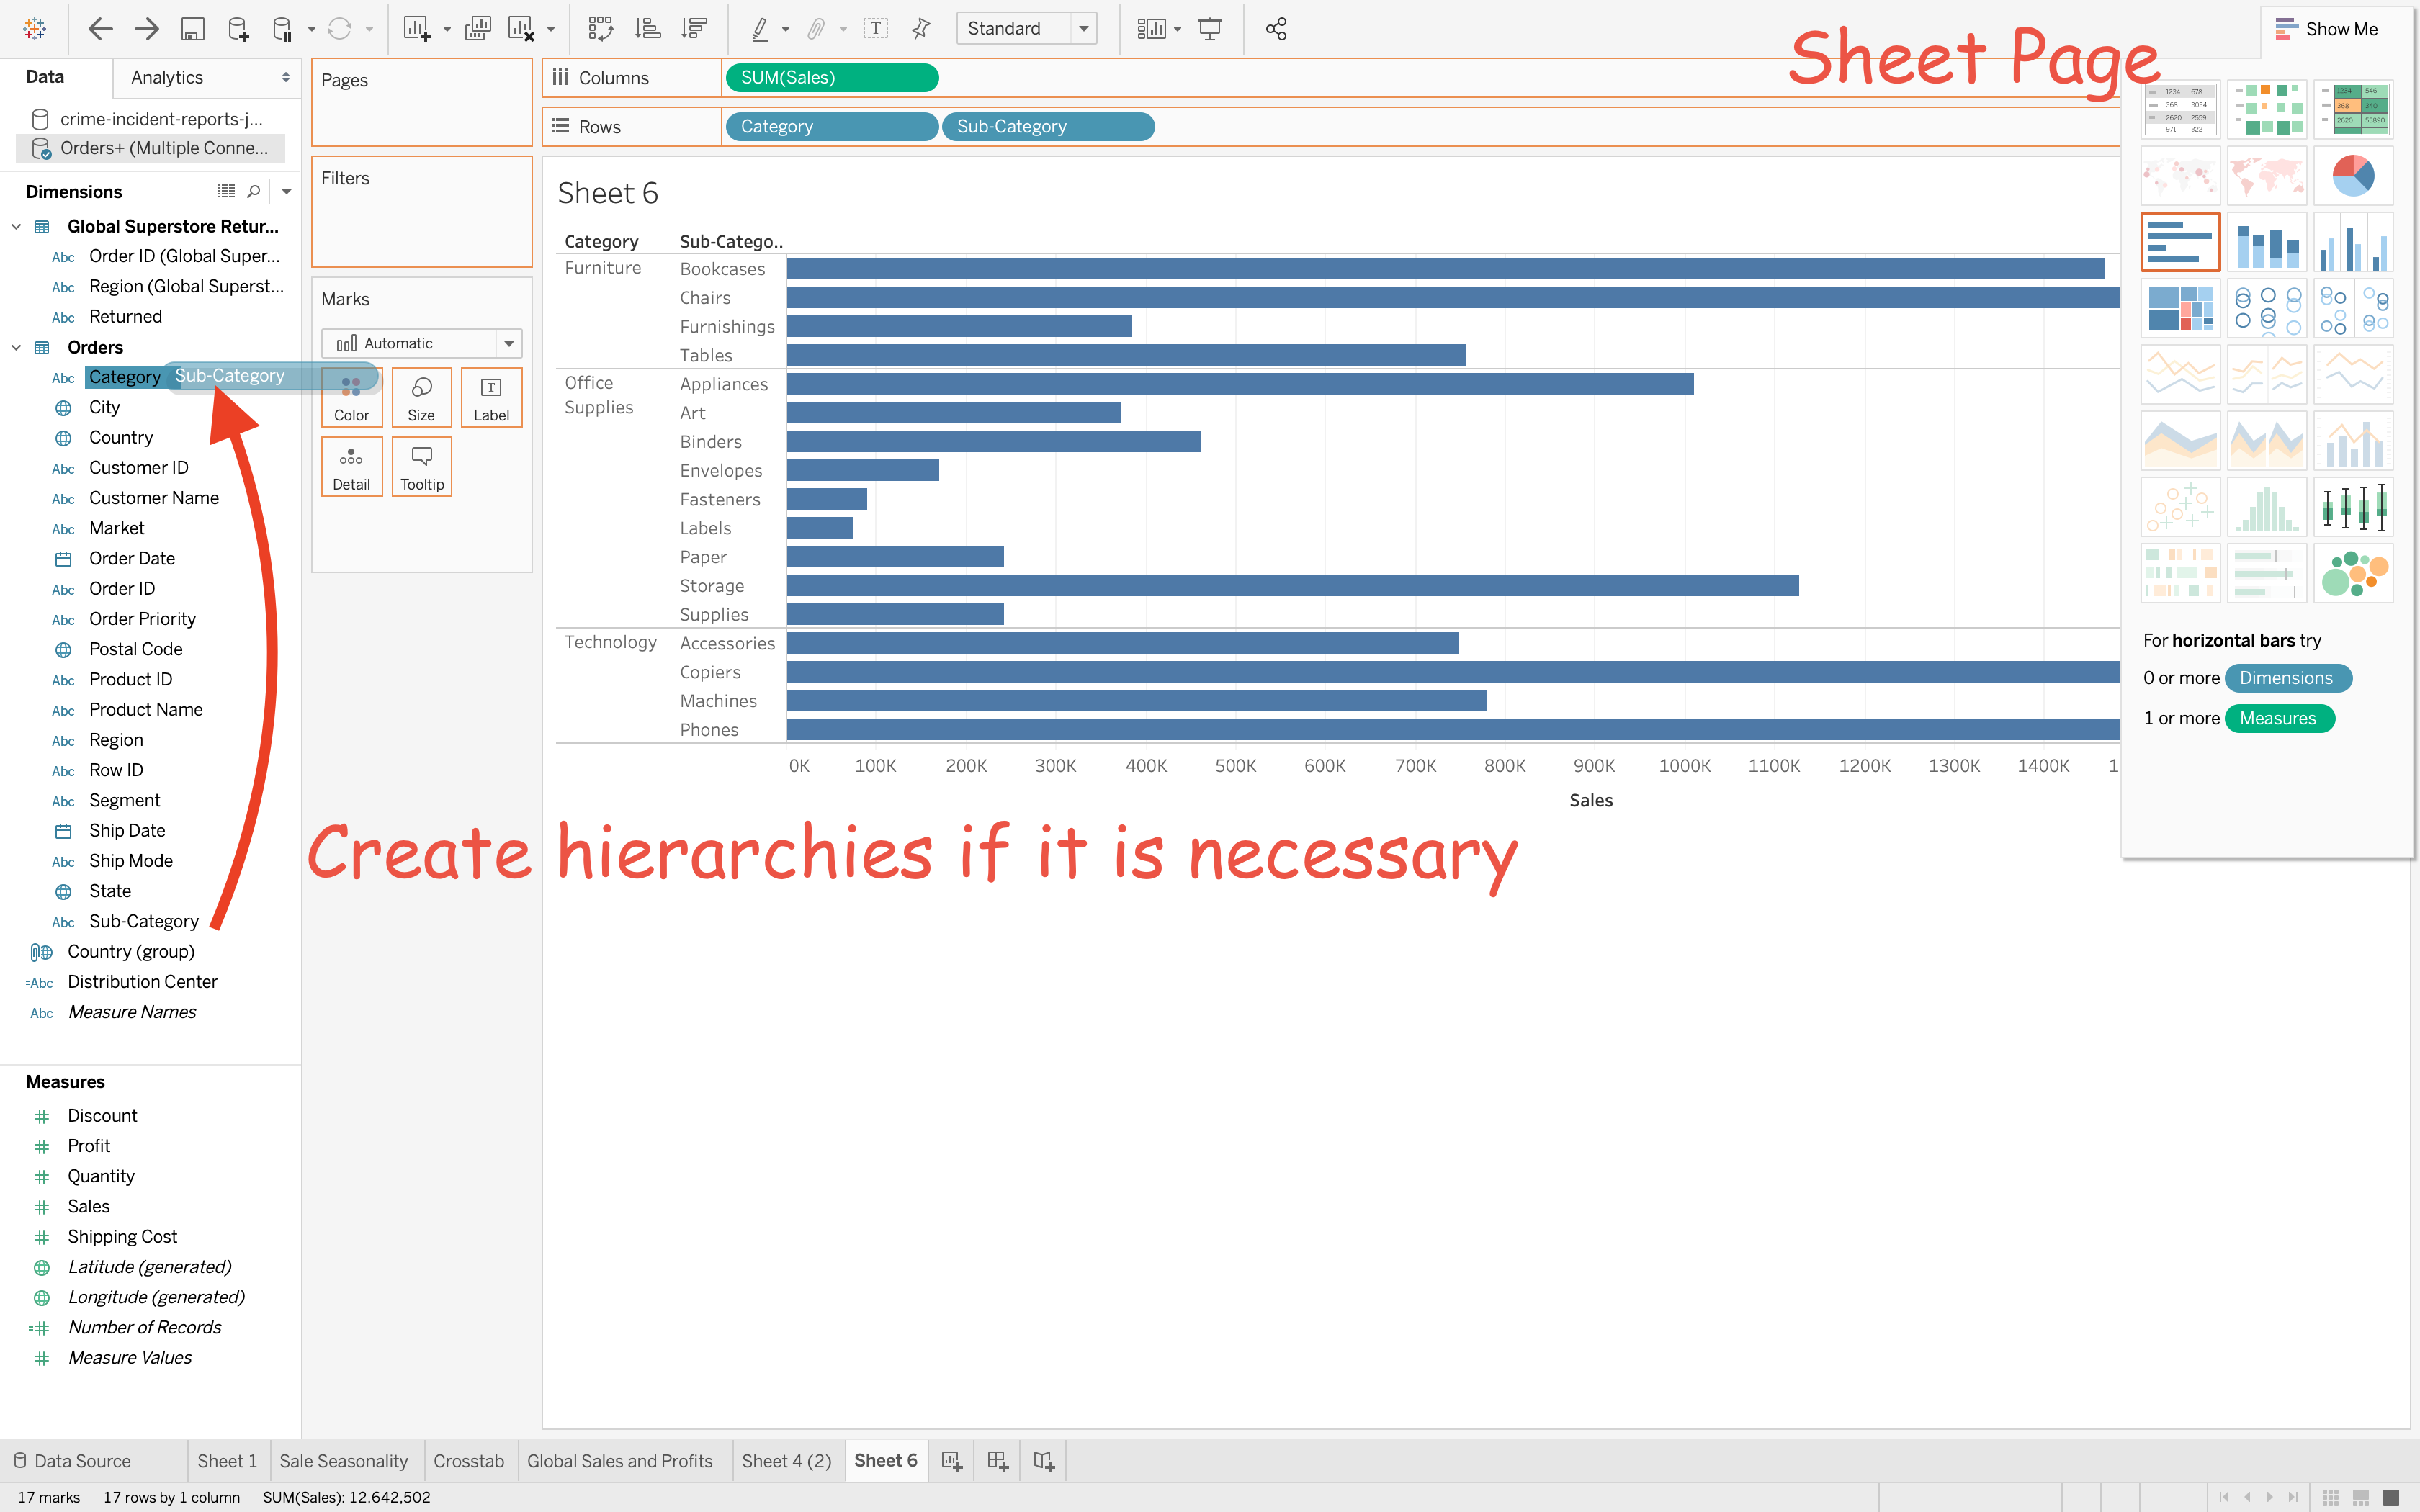
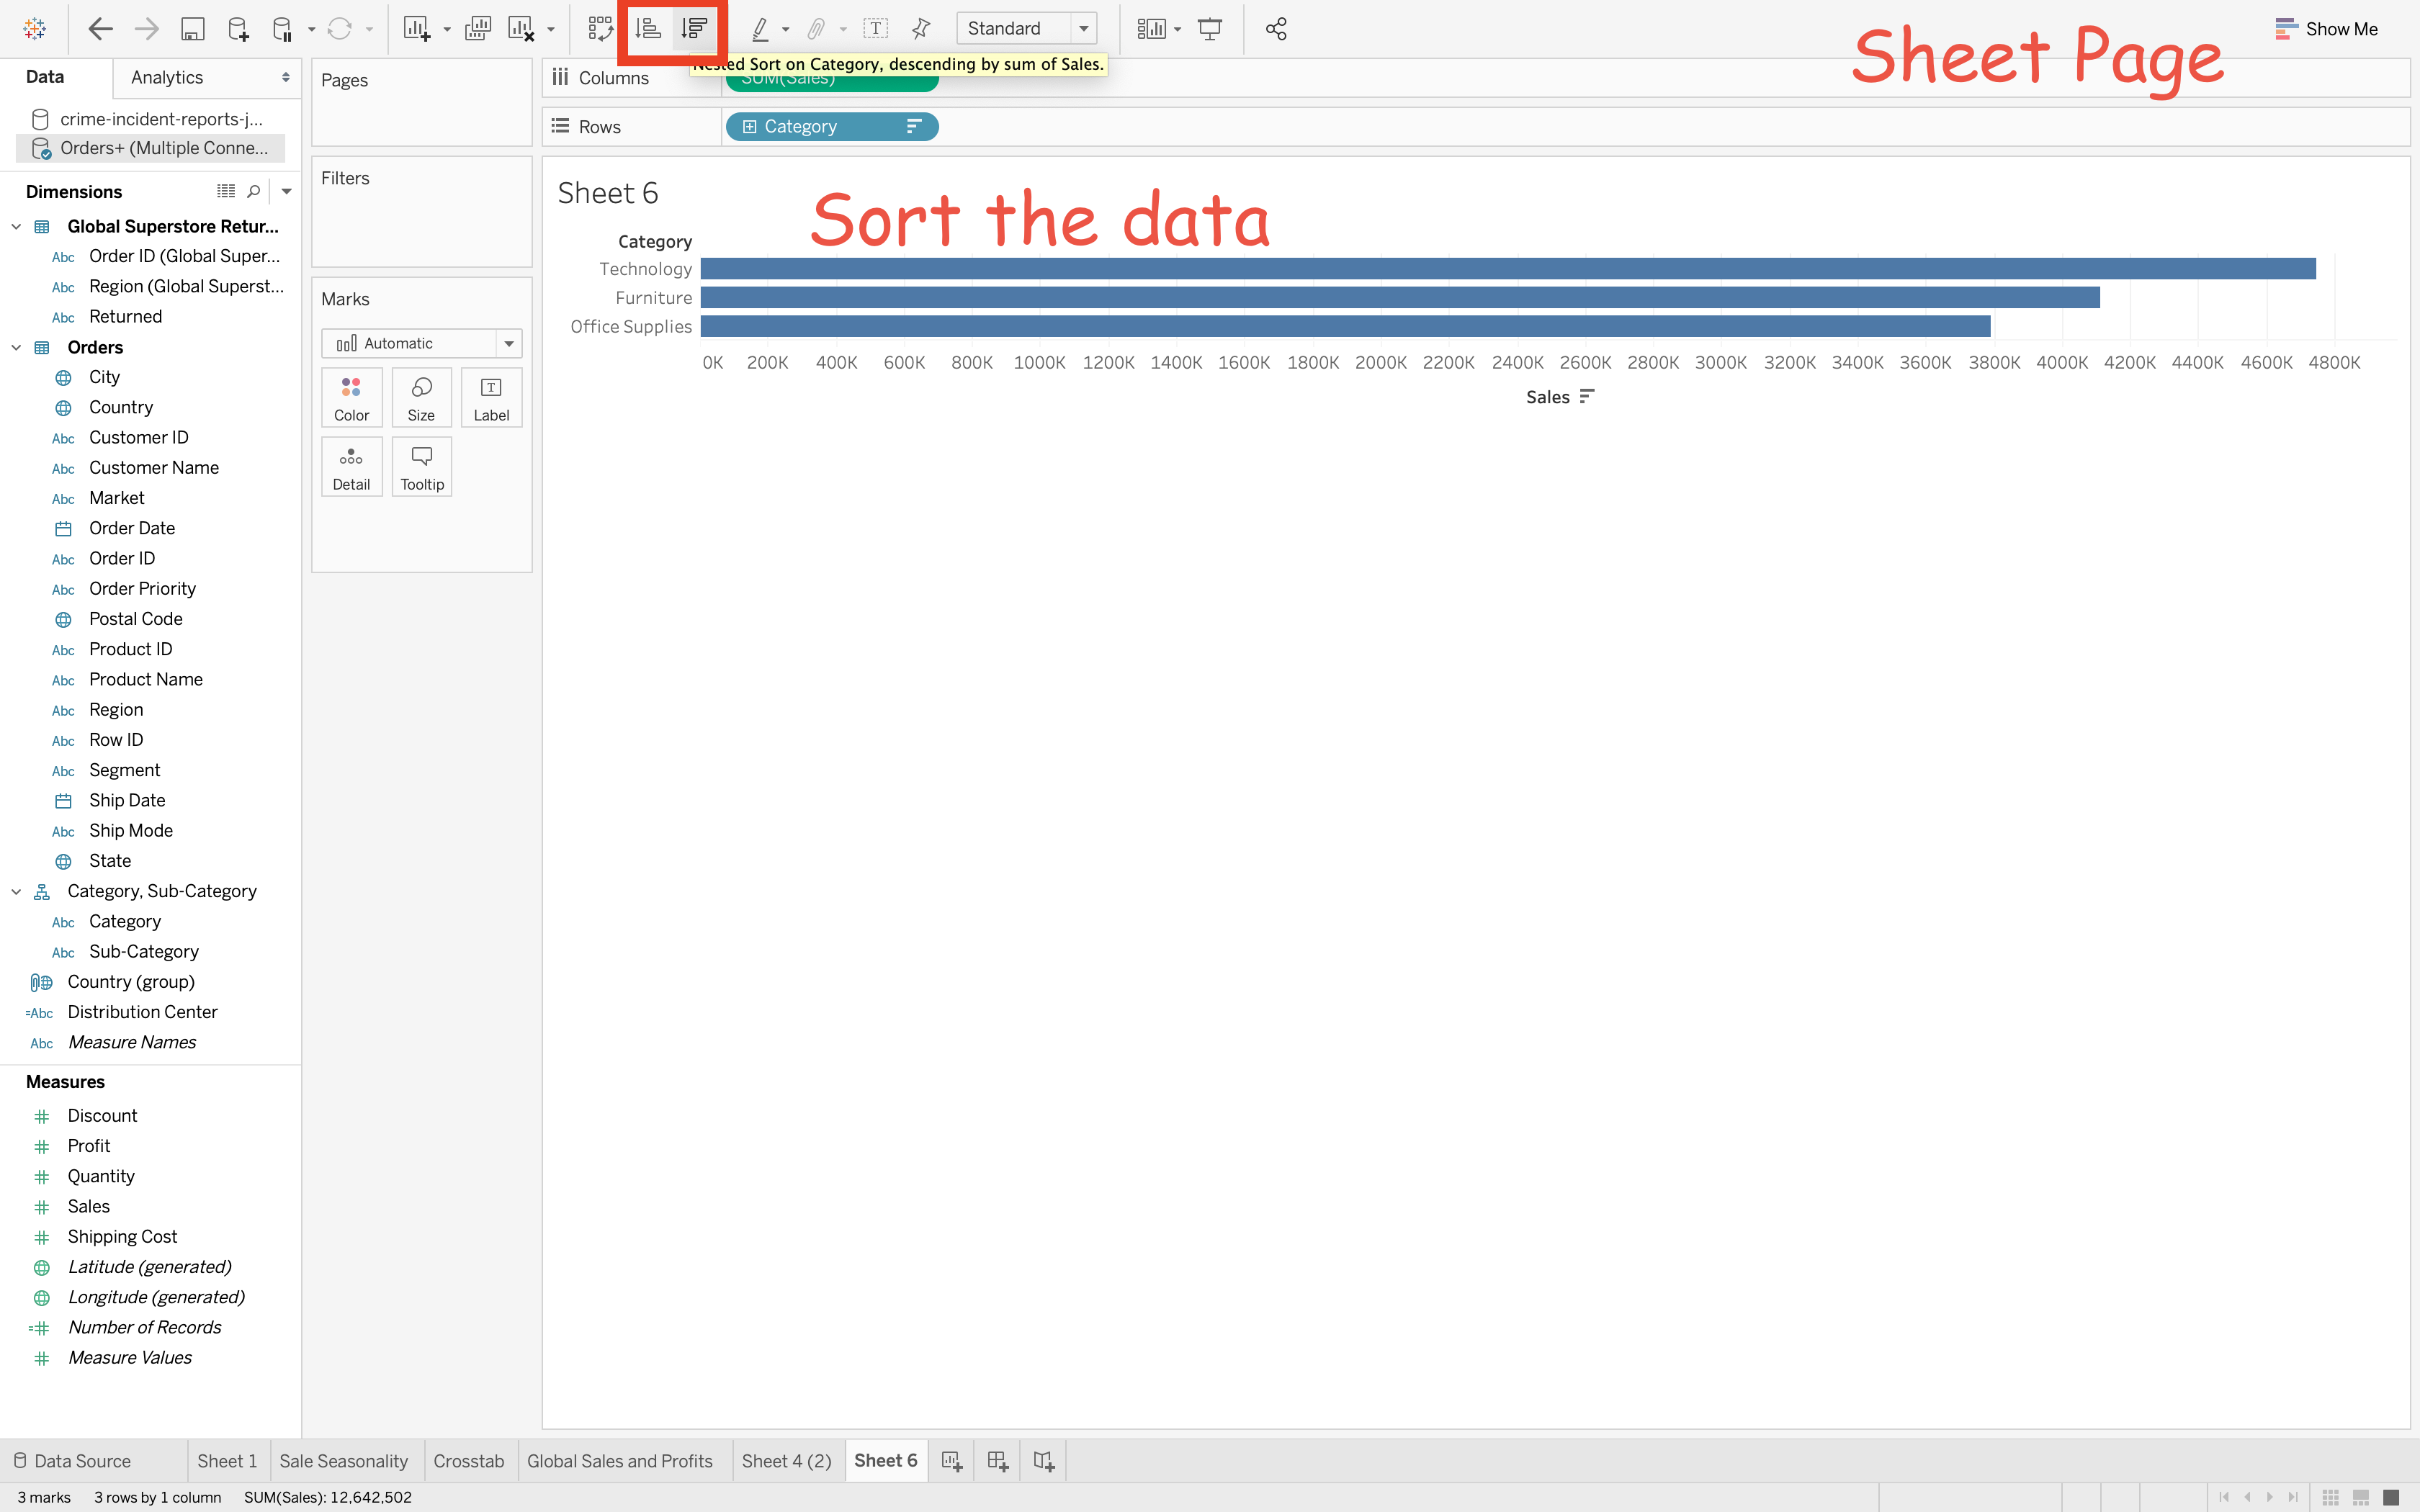
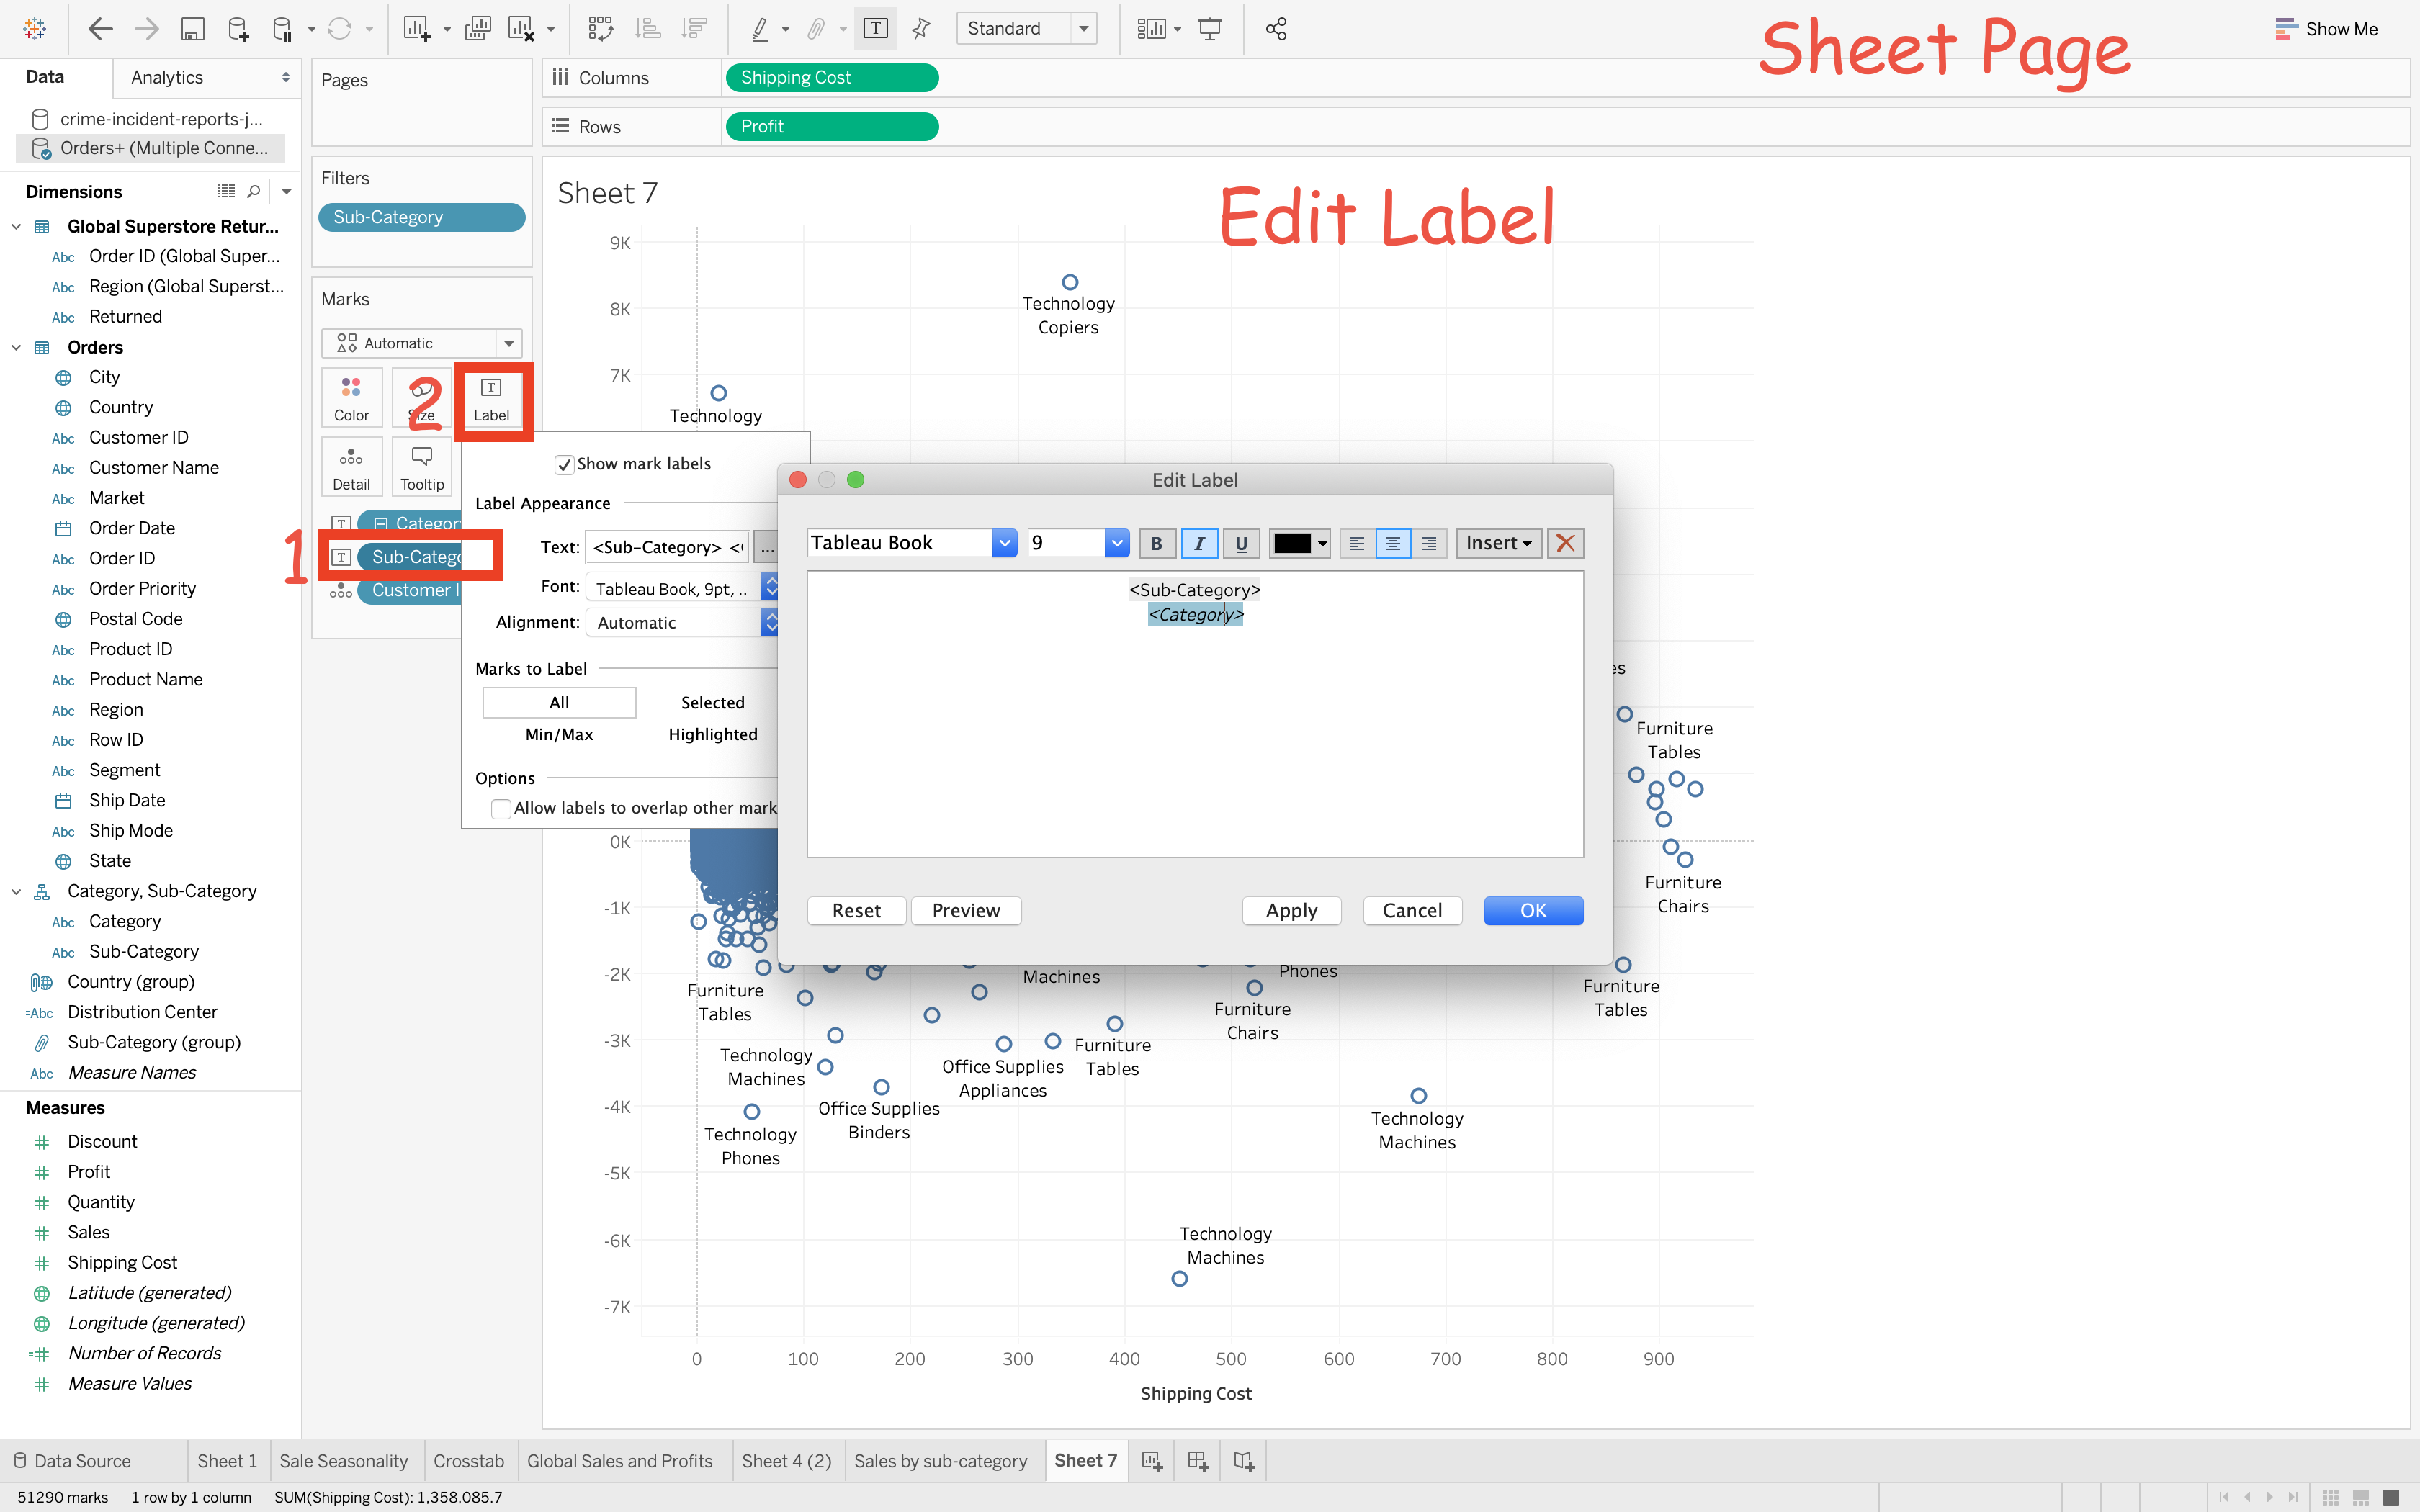
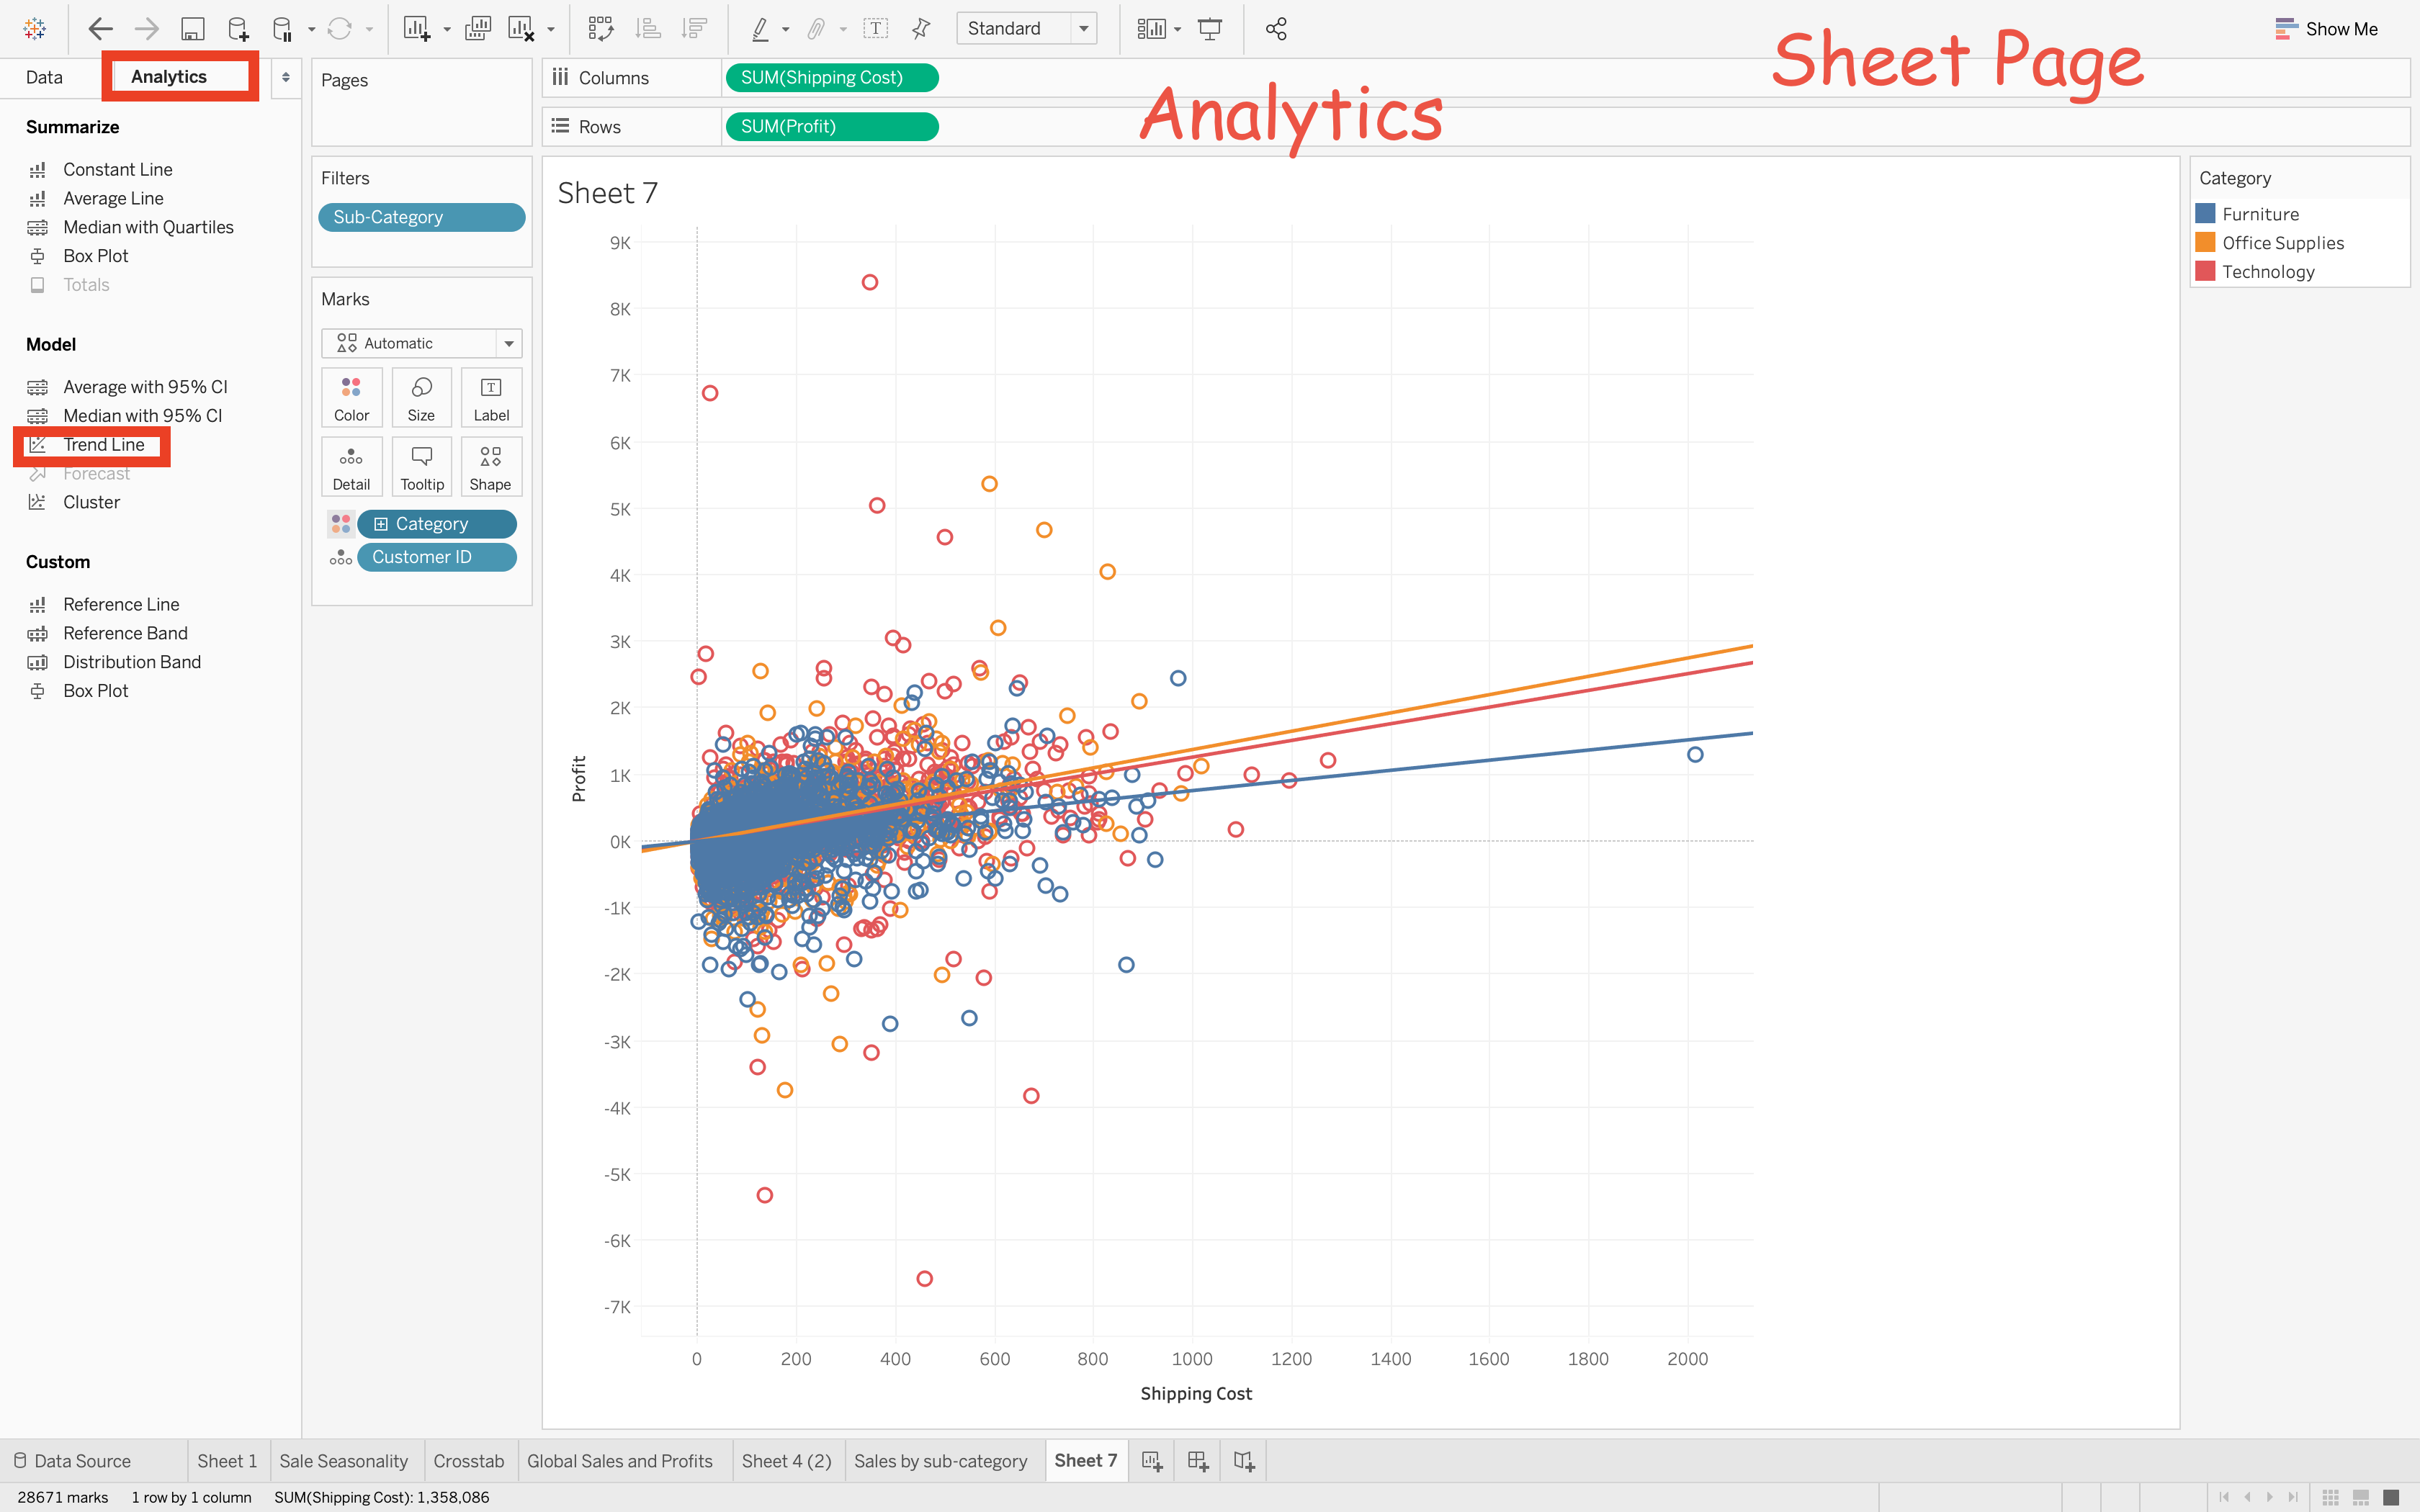
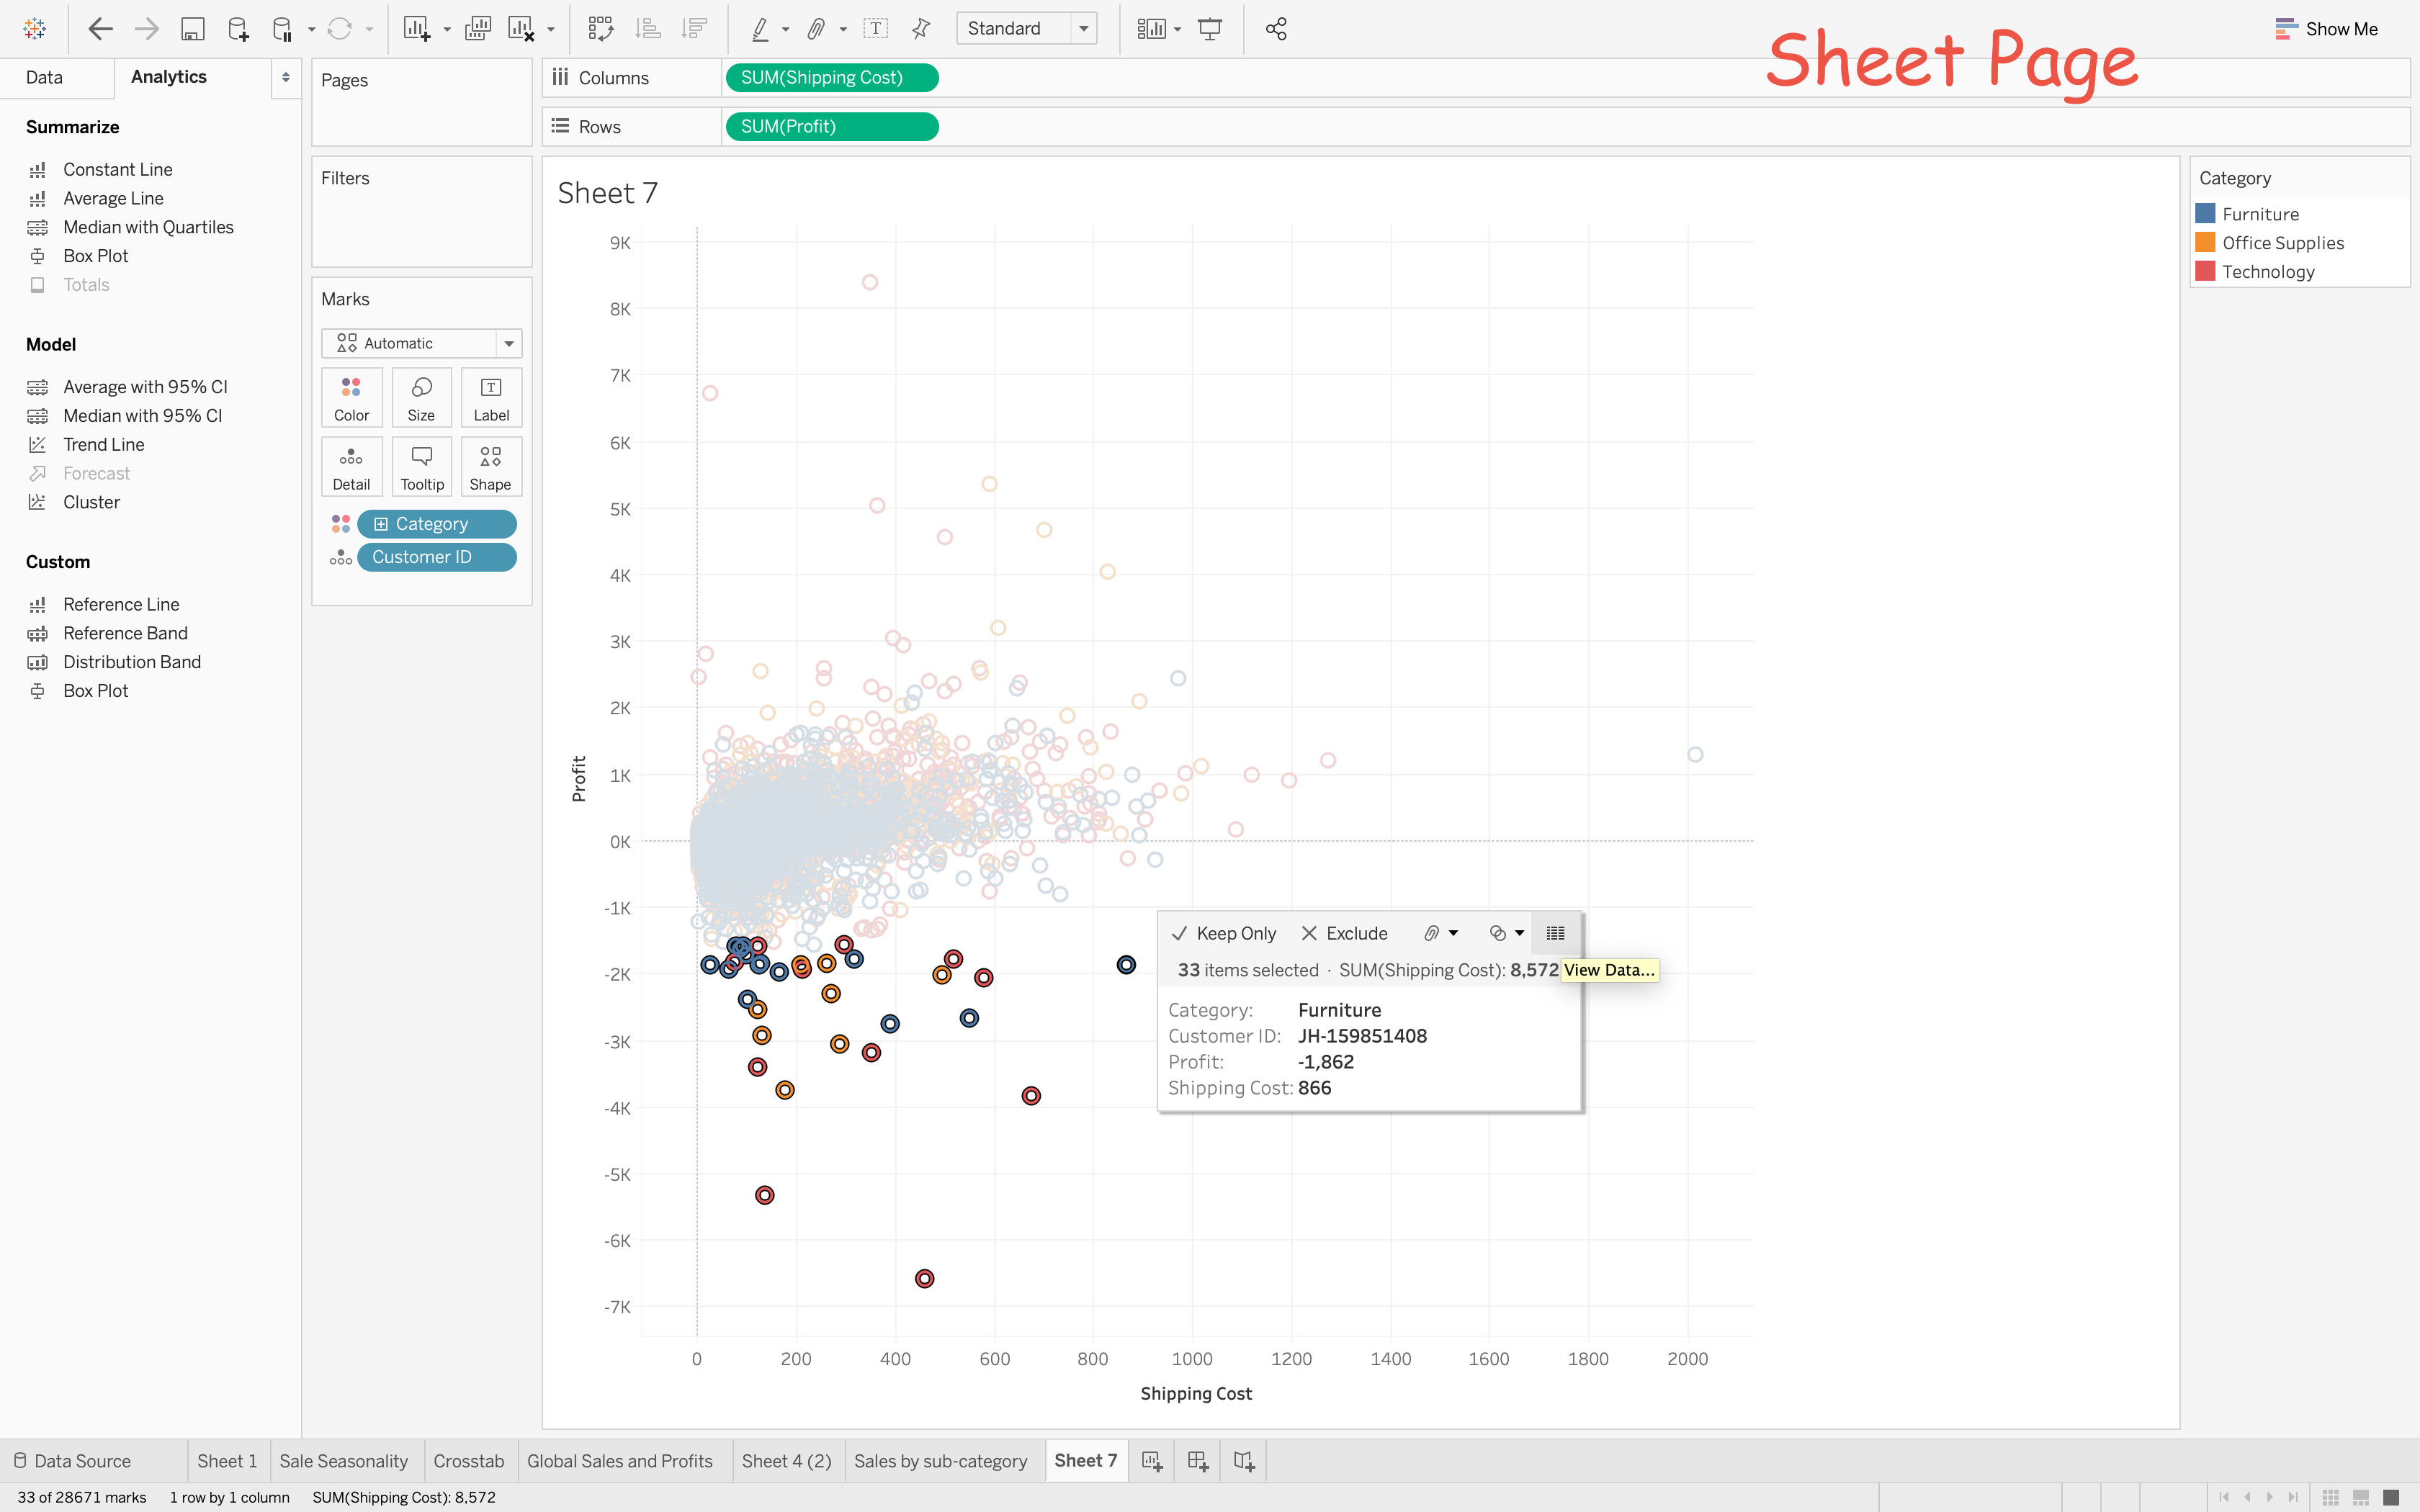
Sheet Page
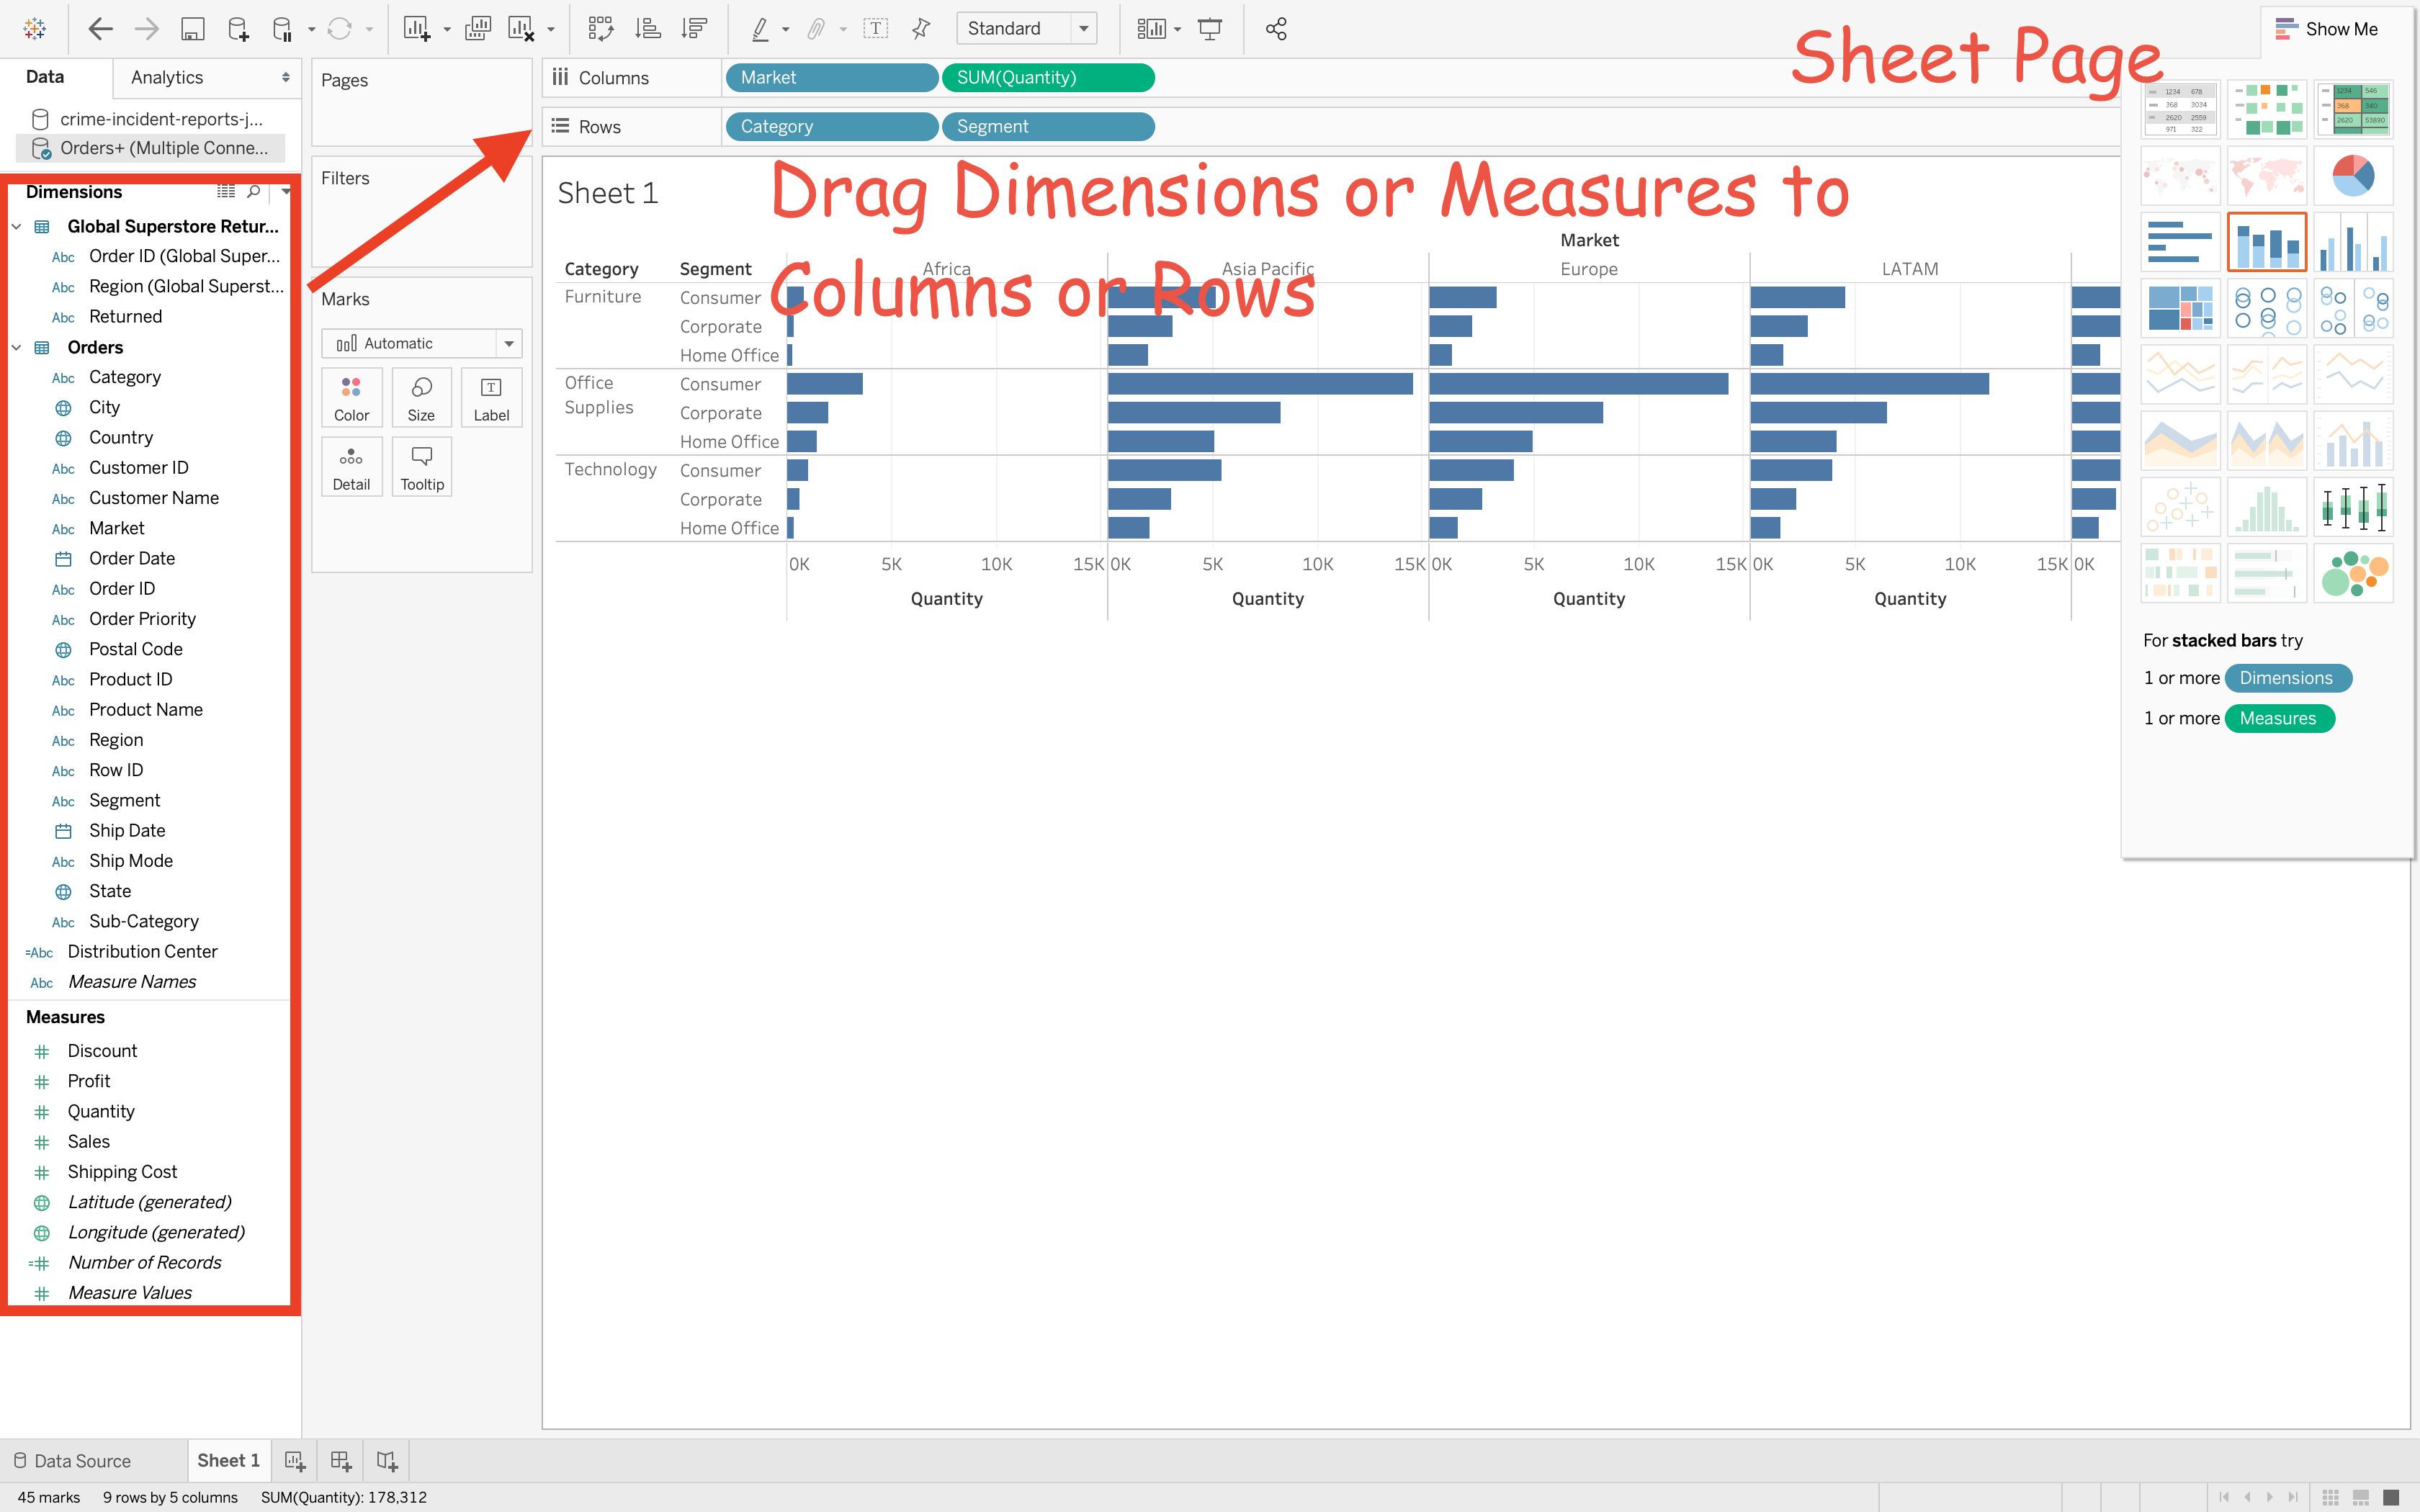
Dimensions are categories fields. These are fields hat we want to slice and dice our numerical data by.
Dimensions are often discrete.
Measures are metrics. They are the numbers we want to analyze.
Measures are often continuous.
Continuous fields create axes in the chart and their pills are color coded green.
Symbol Maps
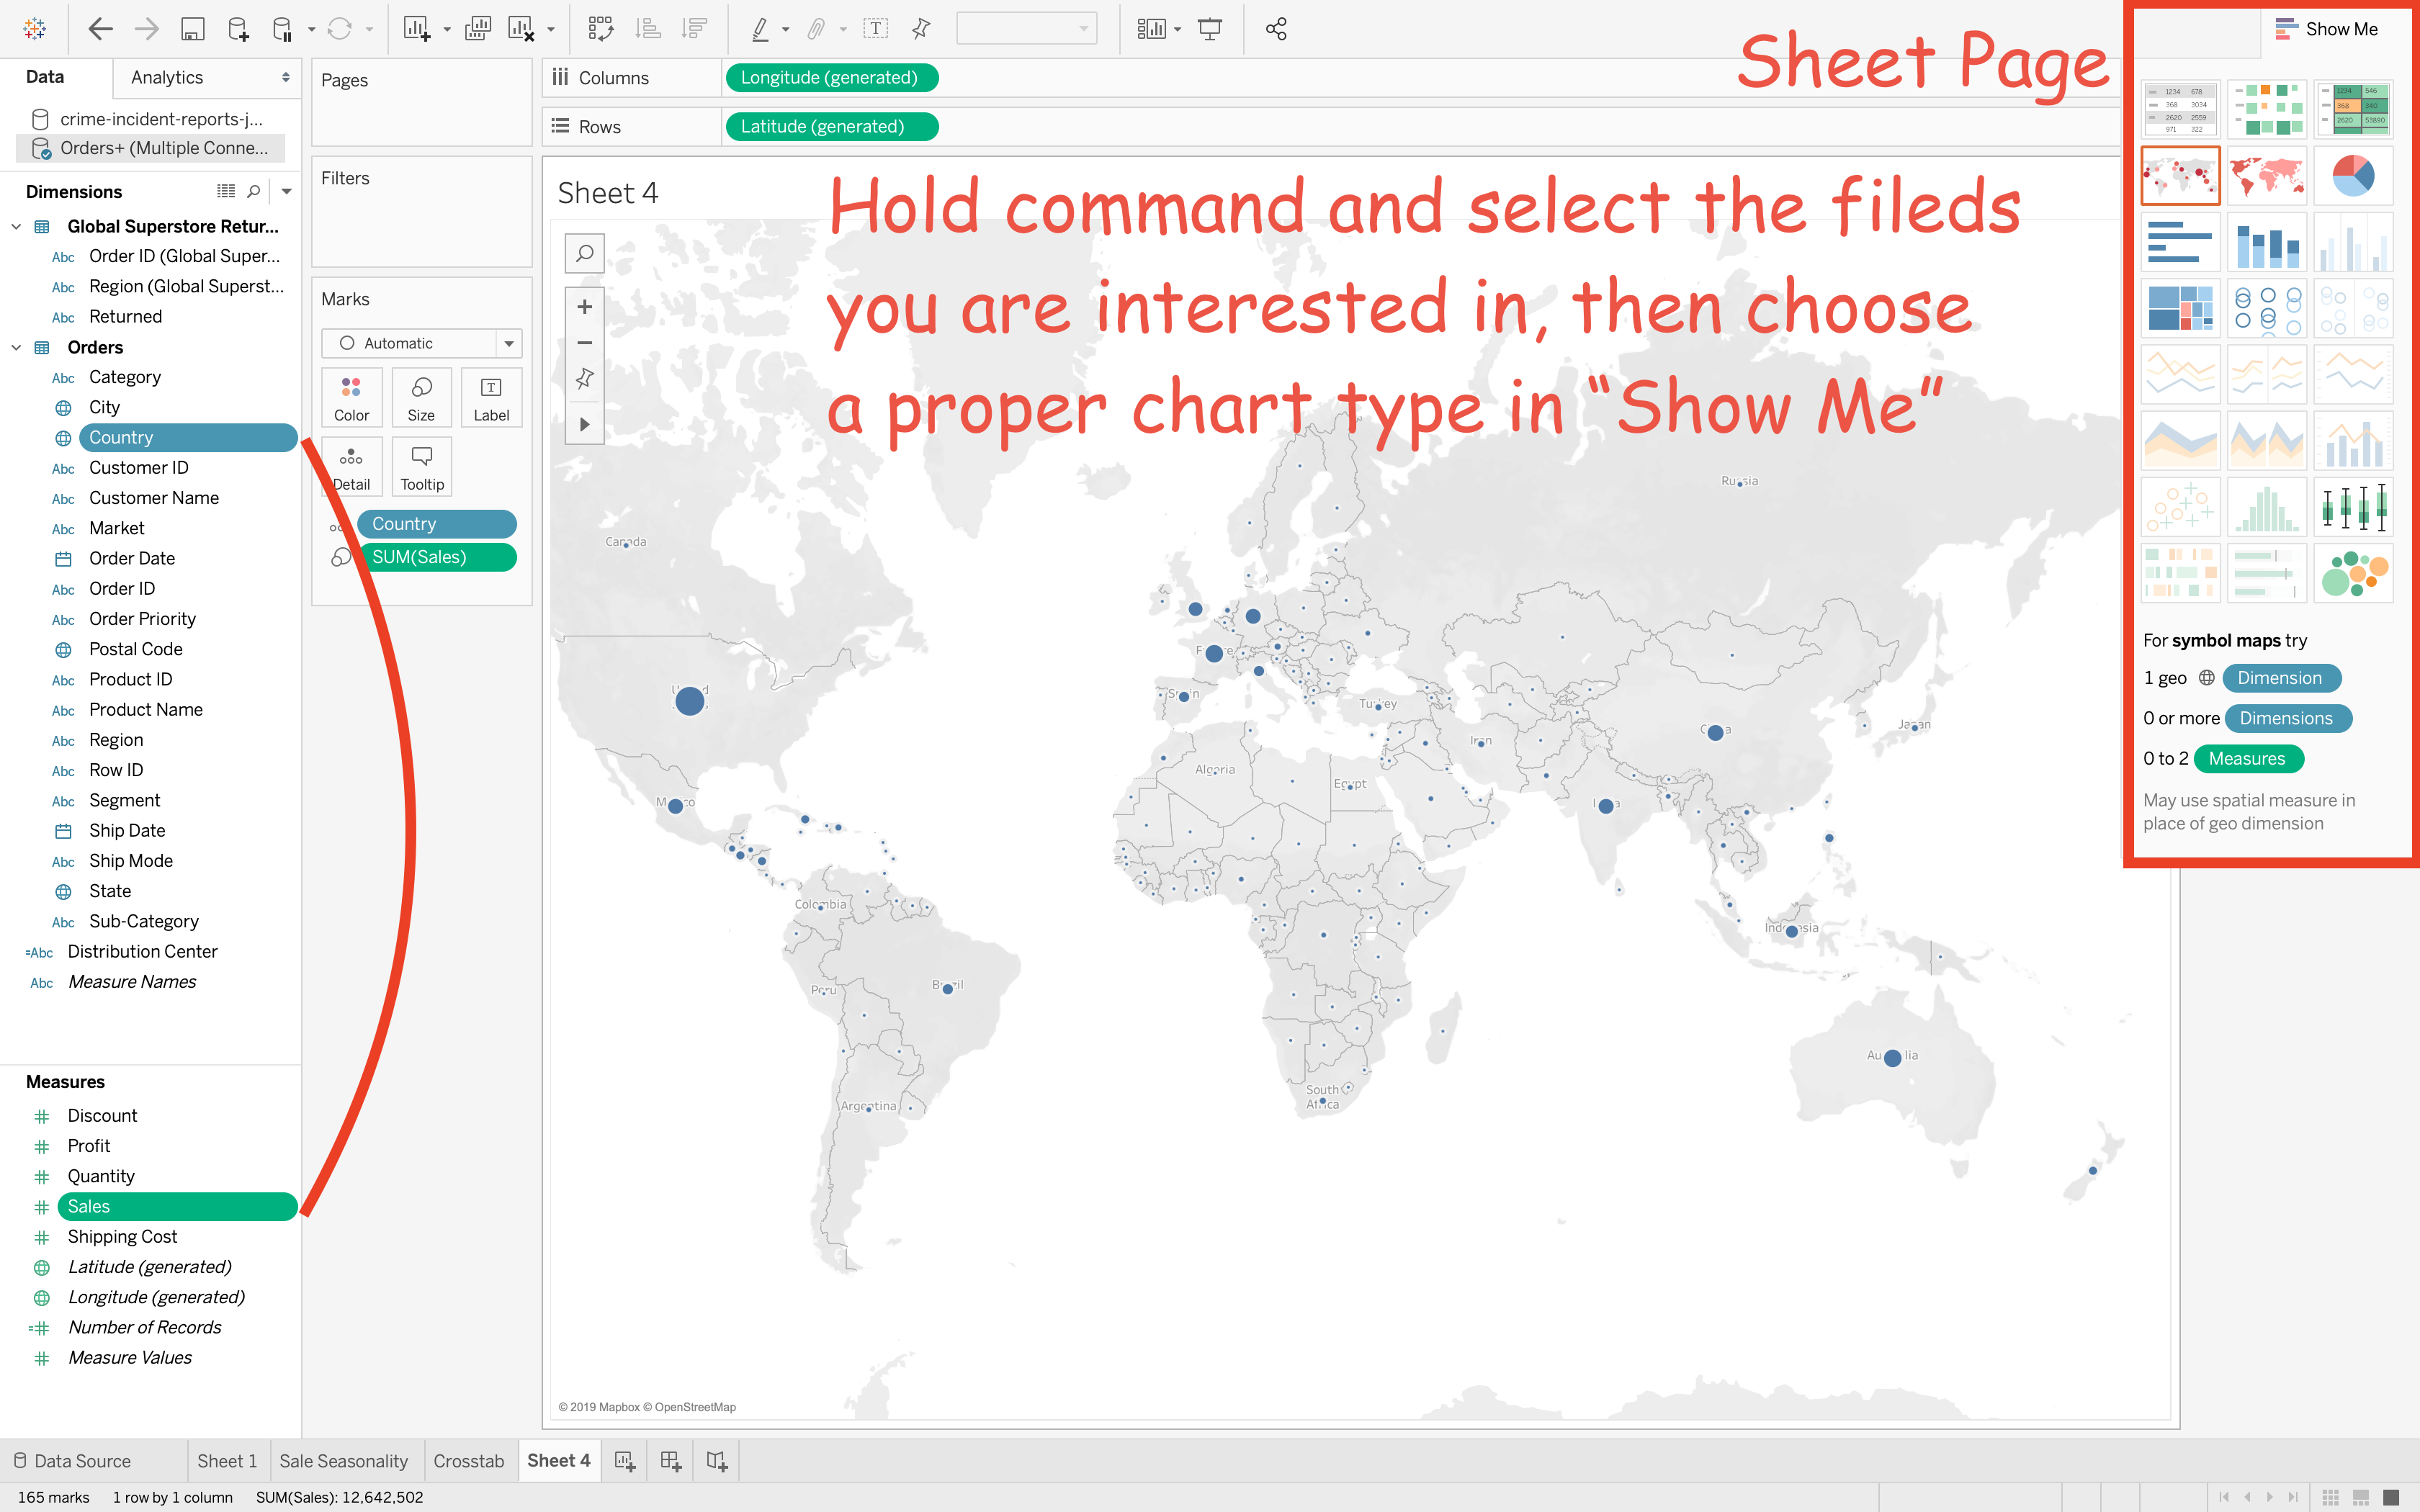
Show me is a simple tool to help us create an effective view when we do know the data we want to look at but do not know how to create it.
Horizontal Bars
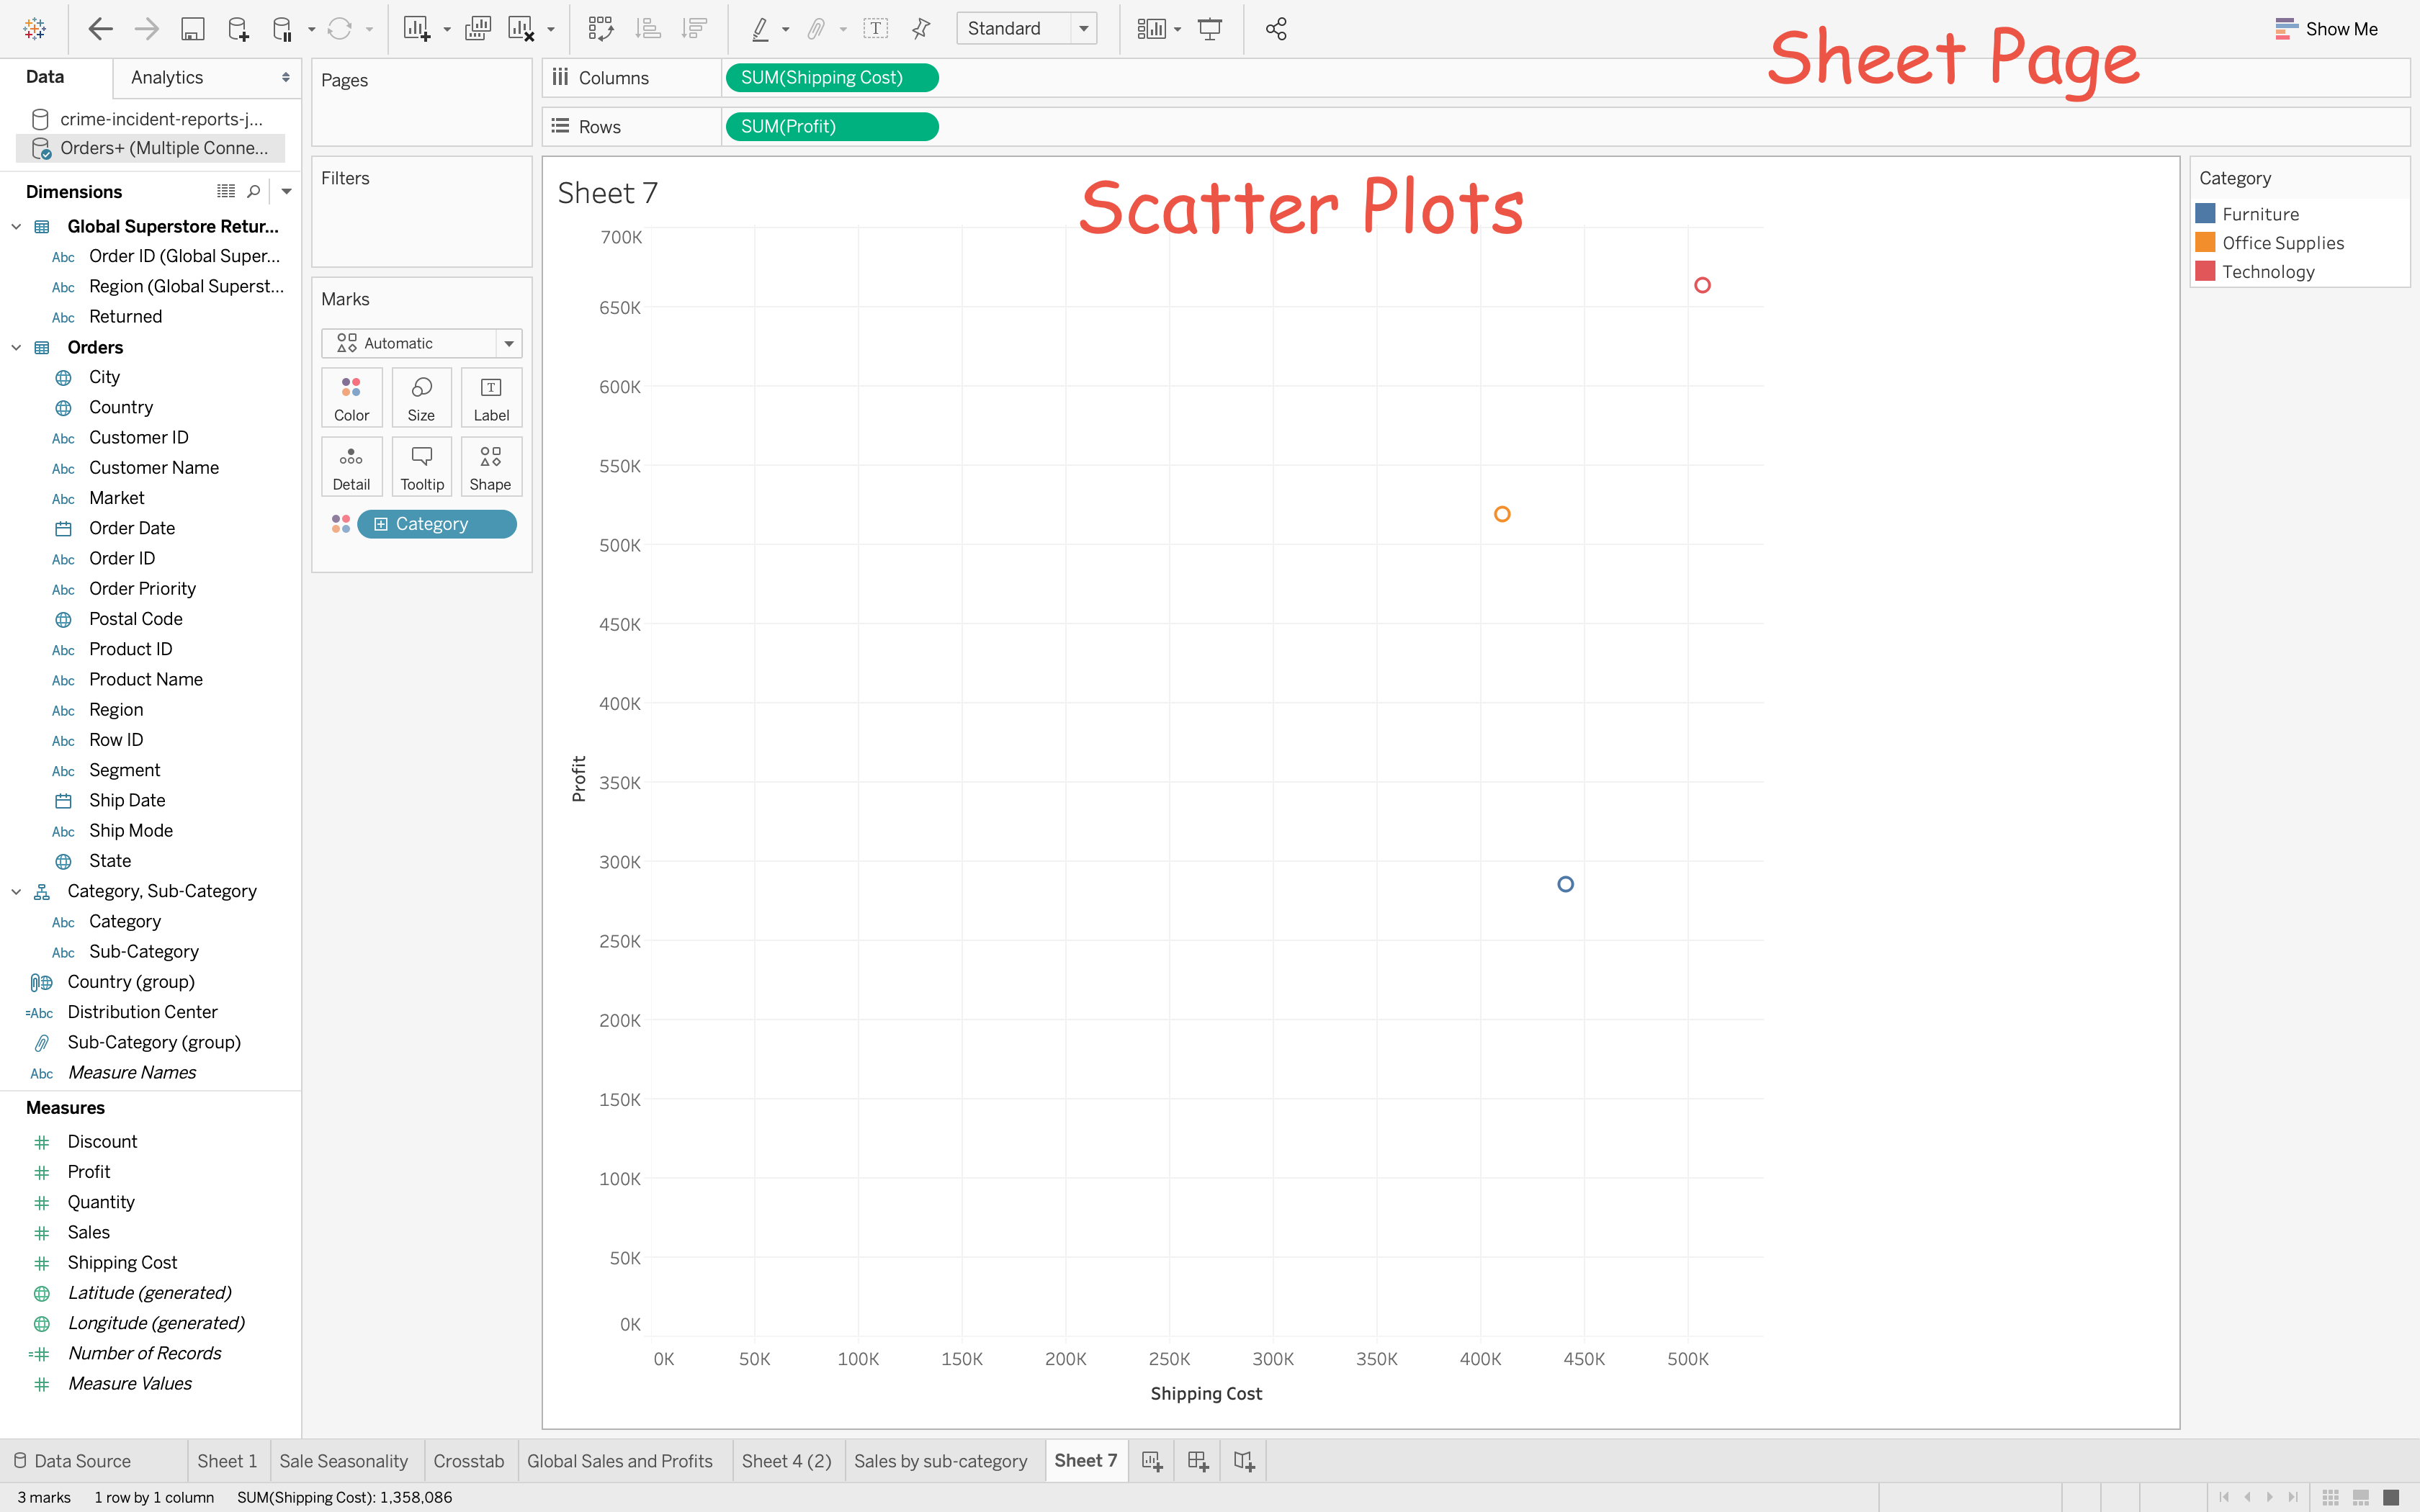
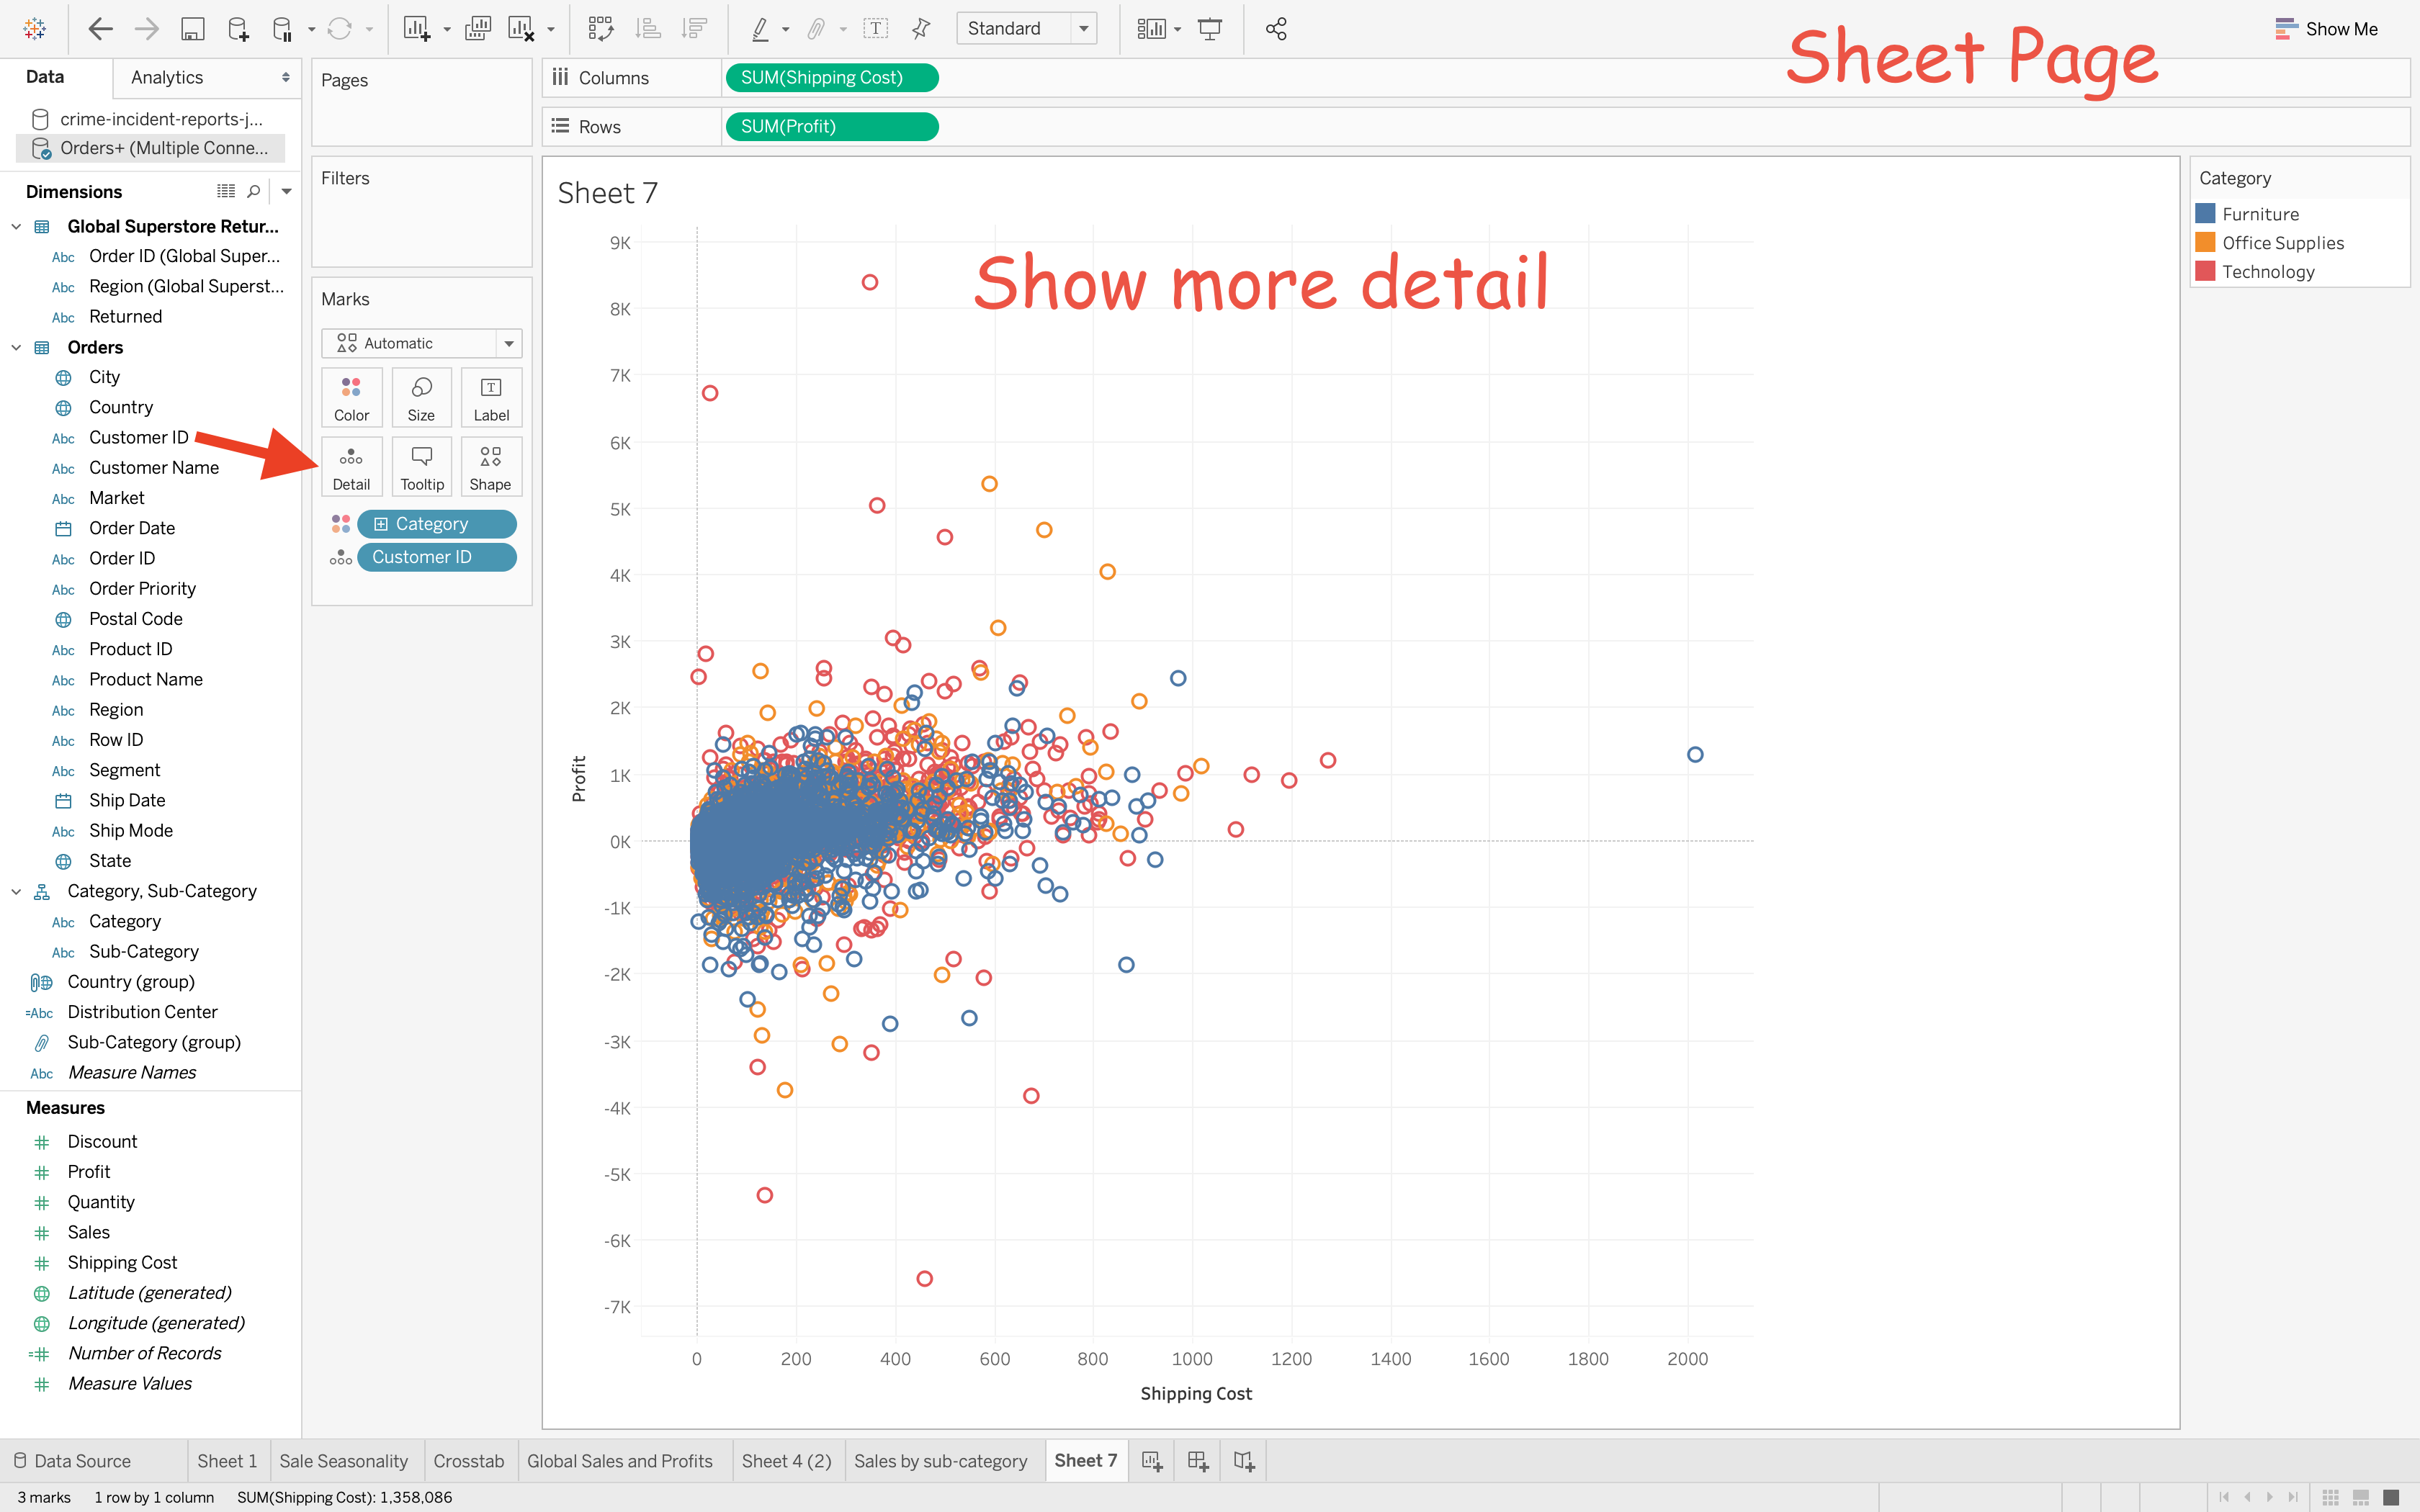
Scatter Plots
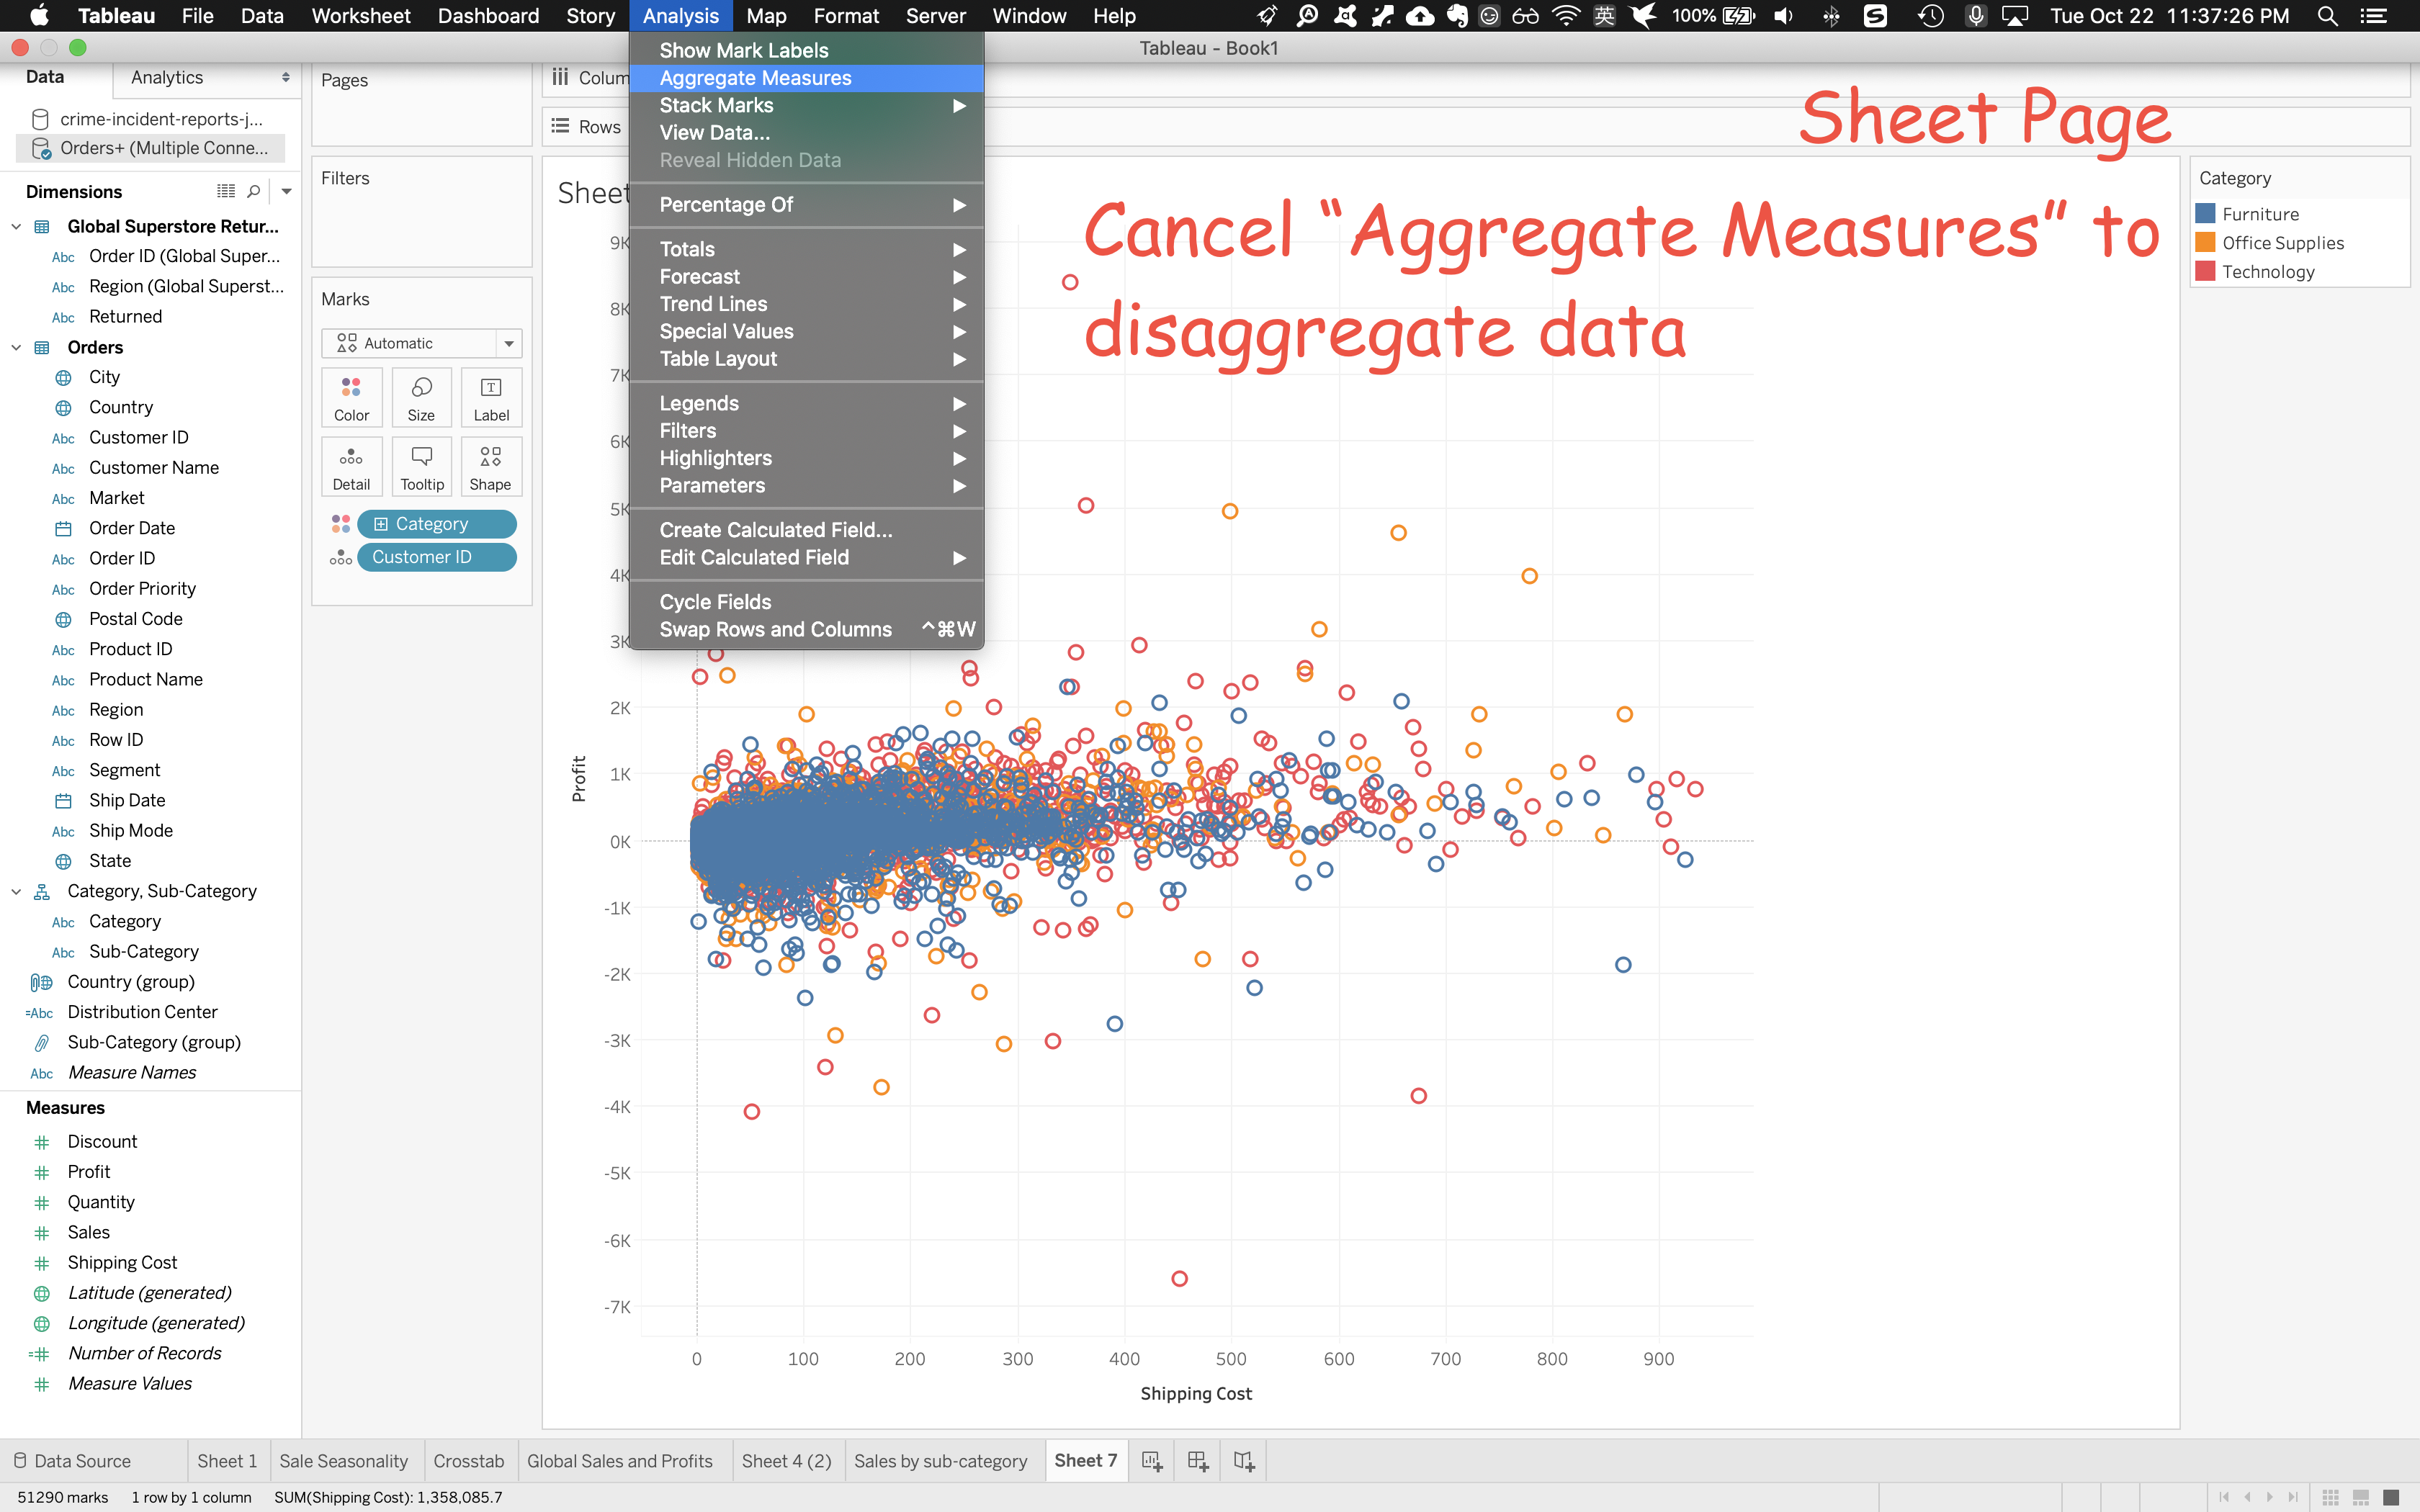
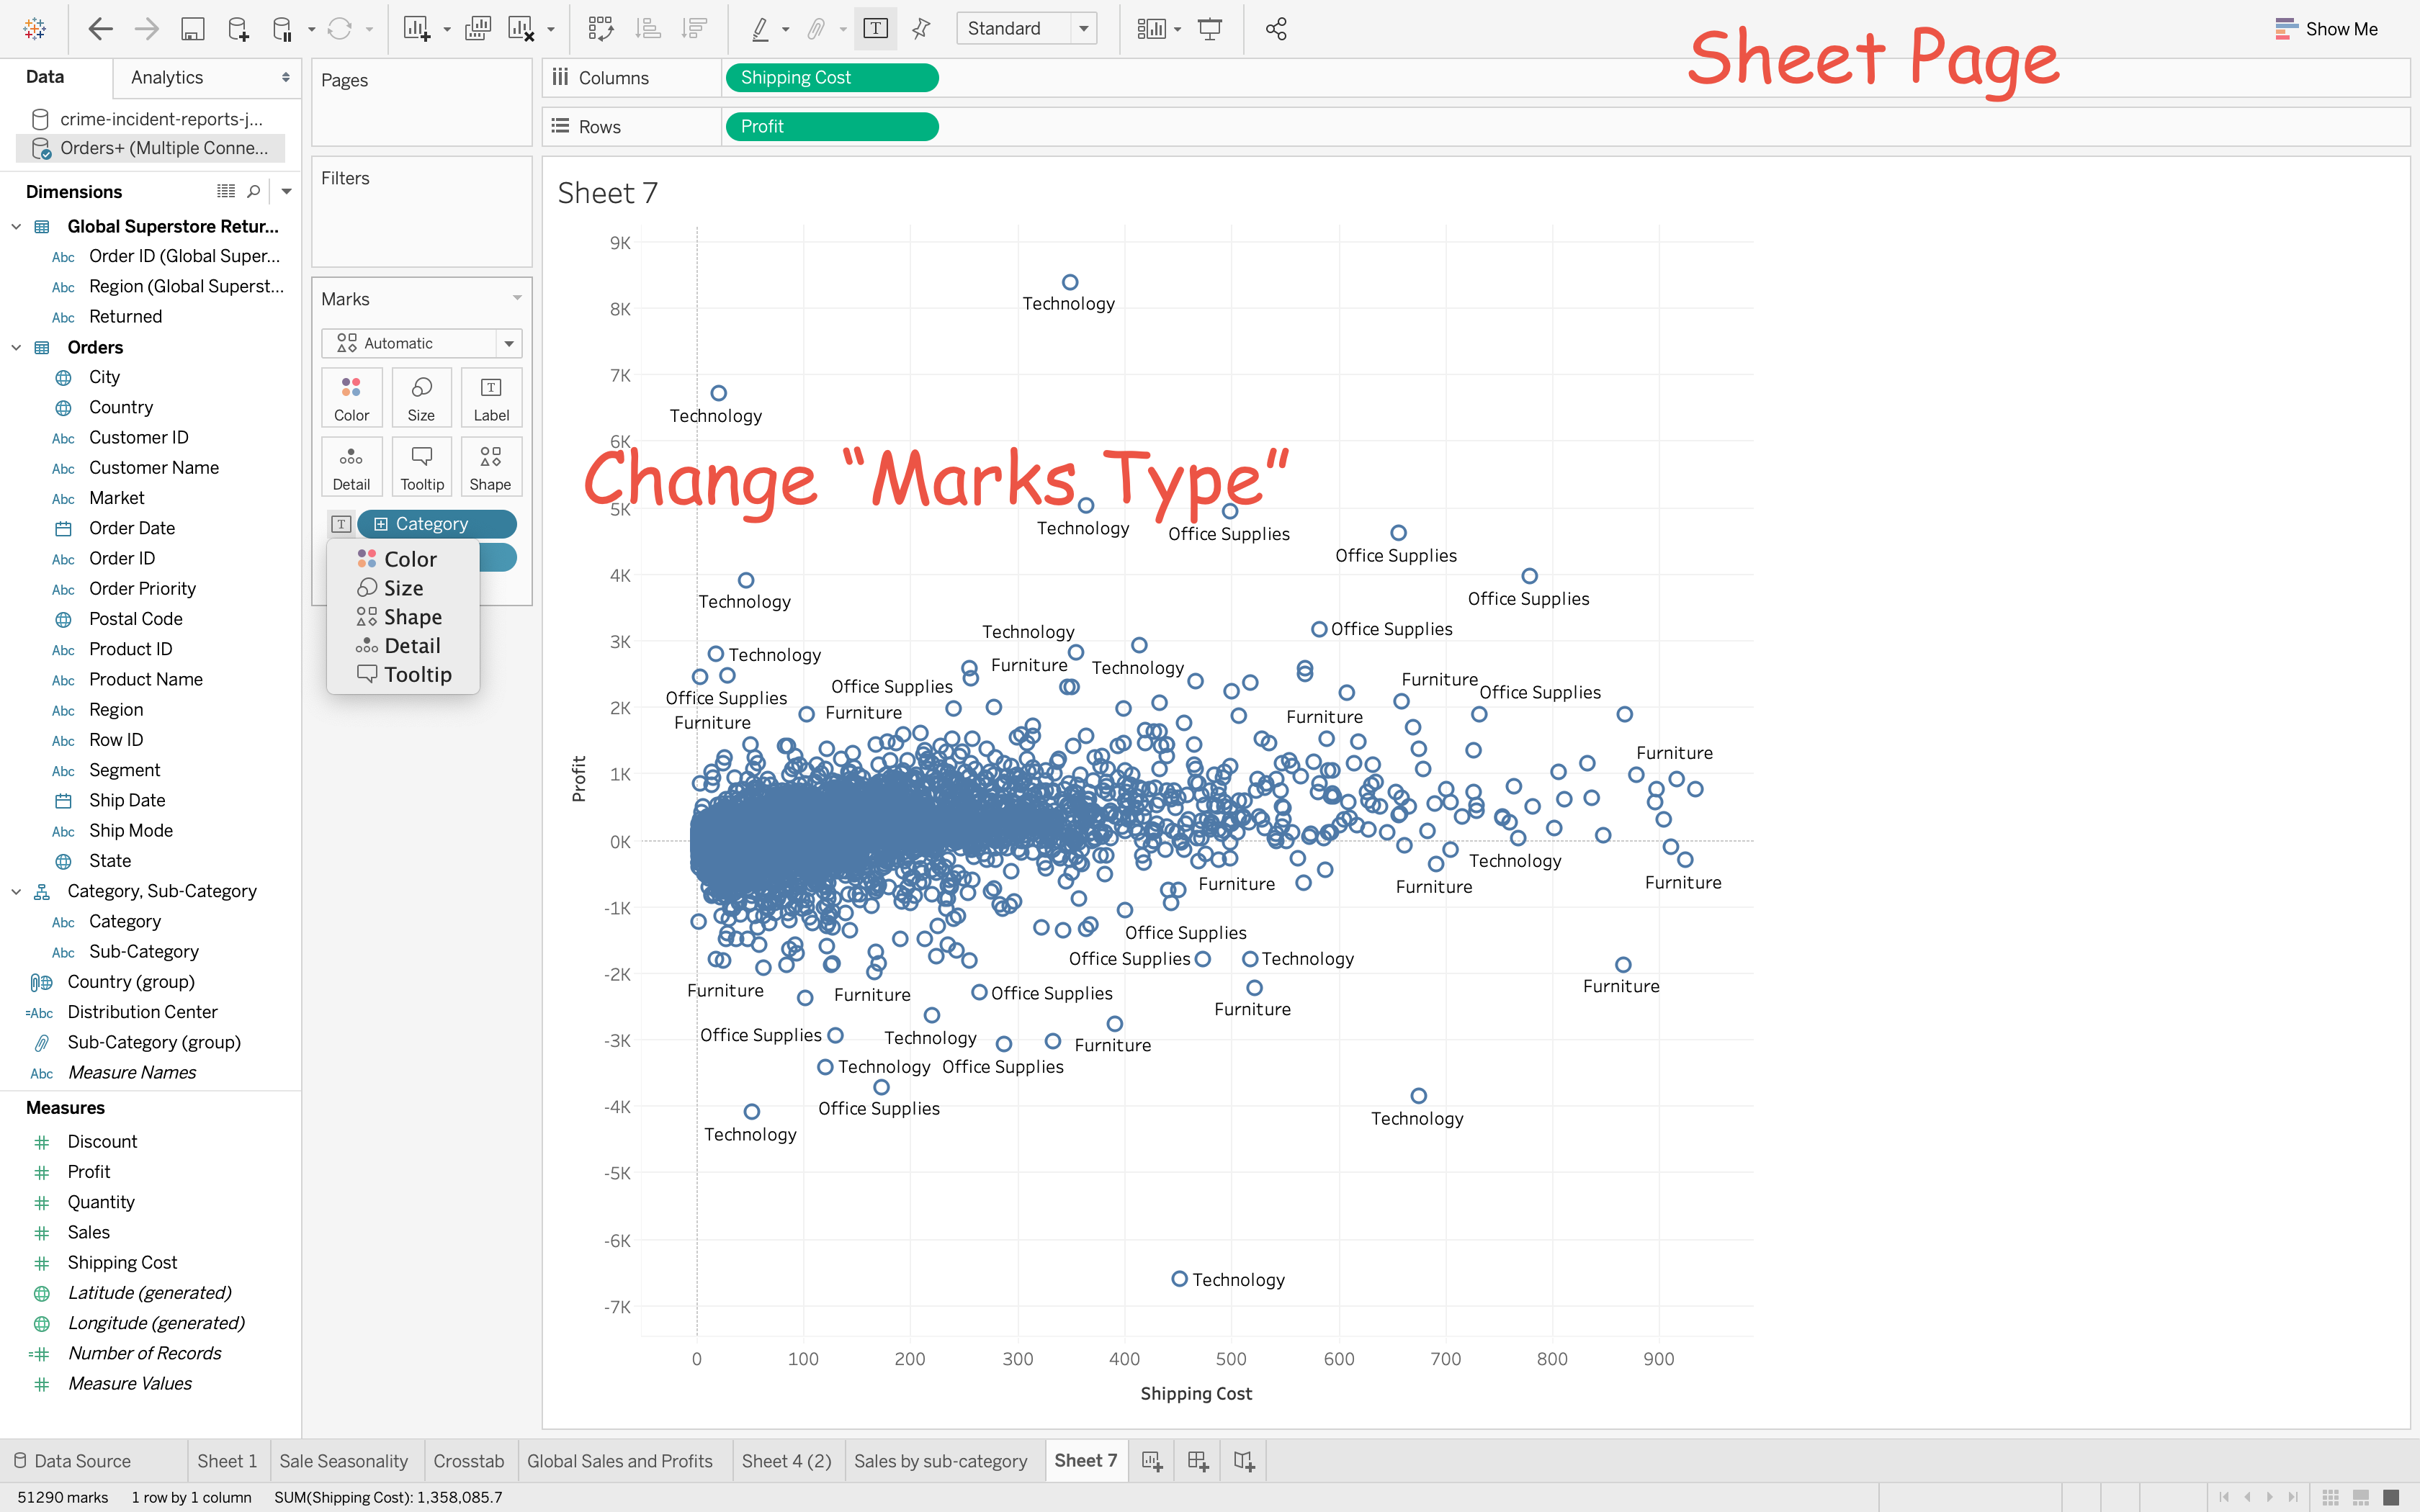
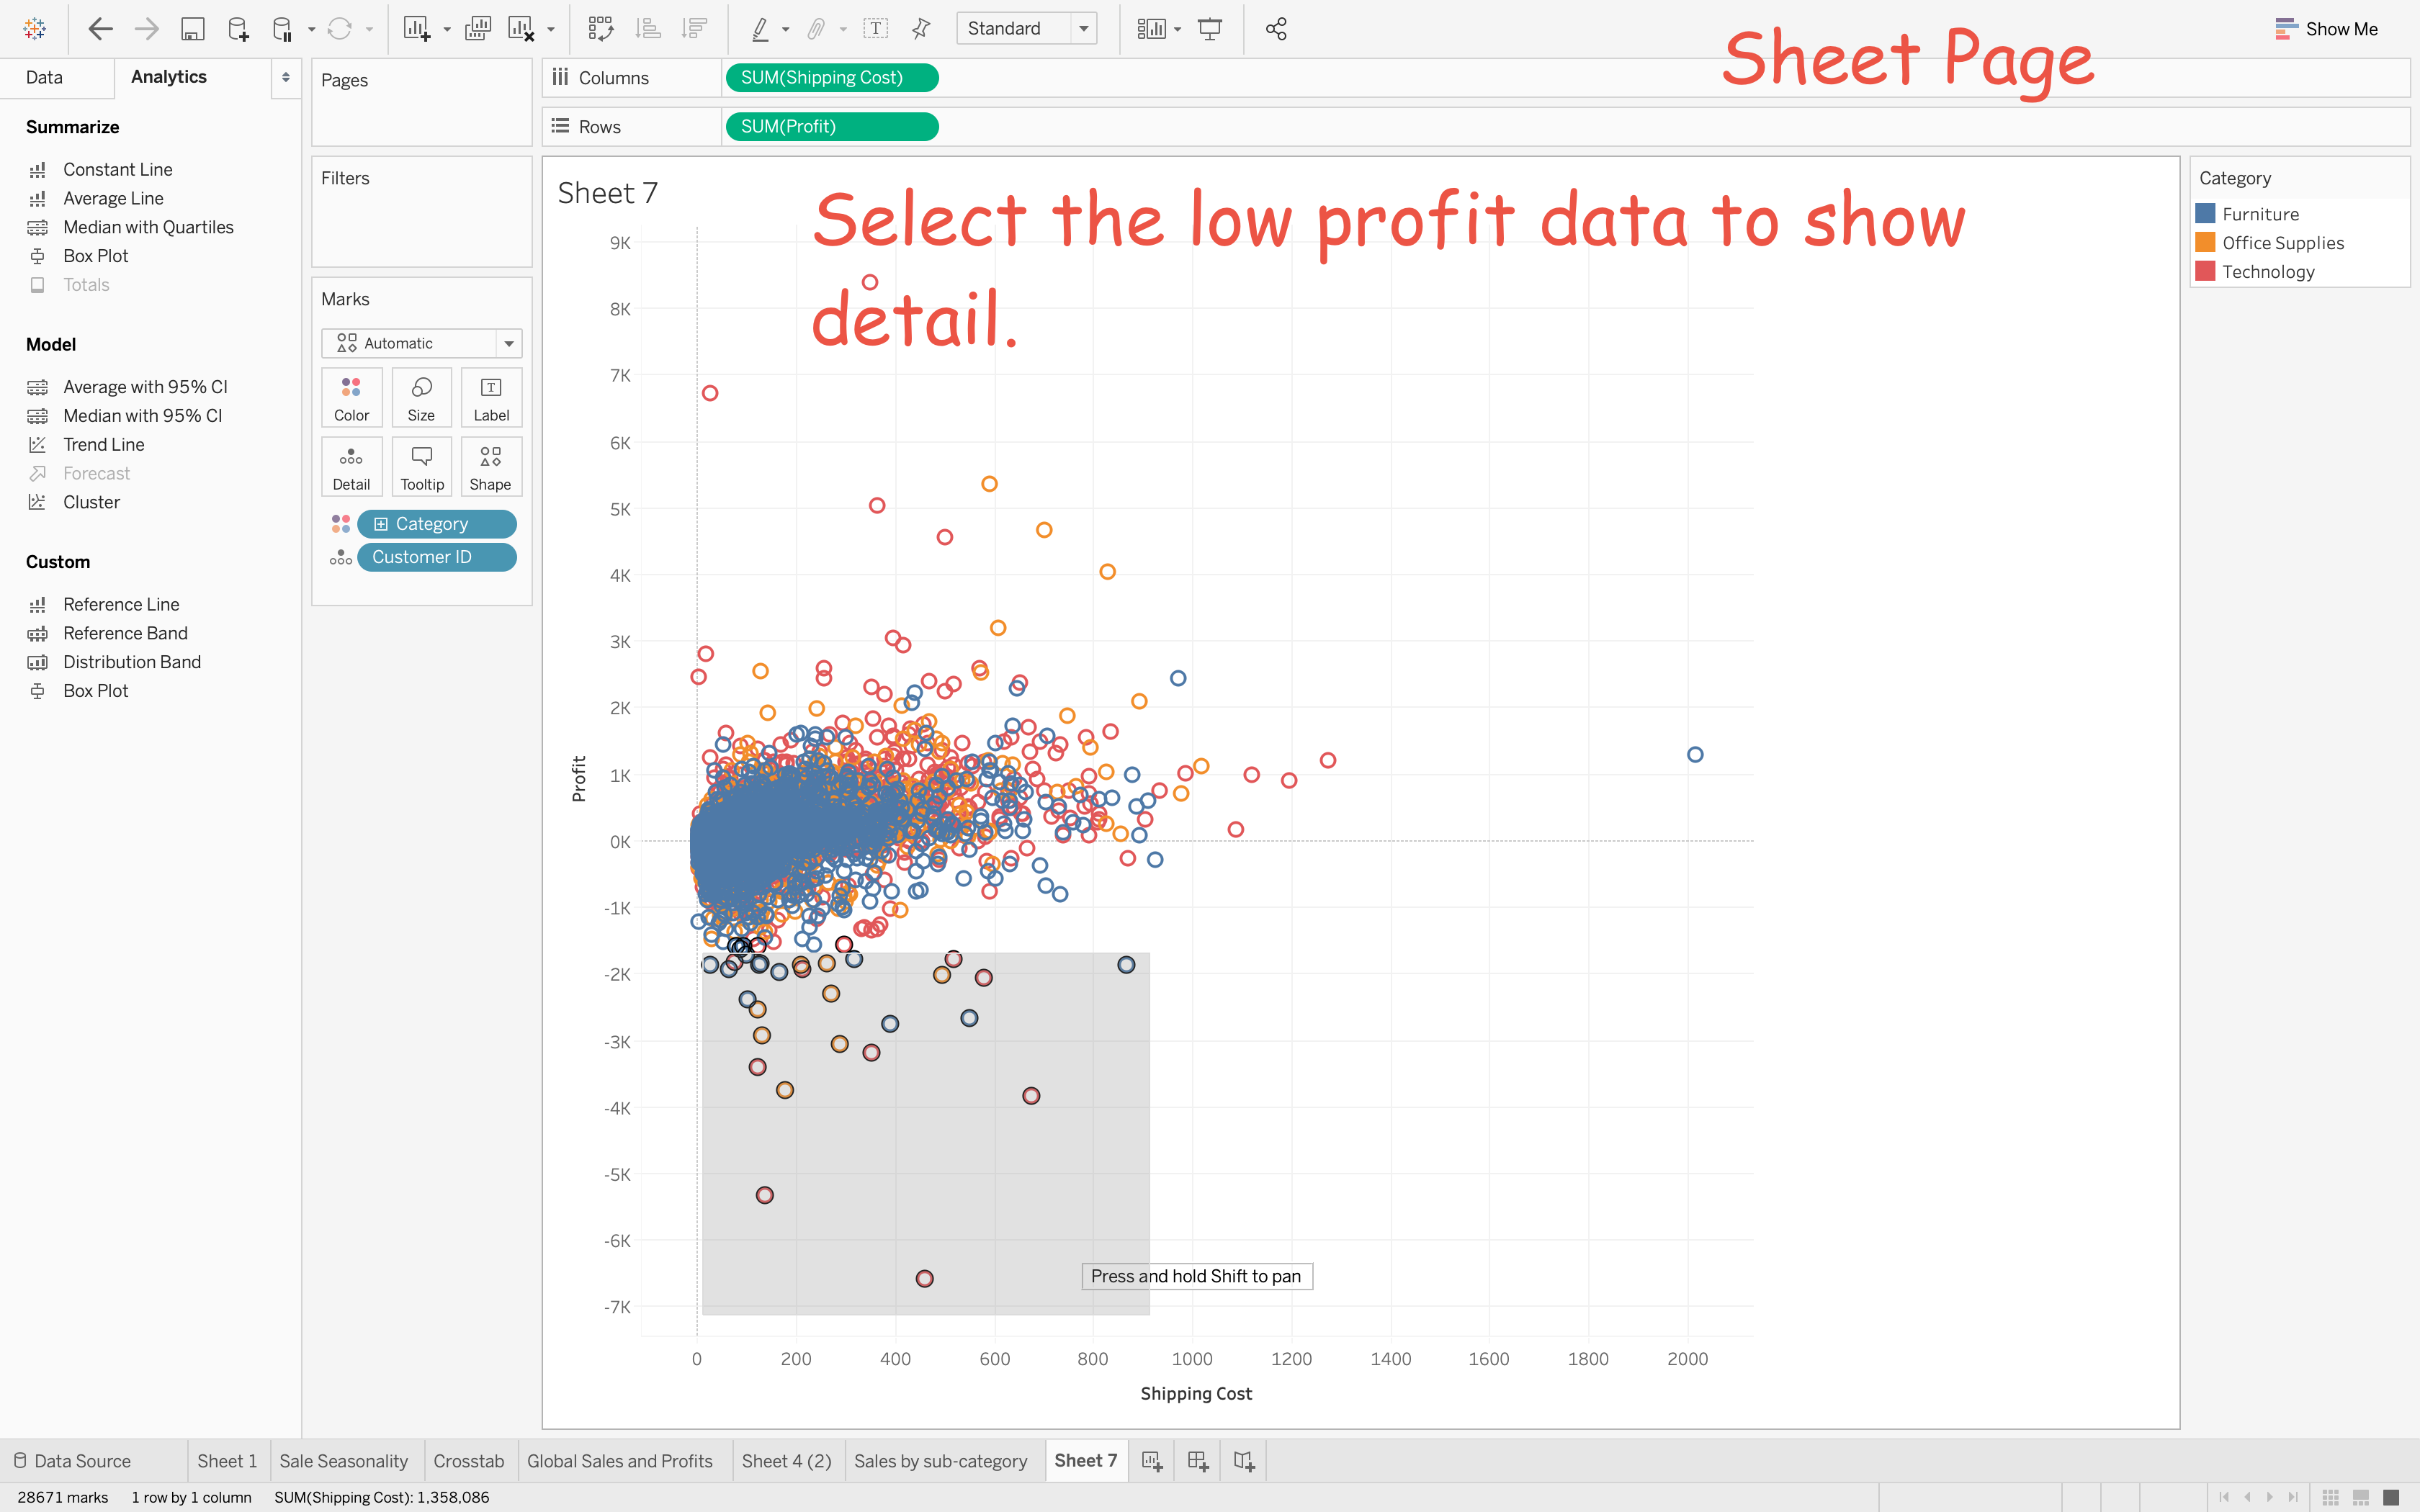
Analytics
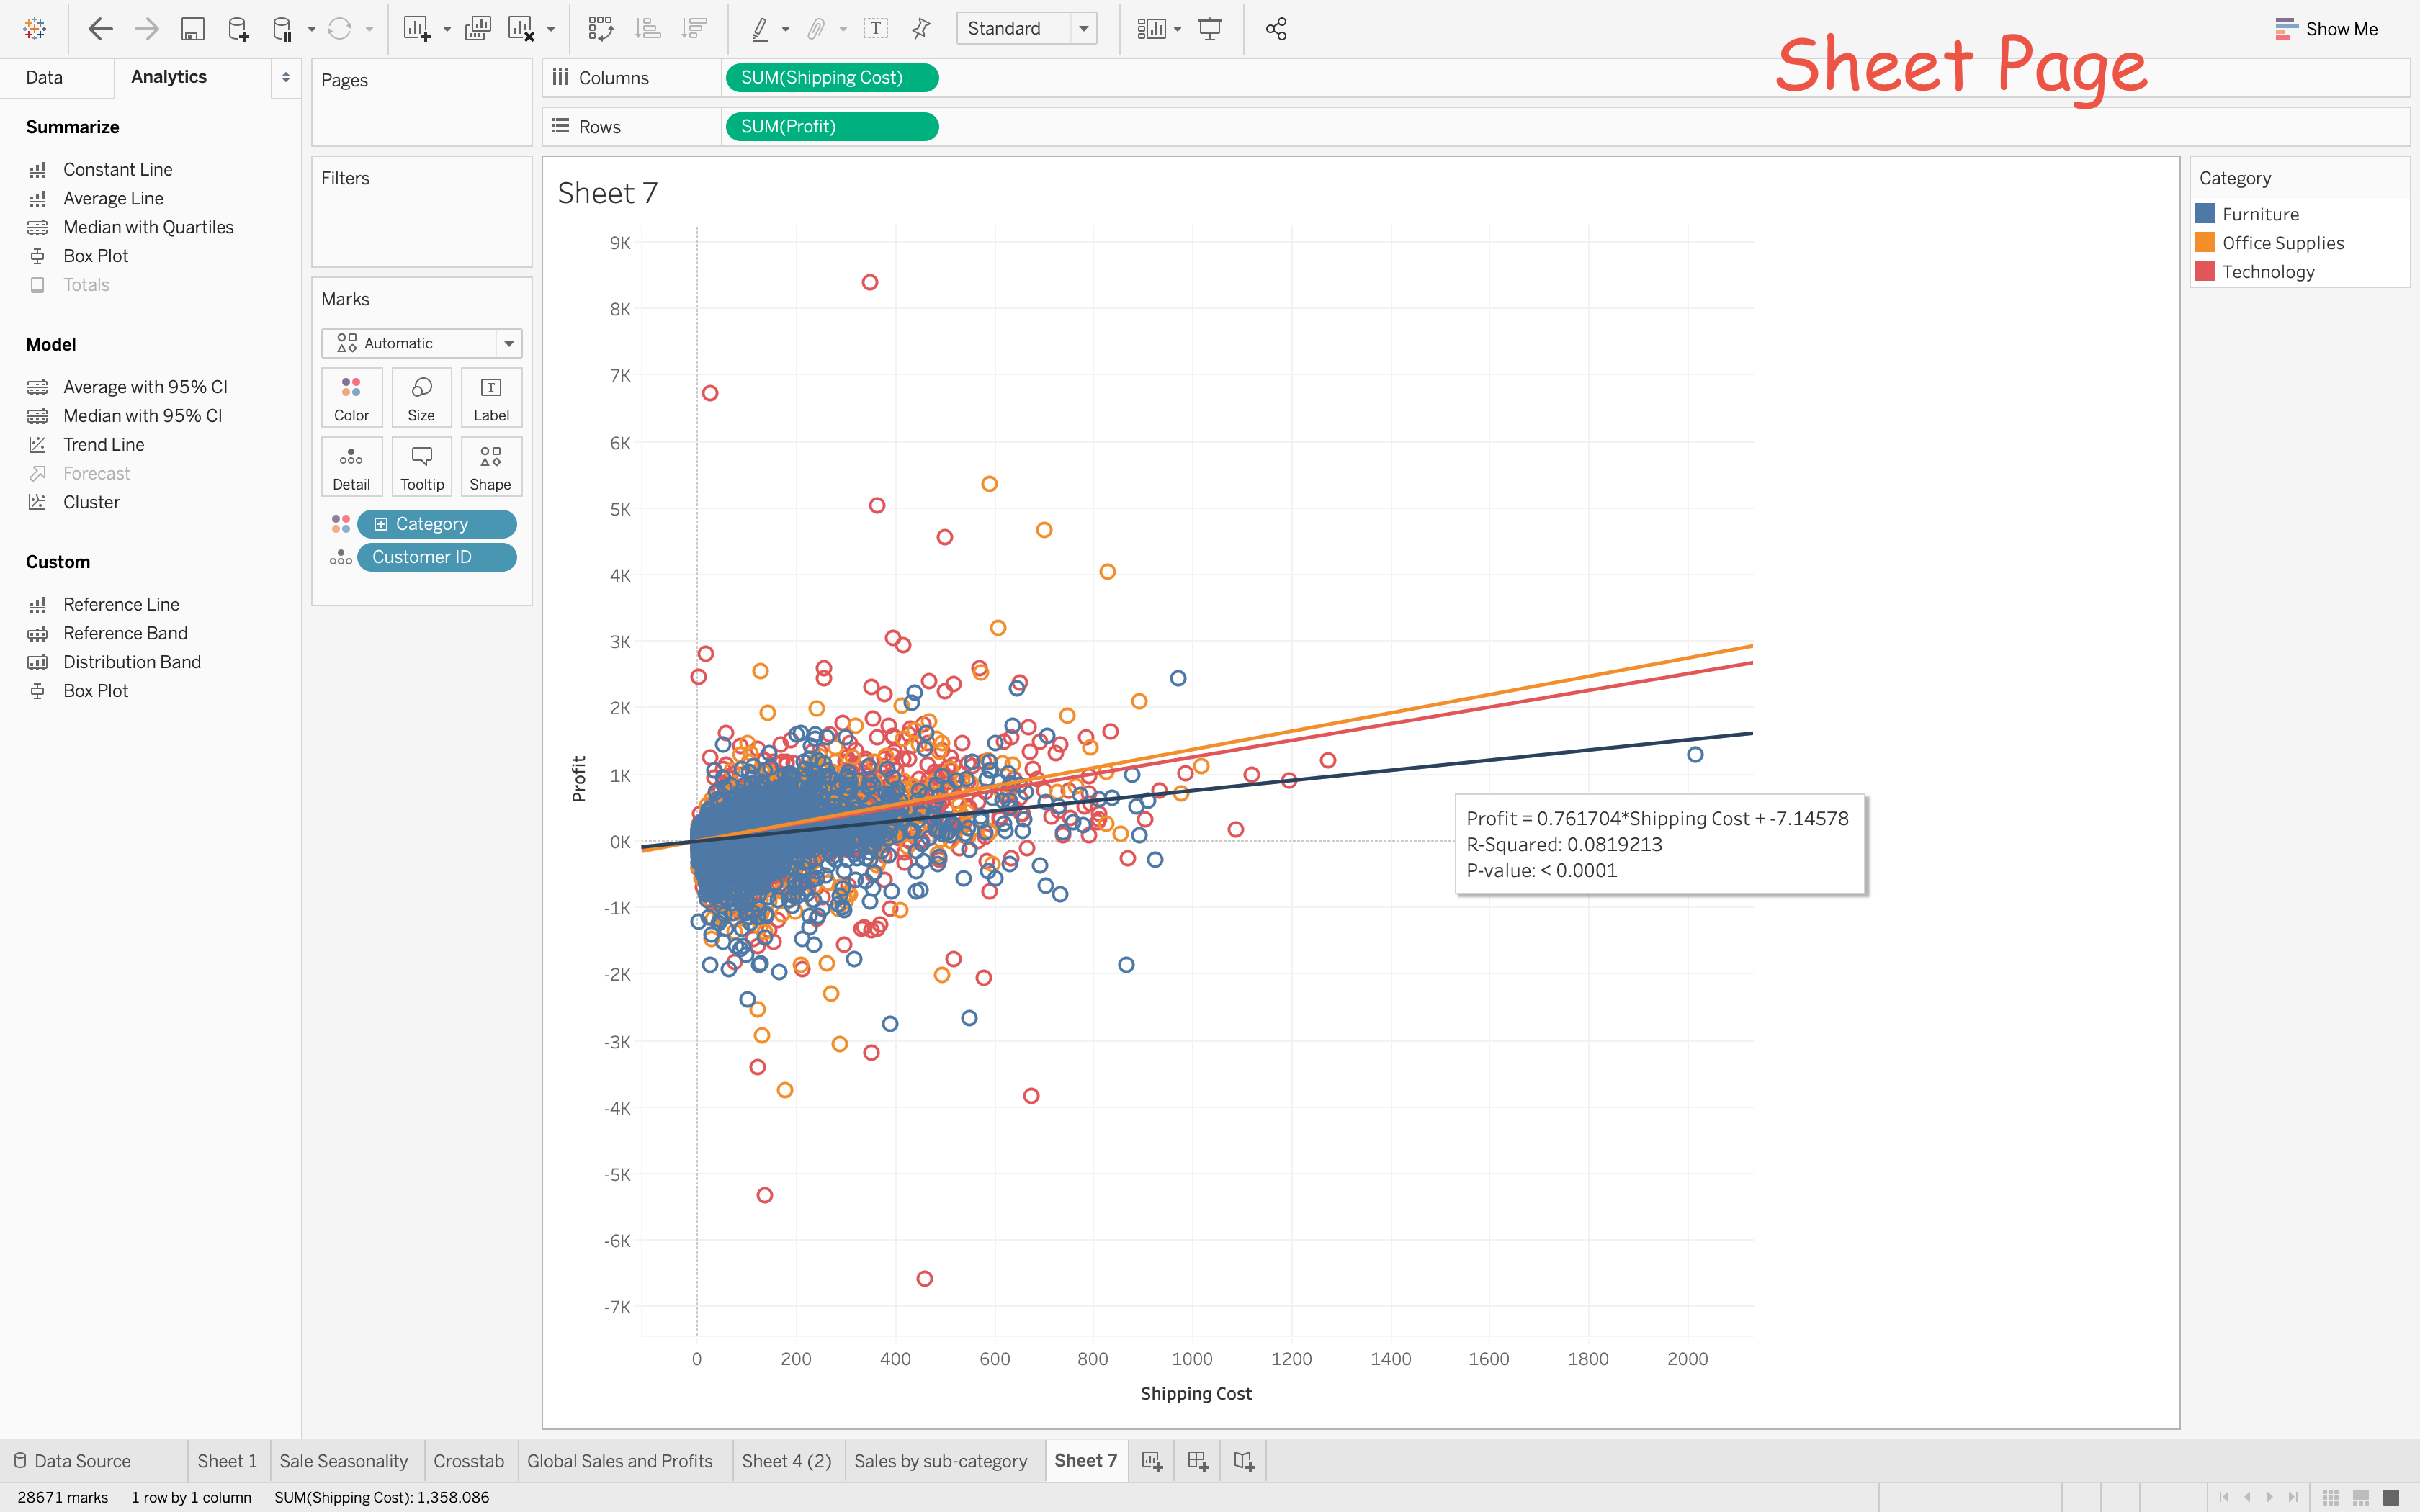
As shipping cost goes up, the profits go up less sharply in furniture. But the R-squared is too low to prove it.
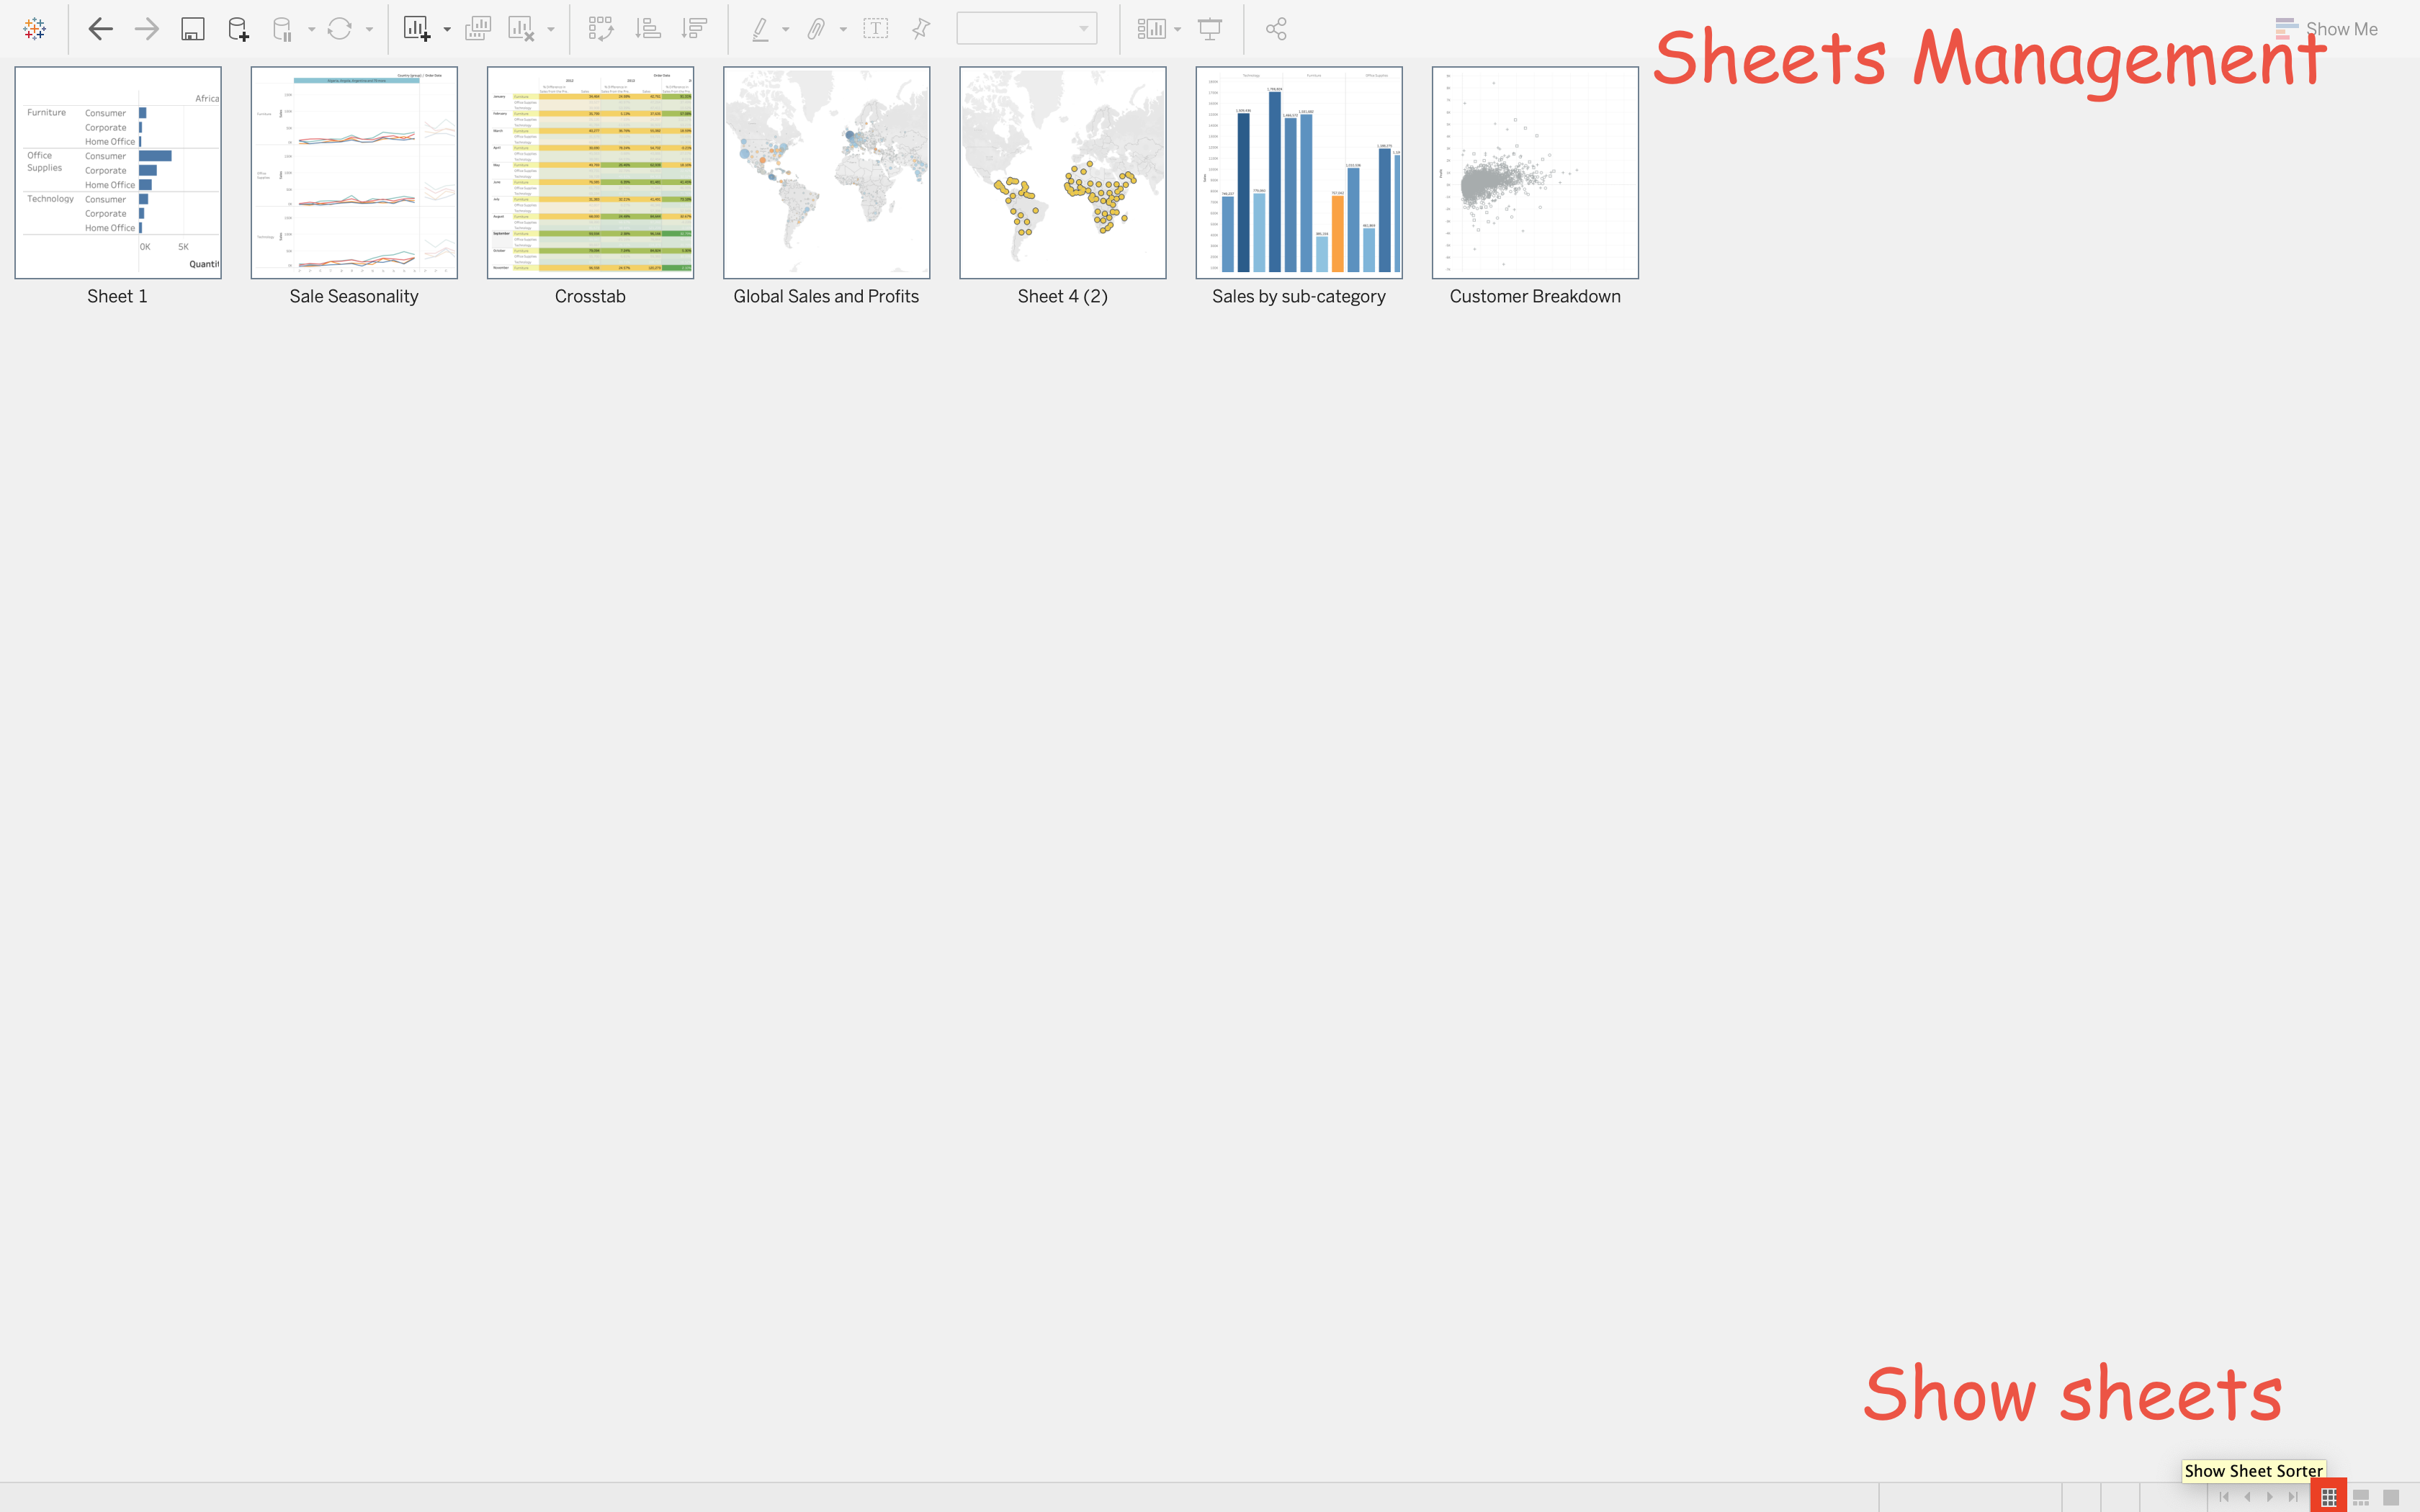
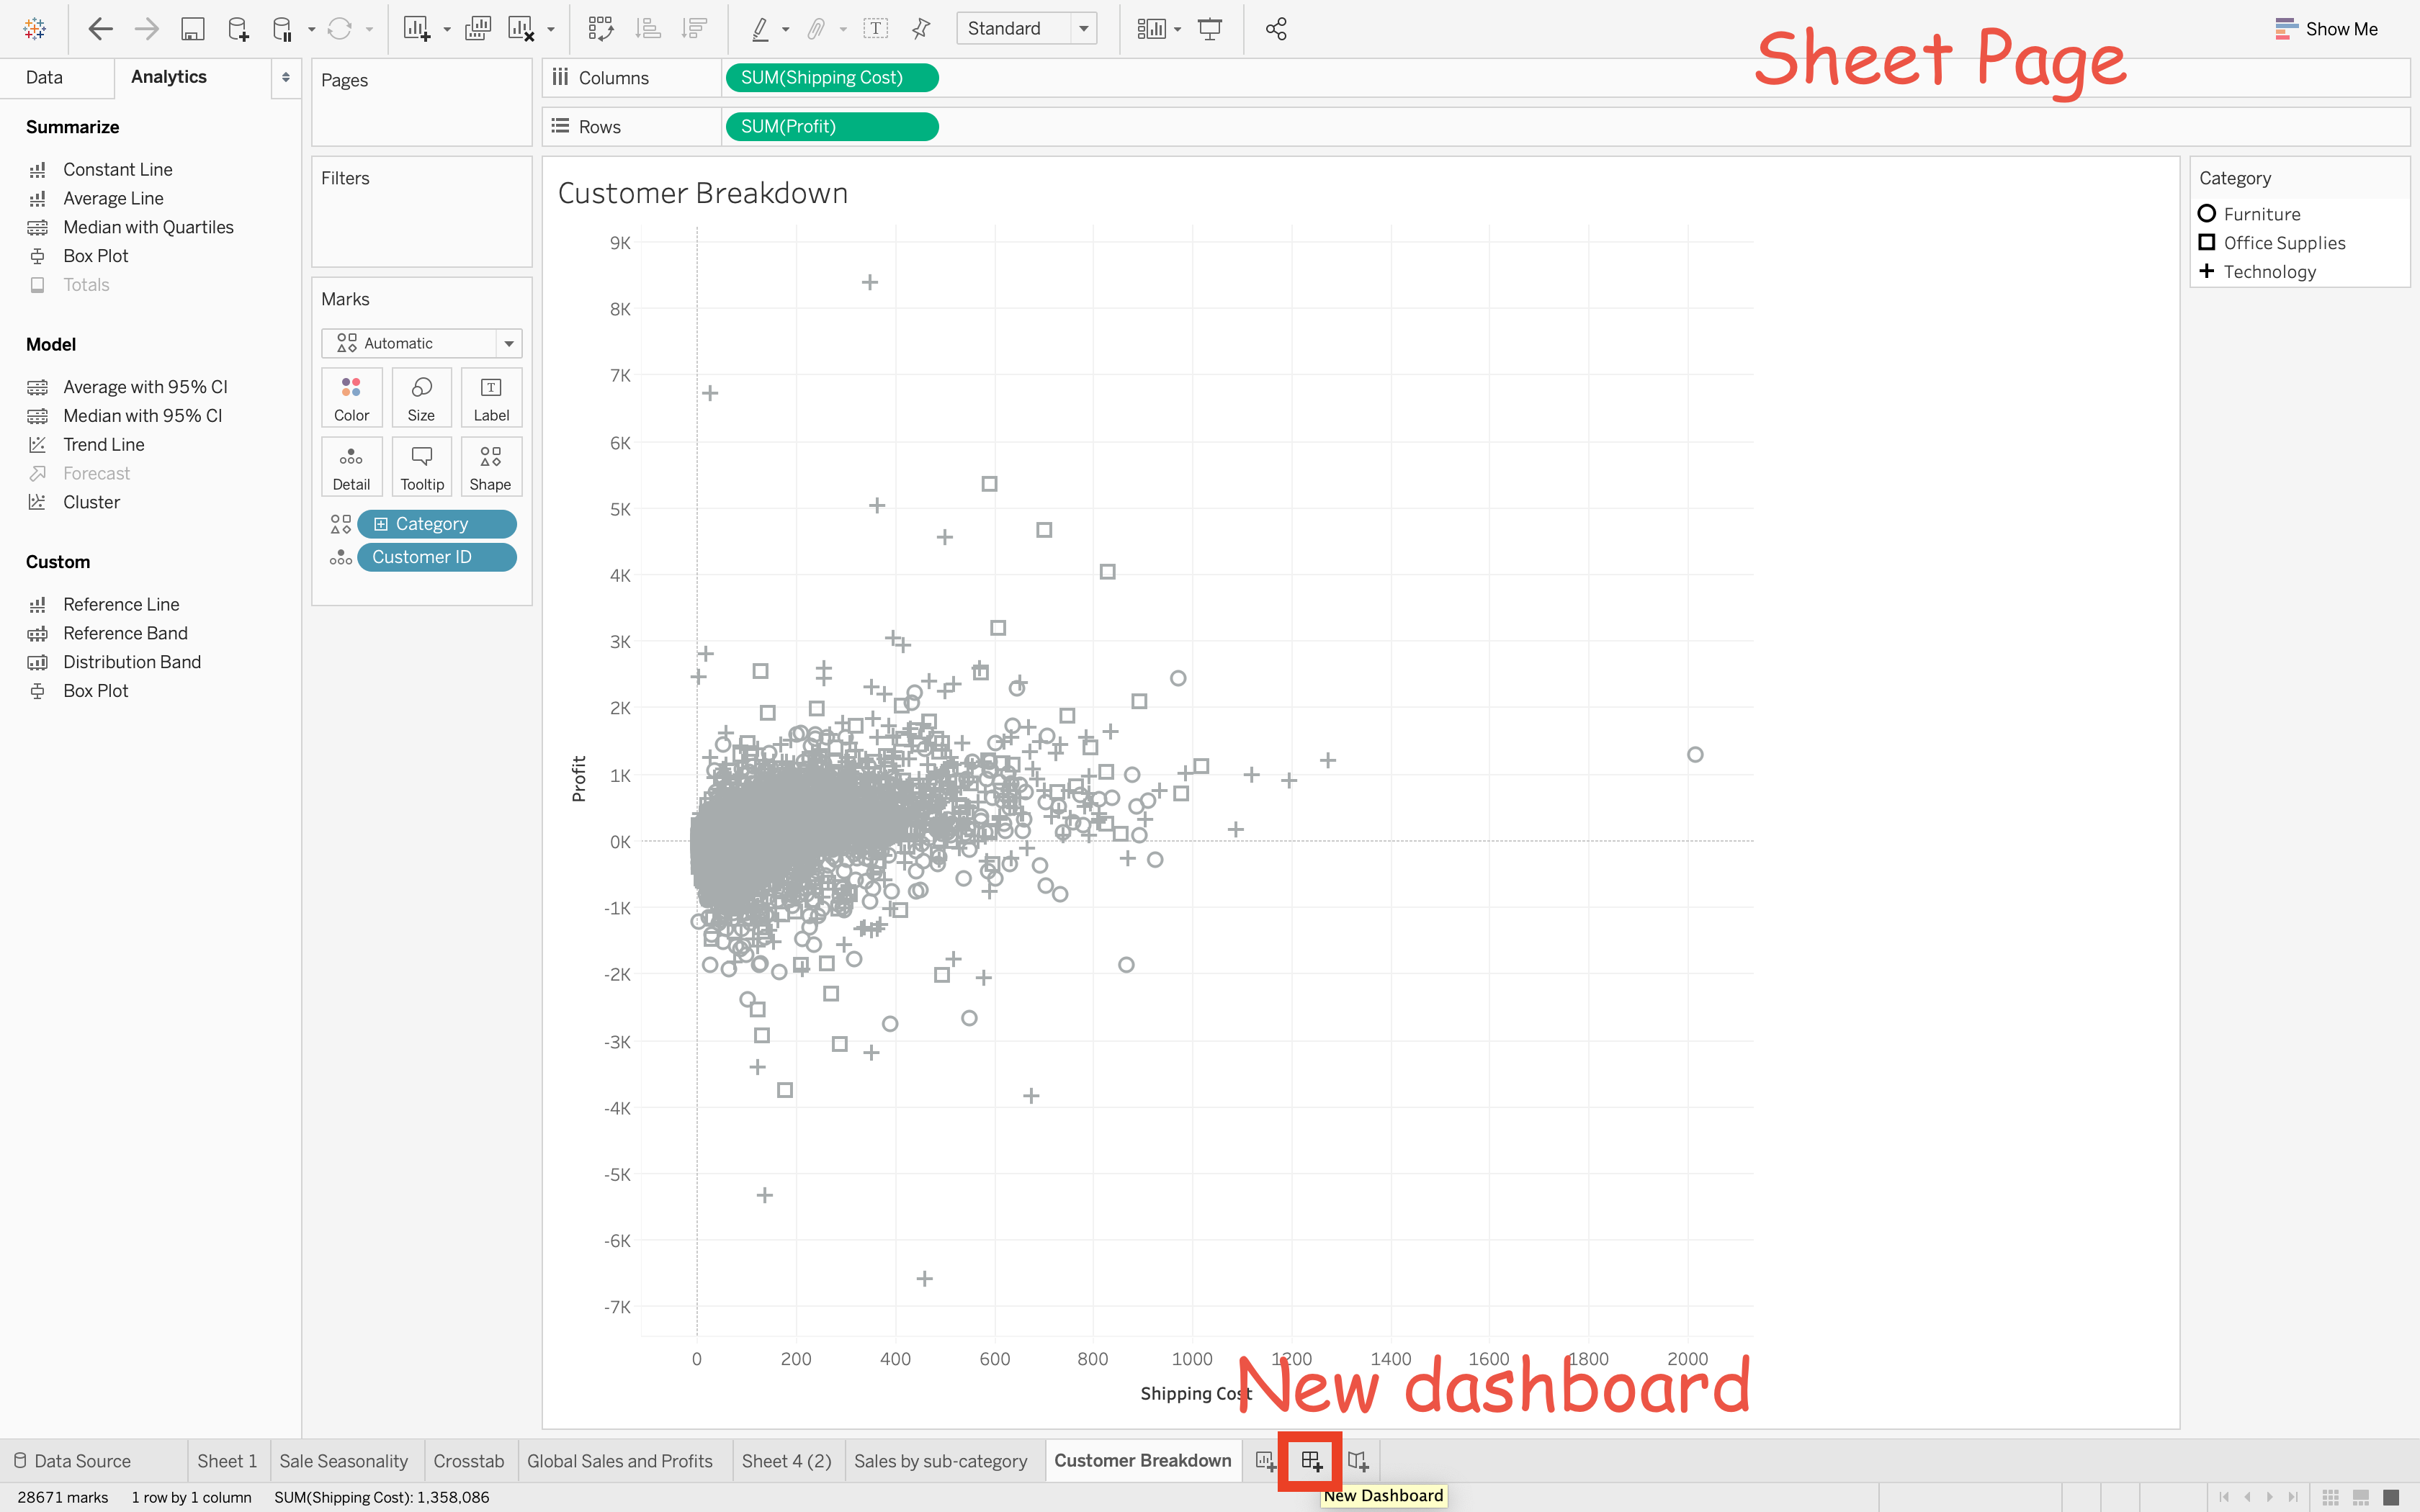
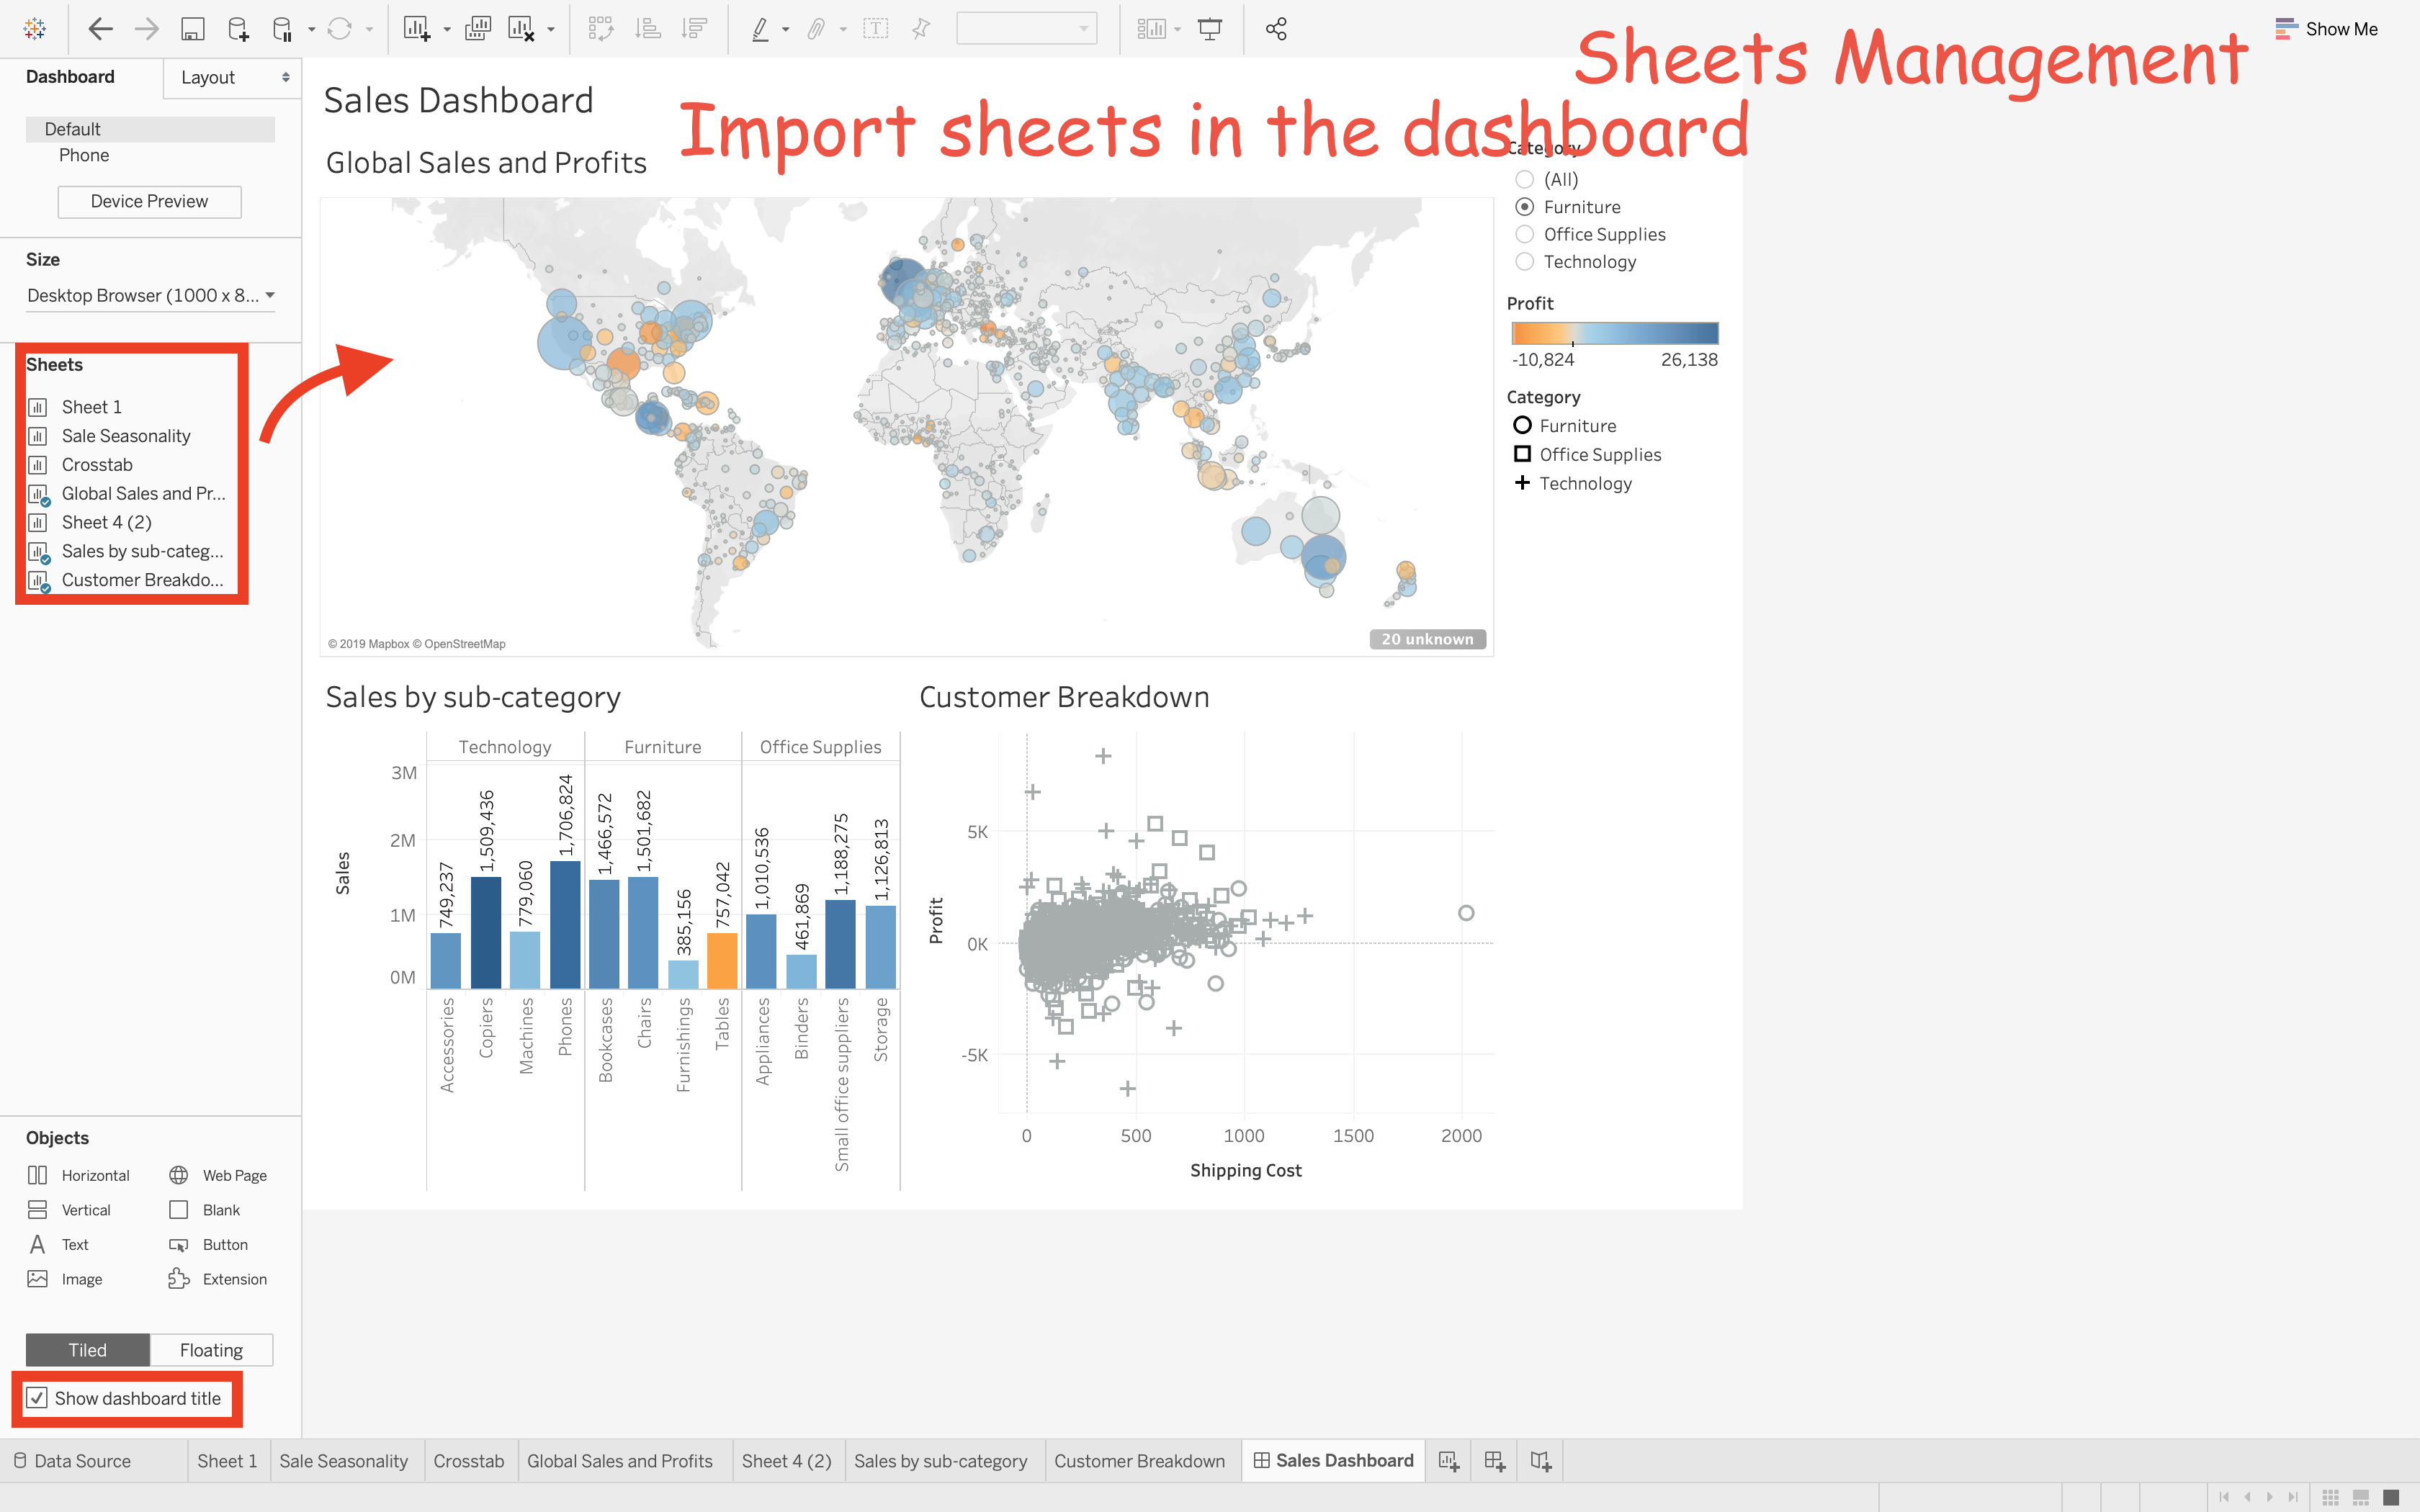
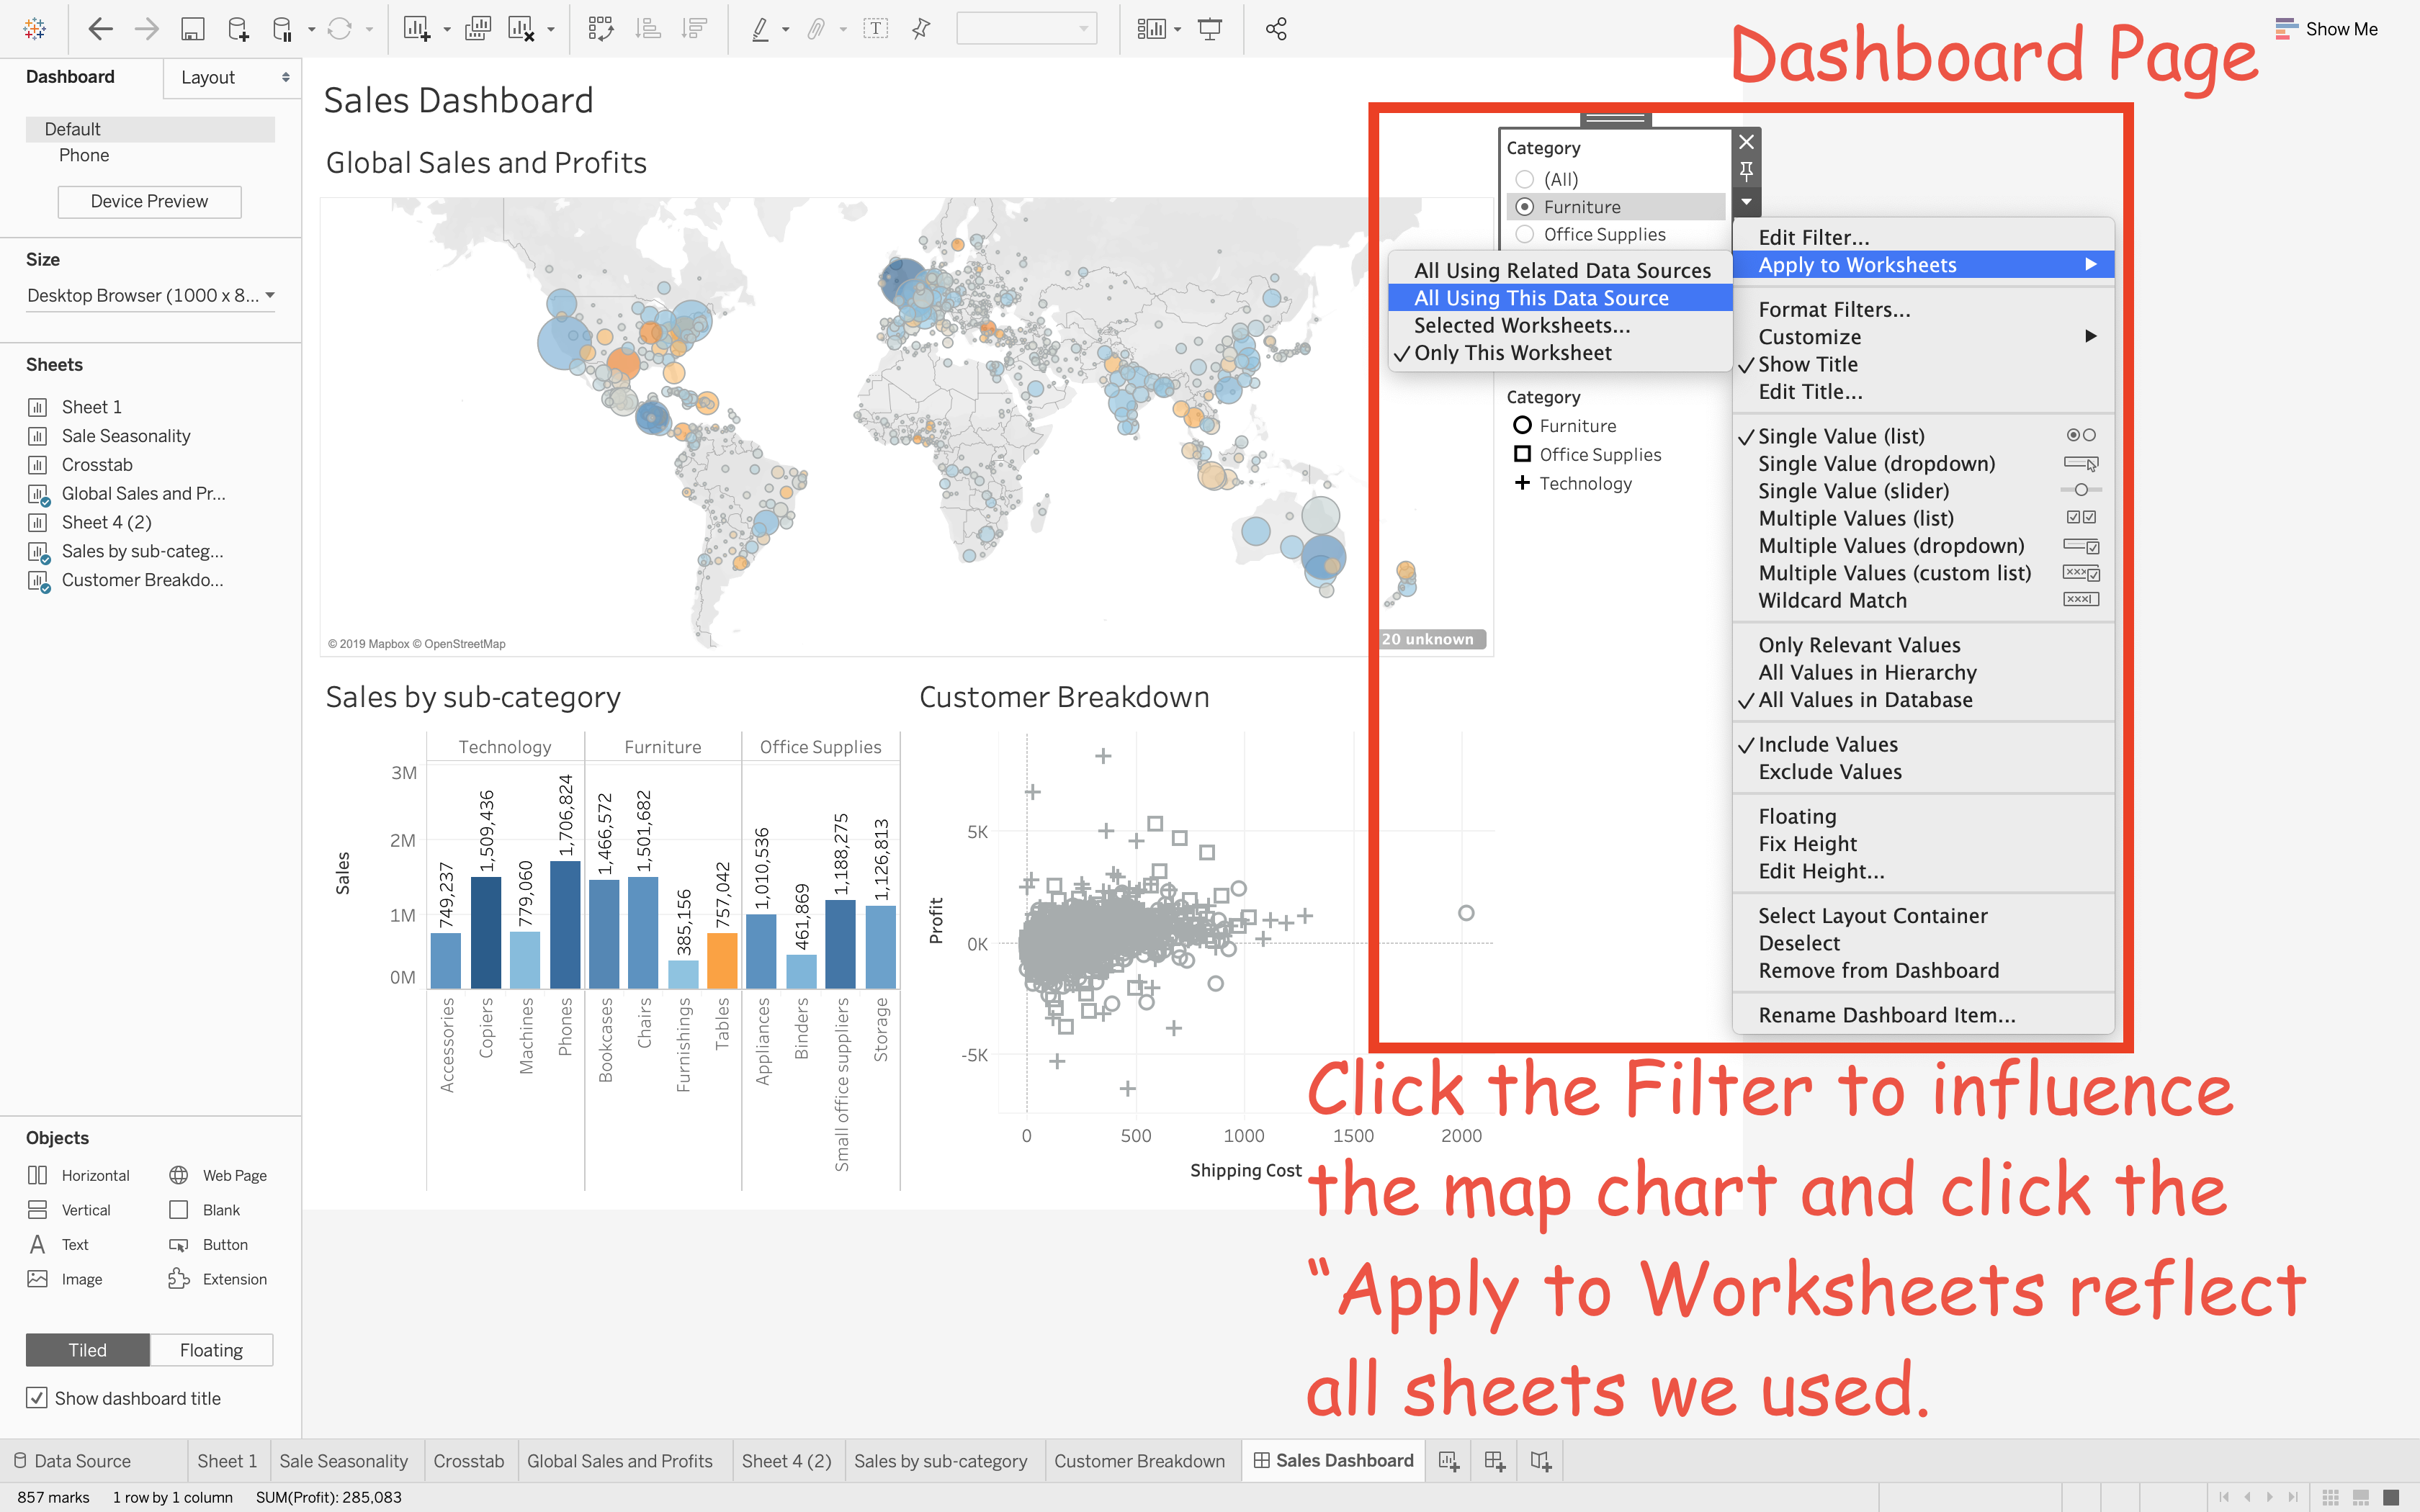
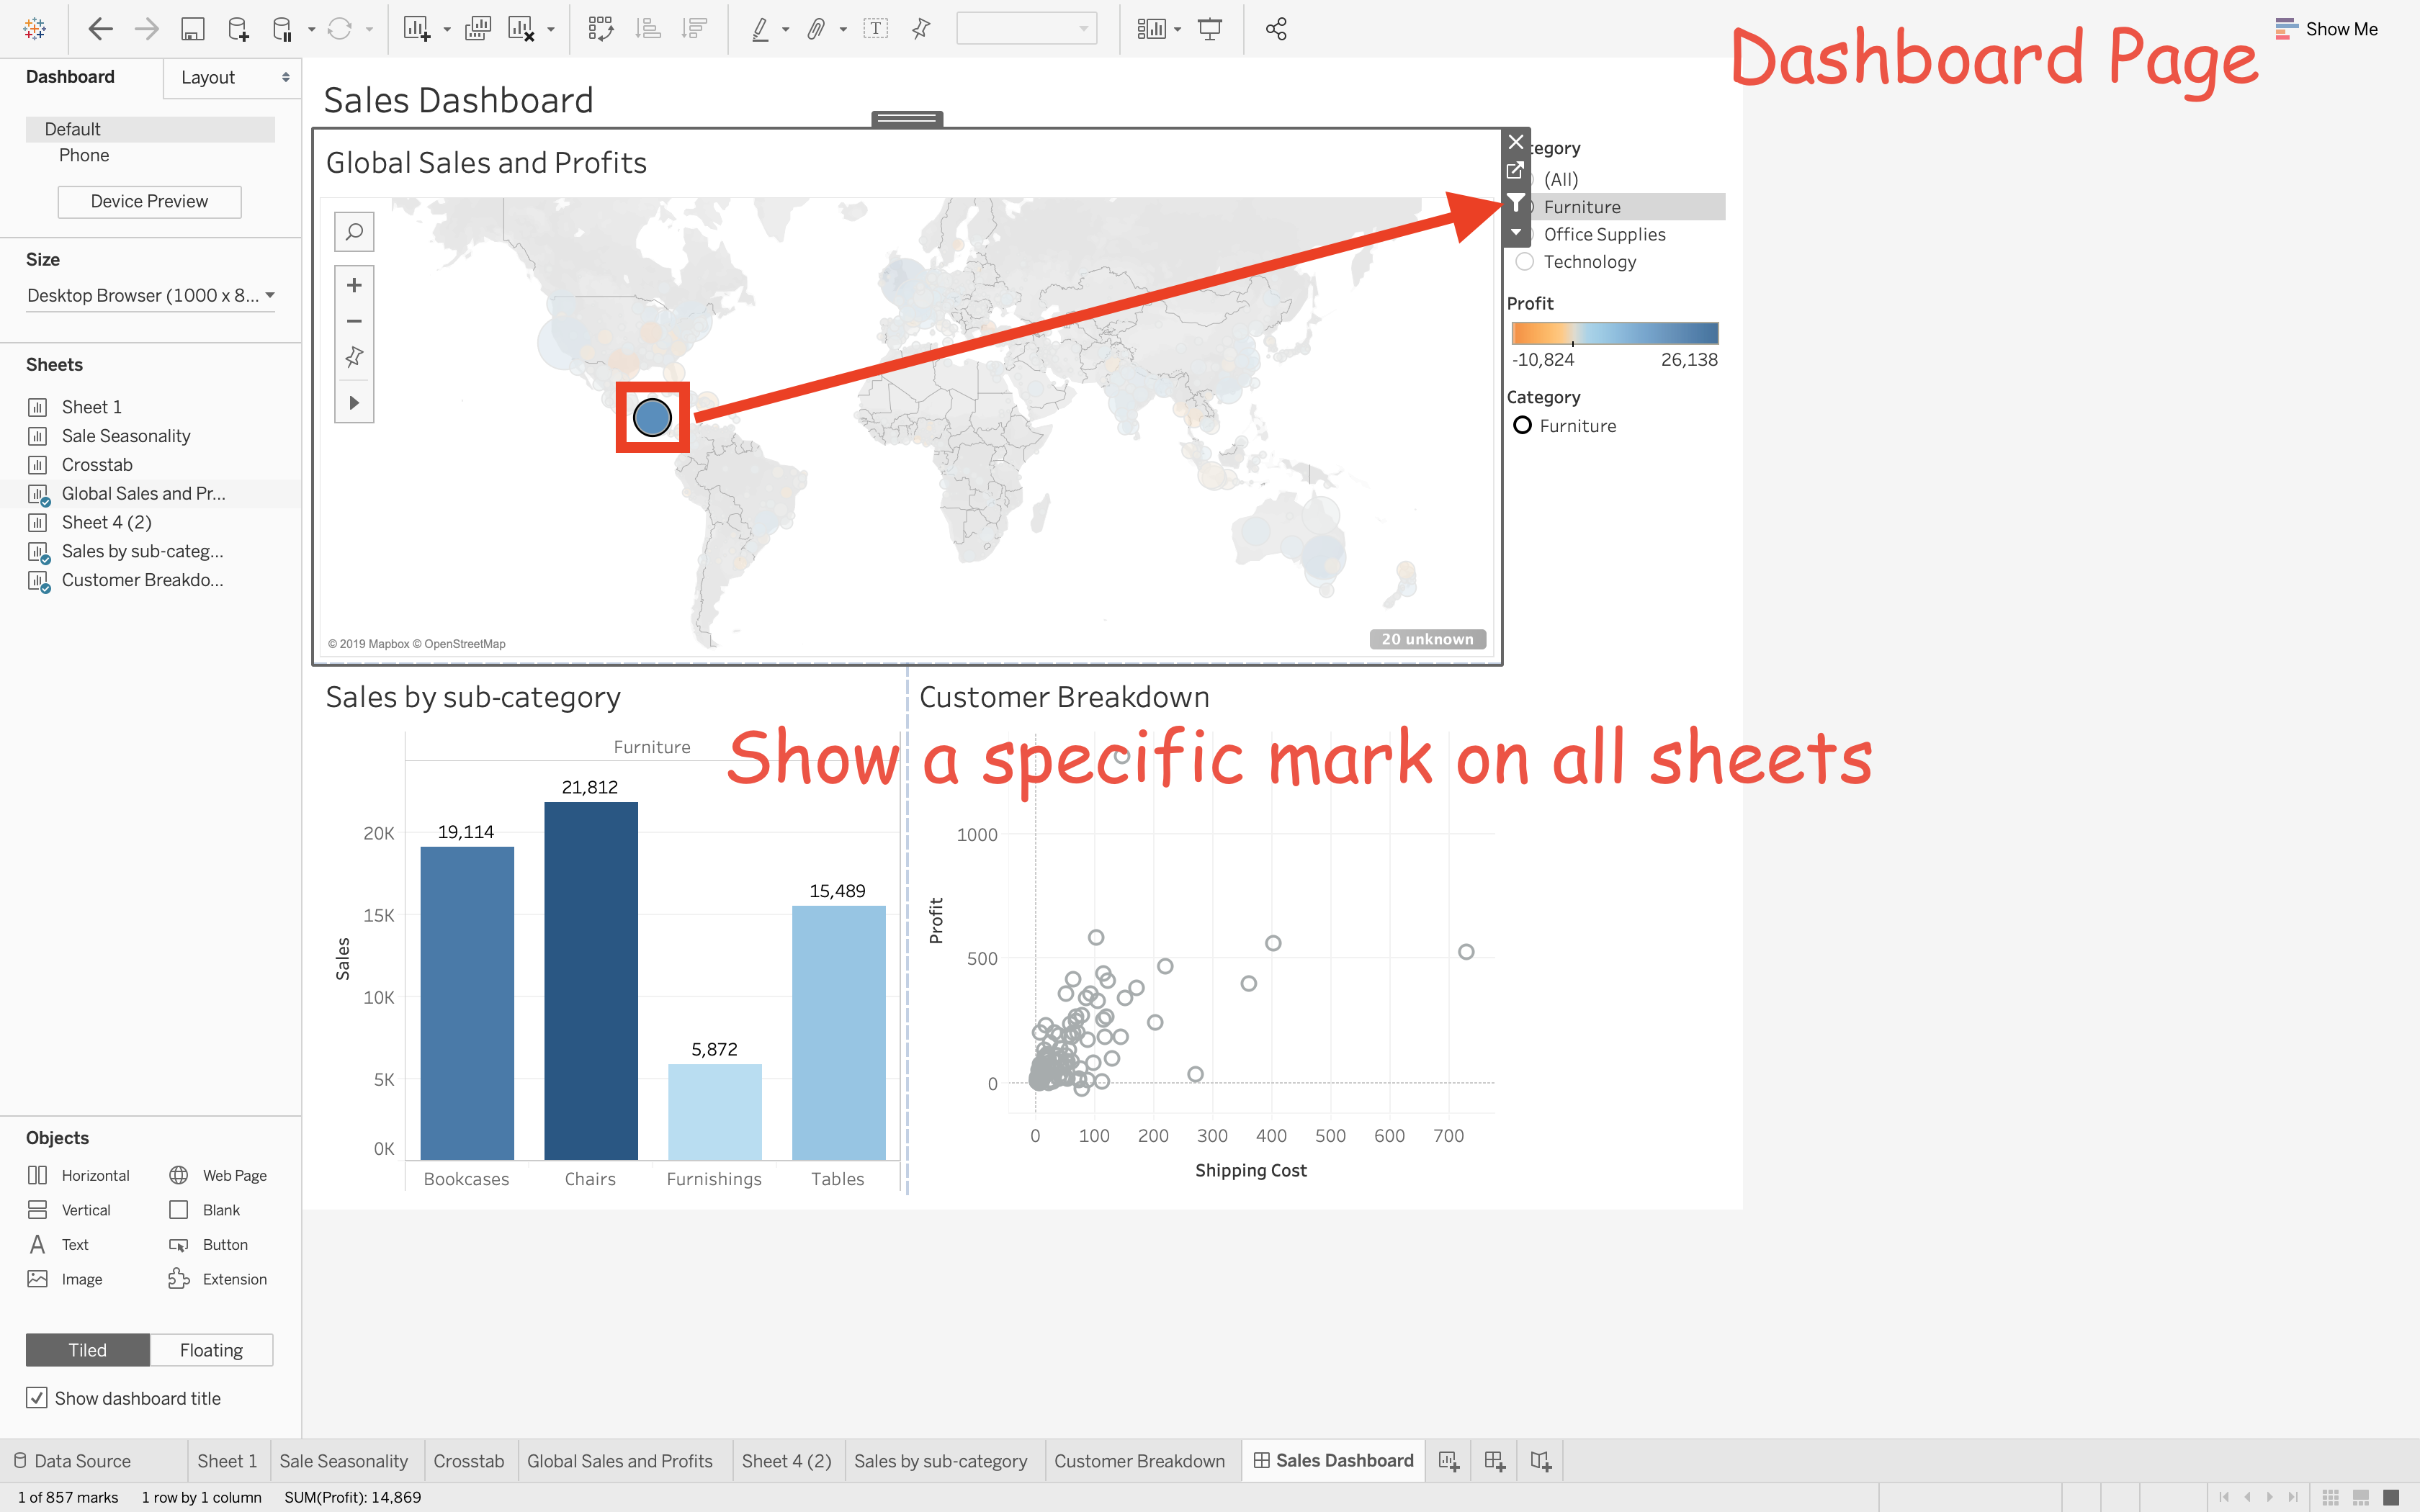
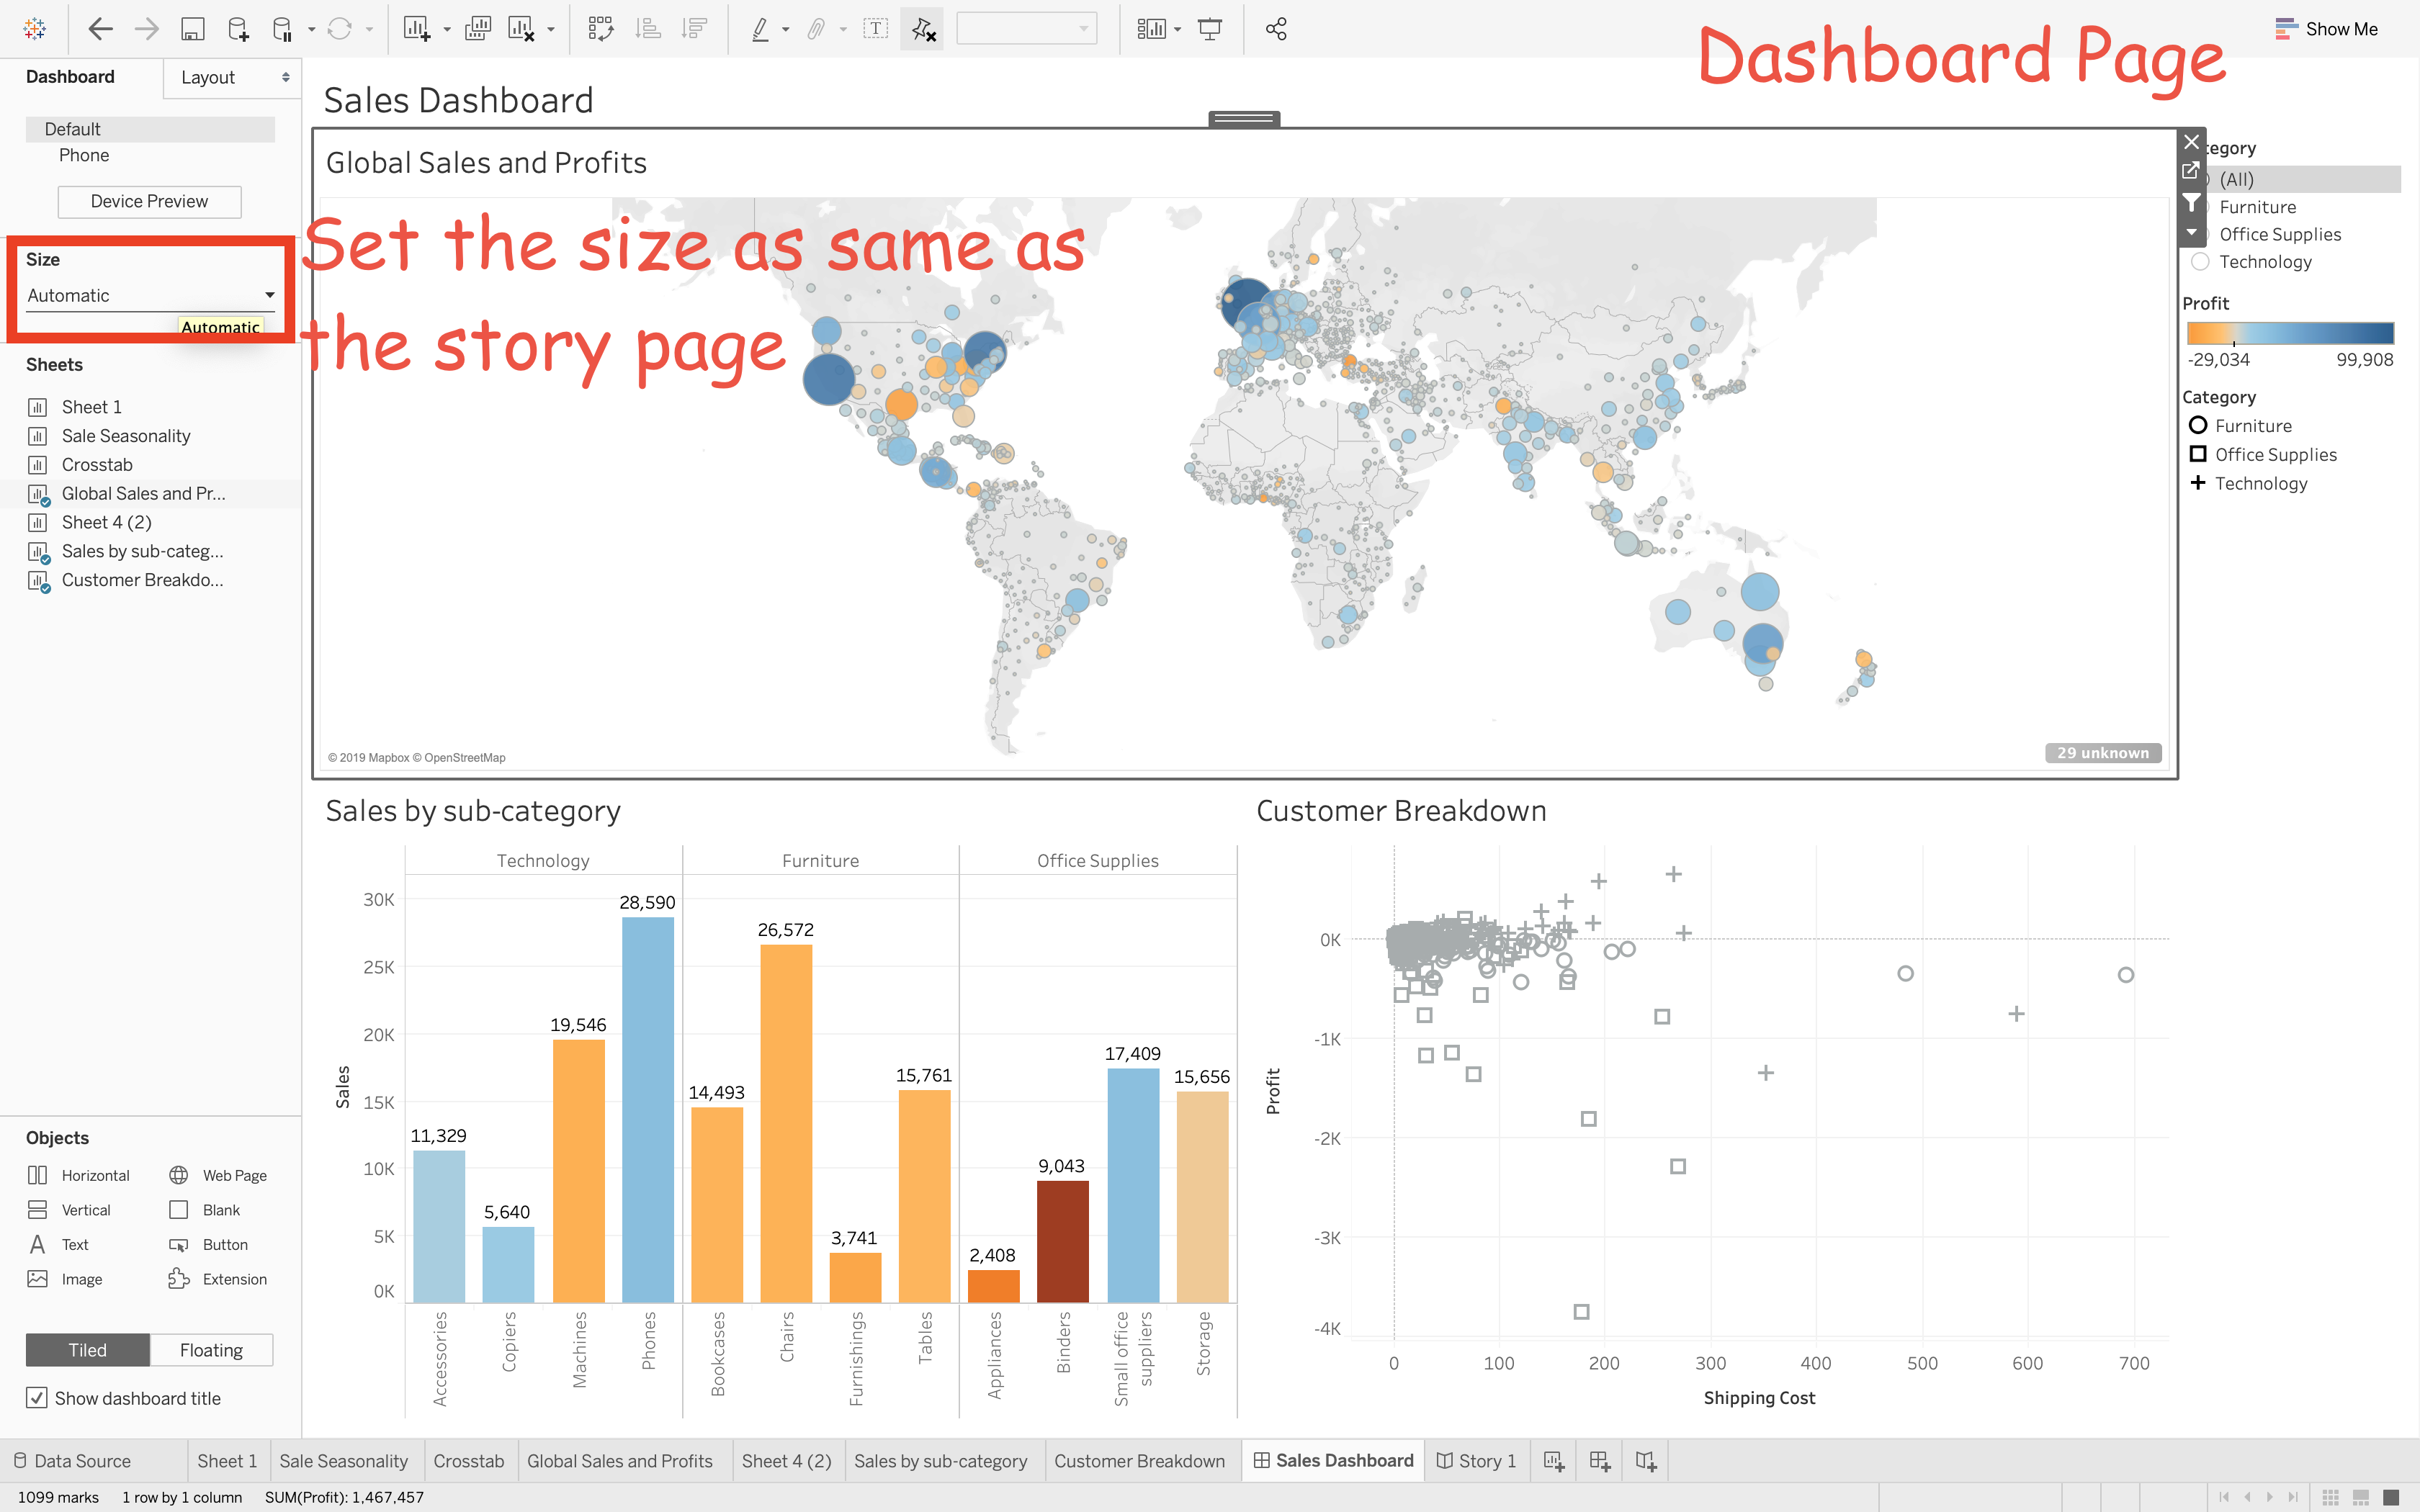
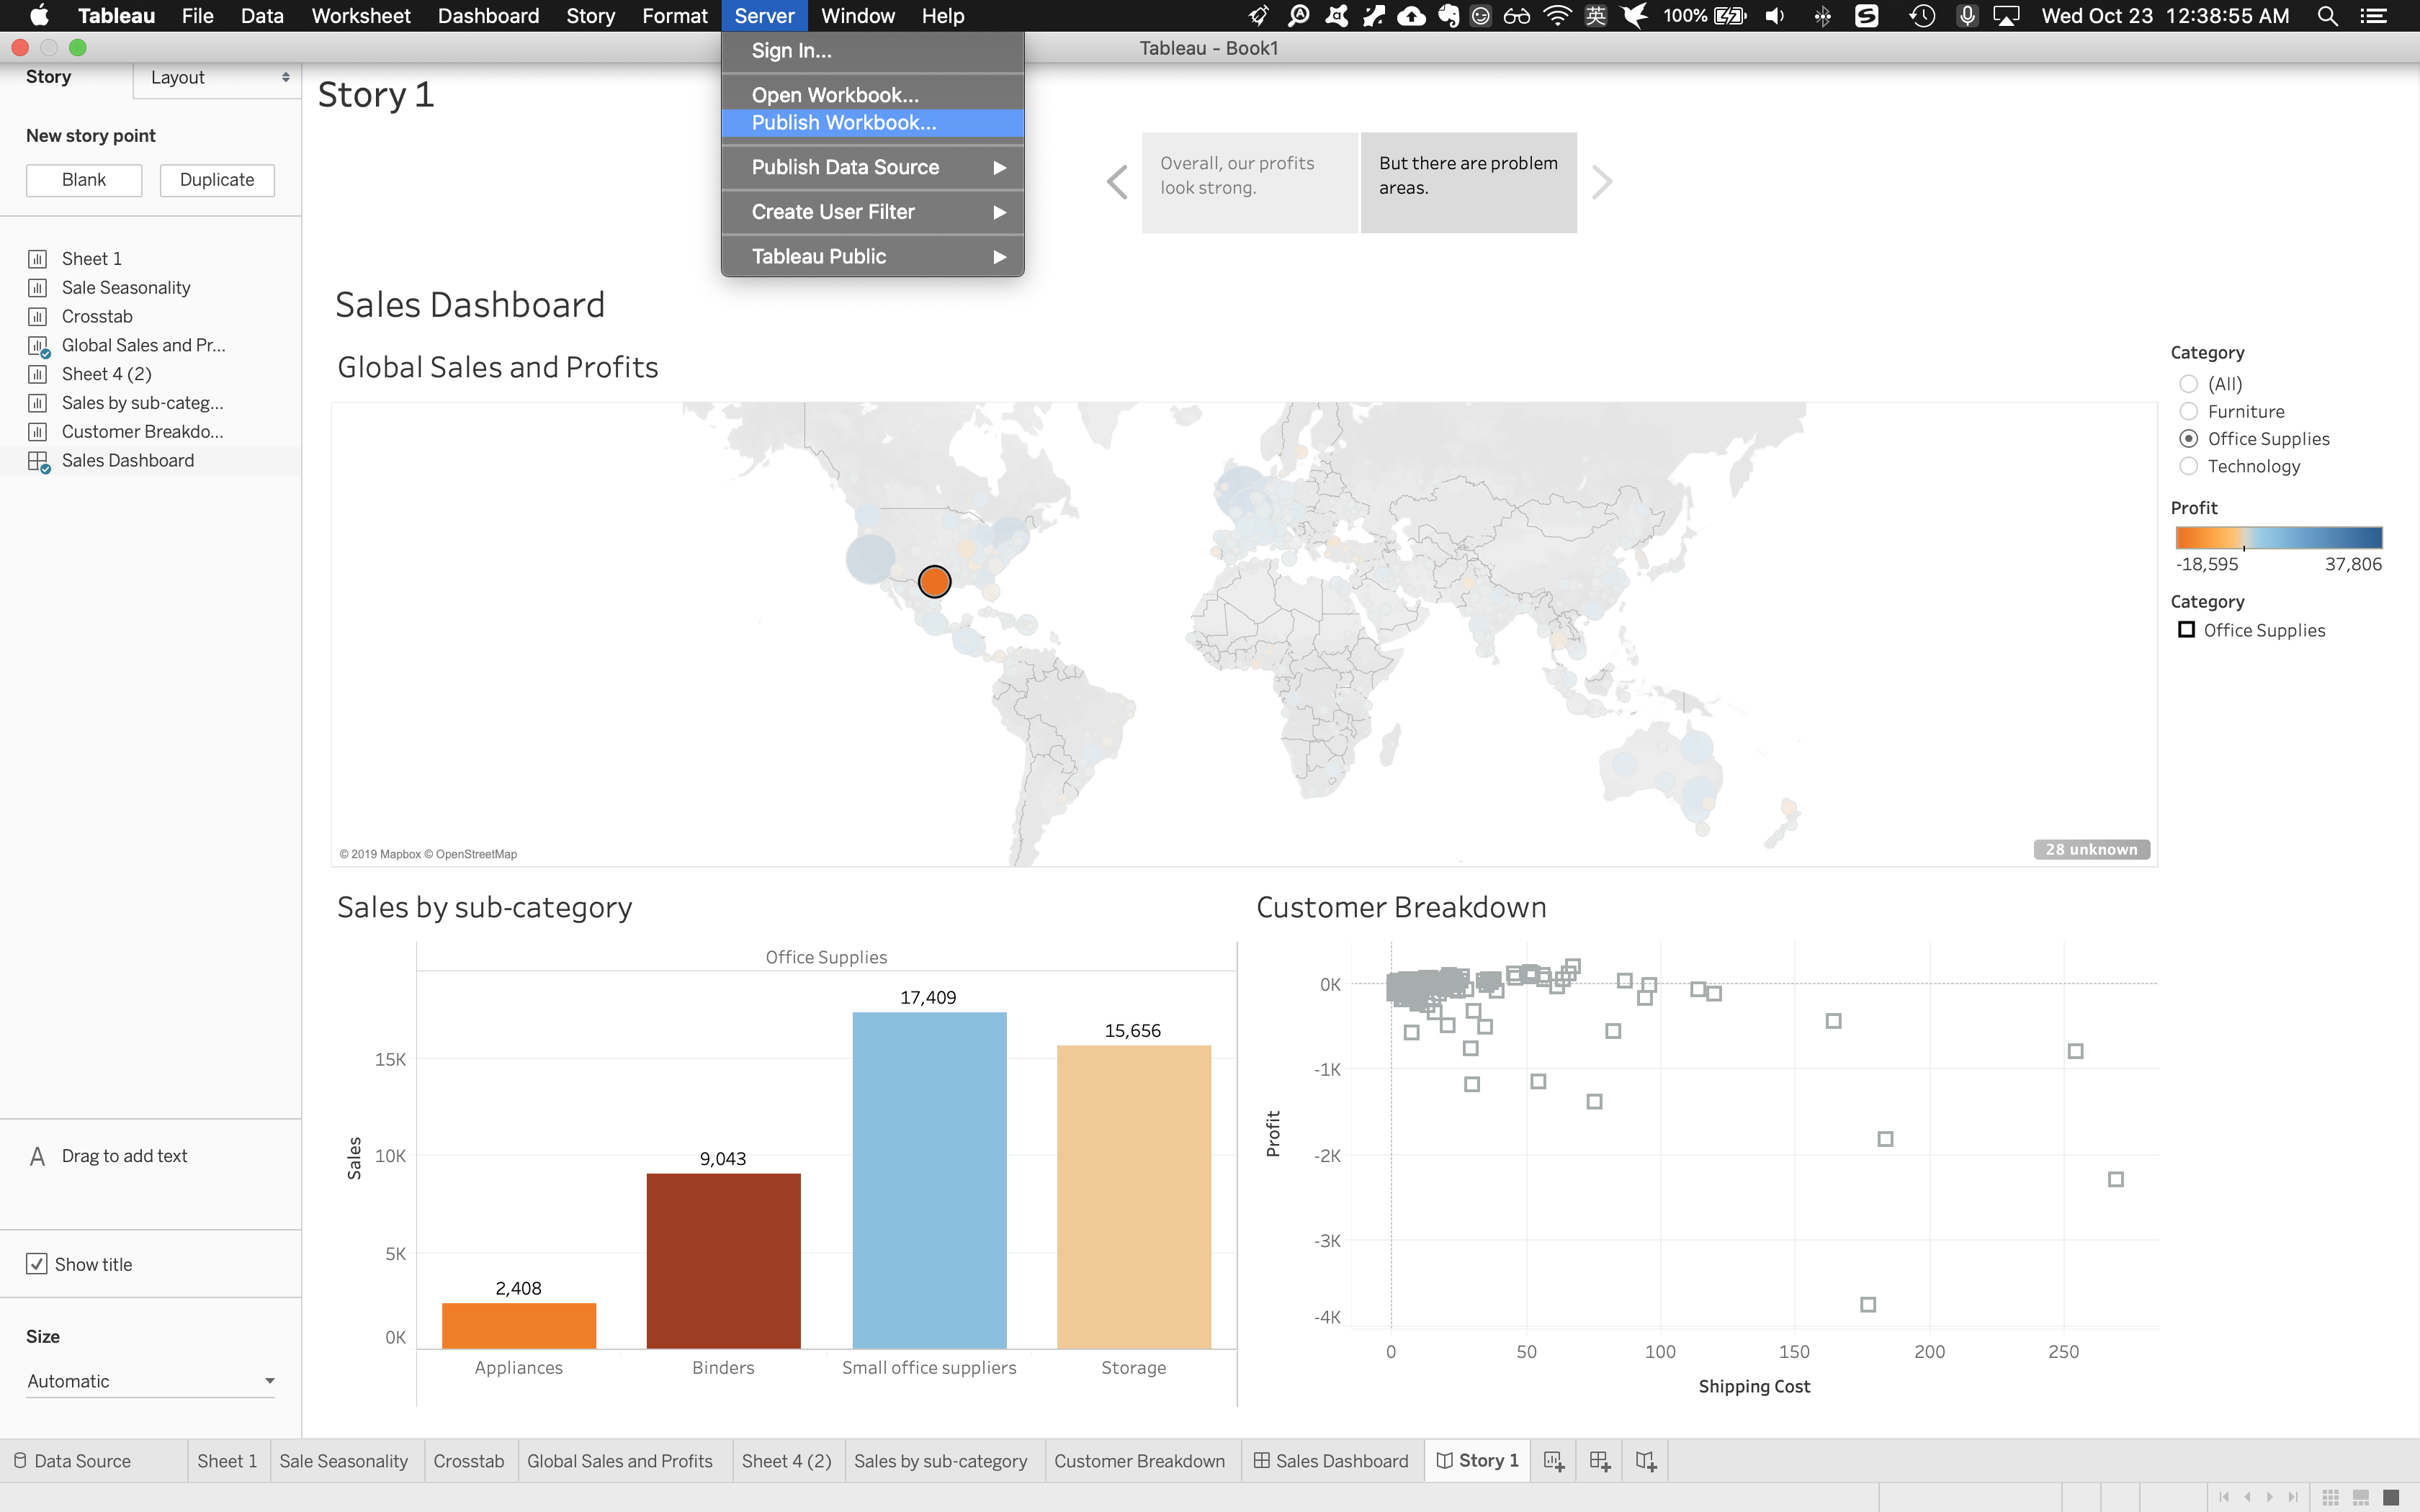
Dashboard Page
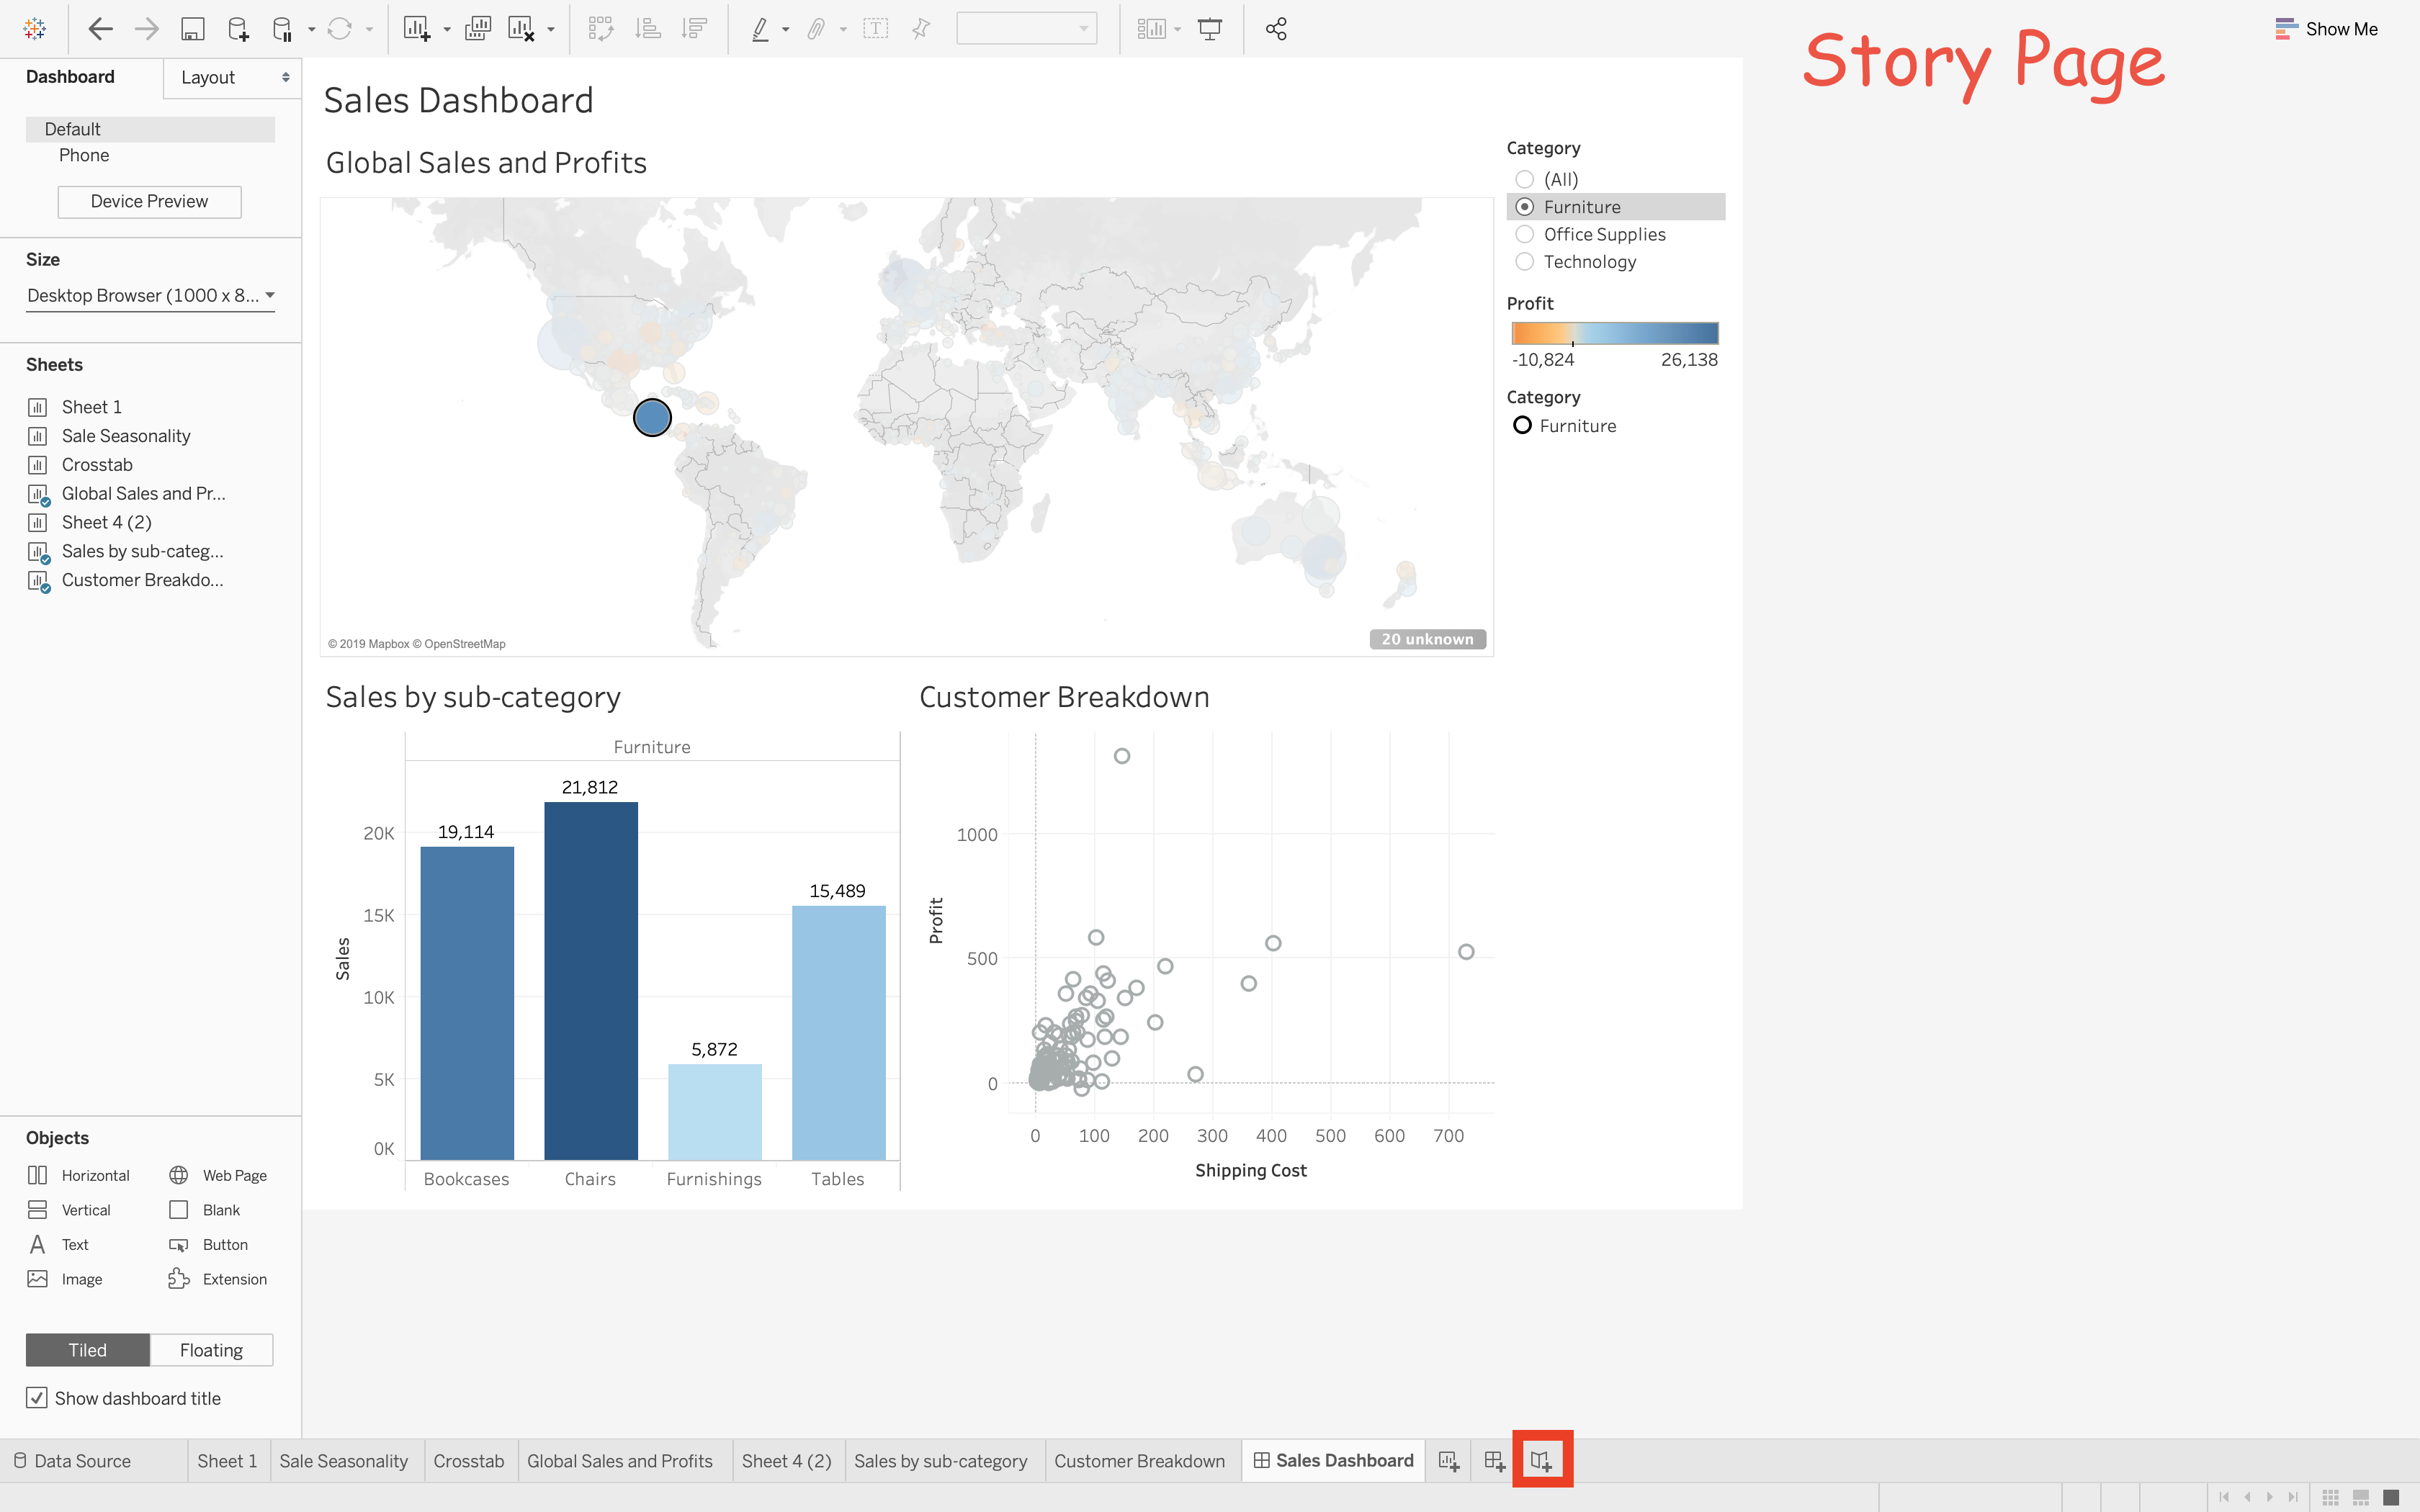
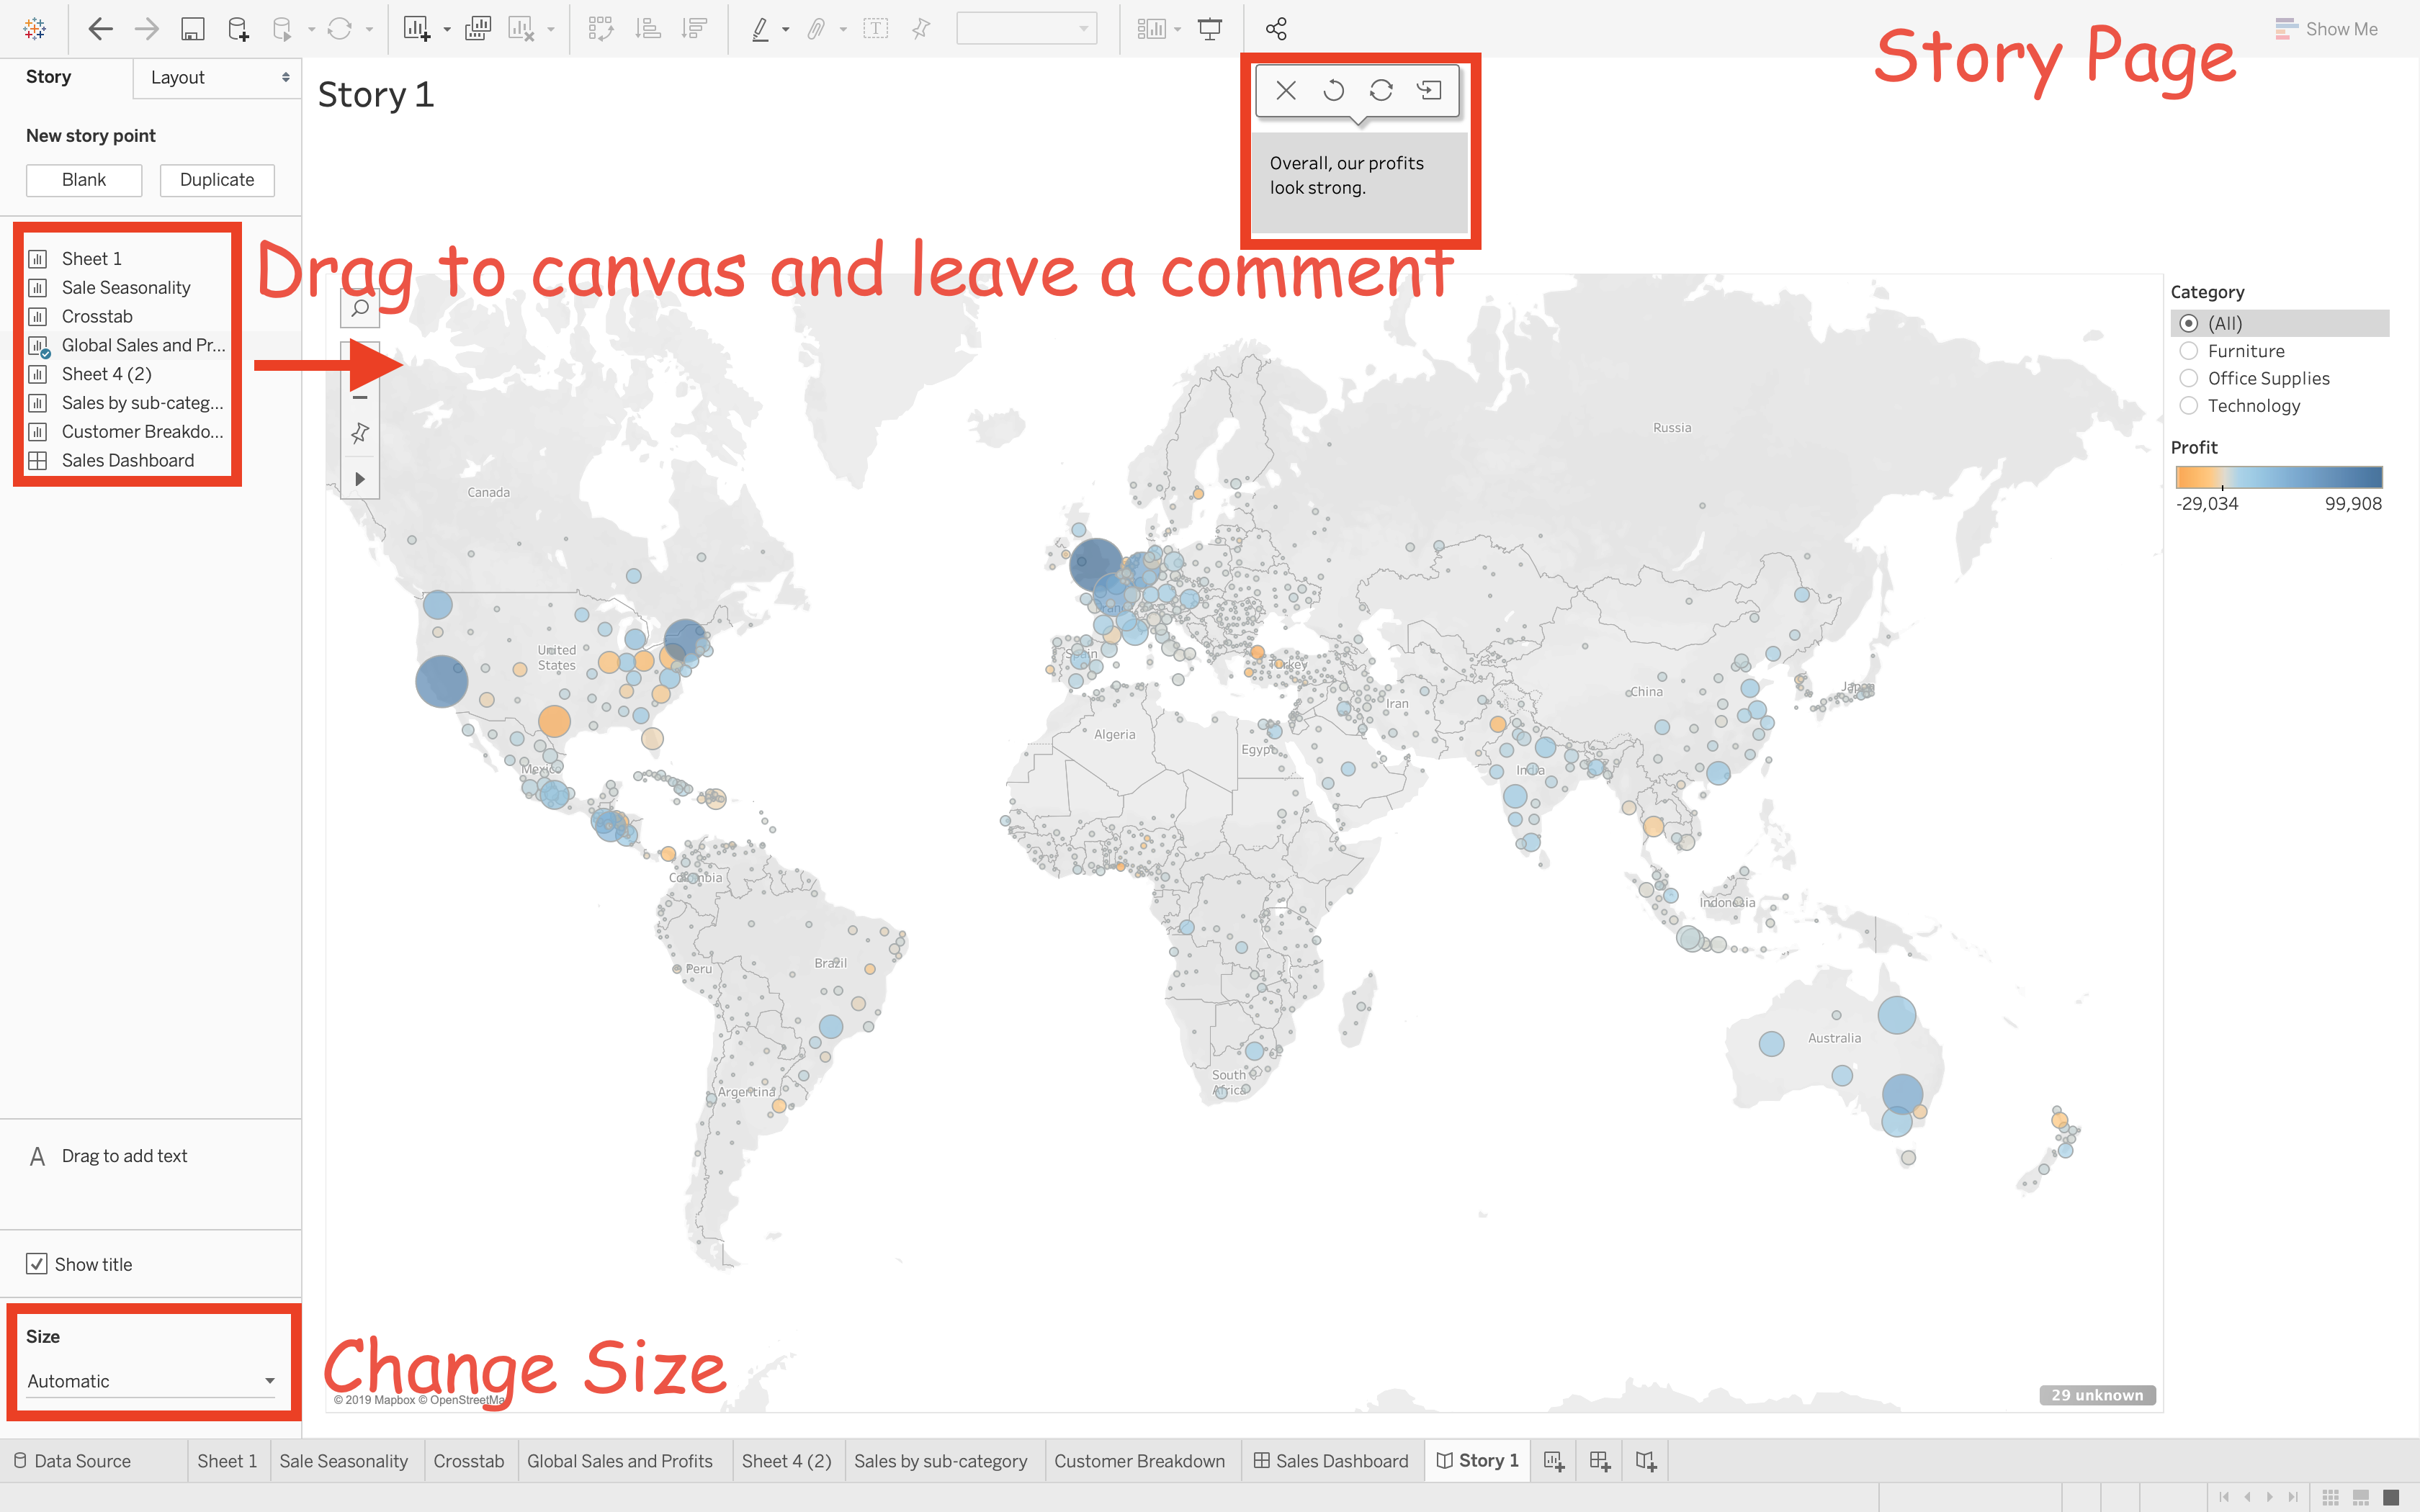
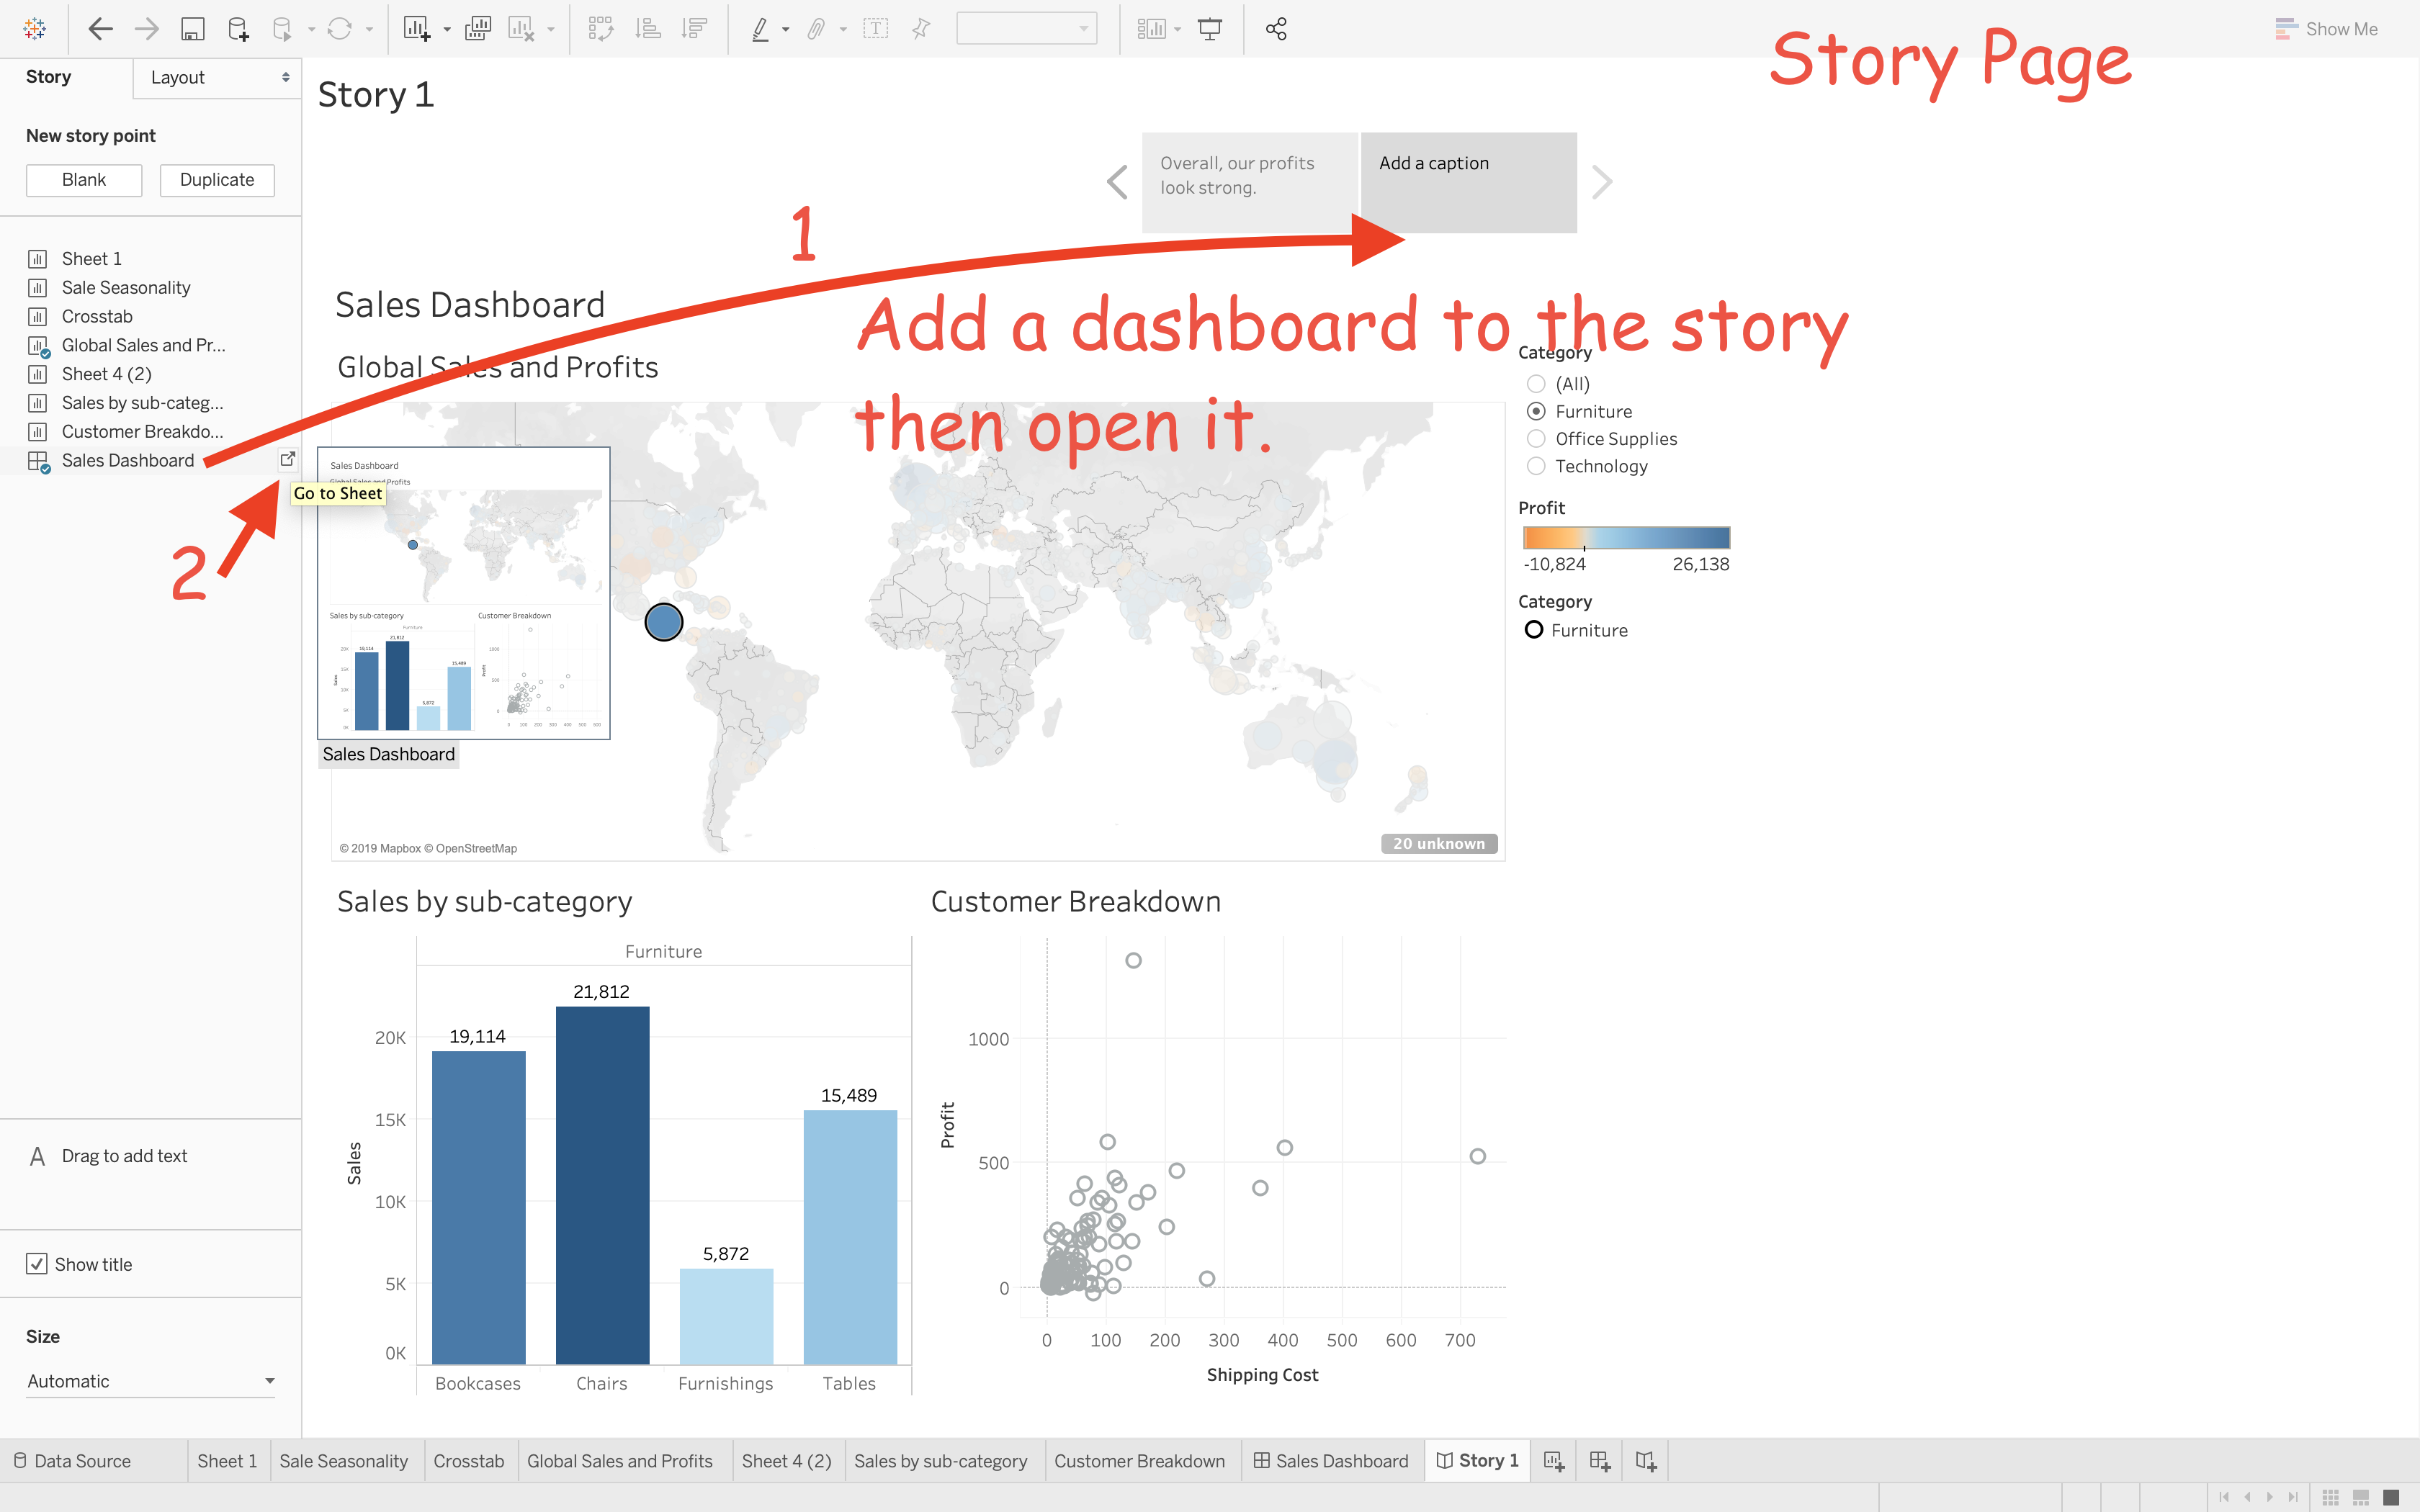
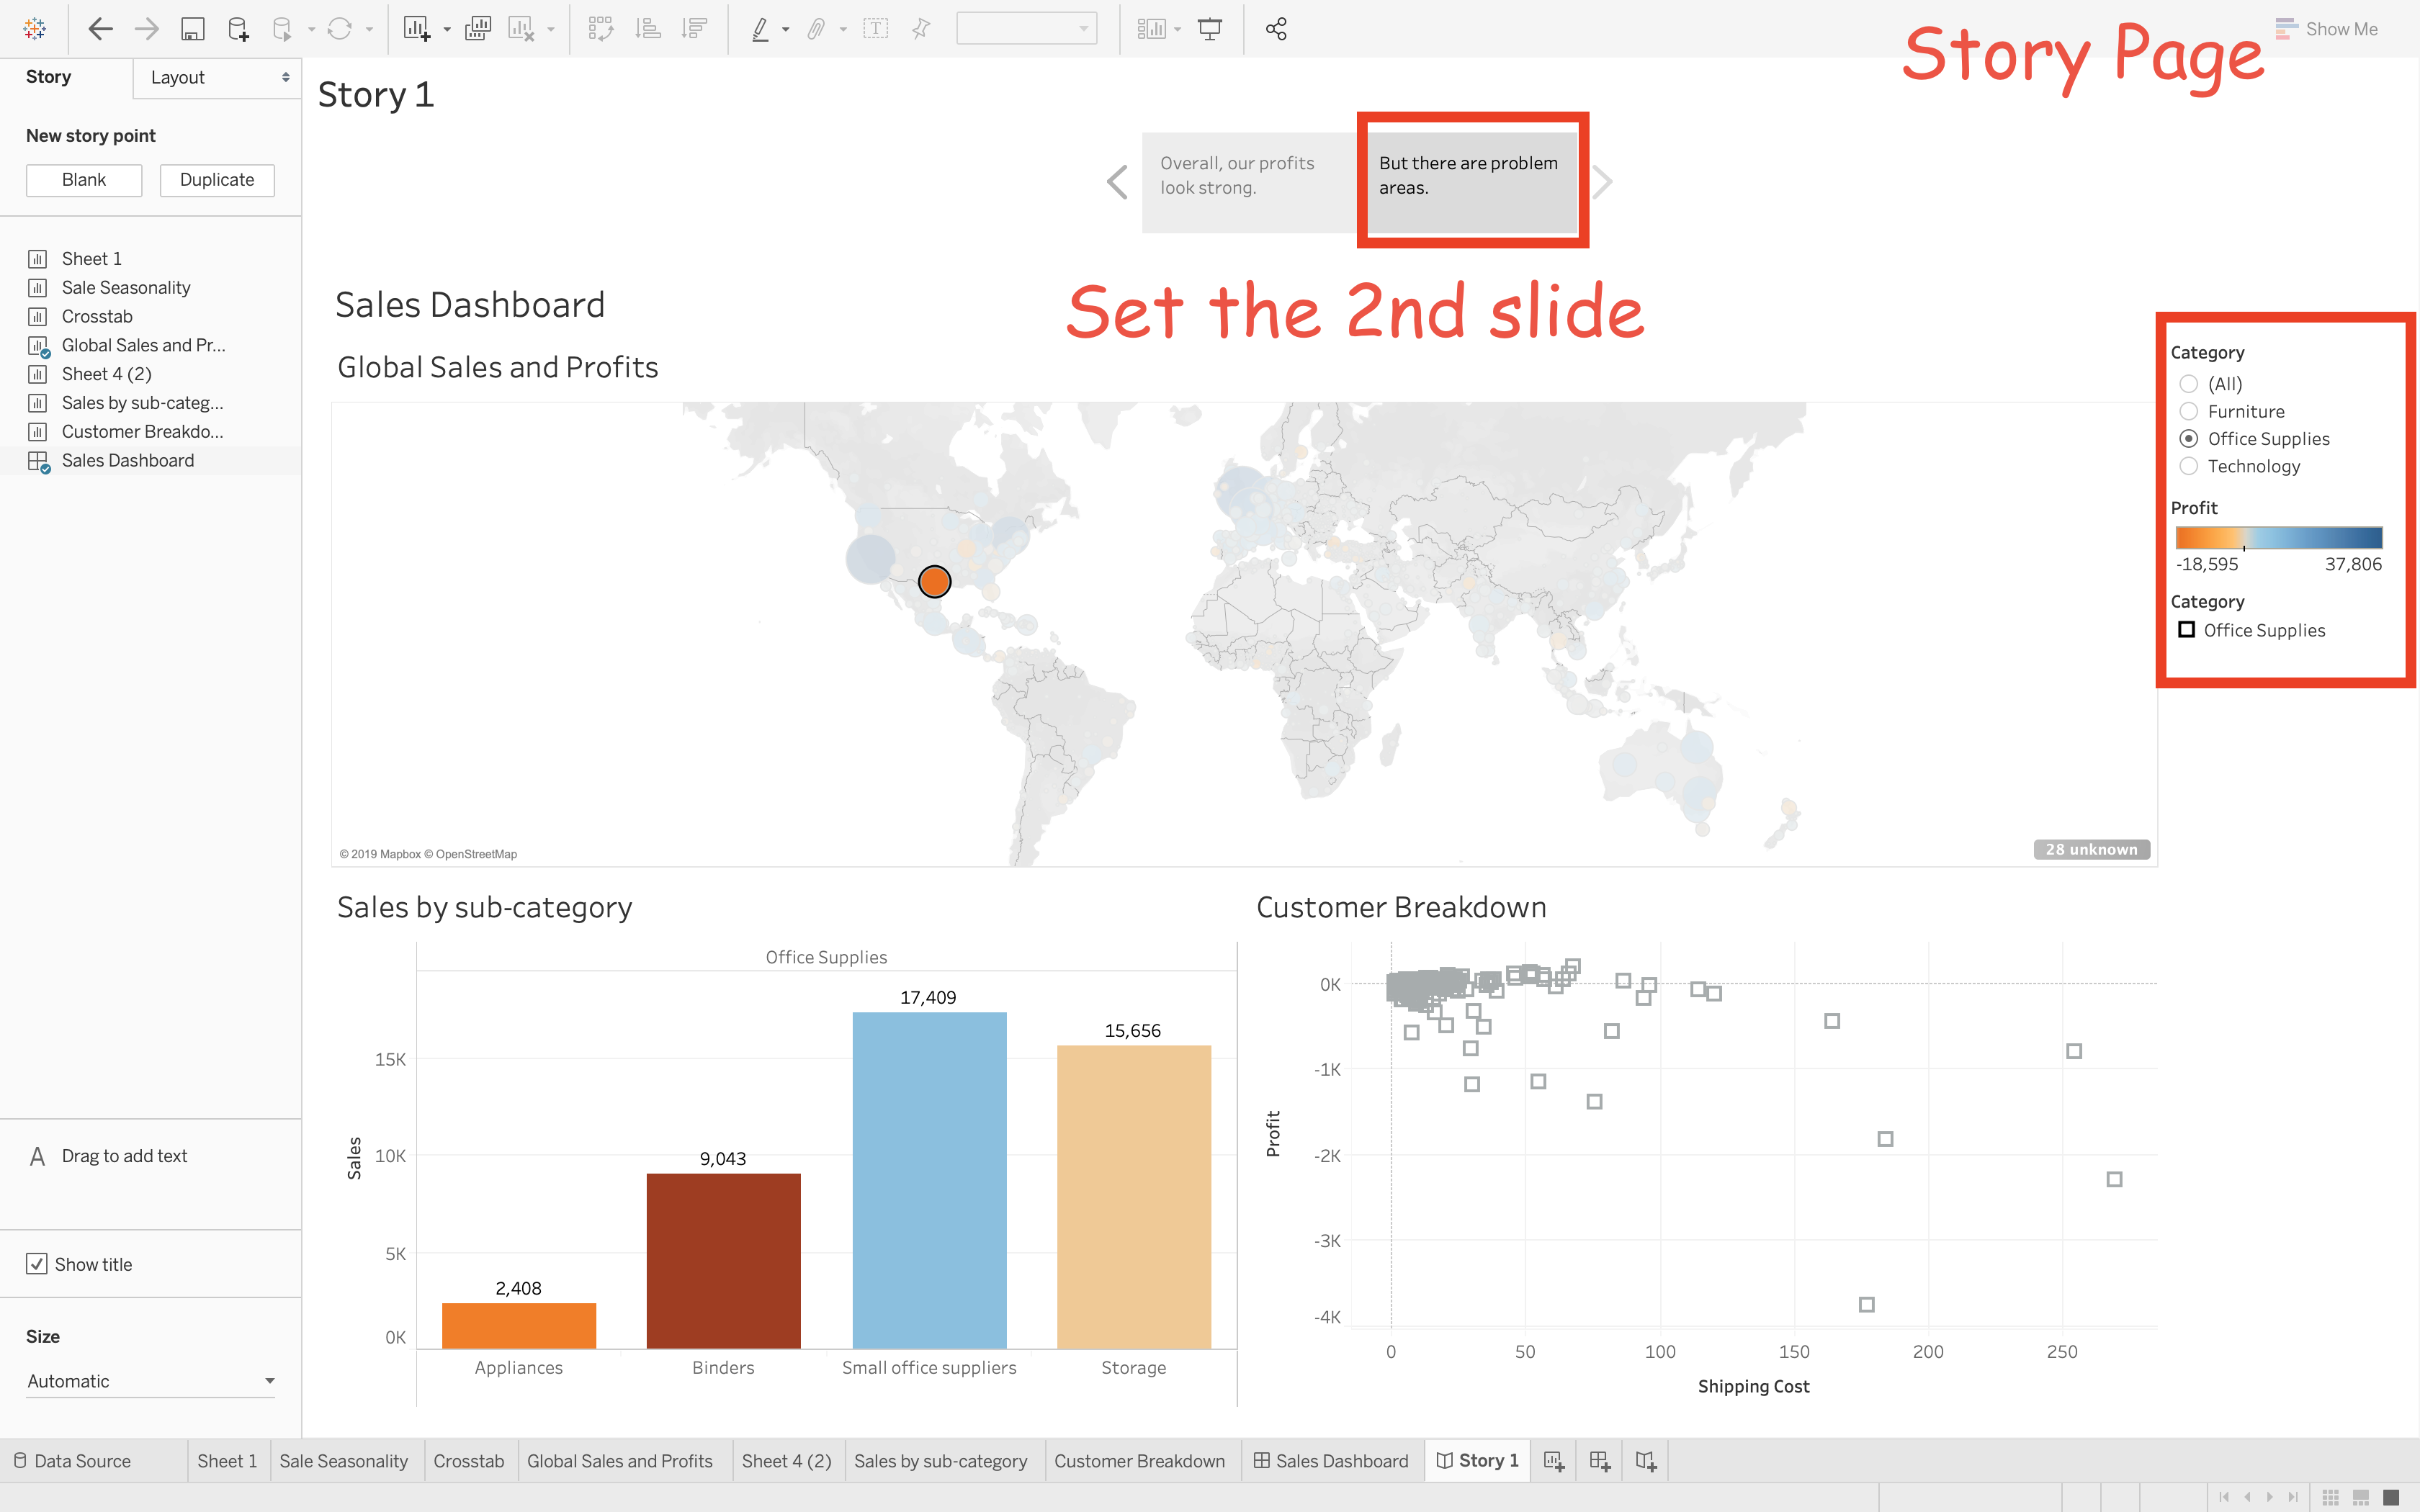
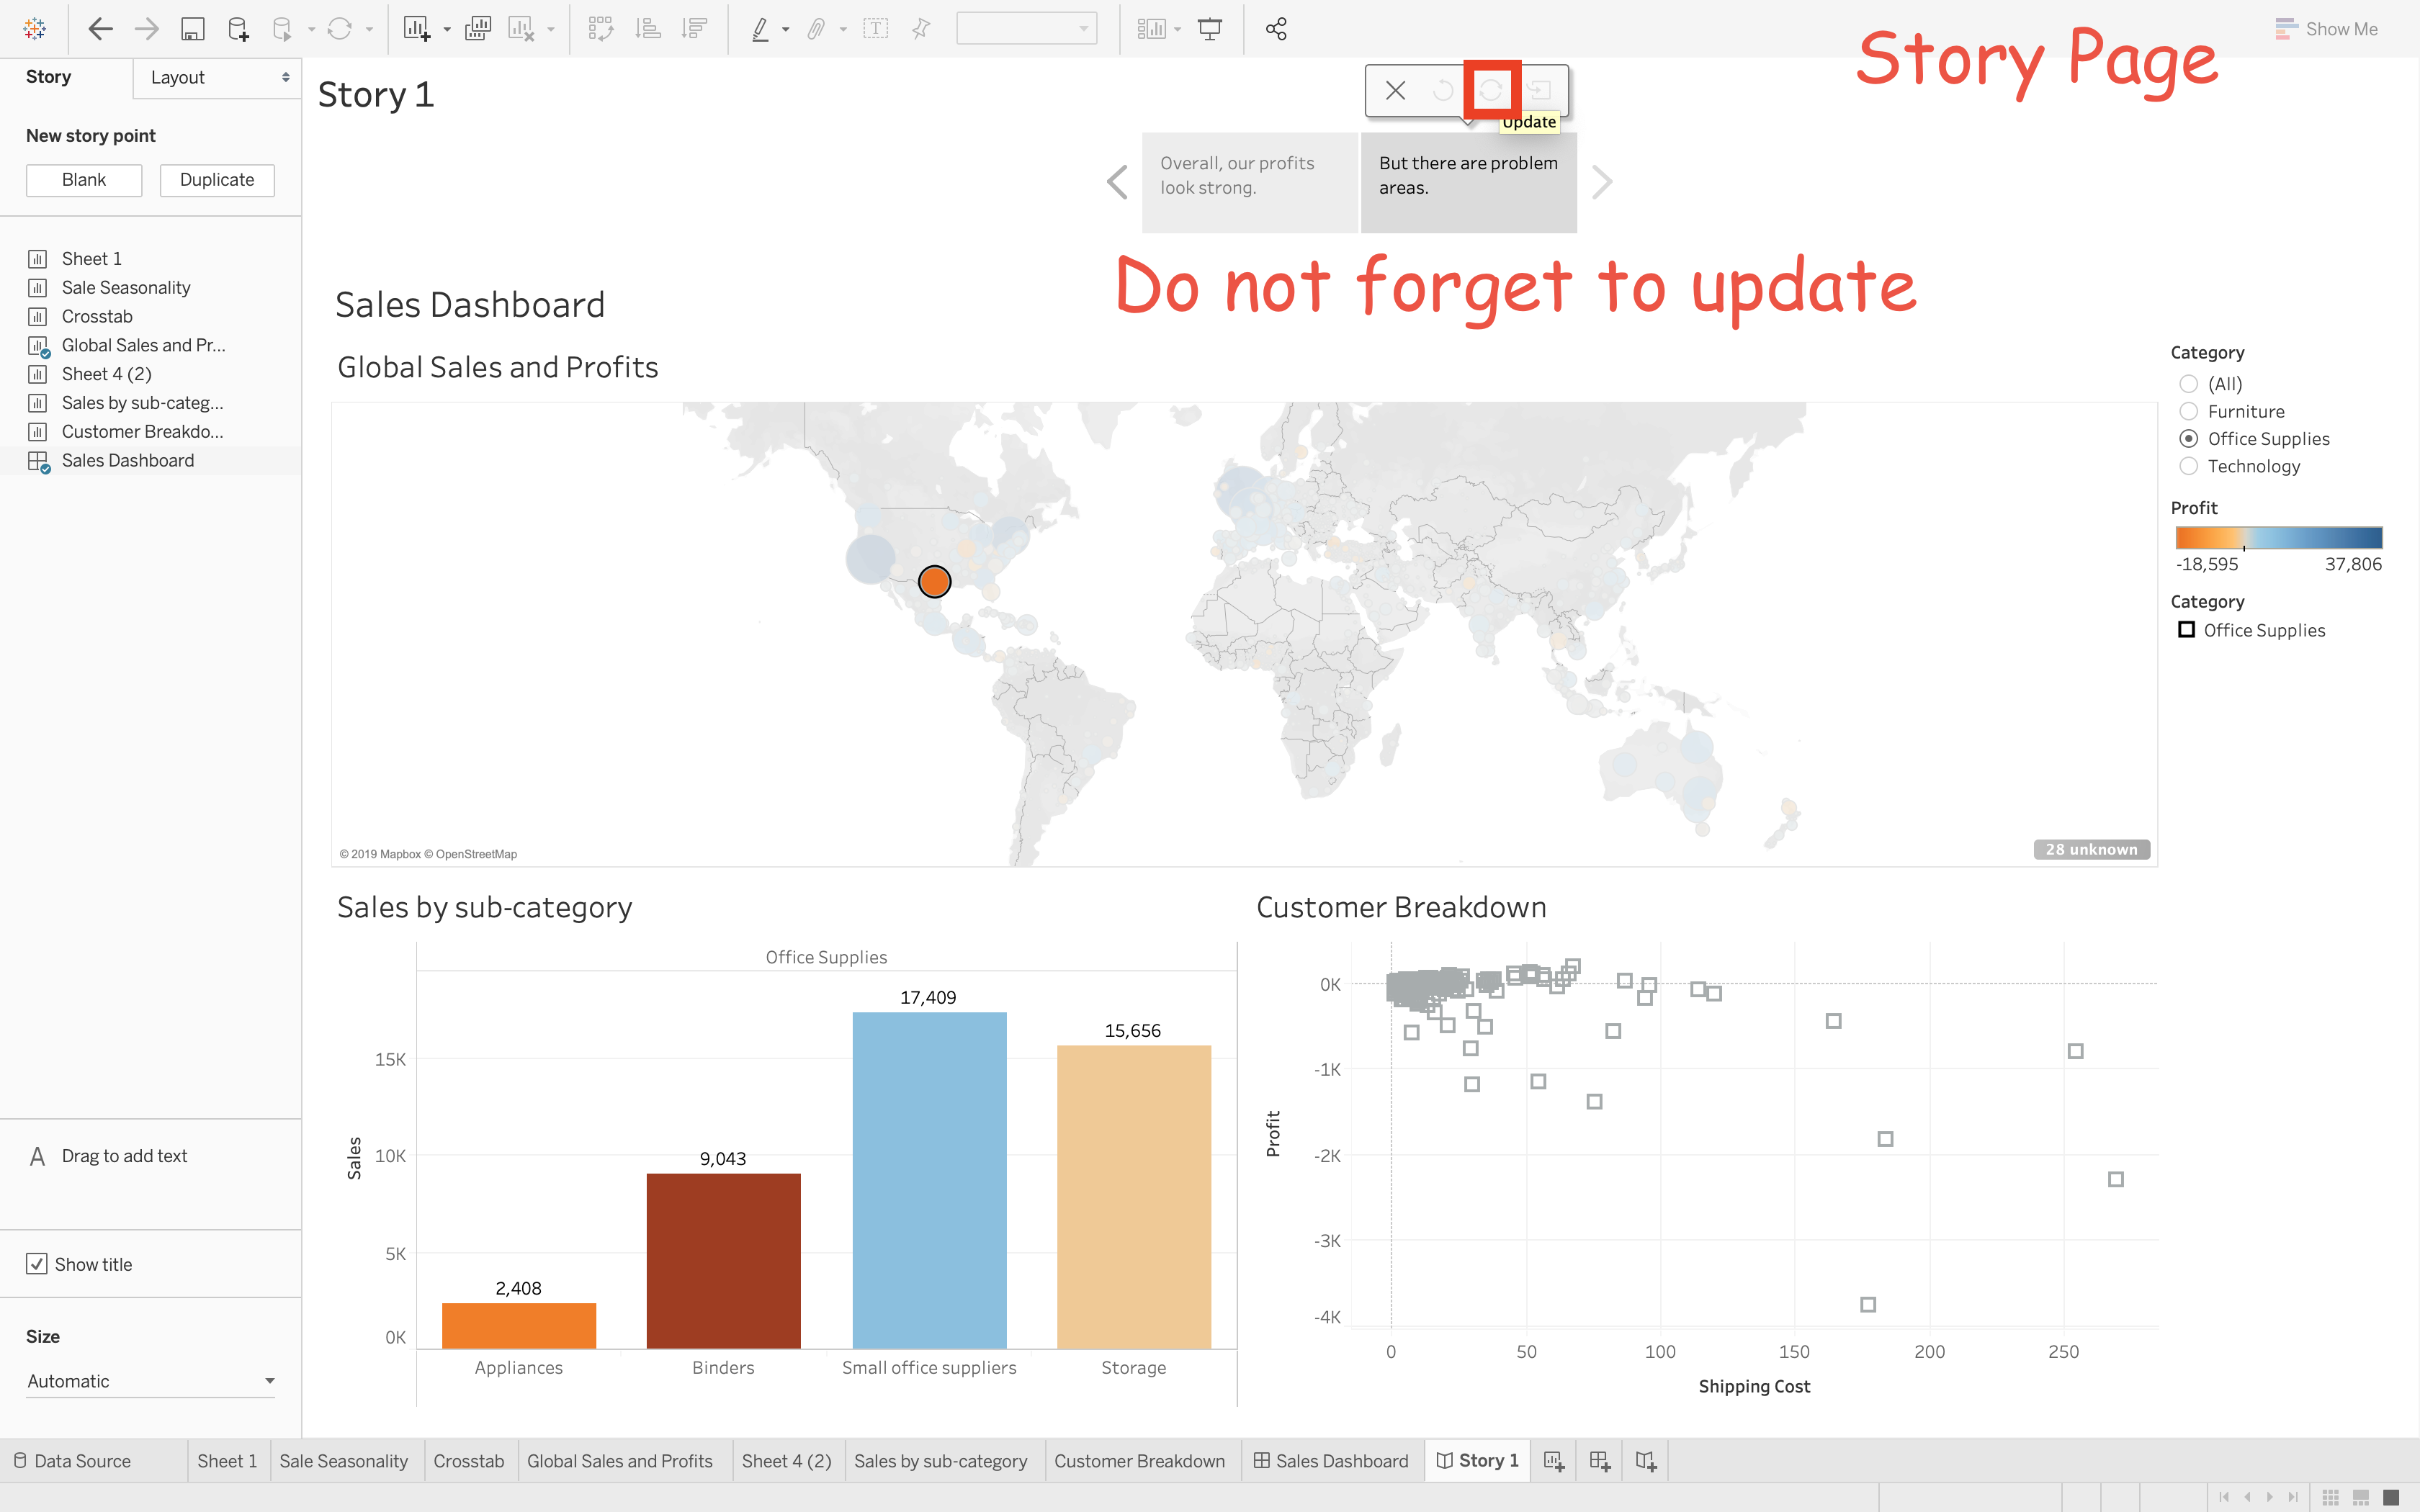
Story Page
Share workbook
Conclusion
During this process, we finally located the issue that the reason of sales fall down not because of the seasonality and the furniture’s shipping cost is to high.