Data-Driven Decision Making
ALY6100
Learning Material
Learning Data Science: Ask Great Questions
Traditional BI Buzzwords for Modern Data Teams
Course
1 Introduction, Objectives, Asking Questions
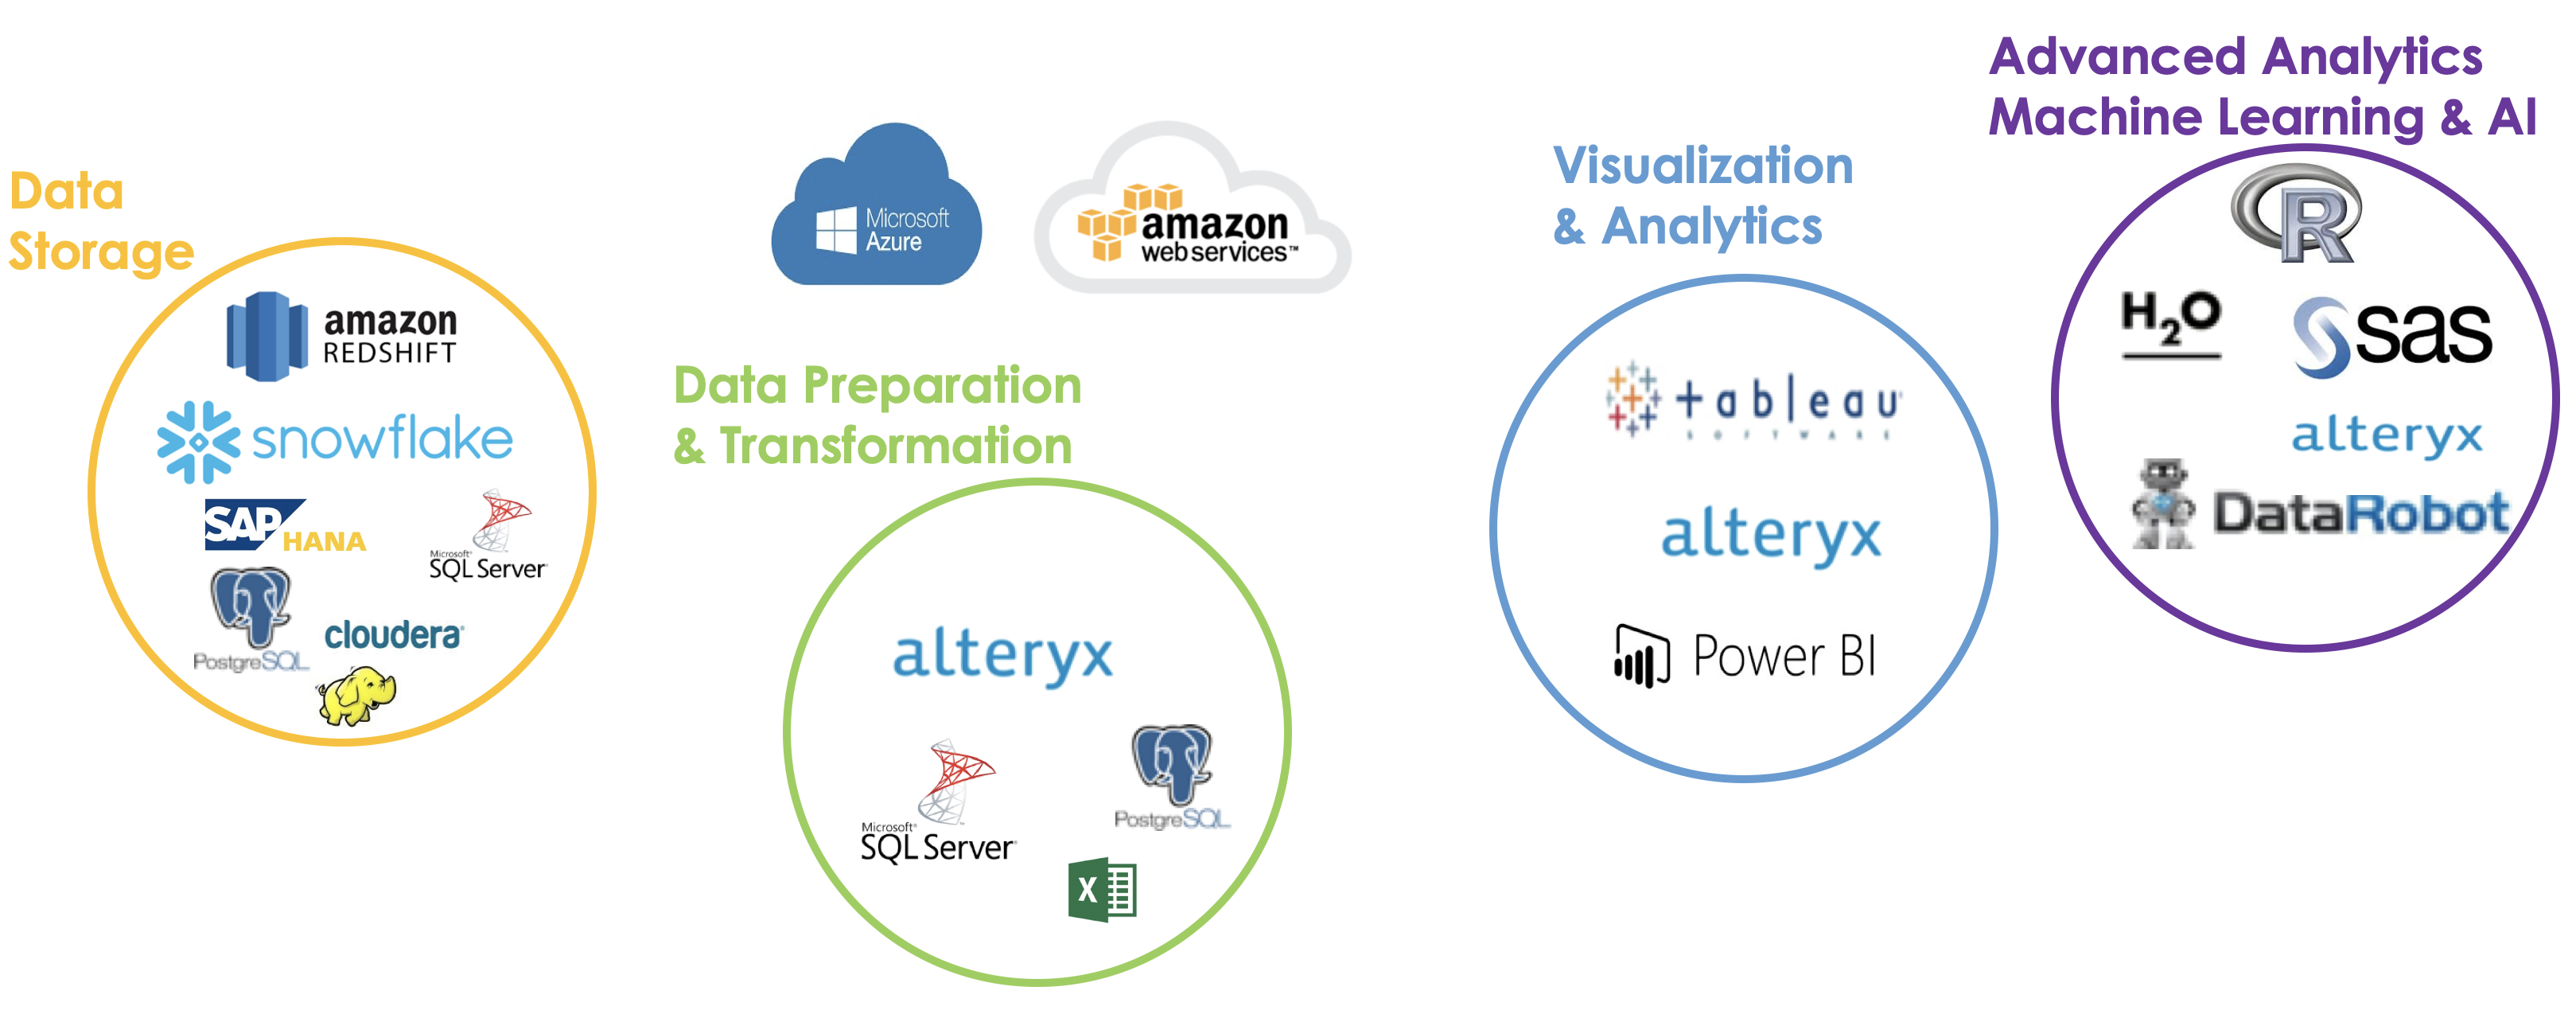
Toolkit Roadmap
Analytic Curve
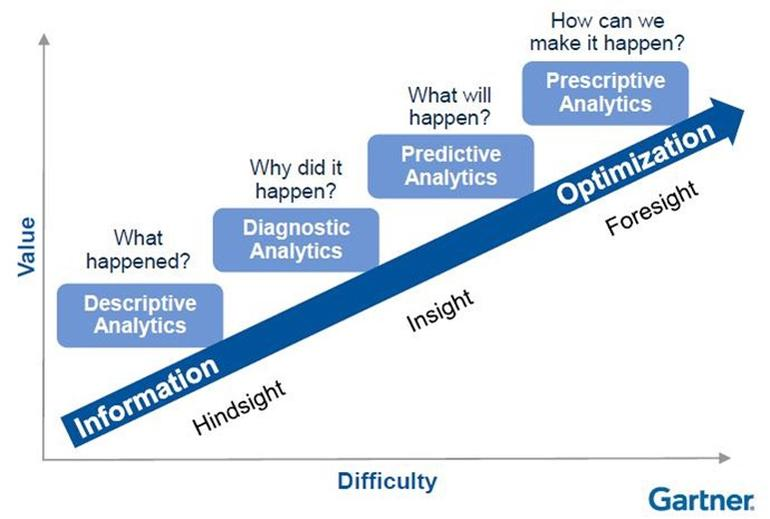
Analytics Curve
Descriptive 99% -> Diagnostic 60% -> Predictive 15-20% -> Prescriptive 1-2%
Descriptive Analytics
- The origin of data discovery
- Broken into 2 parts:
- Basic Statistics
- Data Visualization
- Heart of Data Storytelling
- Helps discover source of truth
- https://www.tableau.com/solutions/customer/pepsico-cuts-analysis-time-90-tableau-trifacta
Diagnostic Analytics
- Help establish source of truth
- Data transformation & reporting stage
- Data Blending
- Tool Comparison (Open Source or Software)
- KPI establishment
- Dashboard creation
- Data Governance becomes a topic
- https://www.alteryx.com/sites/default/files/resources/files/case-study-rosenblatt-securities-inc.pdf
Predict Analytics
- Move from being reactionary to proactive
- Data sources have been cleaned and structured to perform algorithms
- Modeling is easy, interpretation is hard
- Embedding predictive elements into the business
- Send an email alert if we have identified a possible fraudulent charge
- Prioritize which clients we should see in a day
- Rank candidates that we should hire
- https://data-flair.training/blogs/data-science-at-netflix/
Prescriptive Analytics
- Working in a state of full optimization powered by predictive analytics
- What are business models are driven off of
- Which combination of products should I sell to maximize our revenue
- How should I allocate my sales reps based on their strengths and weakness
- What is the best lineup I can put on the field
- Full optimization is not always obtainable
- Restraints (environmental and resources) are present
- Choosing the right levers to pull
Data Collection
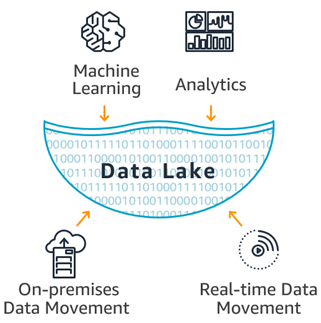
The Mythical Data Lake
Reference: What is a data lake?
What is a data lake?
A data lake is a centralized repository that allows you to store all your structured and unstructured data at any scale. You can store your data as-is, without having to first structure the data, and run different types of analytics—from dashboards and visualizations to big data processing, real-time analytics, and machine learning to guide better decisions.
Why do you need a data lake?
Organizations that successfully generate business value from their data, will outperform their peers. An Aberdeen survey saw organizations who implemented a Data Lake outperforming similar companies by 9% in organic revenue growth. These leaders were able to do new types of analytics like machine learning over new sources like log files, data from click-streams, social media, and internet connected devices stored in the data lake. This helped them to identify, and act upon opportunities for business growth faster by attracting and retaining customers, boosting productivity, proactively maintaining devices, and making informed decisions.
KPI
- Key Performance Indicator
- Metrics that we use to shape the outlook of the business
- KPI’s are not the same for every industry and certainly not for any company
- What do you think are KPI’s for the following companies?
- Apple
- Netflix/Hulu
- Mass General (the hospital)
How Are KPI’s Established
- Level 1 of the Analytics Maturity Curve: Descriptive Analytics
- What does success look like
- What variables have a correlation with that success metric
- Do we spot any trends?
- Most of this will be discovered through data visualization but other metrics can be found by…
- Looking at summary statistics
- Accuracy of forecasts
- External/Industry reviews
Why Building A Data Warehouse Is Hard
- How are we ingesting the data?
- Are we ingesting the data in raw
- Where are we building in business rules
- How do we handle Excel files that are not automated?
- Do we need to hire a DBA or consulting company?
- Most companies just go for the temporary fix
- Amazon S3
- Microsoft Access
2 Data Collection and Management, Defining Metrics
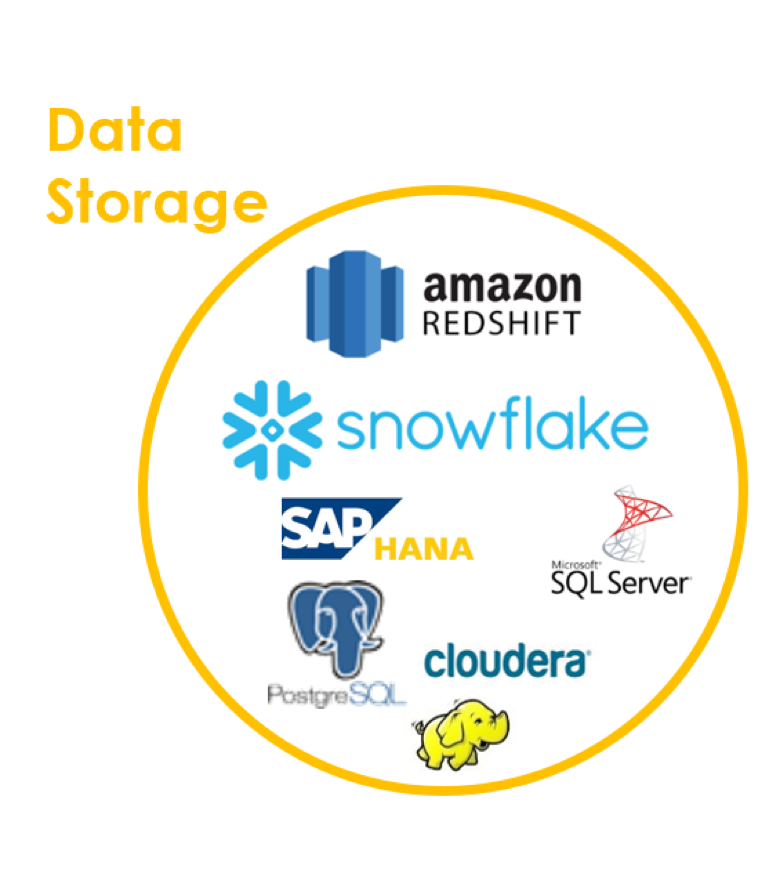
Data Storage
Relational Databases
- Matching Tables of Data By Key Words or Terms
- Day=Day, Name=Name
- Most Traditional Database
- Uses SQL language to query
- Not ideal for unstructured data
Cloud Vs On Prem – Relational DB
- Biggest question right now in data!
- Each has their own advantages and disadvantages
- On Prem -> Controlled Center of IT, Reduces leakage
- Cloud -> Quicker, On demand calls, Less IT
Cloud Options
On Prem Options
Non Relational Databases
- Been on a bunch of highs and lows for the last few years
- Built to handle big data
- IOT focused
- Images, Video, Sound
- Data is researched by keys not joins
- Tougher to query or get data out of
Non Relational Database Examples
Case Study
1
Netflix
- The Netflix Prize: How a $1 Million Contest Changed Binge-Watching Forever
- Netflix Recommendations: Beyond the 5 stars (Part 1)
- Netflix Recommendations: Beyond the 5 stars (Part 2)
why does Netflix pay for a recommendation system? e.g., why not pay for more exclusive show?
why does Netflix set a prize?
In October 2006, Netflix, then a service peddling discs of every movie and TV show under the sun, announced “The Netflix Prize,”
The mission: Make the company’s recommendation engine 10% more accurate – or die coding
over 100 million ratings of 17,770 movies from 480,189 customers
Why the hell would a tech giant even do that? While it’s common for successful corporations to protect their data like pirates guarding treasure
the five-star ratings would be replaced with a new thumbs-up-or-down system
Later in the competition, factors like what day users rated a movie on – maybe you’re a crankier critic on Mondays – were incorporated into mathematical models built during late night coding sessions.
That shift – from the crowdsourced wild west of a web forum to the benignly smooth aesthetics of a Medium post – perhaps signals a larger change in online culture. Netflix is a completely different company now, a major player in Hollywood and a cable TV disruptor. With over 100 million global subscribers, the former DVD-mailing enterprise is now, by most recent estimates, worth more than $70 billion.
production environment
50 billions
From US DVDs to Global Streaming
One of the reasons our focus in the recommendation algorithms has changed is because Netflix as a whole has changed dramatically in the last few years. Netflix launched an instant streaming service in 2007, one year after the Netflix Prize began. Streaming has not only changed the way our members interact with the service, but also the type of data available to use in our algorithms. For DVDs our goal is to help people fill their queue with titles to receive in the mail over the coming days and weeks; selection is distant in time from viewing, people select carefully because exchanging a DVD for another takes more than a day, and we get no feedback during viewing. For streaming members are looking for something great to watch right now; they can sample a few videos before settling on one, they can consume several in one session, and we can observe viewing statistics such as whether a video was watched fully or only partially.
Another big change was the move from a single website into hundreds of devices. The integration with the Roku player and the Xbox were announced in 2008, two years into the Netflix competition. Just a year later, Netflix streaming made it into the iPhone. Now it is available on a multitude of devices that go from a myriad of Android devices to the latest AppleTV.
Now it is clear that the Netflix Prize objective, accurate prediction of a movie’s rating, is just one of the many components of an effective recommendation system that optimizes our members enjoyment. We also need to take into account factors such as context, title popularity, interest, evidence, novelty, diversity, and freshness. Supporting all the different contexts in which we want to make recommendations requires a range of algorithms that are tuned to the needs of those contexts. In the next part of this post, we will talk in more detail about the ranking problem. We will also dive into the data and models that make all the above possible and discuss our approach to innovating in this space.
In other words, in our simple two-dimensional model, how do we determine whether popularity is more or less important than predicted rating?
Data and Models
The previous discussion on the ranking algorithms highlights the importance of both data and models in creating an optimal personalized experience for our members. At Netflix, we are fortunate to have many relevant data sources and smart people who can select optimal algorithms to turn data into product features. Here are some of the data sources we can use to optimize our recommendations:
We have several billion item ratings from members. And we receive millions of new ratings a day.
We already mentioned item popularity as a baseline. But, there are many ways to compute popularity. We can compute it over various time ranges, for instance hourly, daily, or weekly. Or, we can group members by region or other similarity metrics and compute popularity within that group.
We receive several million stream plays each day, which include context such as duration, time of day and device type.
Our members add millions of items to their queues each day.
Each item in our catalog has rich metadata: actors, director, genre, parental rating, and reviews.
Presentations: We know what items we have recommended and where we have shown them, and can look at how that decision has affected the member’s actions. We can also observe the member’s interactions with the recommendations: scrolls, mouse-overs, clicks, or the time spent on a given page.
Social data has become our latest source of personalization features; we can process what connected friends have watched or rated.
Our members directly enter millions of search terms in the Netflix service each day.
All the data we have mentioned above comes from internal sources. We can also tap into external data to improve our features. For example, we can add external item data features such as box office performance or critic reviews.
Of course, that is not all: there are many other features such as demographics, location, language, or temporal data that can be used in our predictive models.
So, what about the models? One thing we have found at Netflix is that with the great availability of data, both in quantity and types, a thoughtful approach is required to model selection, training, and testing. We use all sorts of machine learning approaches: From unsupervised methods such as clustering algorithms to a number of supervised classifiers that have shown optimal results in various contexts. This is an incomplete list of methods you should probably know about if you are working in machine learning for personalization:
Linear regression
Logistic regression
Elastic nets
Singular Value Decomposition
Restricted Boltzmann Machines
Markov Chains
Latent Dirichlet Allocation
Association Rules
Gradient Boosted Decision Trees
Random Forests
Clustering techniques from the simple k-means to novel graphical approaches such as Affinity Propagation
Matrix factorization
Supplemental Materials
Asking Great Data Science Questions
Learning Data Science: Ask Great Questions by Roug Rose
Great data science discoveries are often traced back to someone asking a critical question. That’s why it’s important for your team to use critical thinking to come up with astute, meaningful questions that add real value. A well-crafted question can prevent your team from getting sidetracked on bad assumptions and false conclusions. In this course, author Doug Rose explores the key components of critical reasoning and how to pan for gold in streams of data to search for new questions. You’ll learn how to work together as a team to run question meetings, organize important ideas into question trees, and generate quality questions by clarifying key terms, challenging evidence, uncovering misleading statistics, and more.
1. Apply Critical Thinking
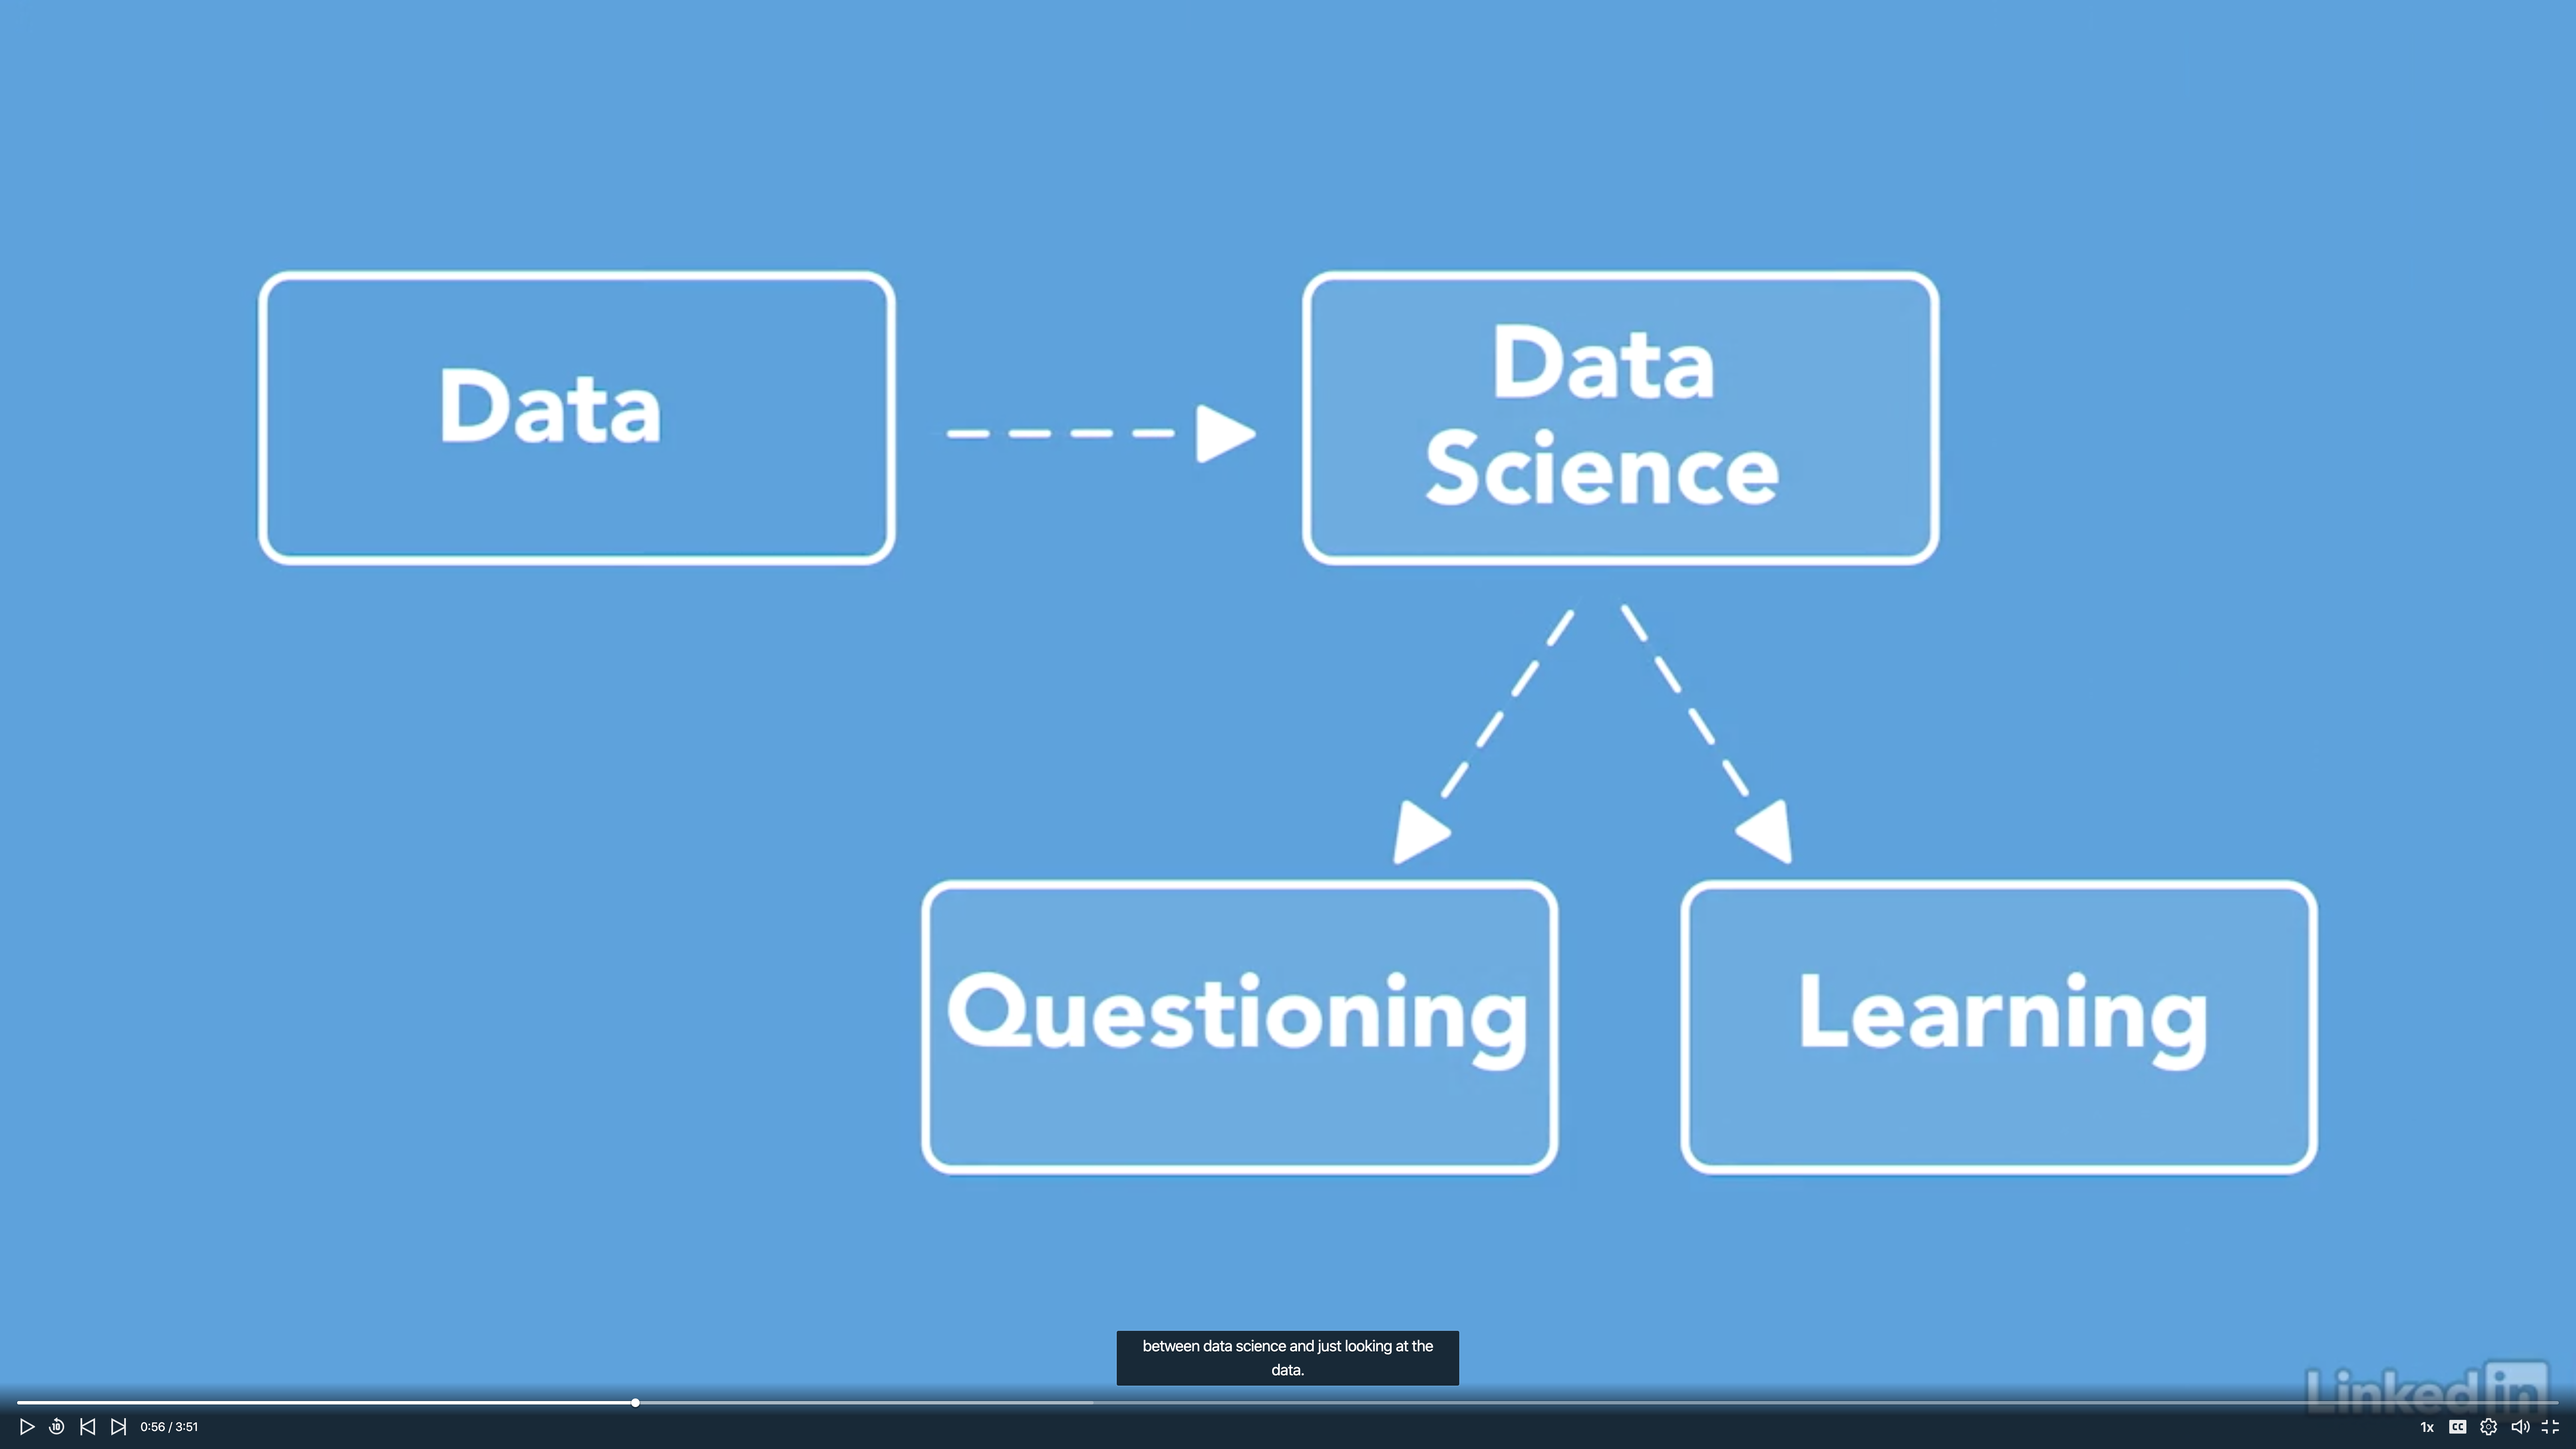
Harness the power of questions
Data science team should create an environment that’s open to interesting questions.
Pan for gold
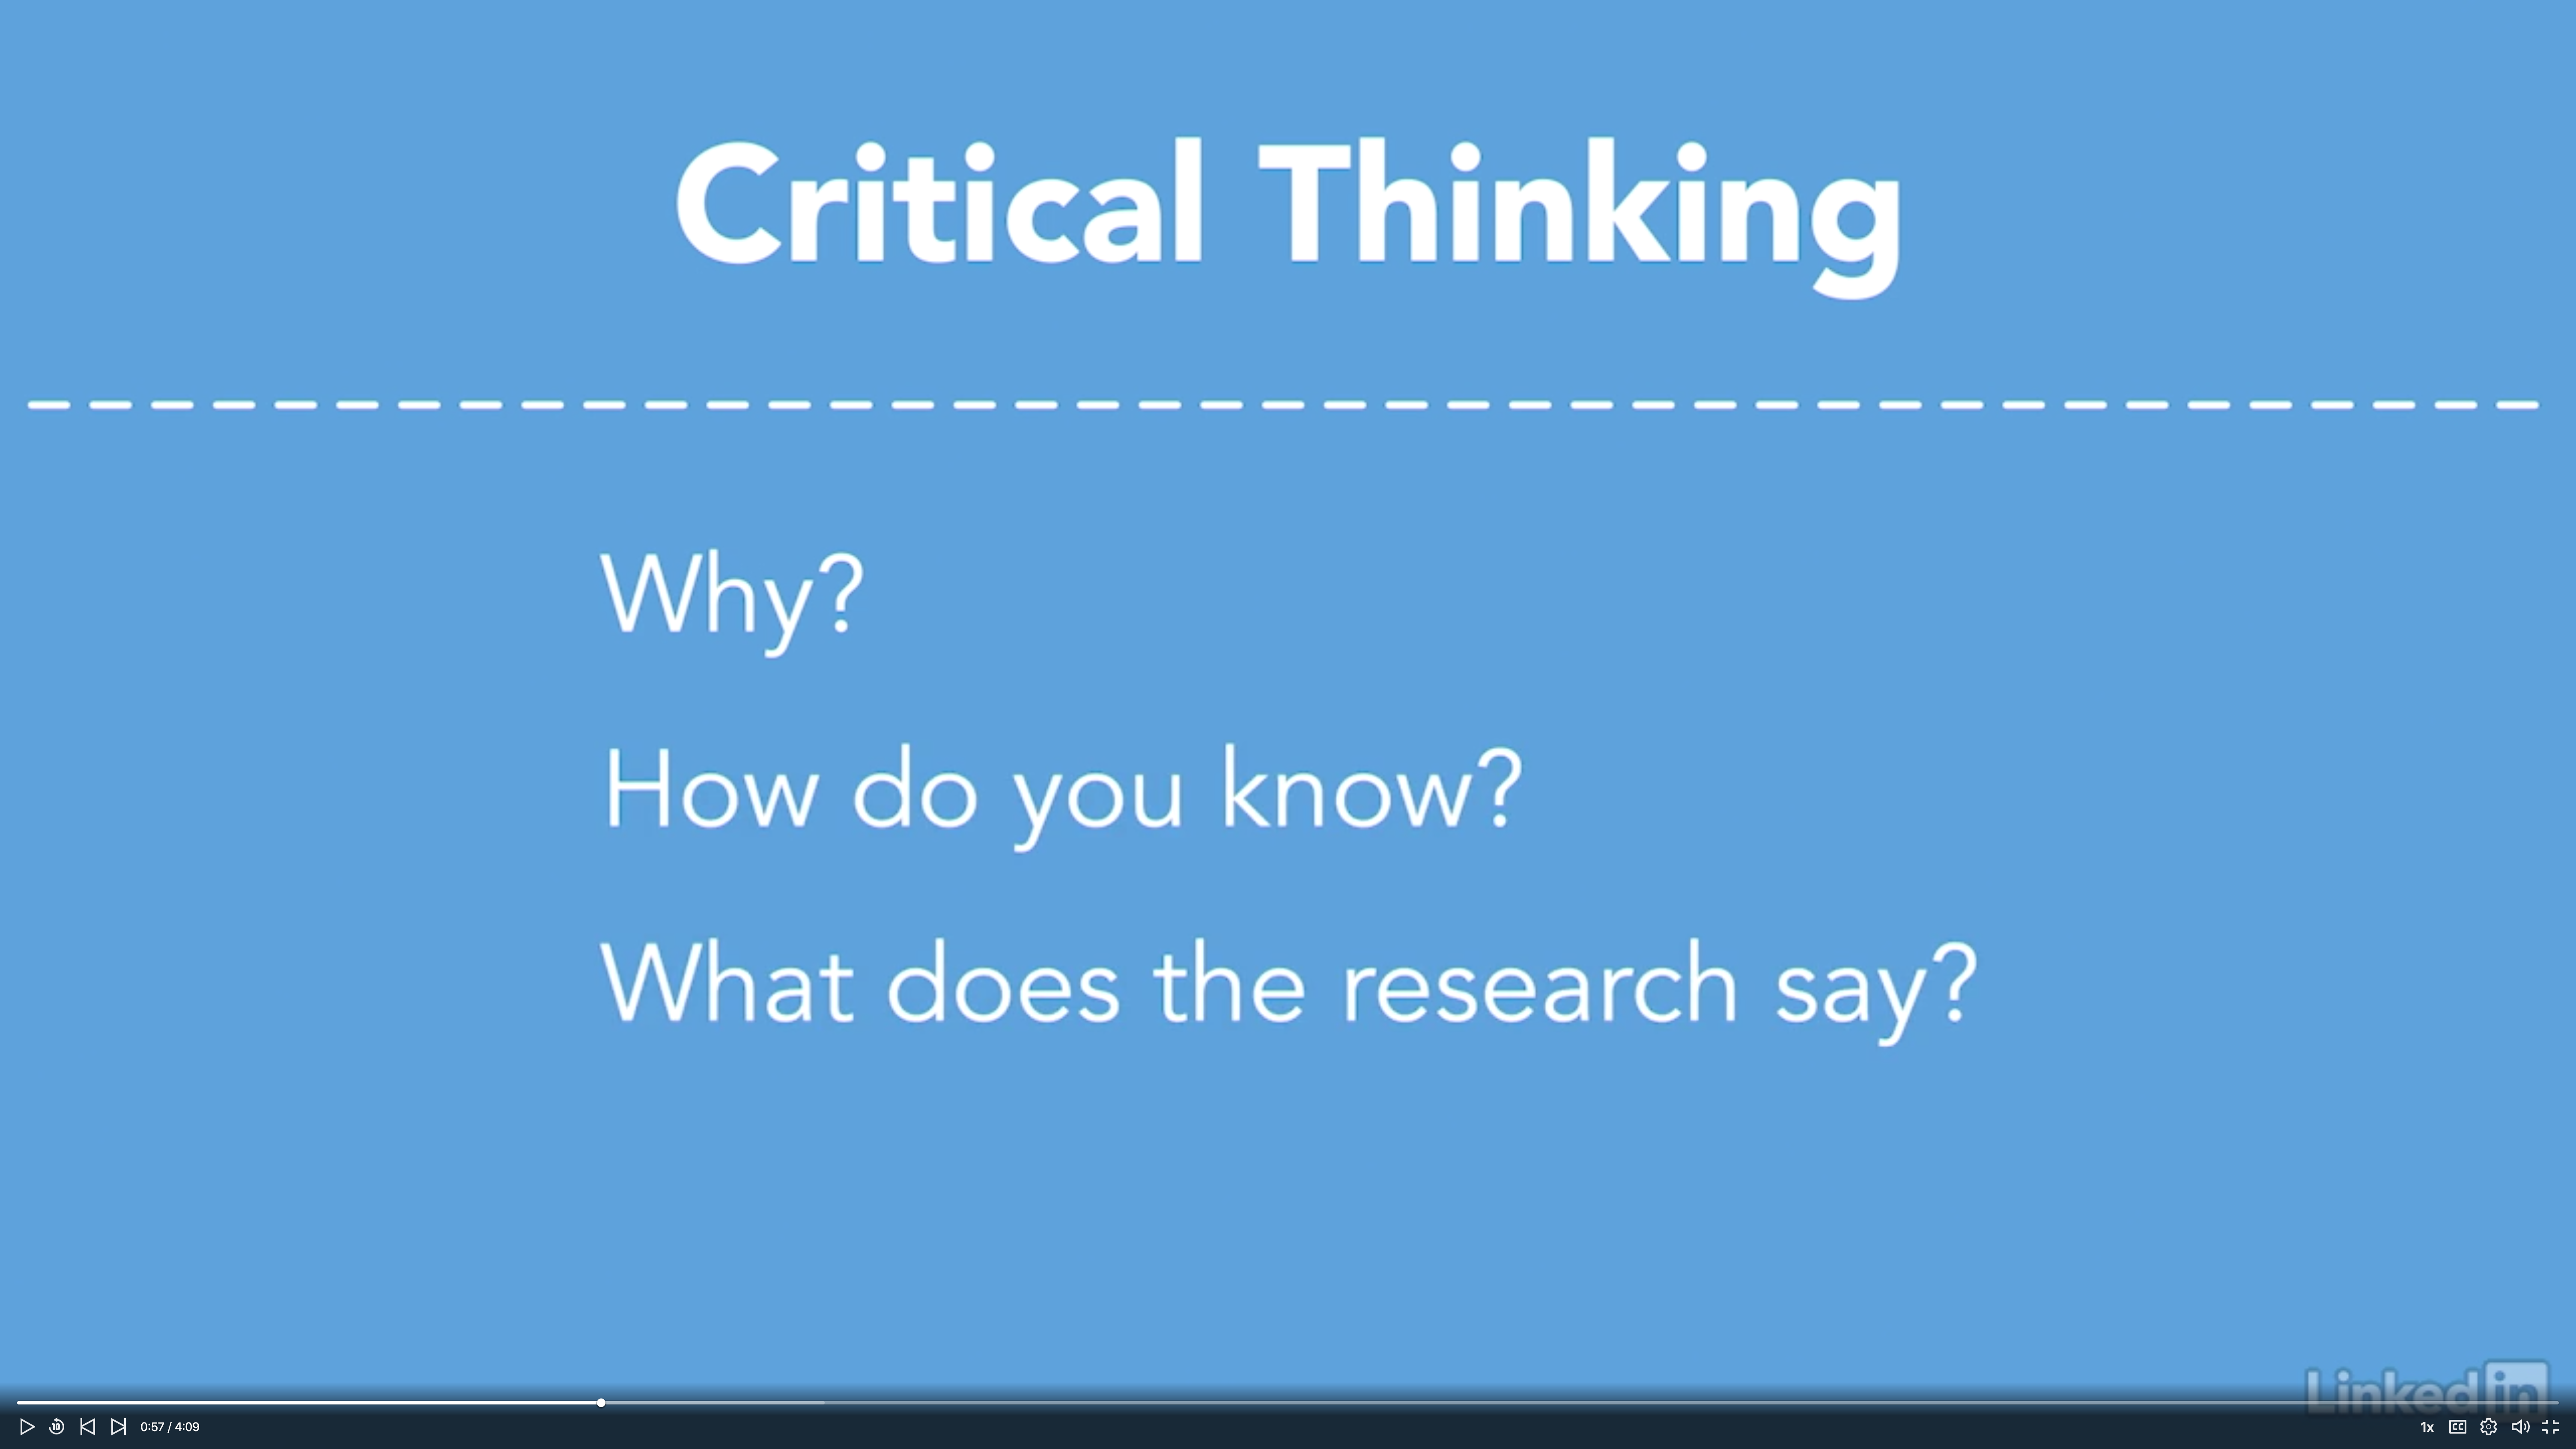
Critical thinking
- It is not all about criticizing. It is about finding out critical questions.
- It is not about good or bad; it is about ask the critical questions.
- A critical question is one that chips away at an idea and reevaluates assumptions.
Example
Critical Thinking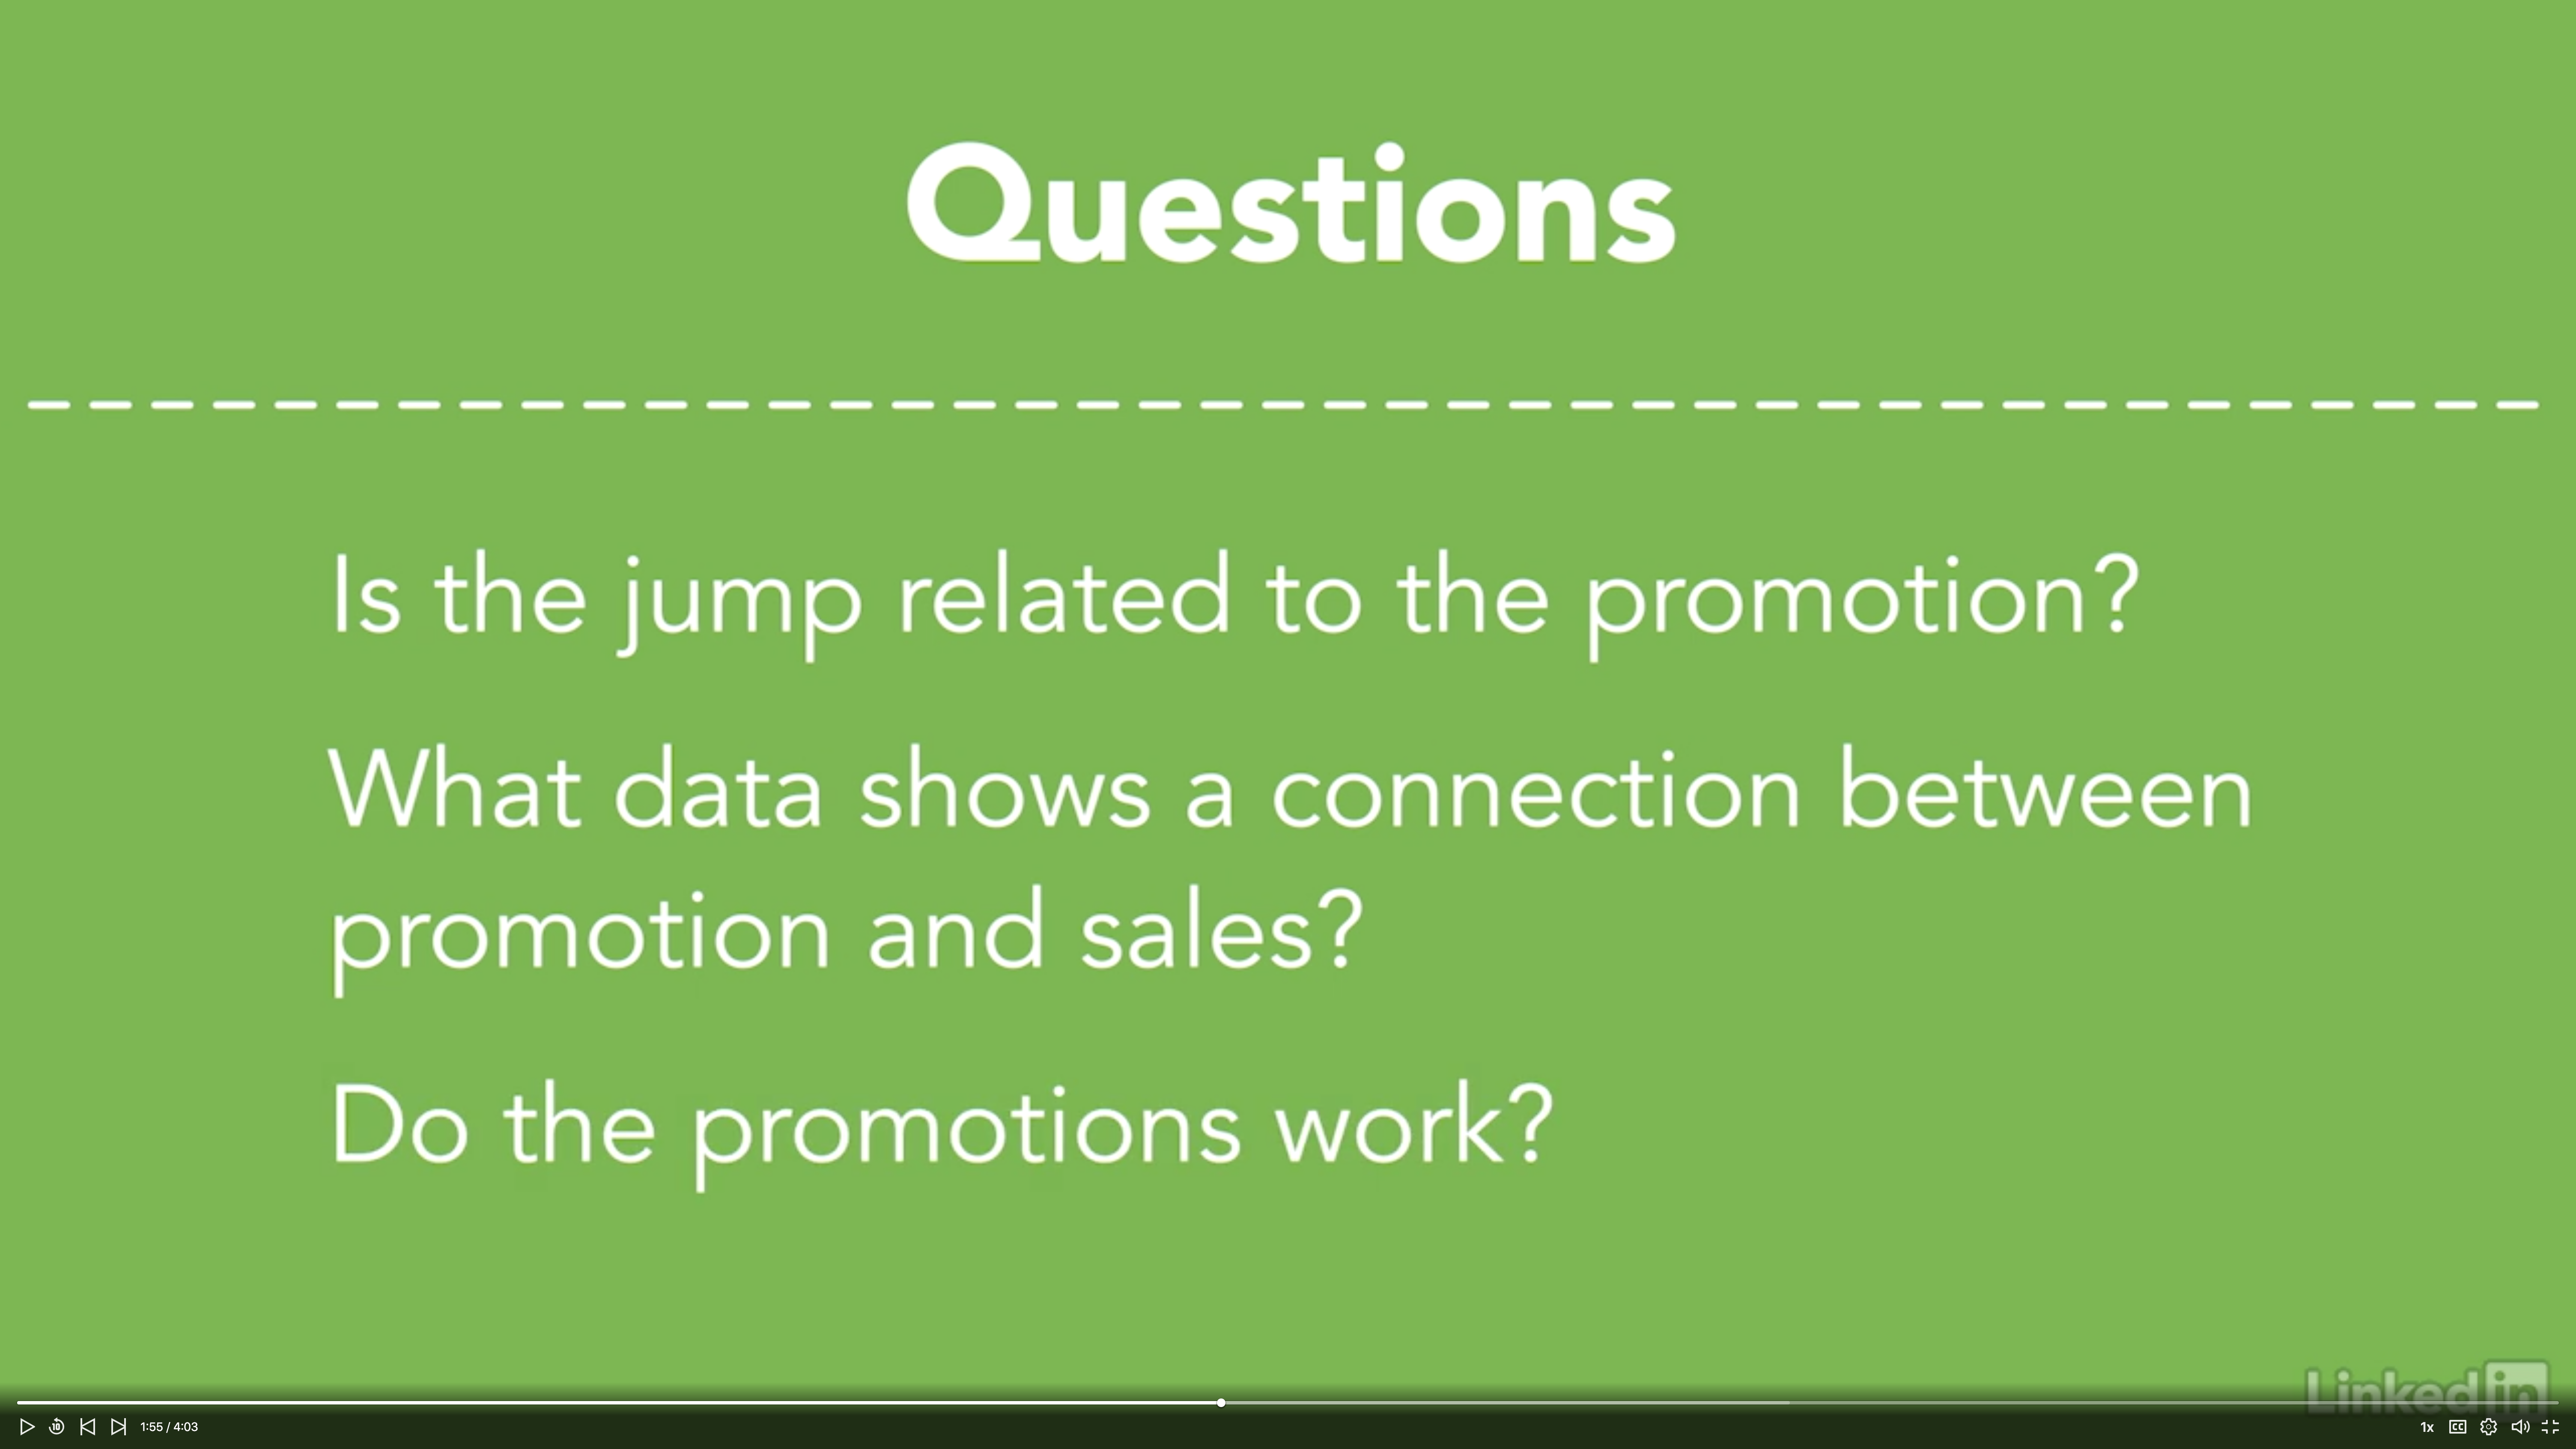
Focus on reasoning
- Reasoning is your beliefs, evidence, experience, and values that support conclusions about the data.
- Reasoning could be the first step towards finding critical questions.
Critical thinking helps data science team gain more value from the reports.
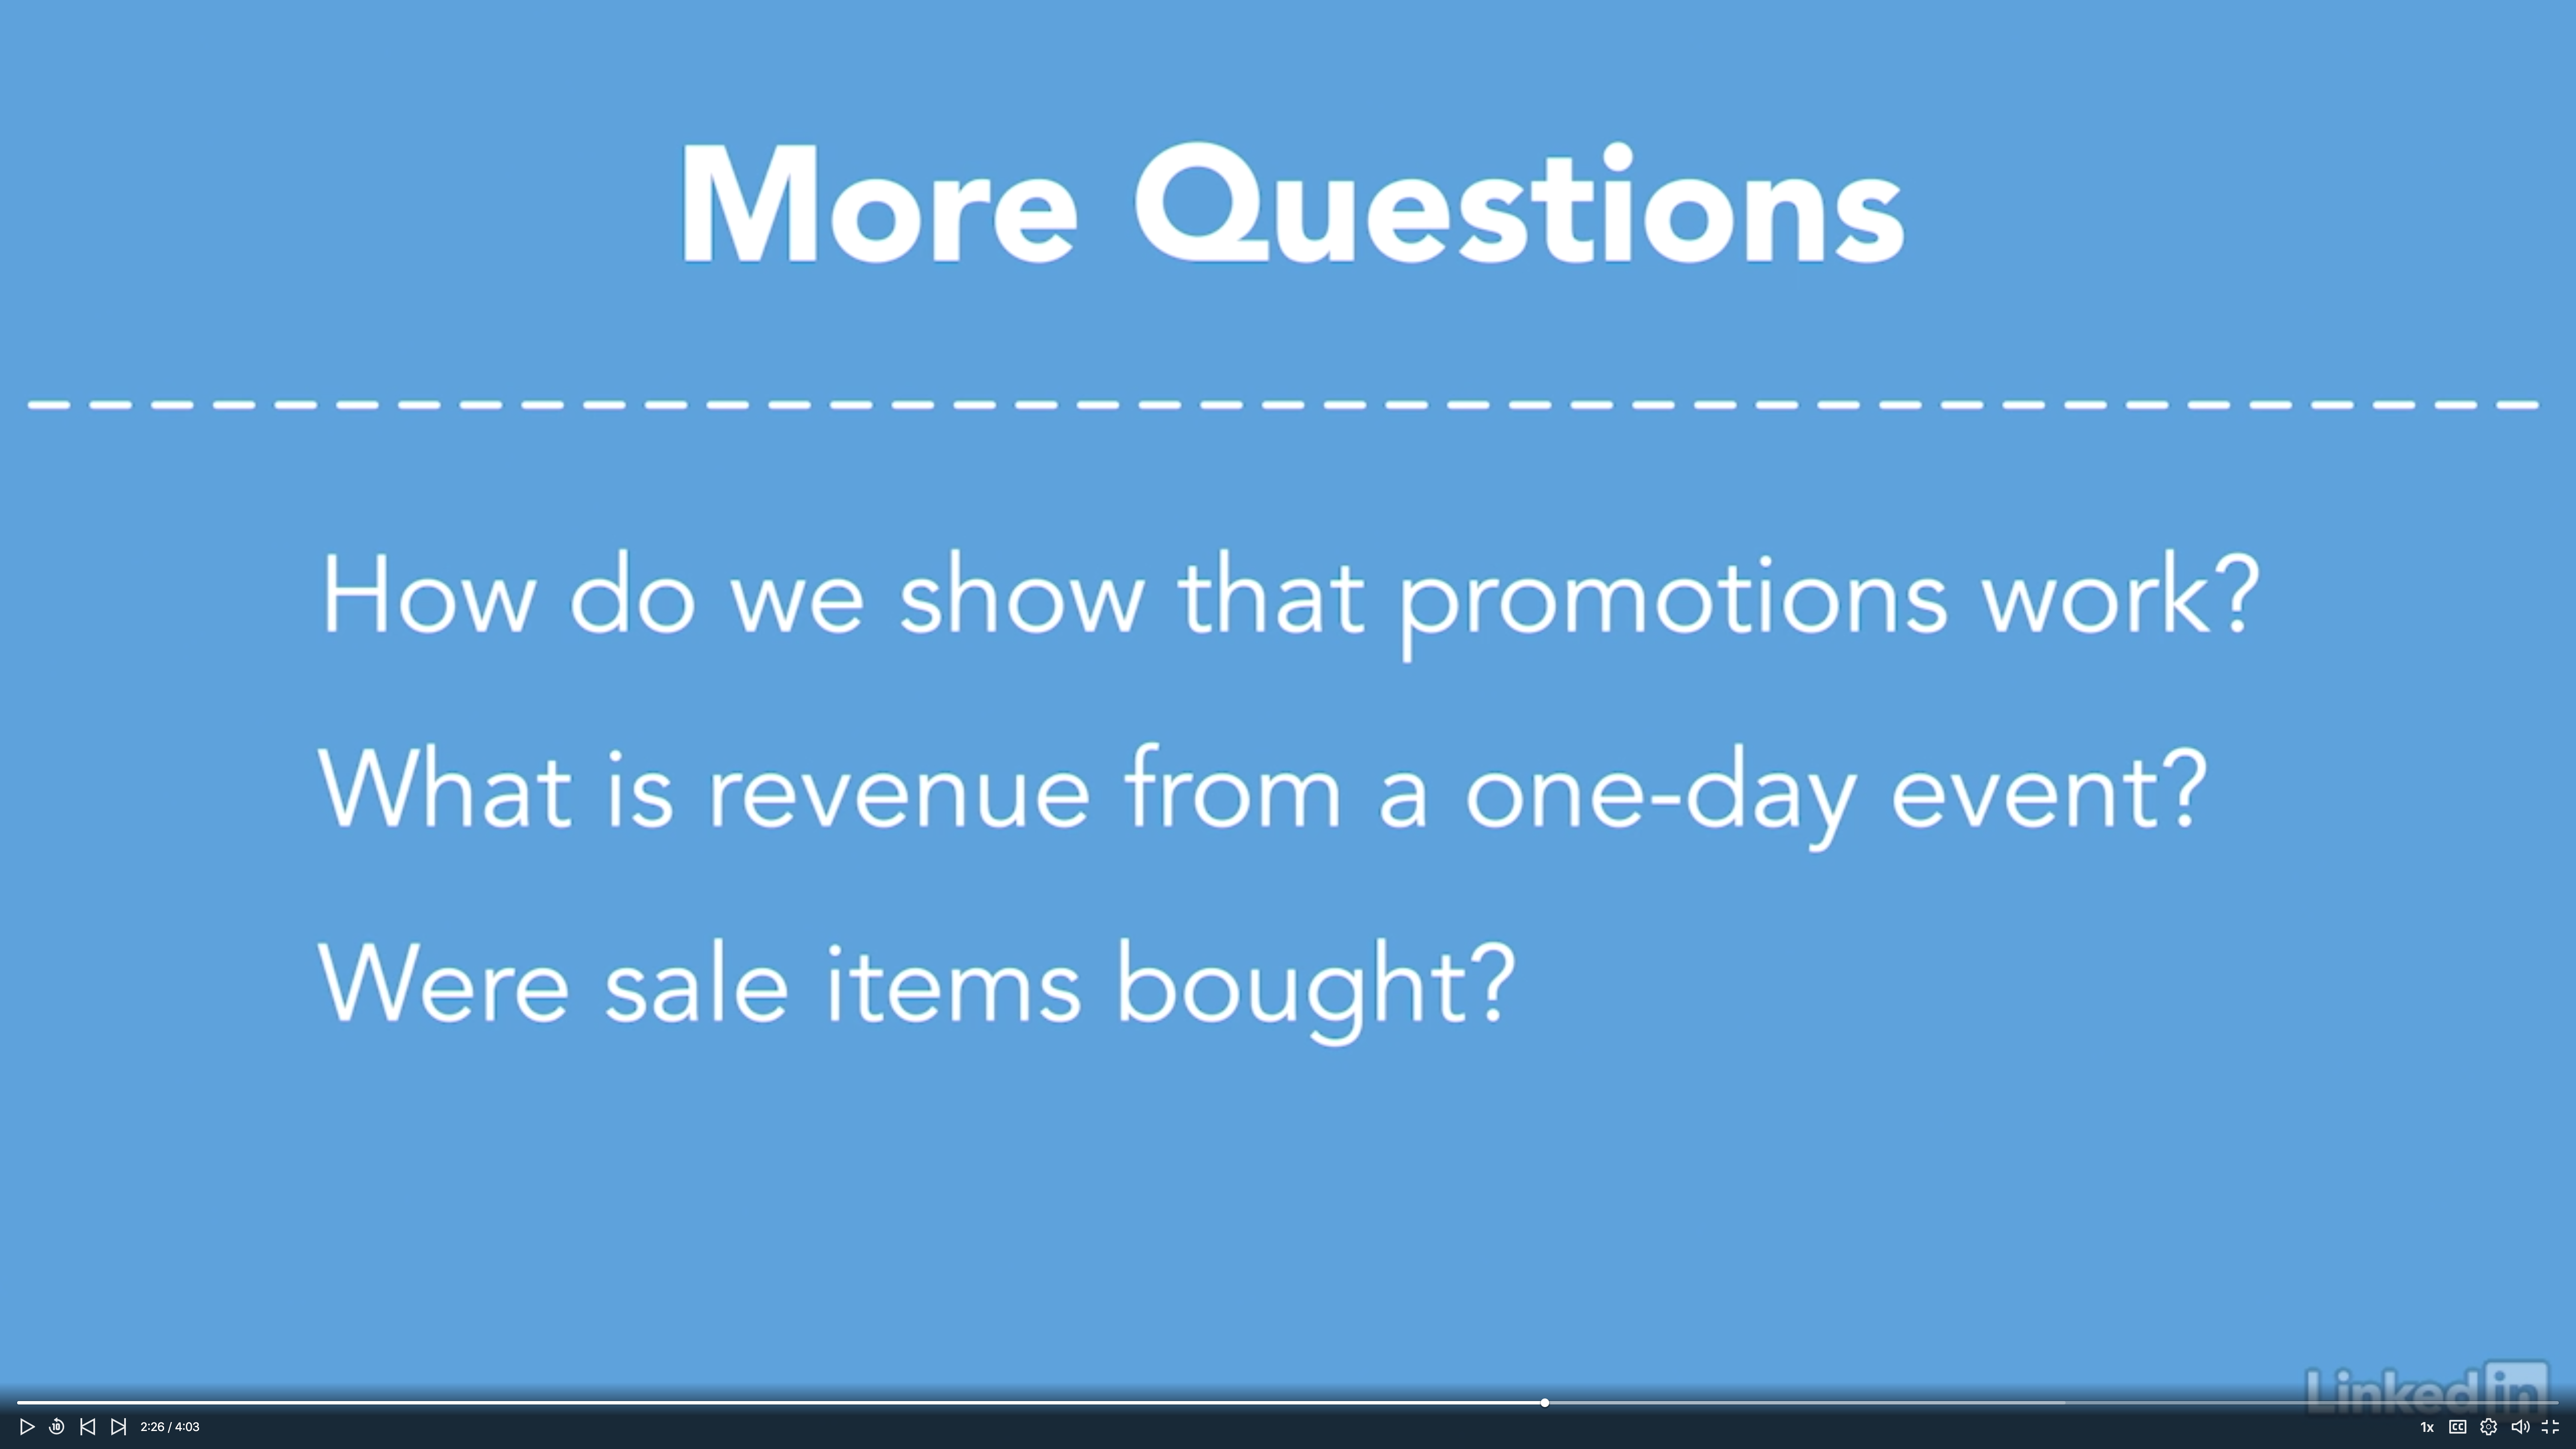
Example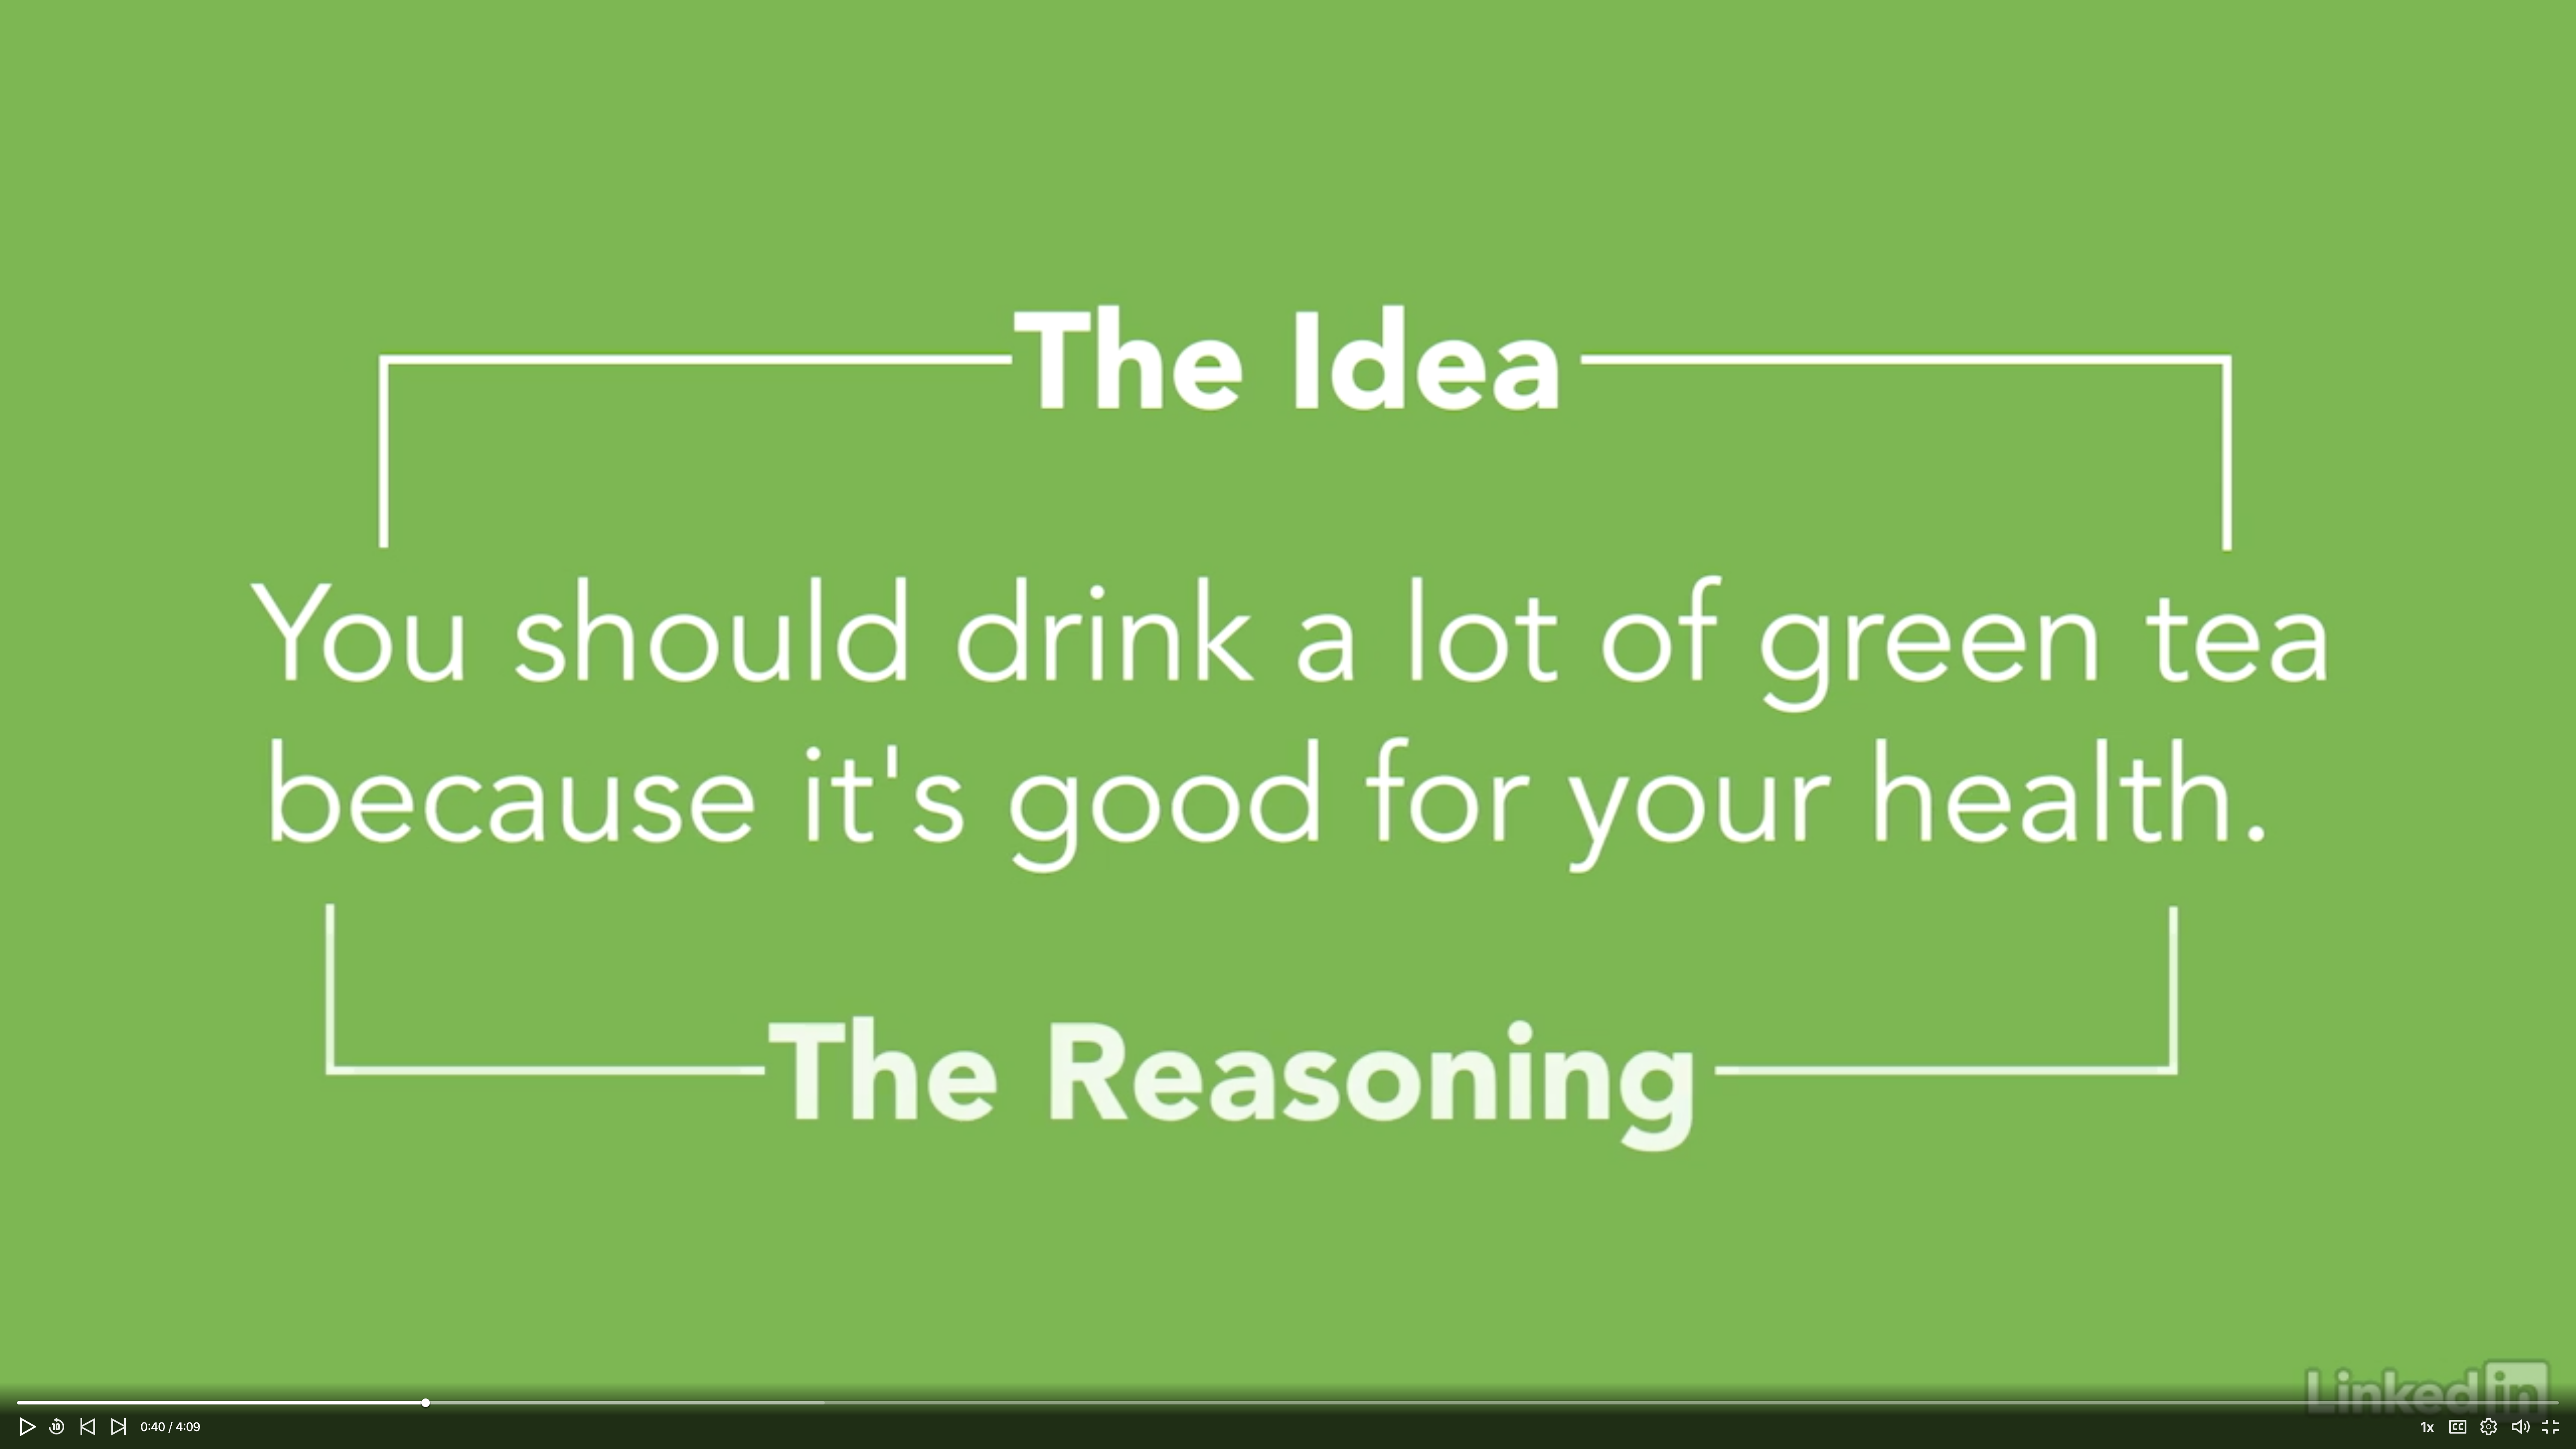
Example
Let’s imagine we are designing a website ads selling running shoes for the runners.

Young runner model vs. Old runner model

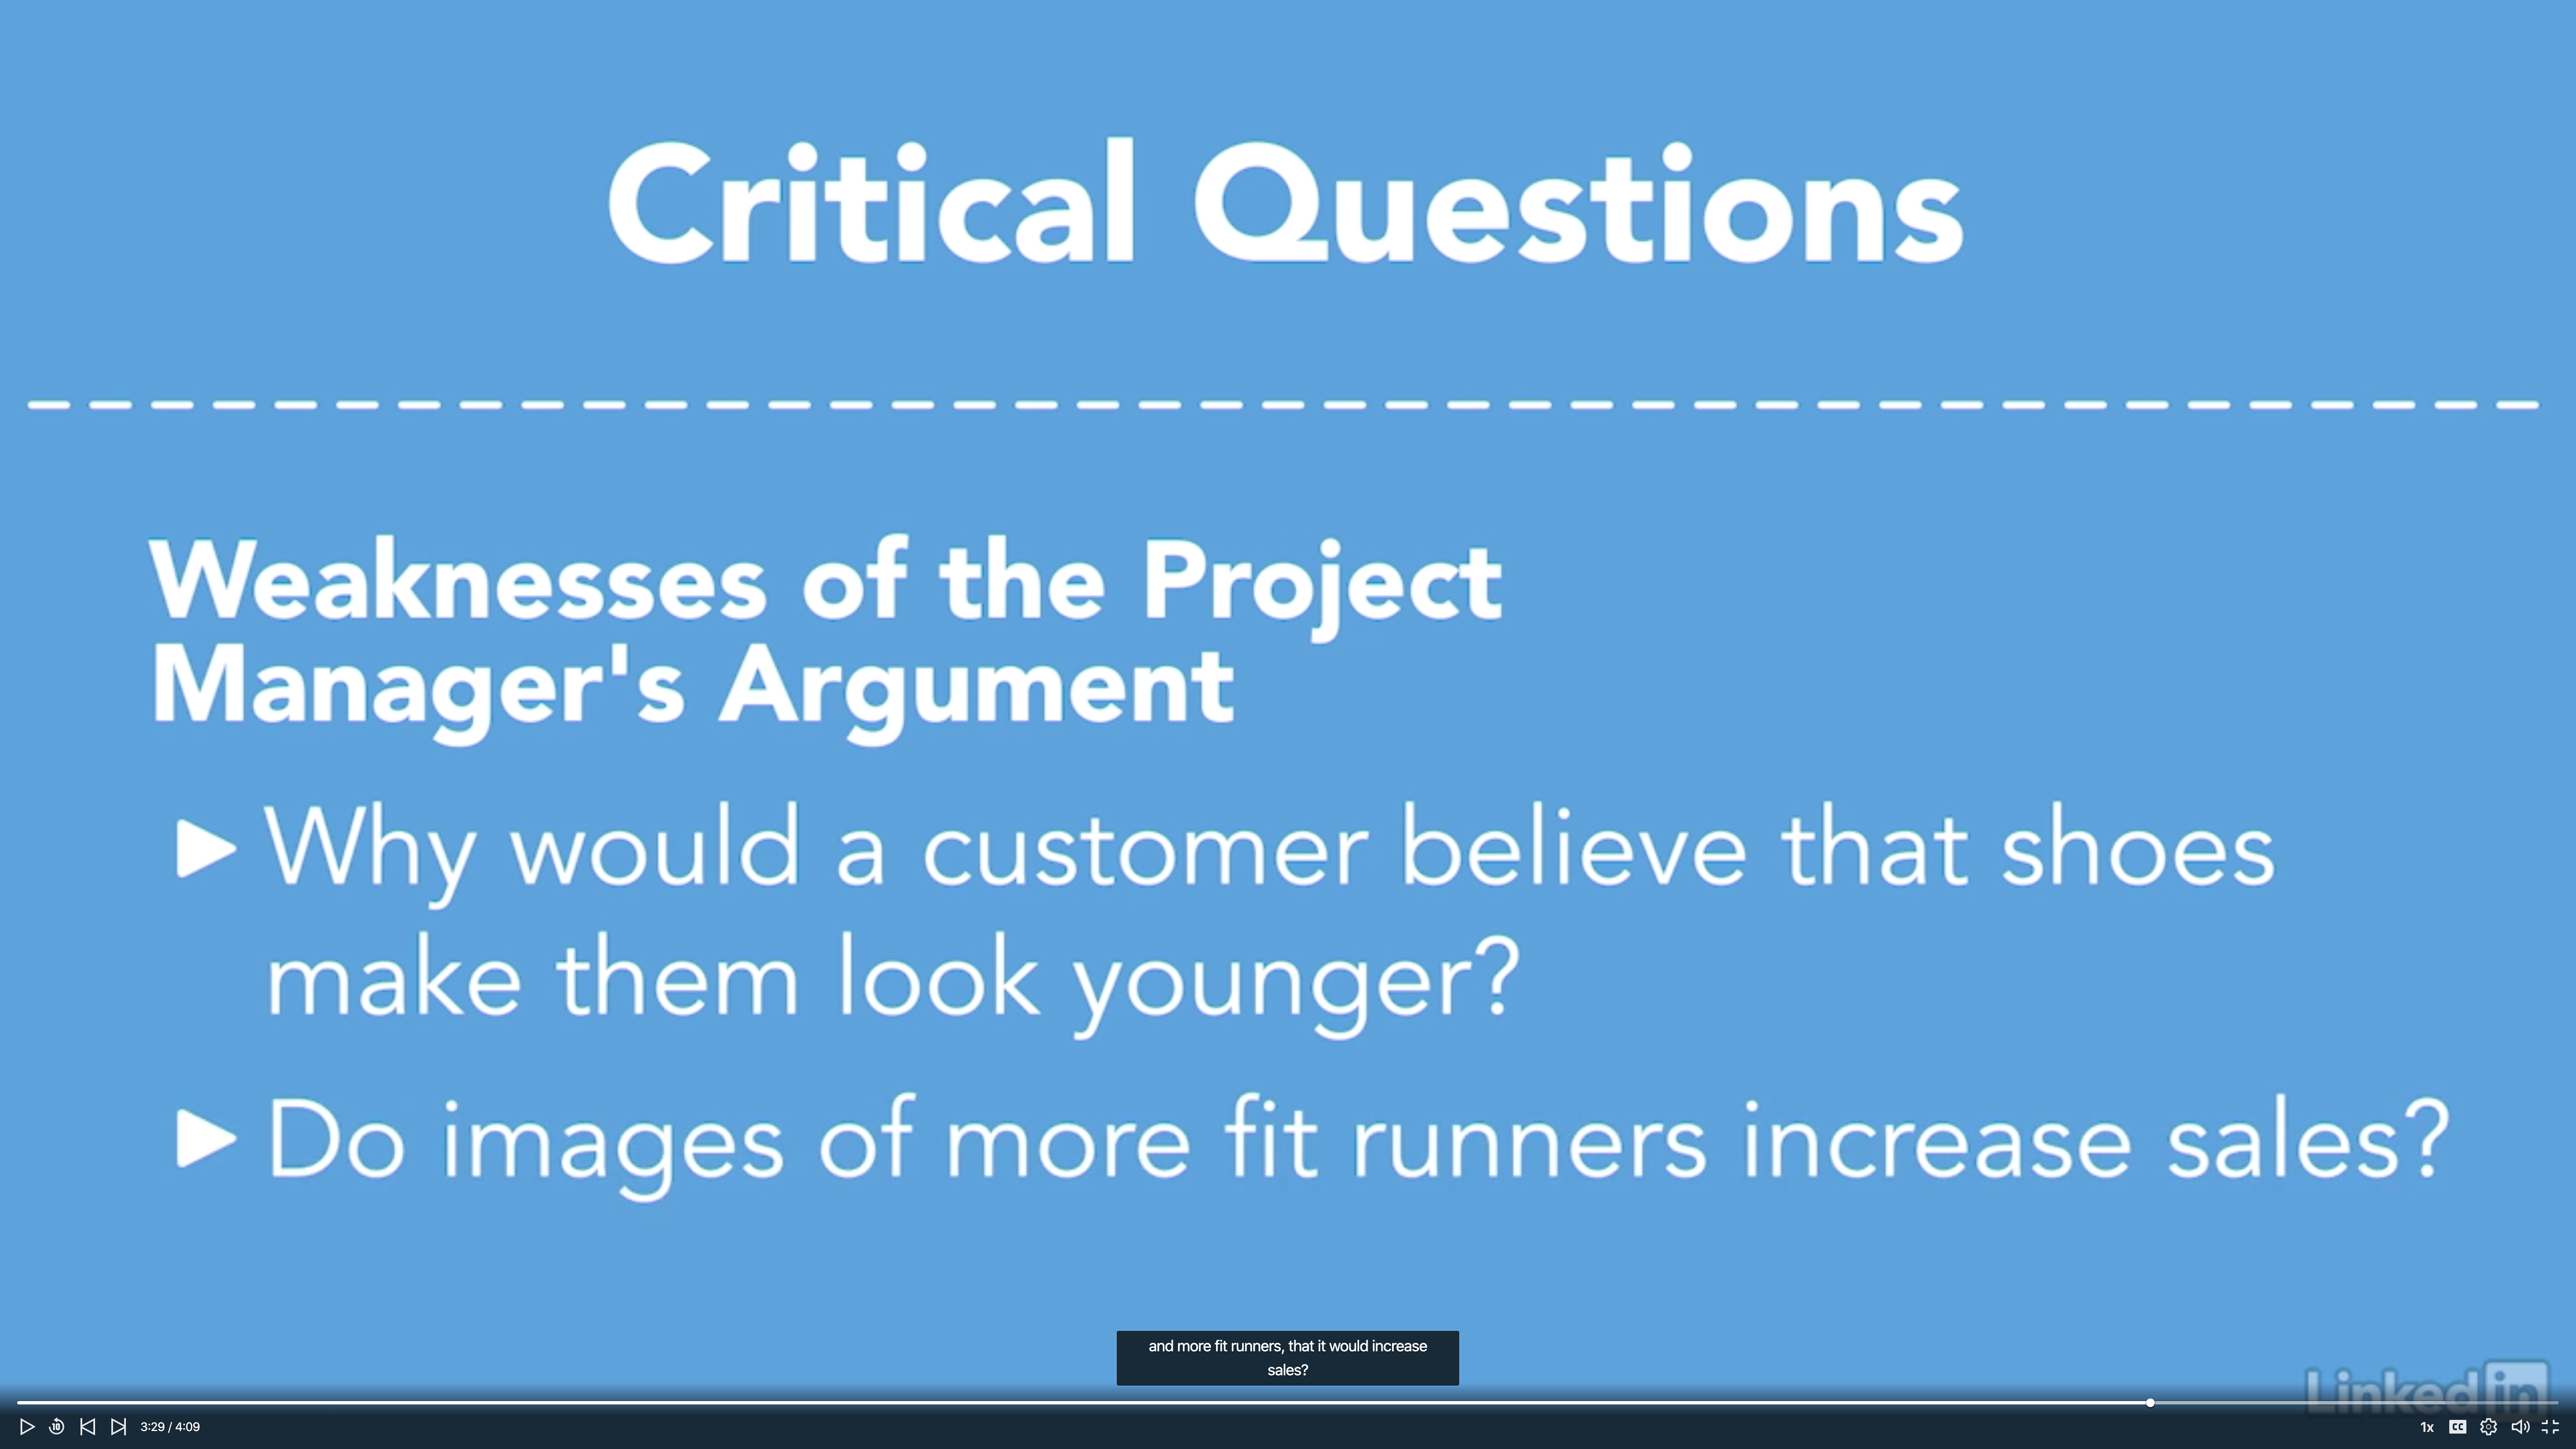
For the product manager, the reasoning was that customers are motivated by who they’d like to become.
For the data analyst, the reason was that customers assume that the product was designed for people who had just standing running.
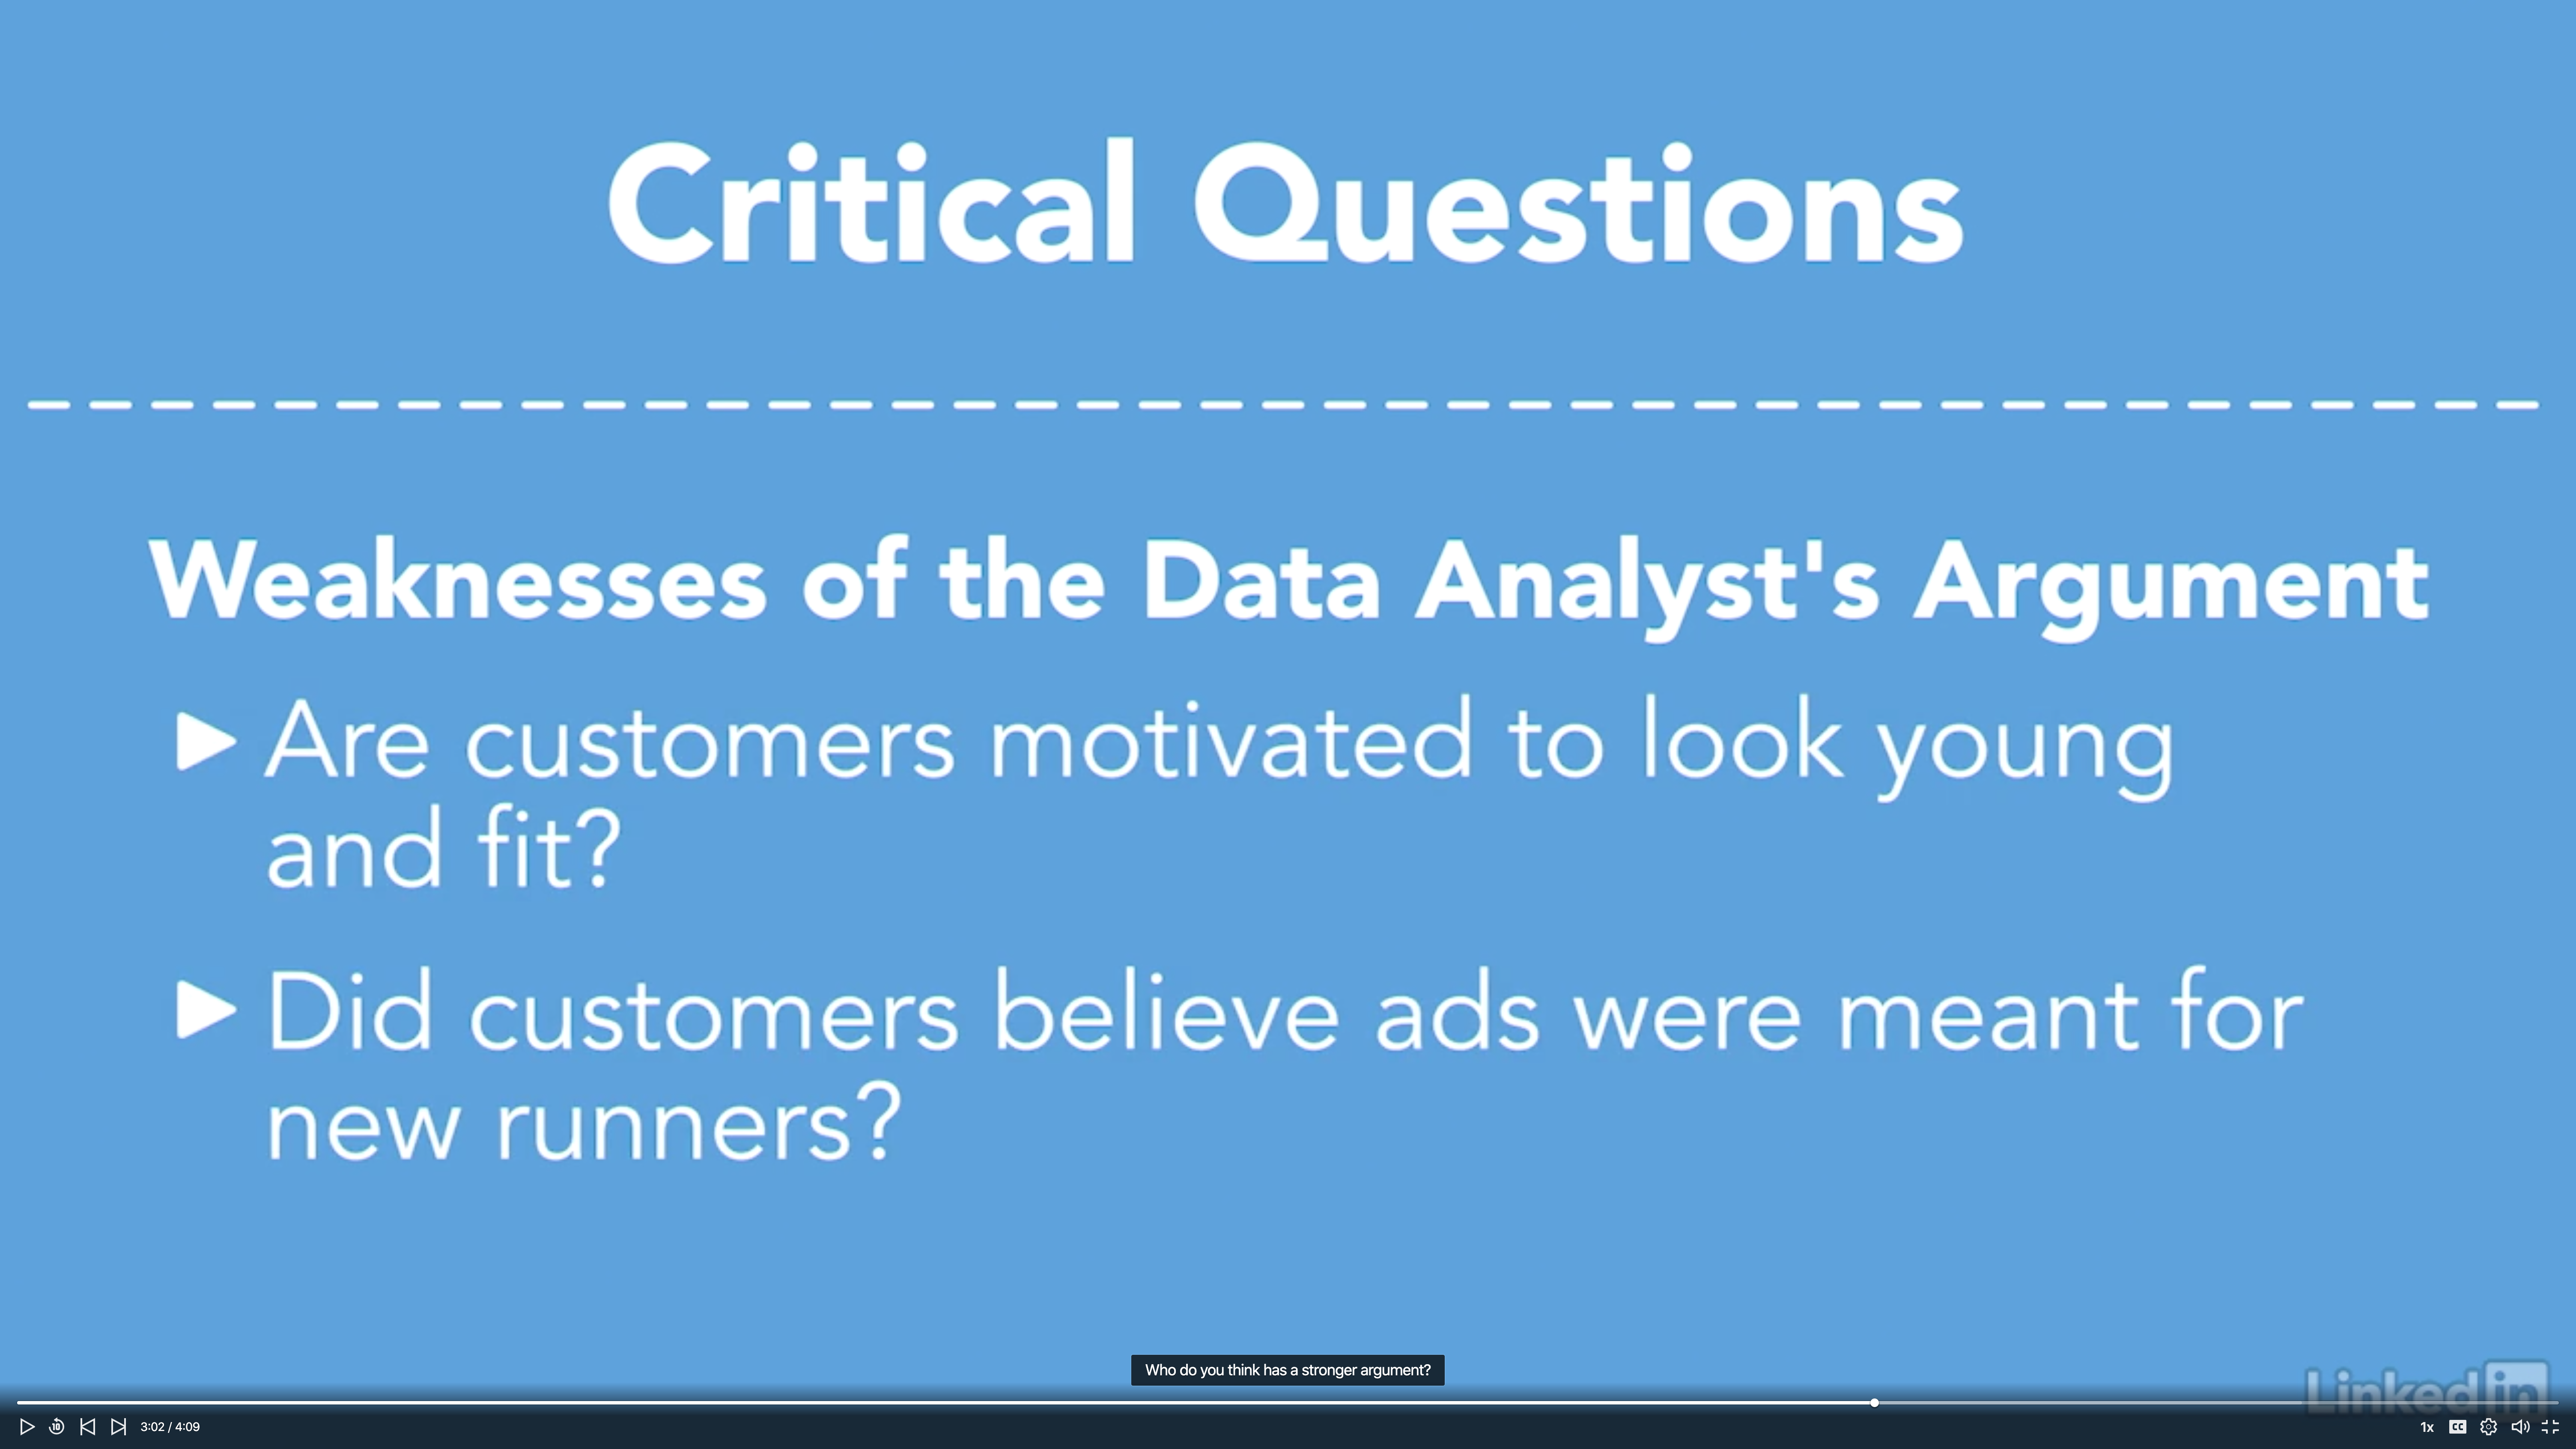
What the weakness of each argument?
Why would a less fit runner be considered one who just started running?
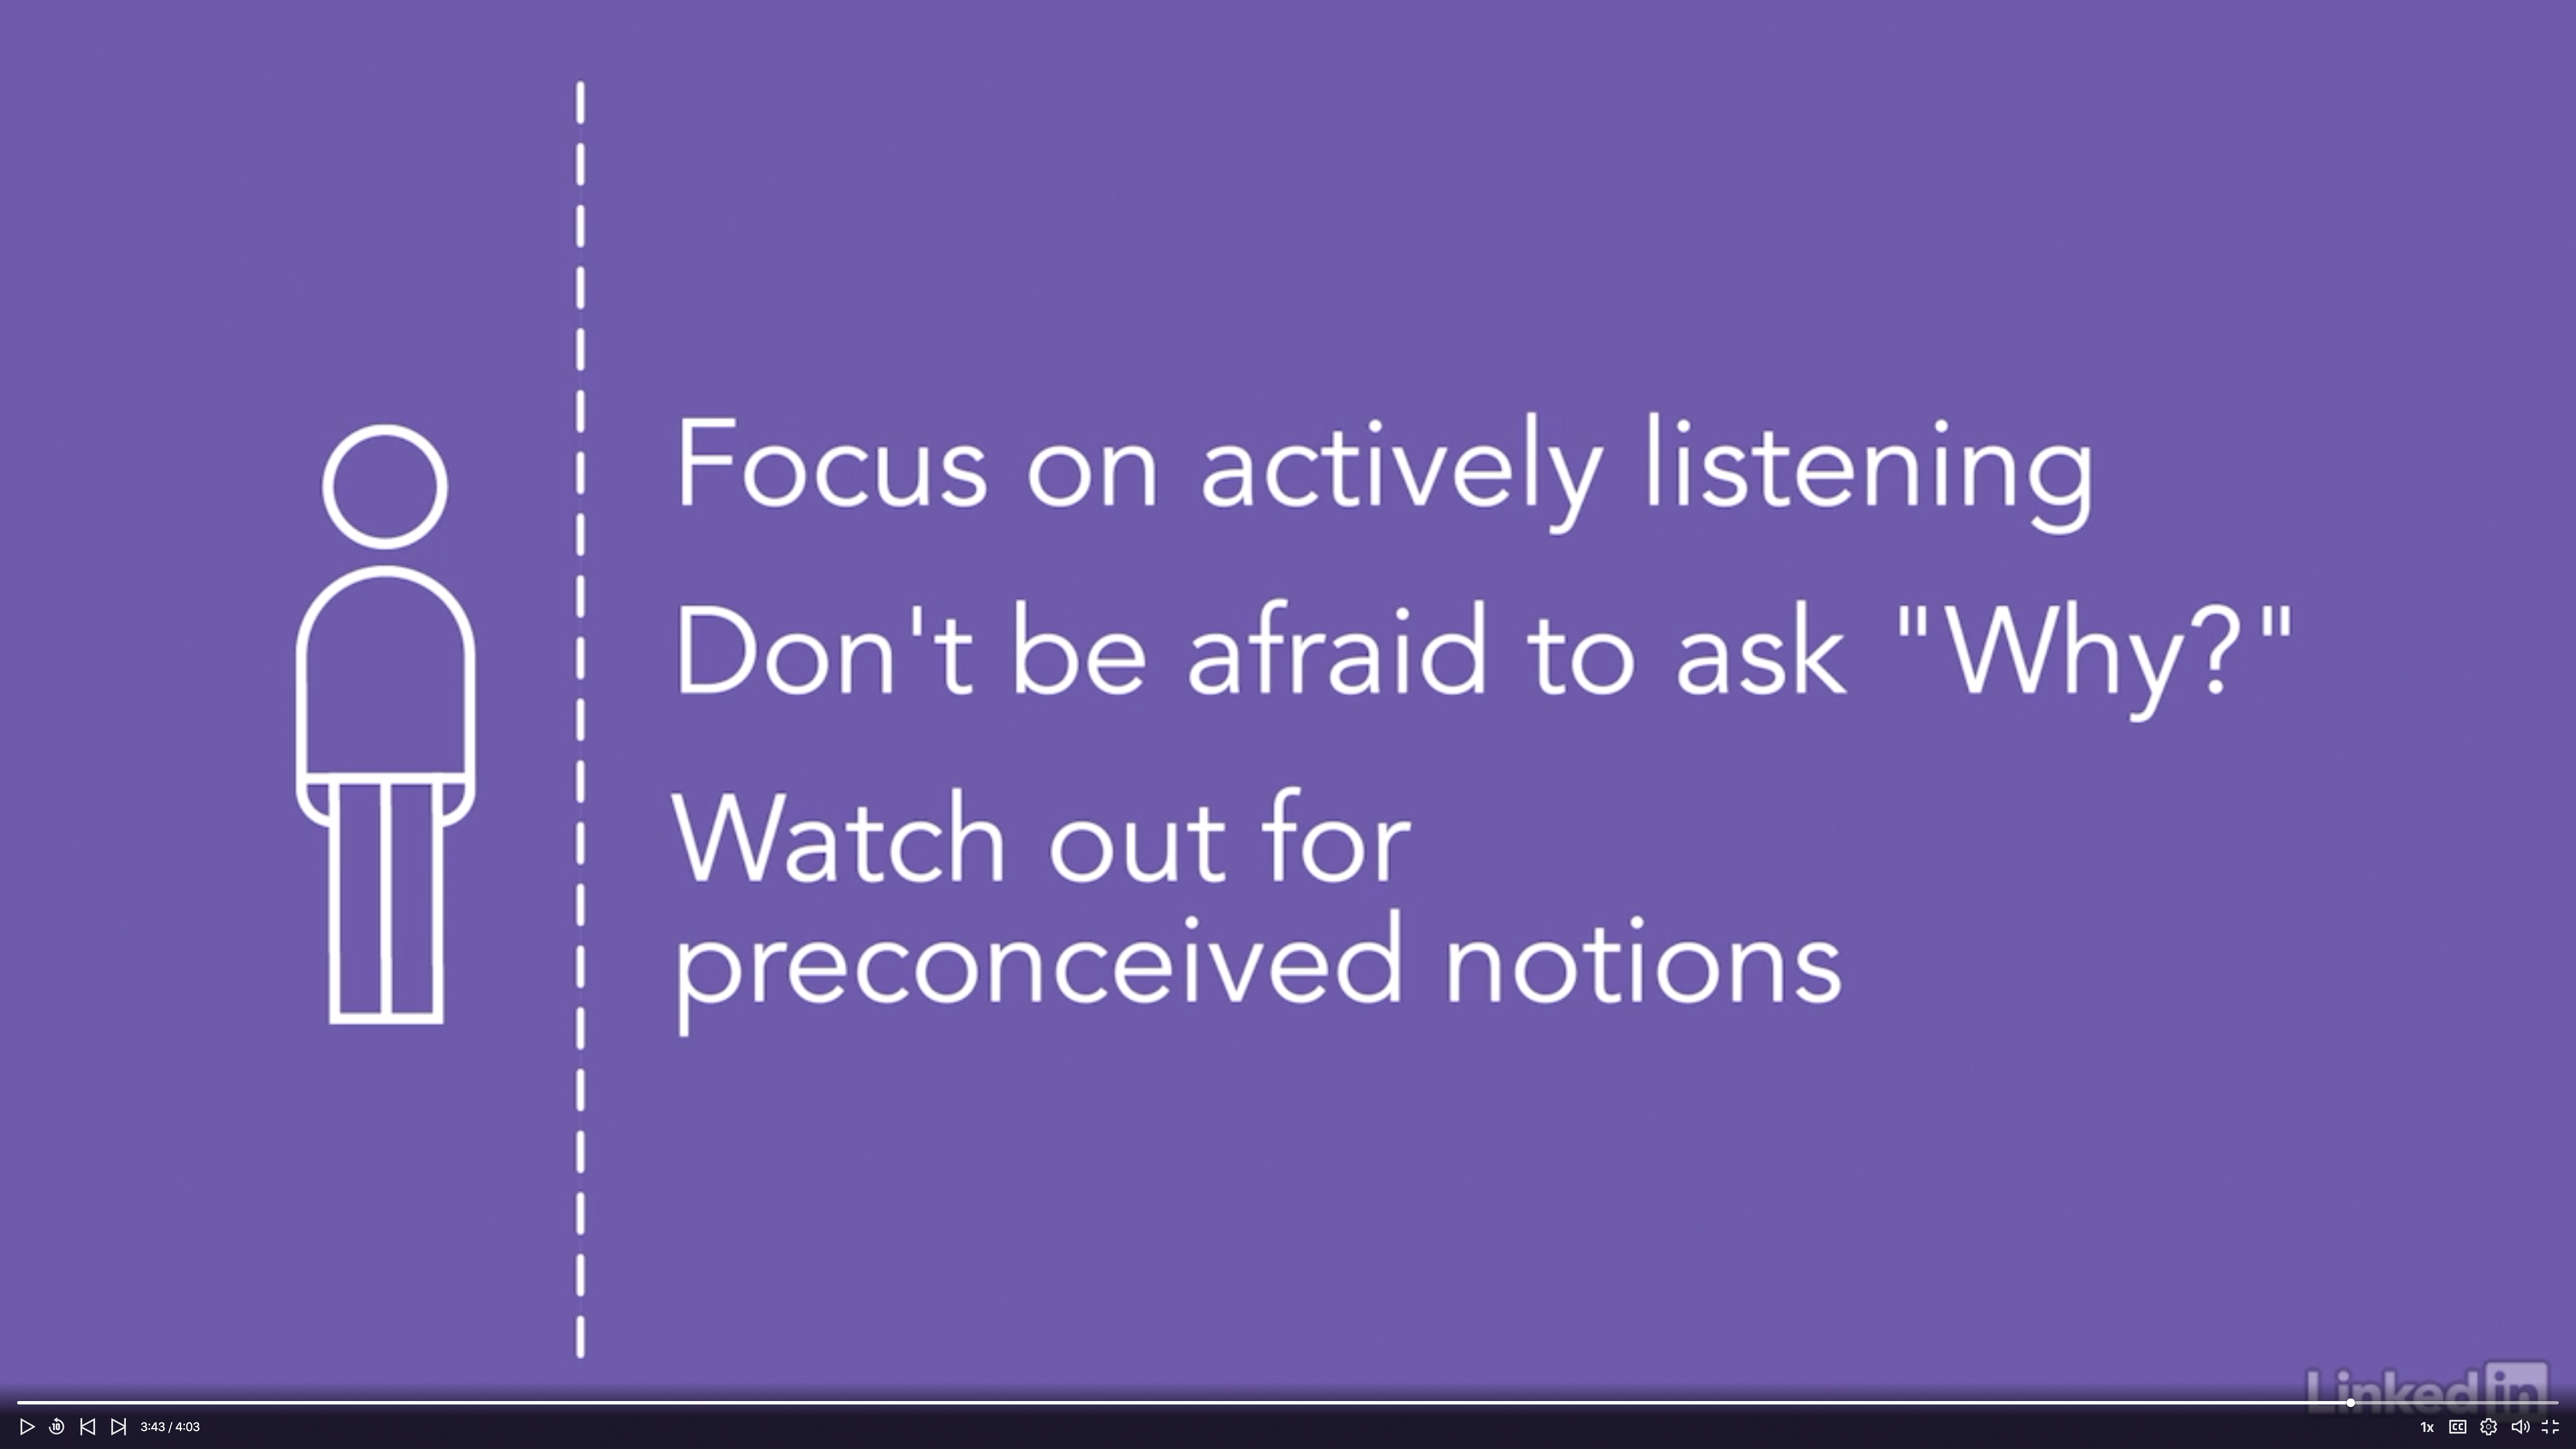
Test your reasoning
- It’s actually pretty rare to see someone change their mind.
- It’s easy to be skeptical of someone else’s ideas. What’s hard is being skeptical of your own.
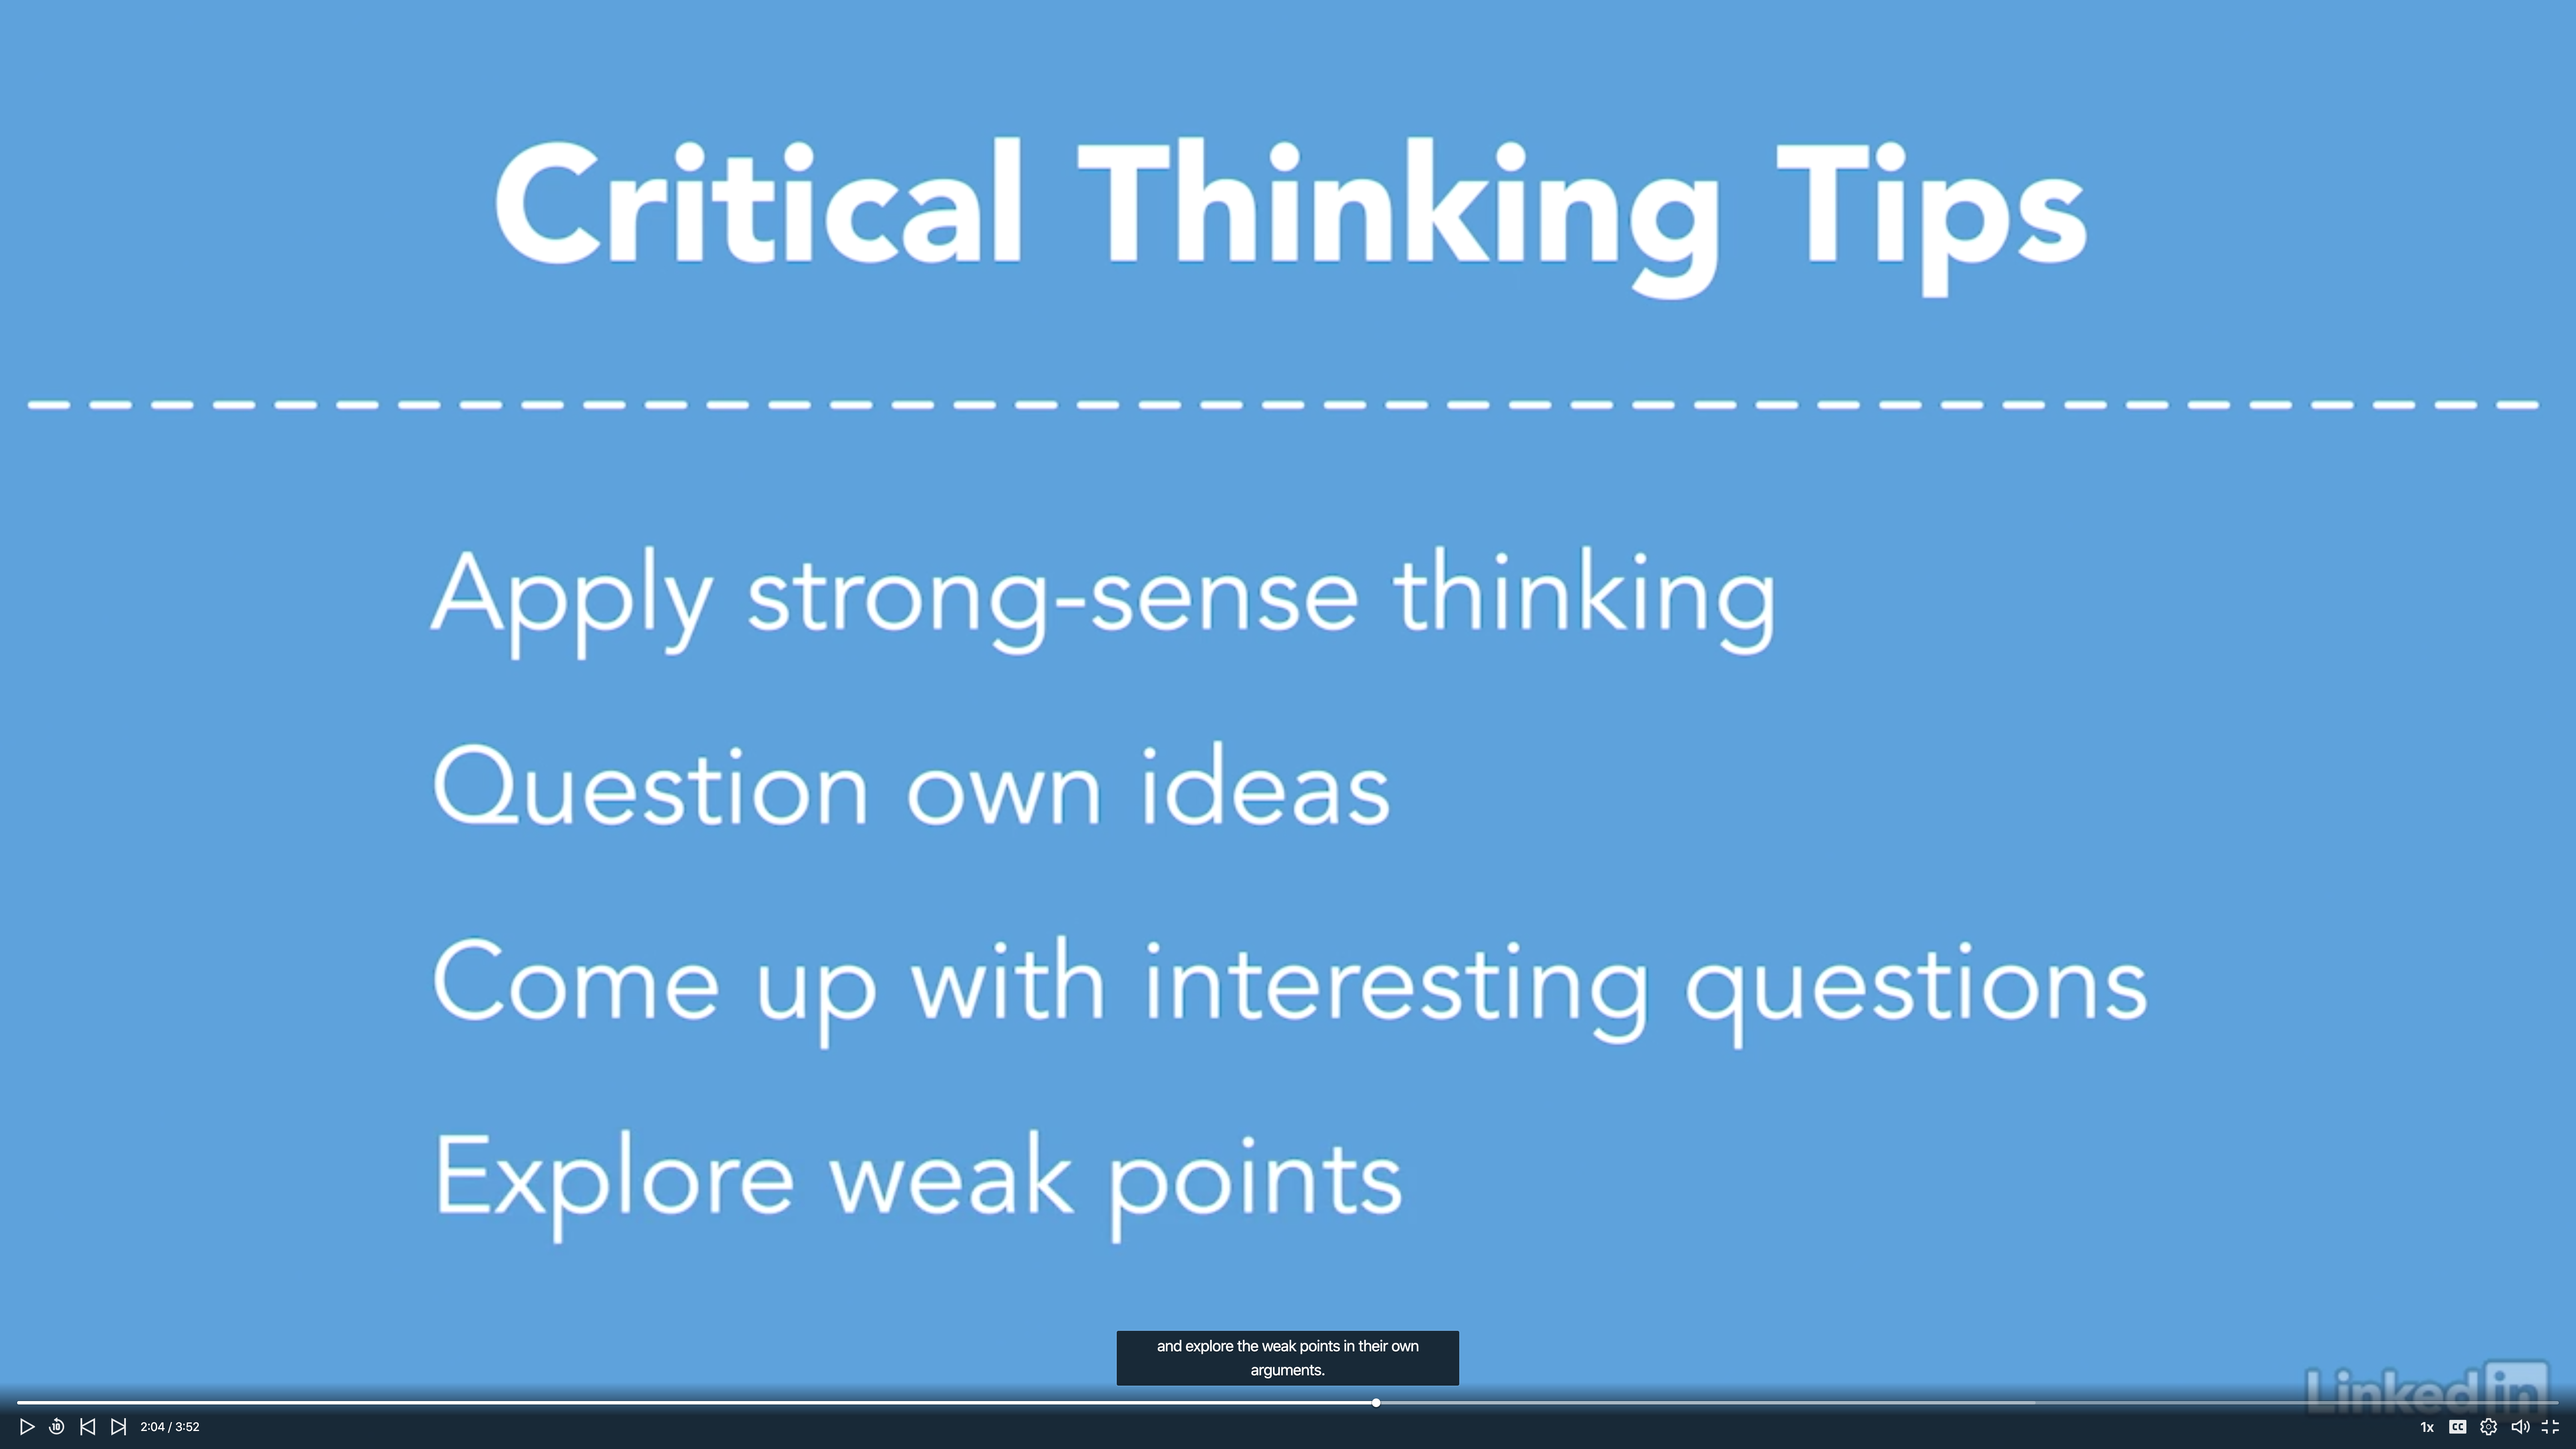
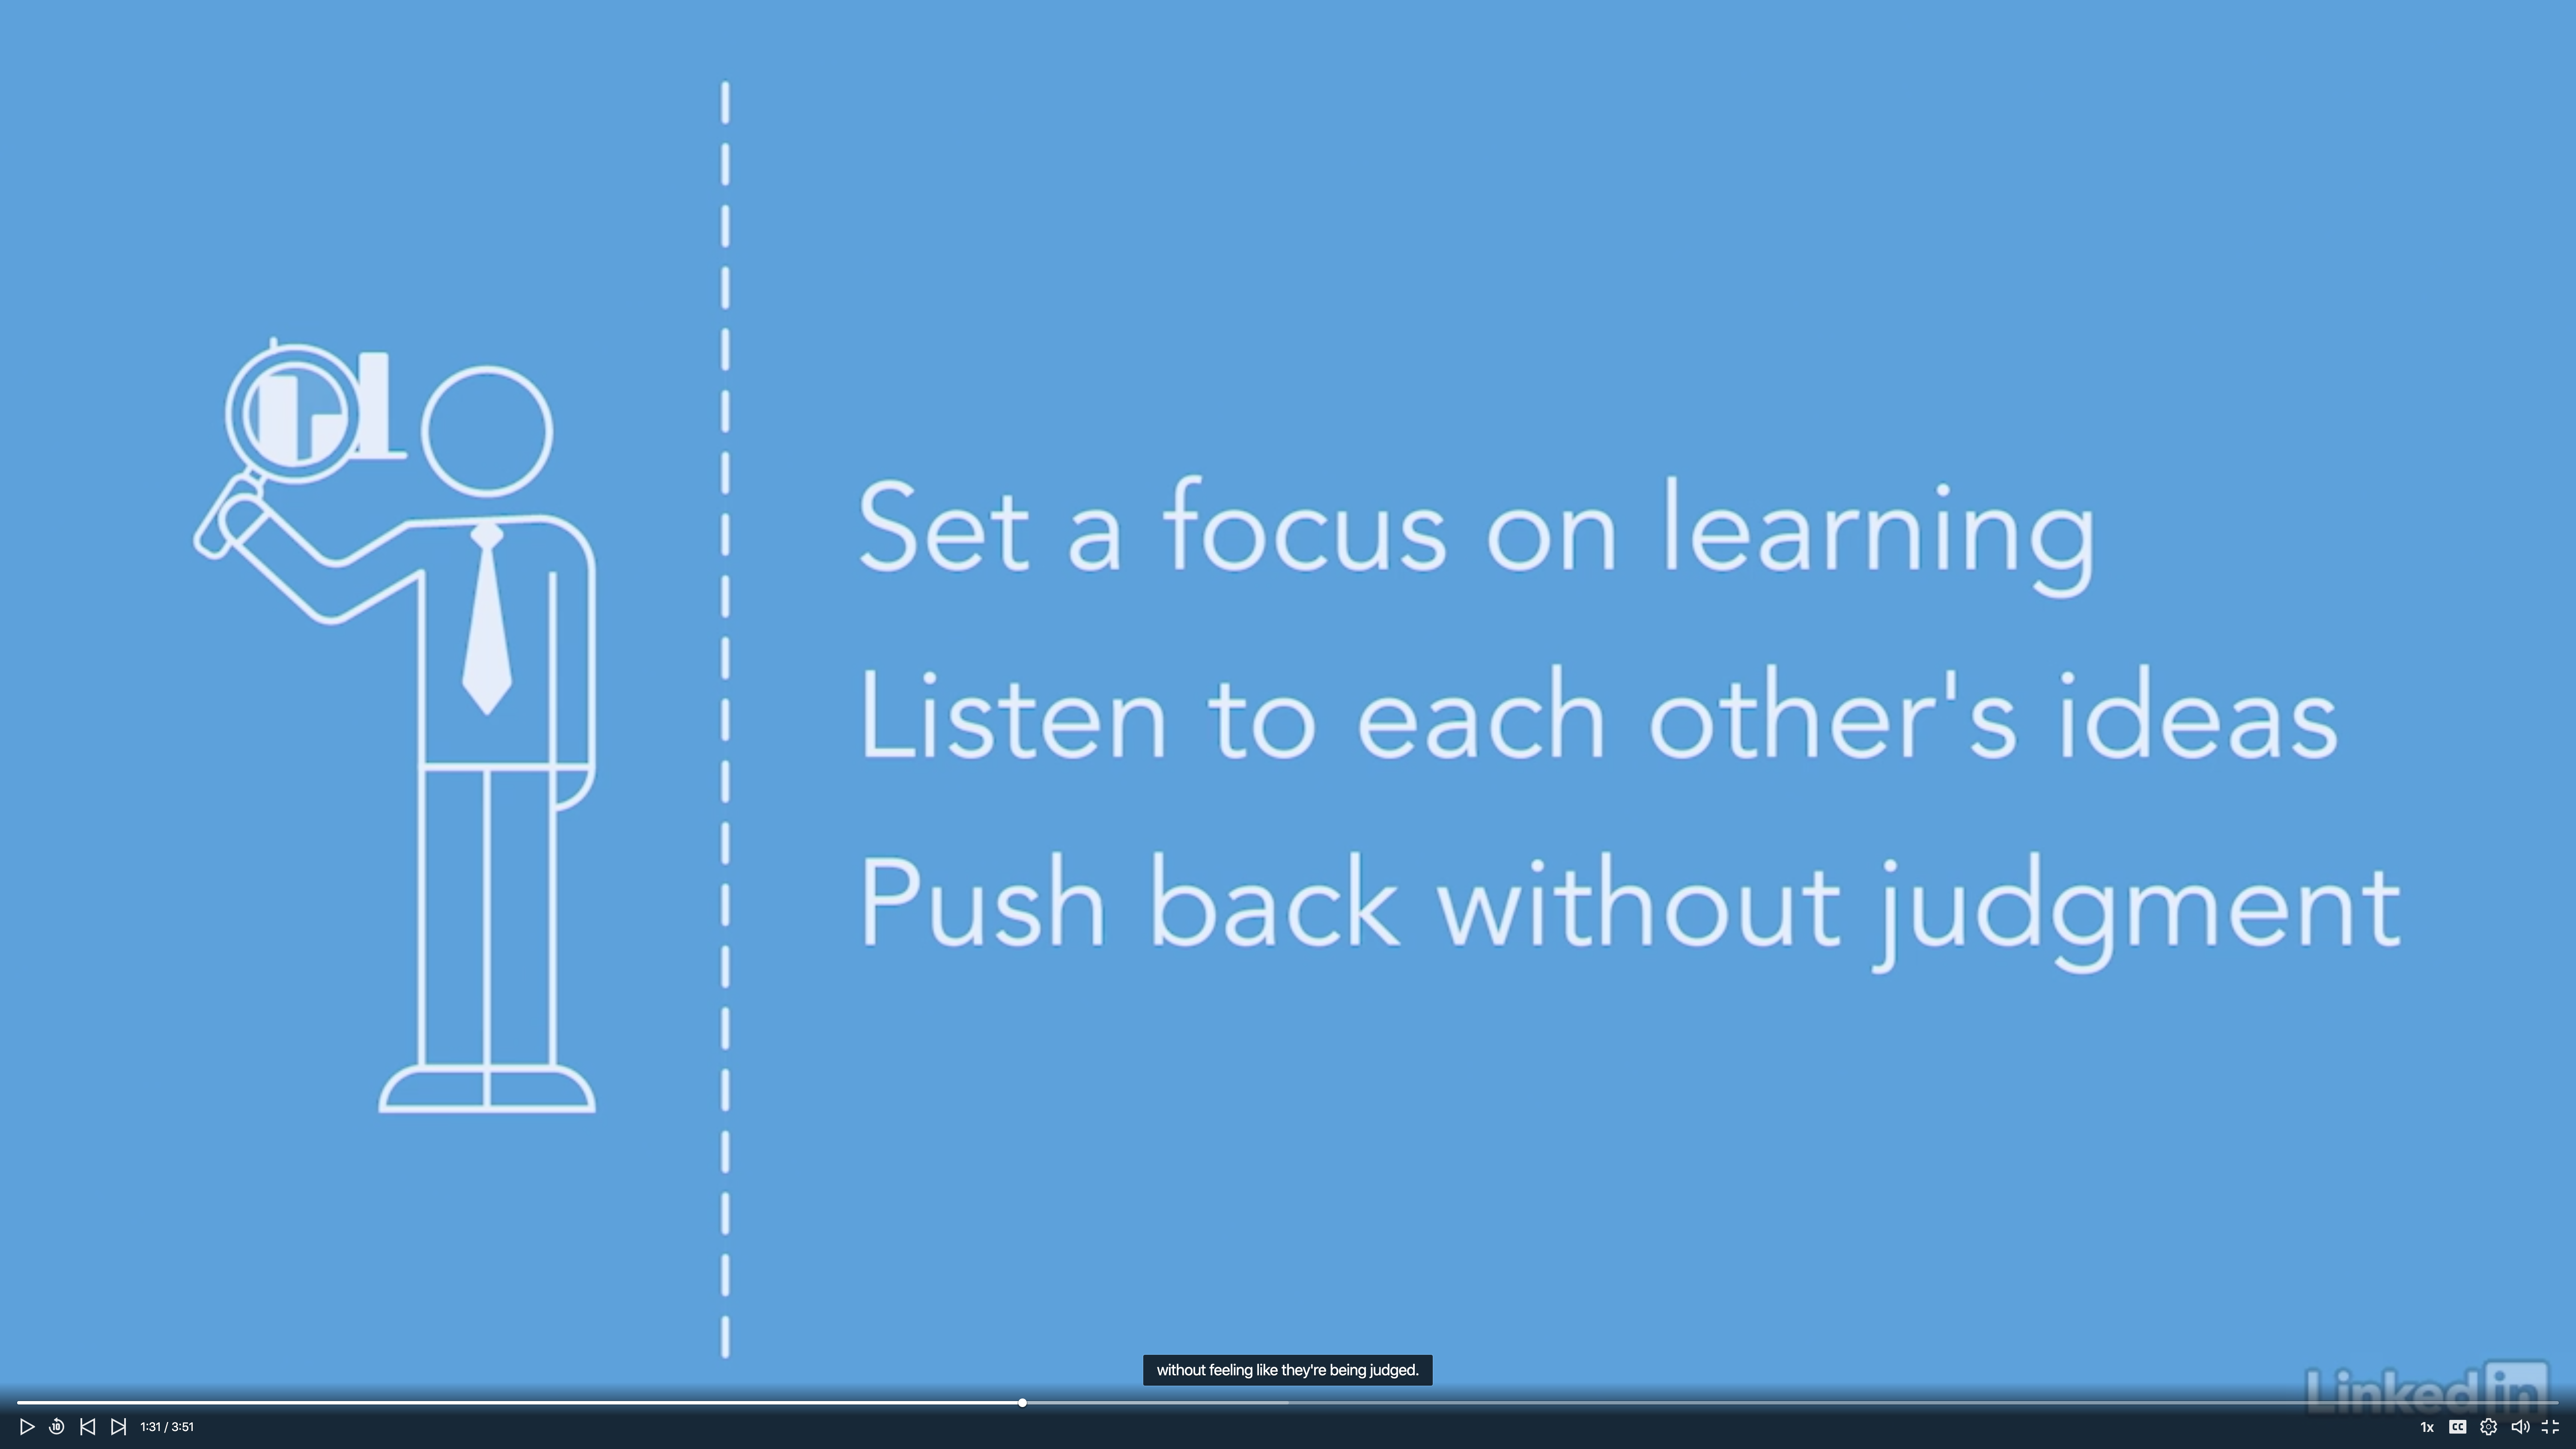
- When your team applies strong sense critical thinking, it should feel like an open conversation. No one should feel like they’re defending themselves.
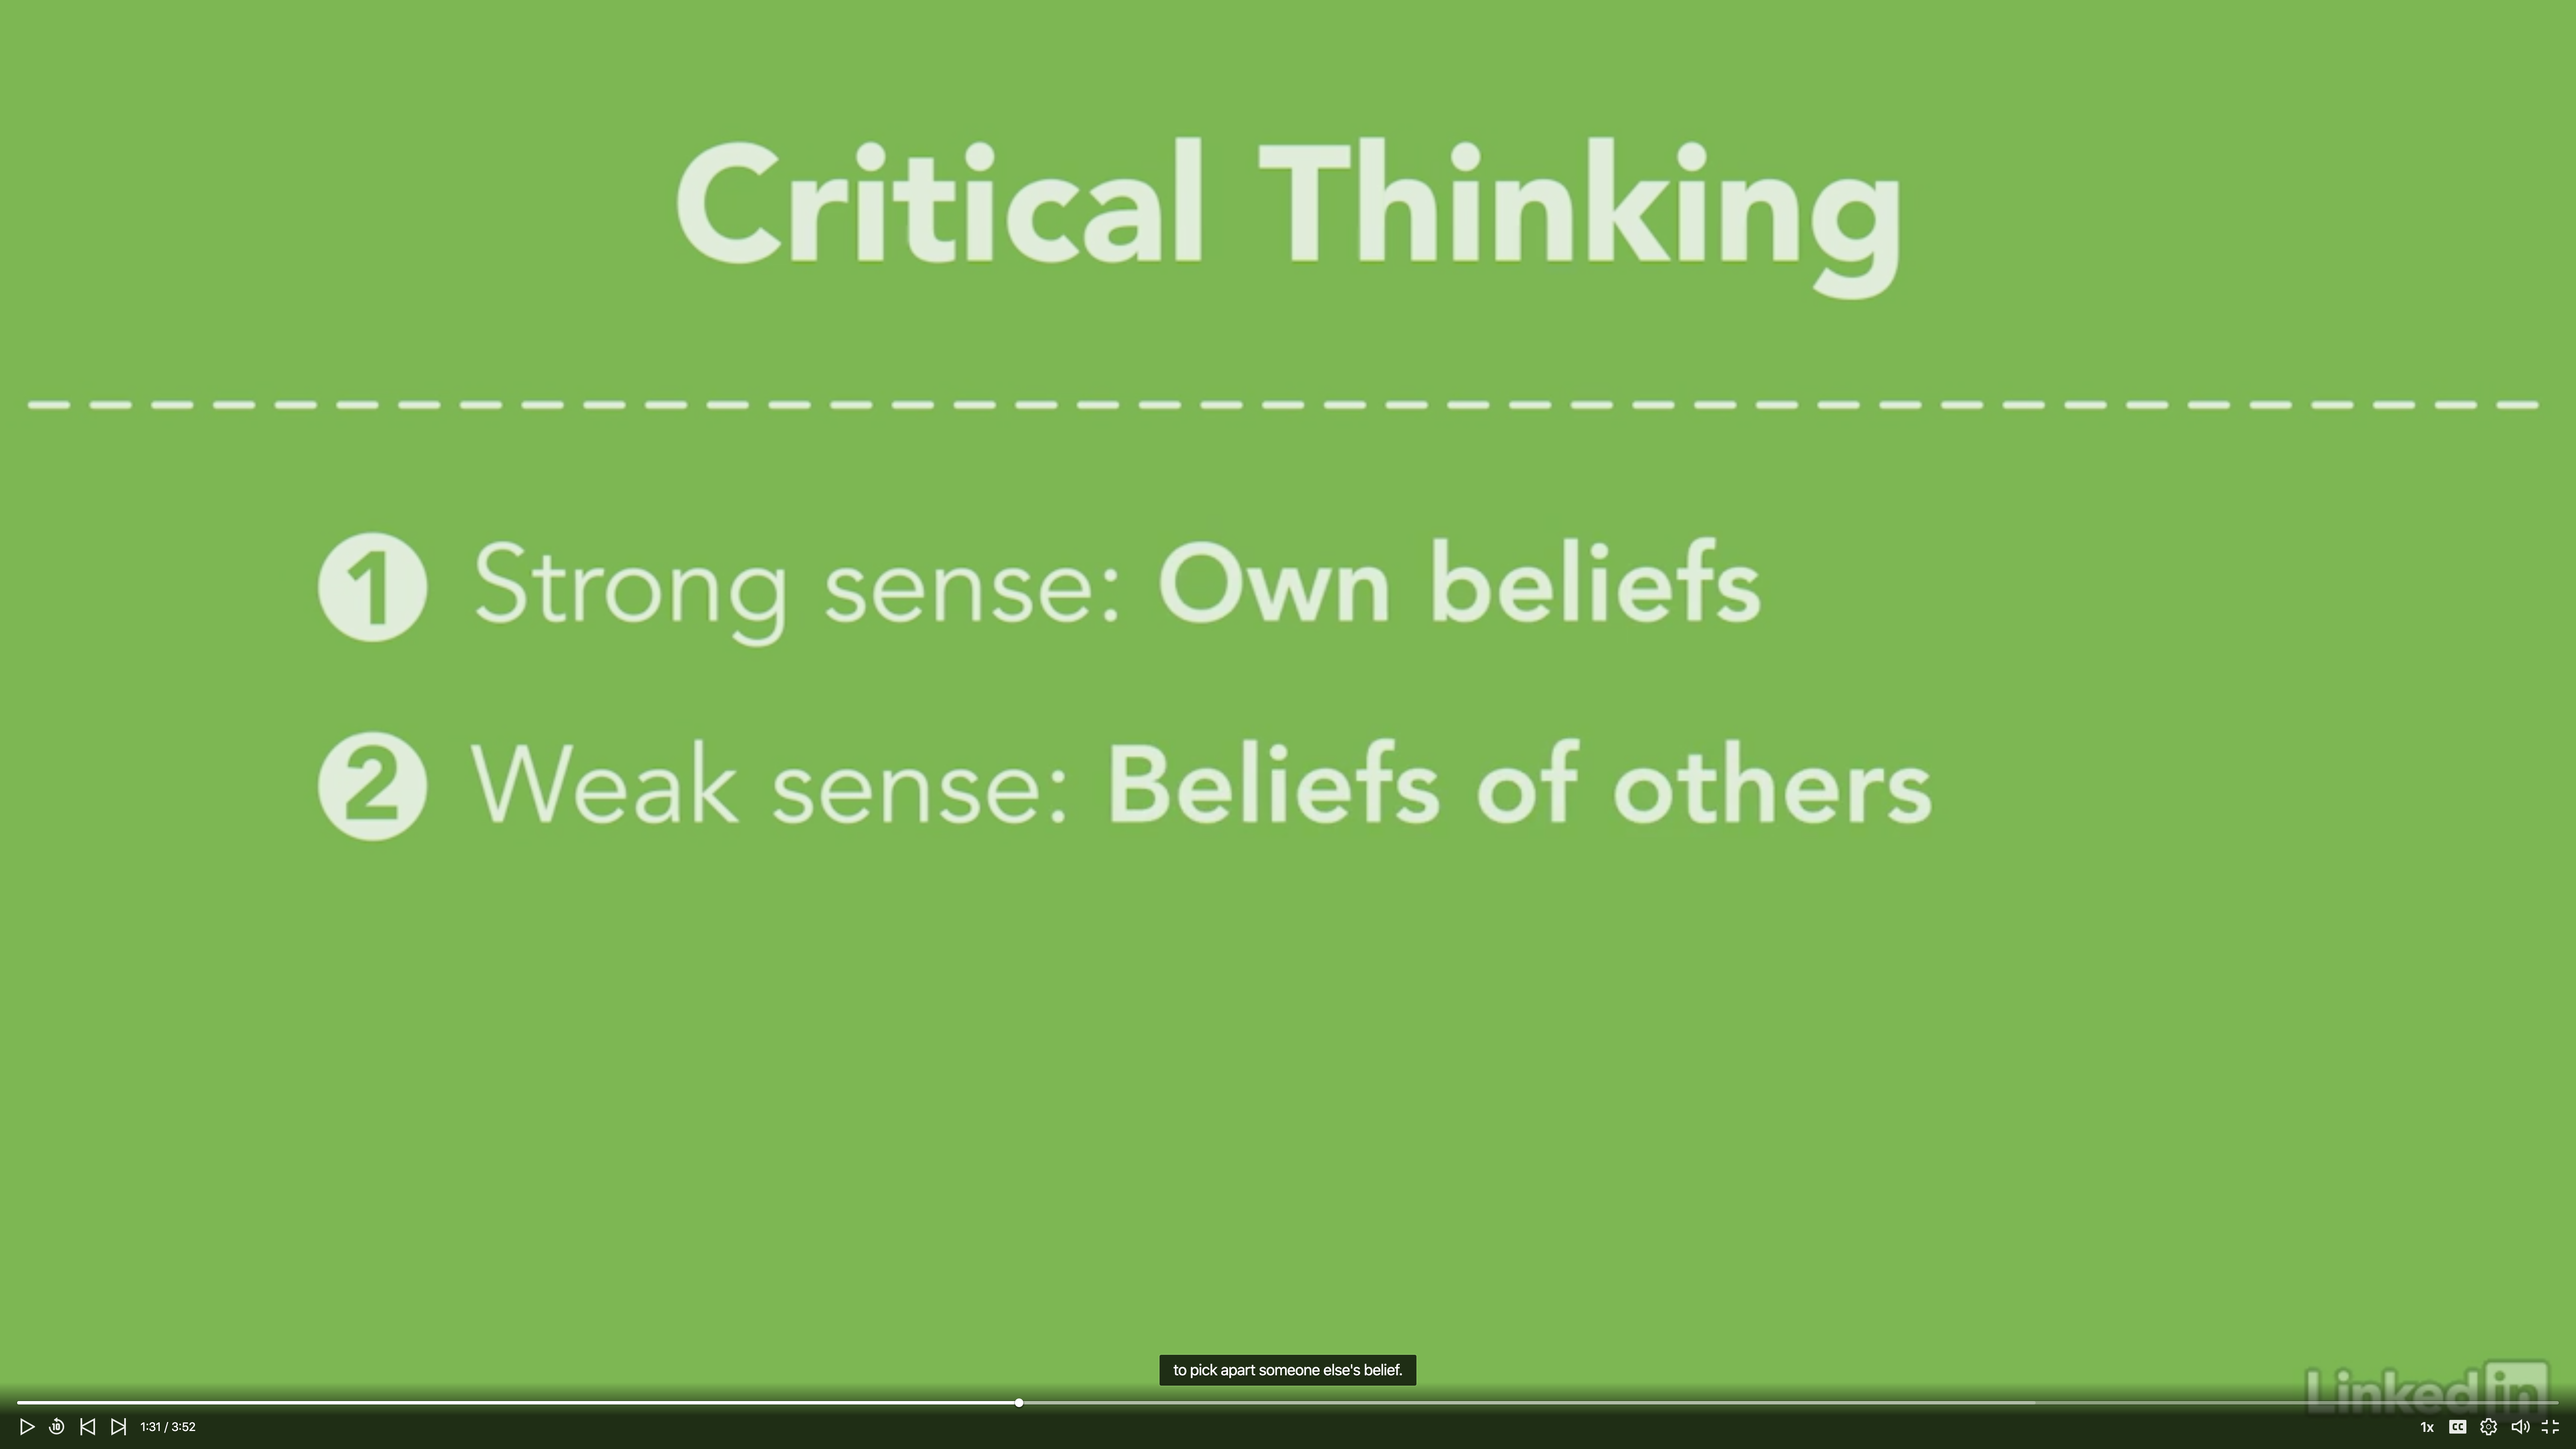
- Strong sense critical thinking is when you think of questions about your own beliefs.
- Weak sense critical thinking is when you only find critical questions to pick apart someone else’s beliefs.
People prefer to question your opinion for defending their position instead of help you to build new questions.
Example
2. Encourage Questions
Run question meetings
- Question is not a judgement; it is way to learn.
- Asking good questions is the core of the scientific method.
- If you are the research leader. It is your responsibility to be a questioning leader.
- One of the best way is to run a question meeting.
- Encourage the participants ask questions before making statements (called question-first approach).
- Don’t try to answer your question. Give everyone some time to think about their answers.
- People who ask tough questions will often gain more insights than people who make quick statements.
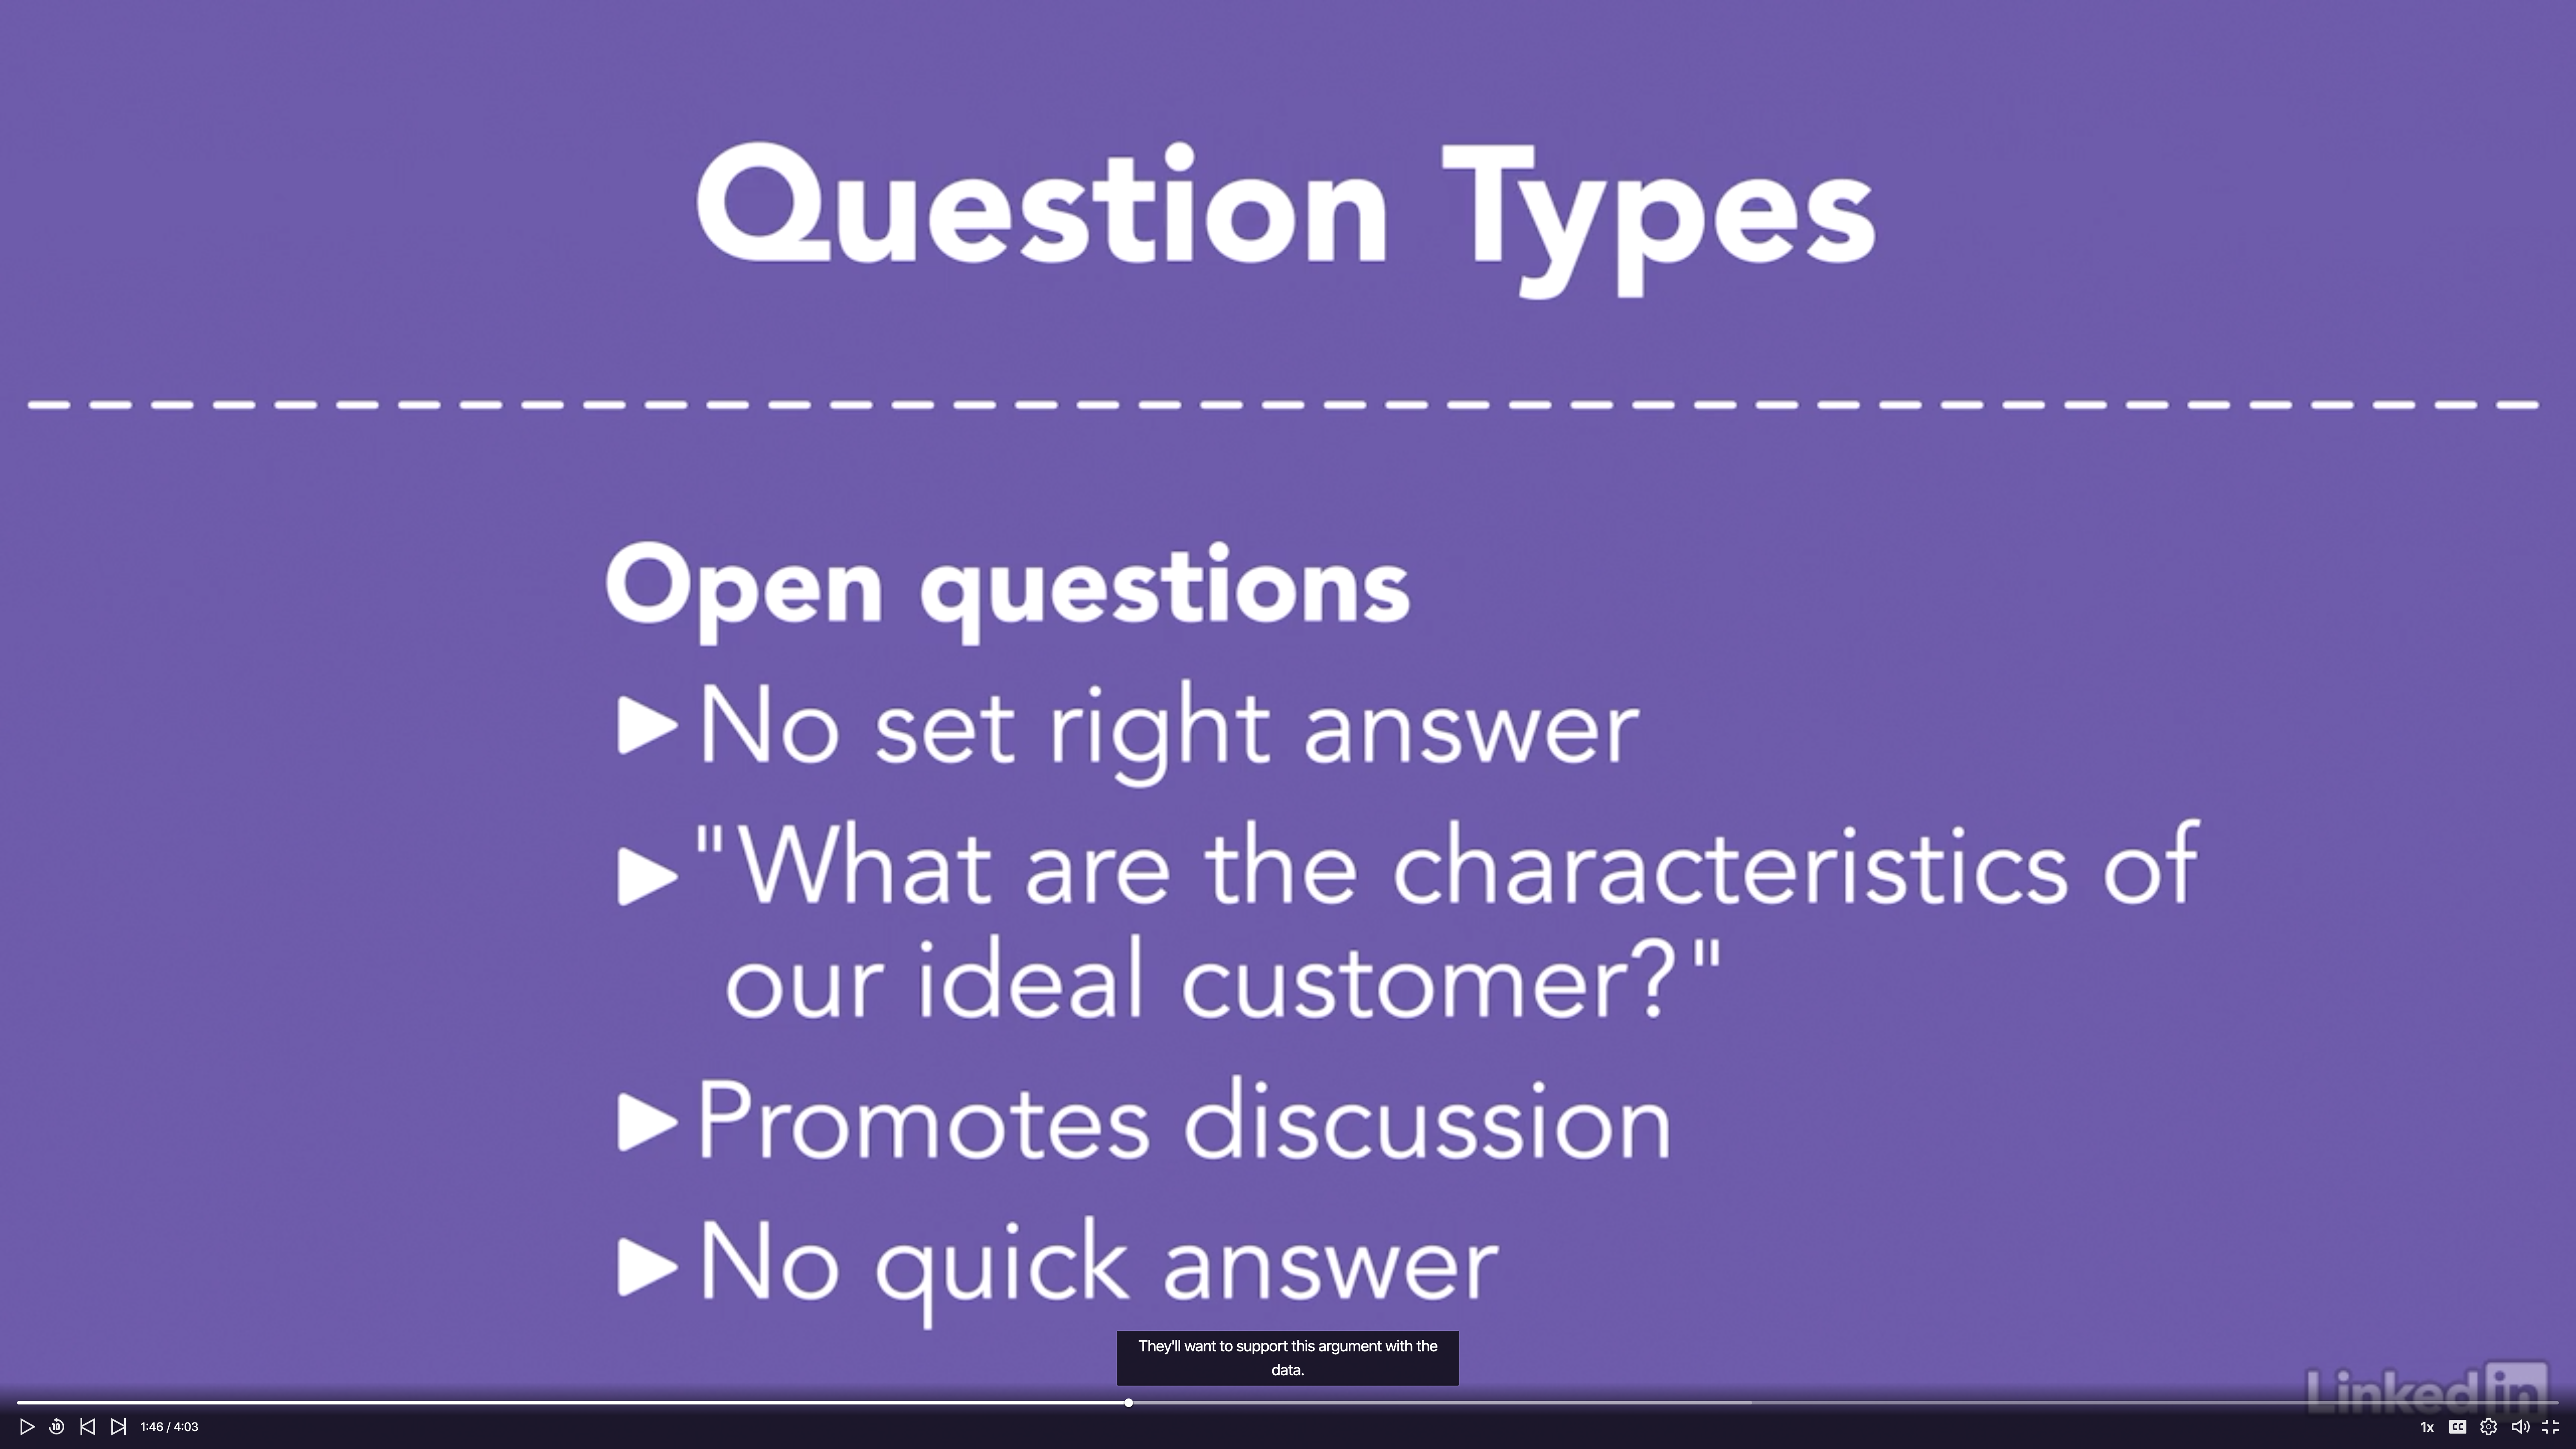
Identify question types
- Open Questions: no right answers
- Time consuming
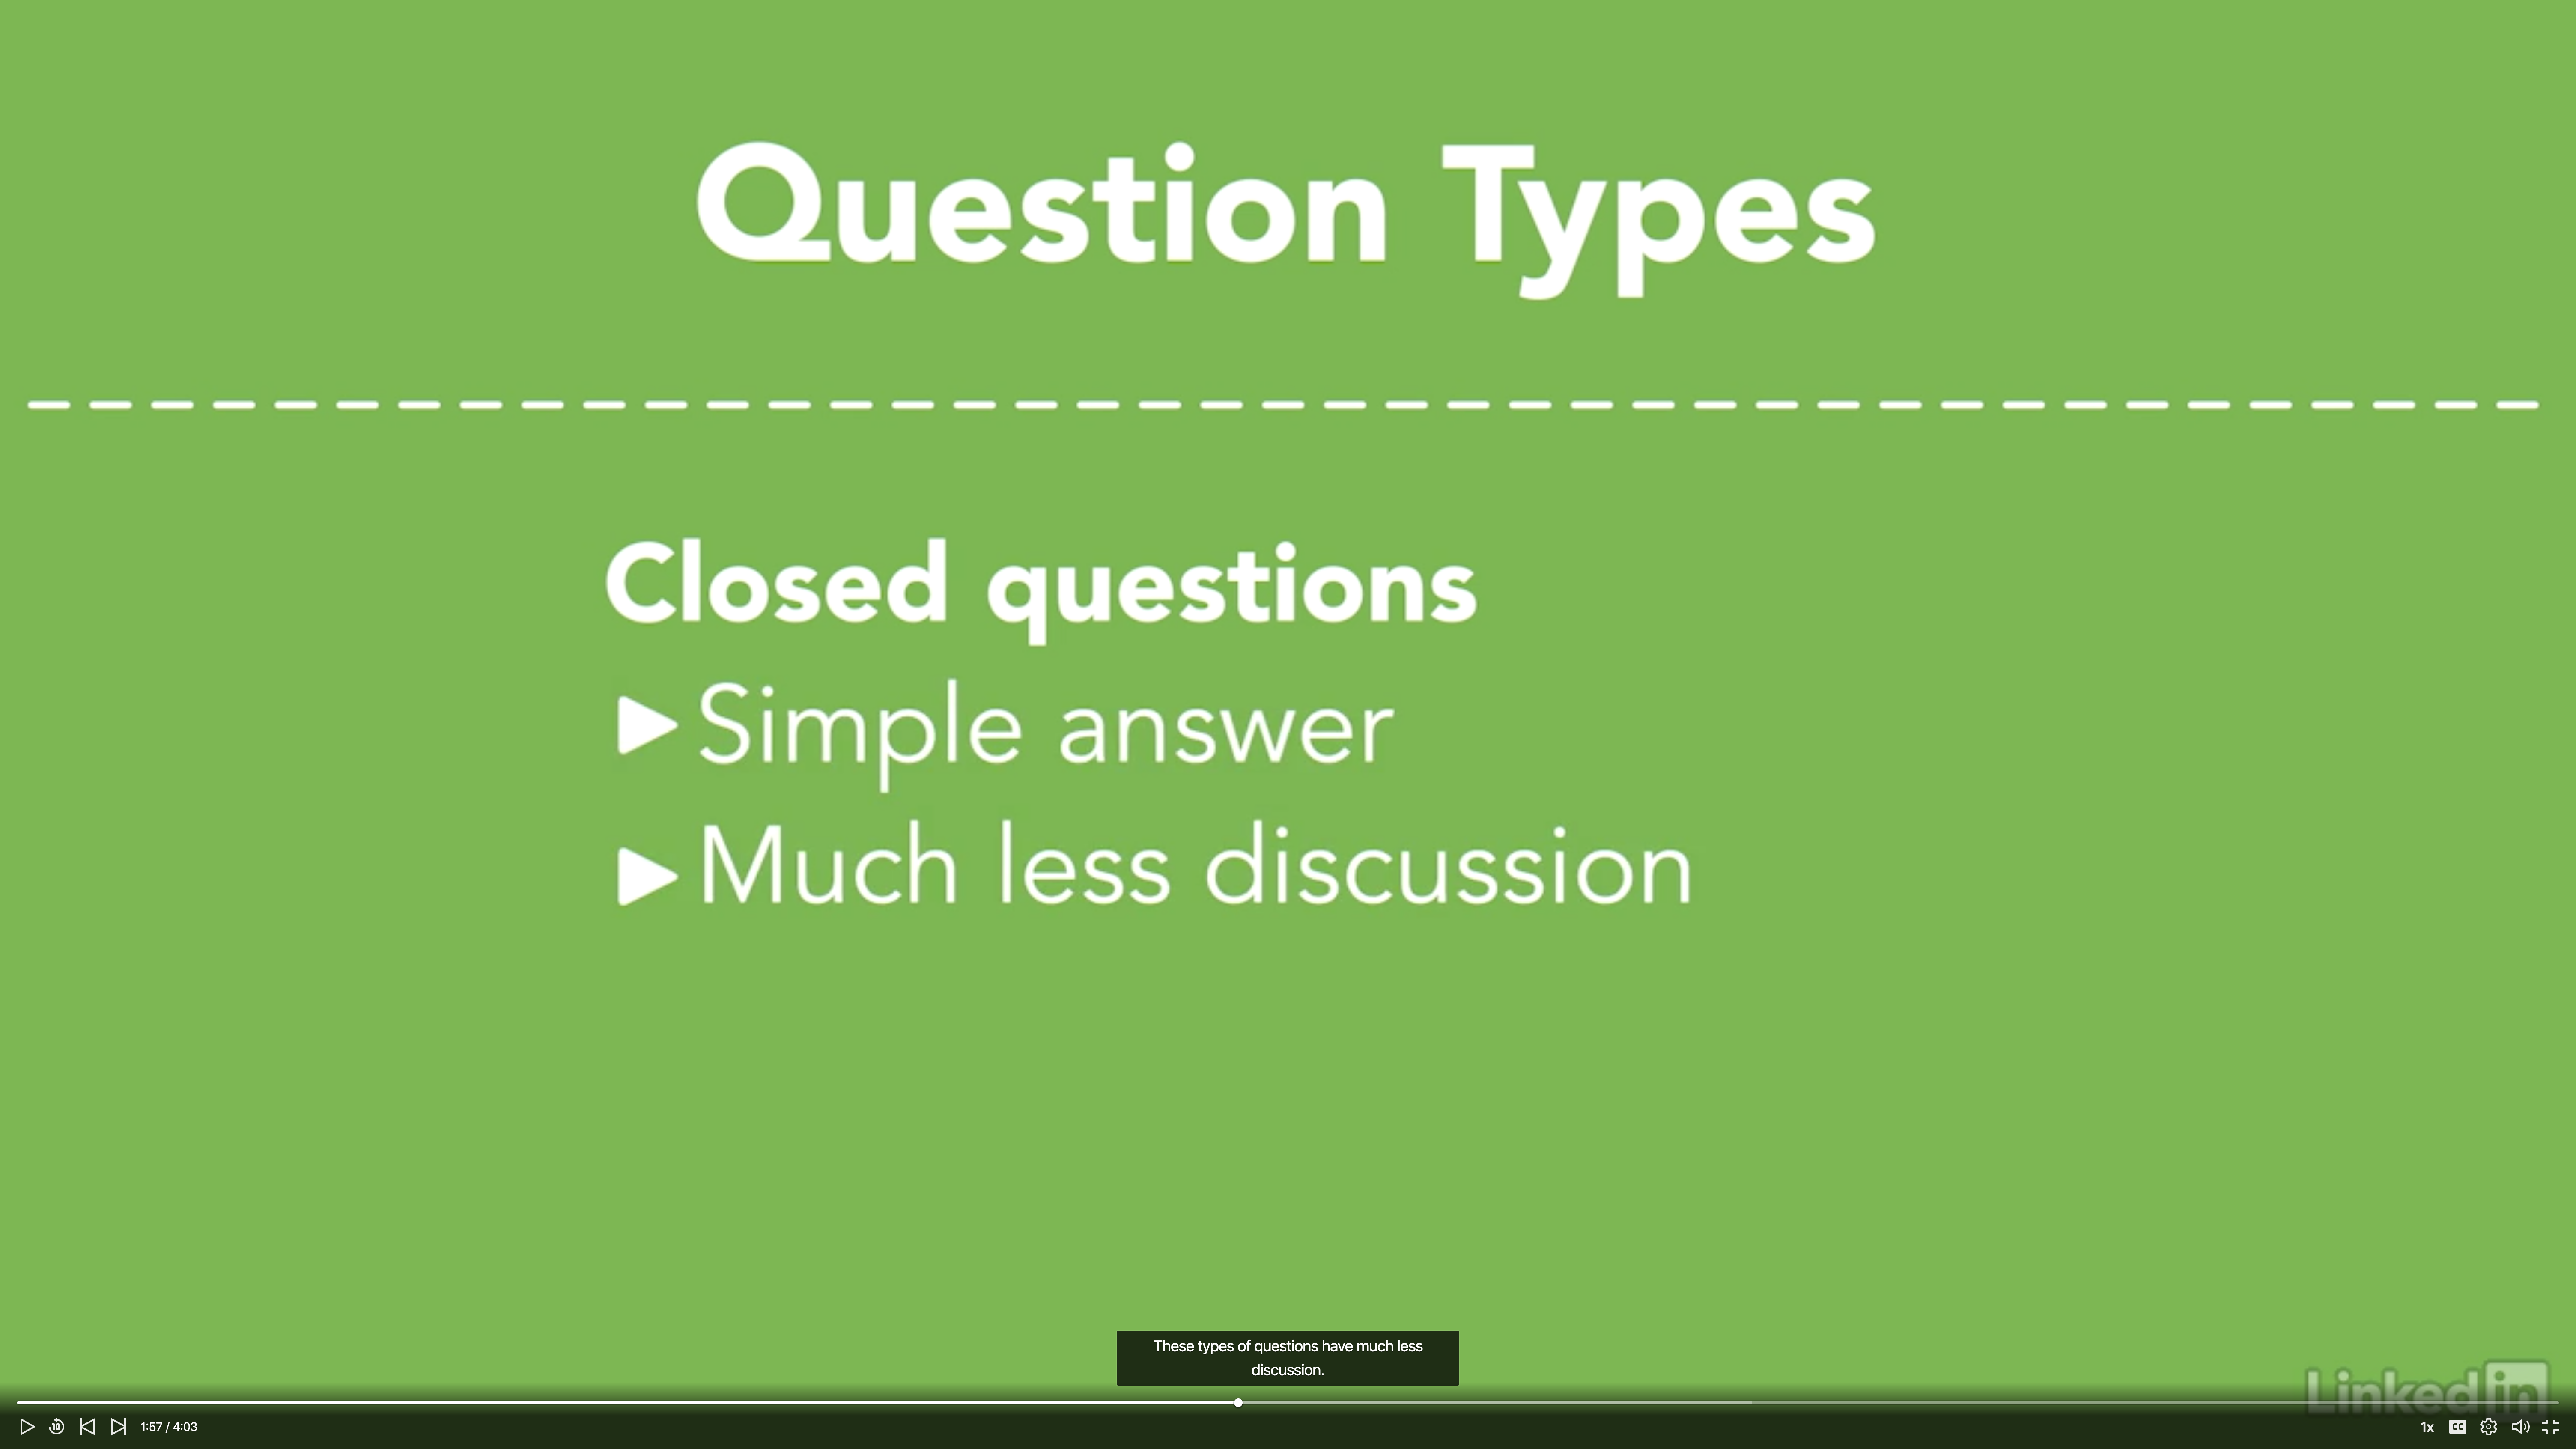
- Closed Questions
- Insight narrow
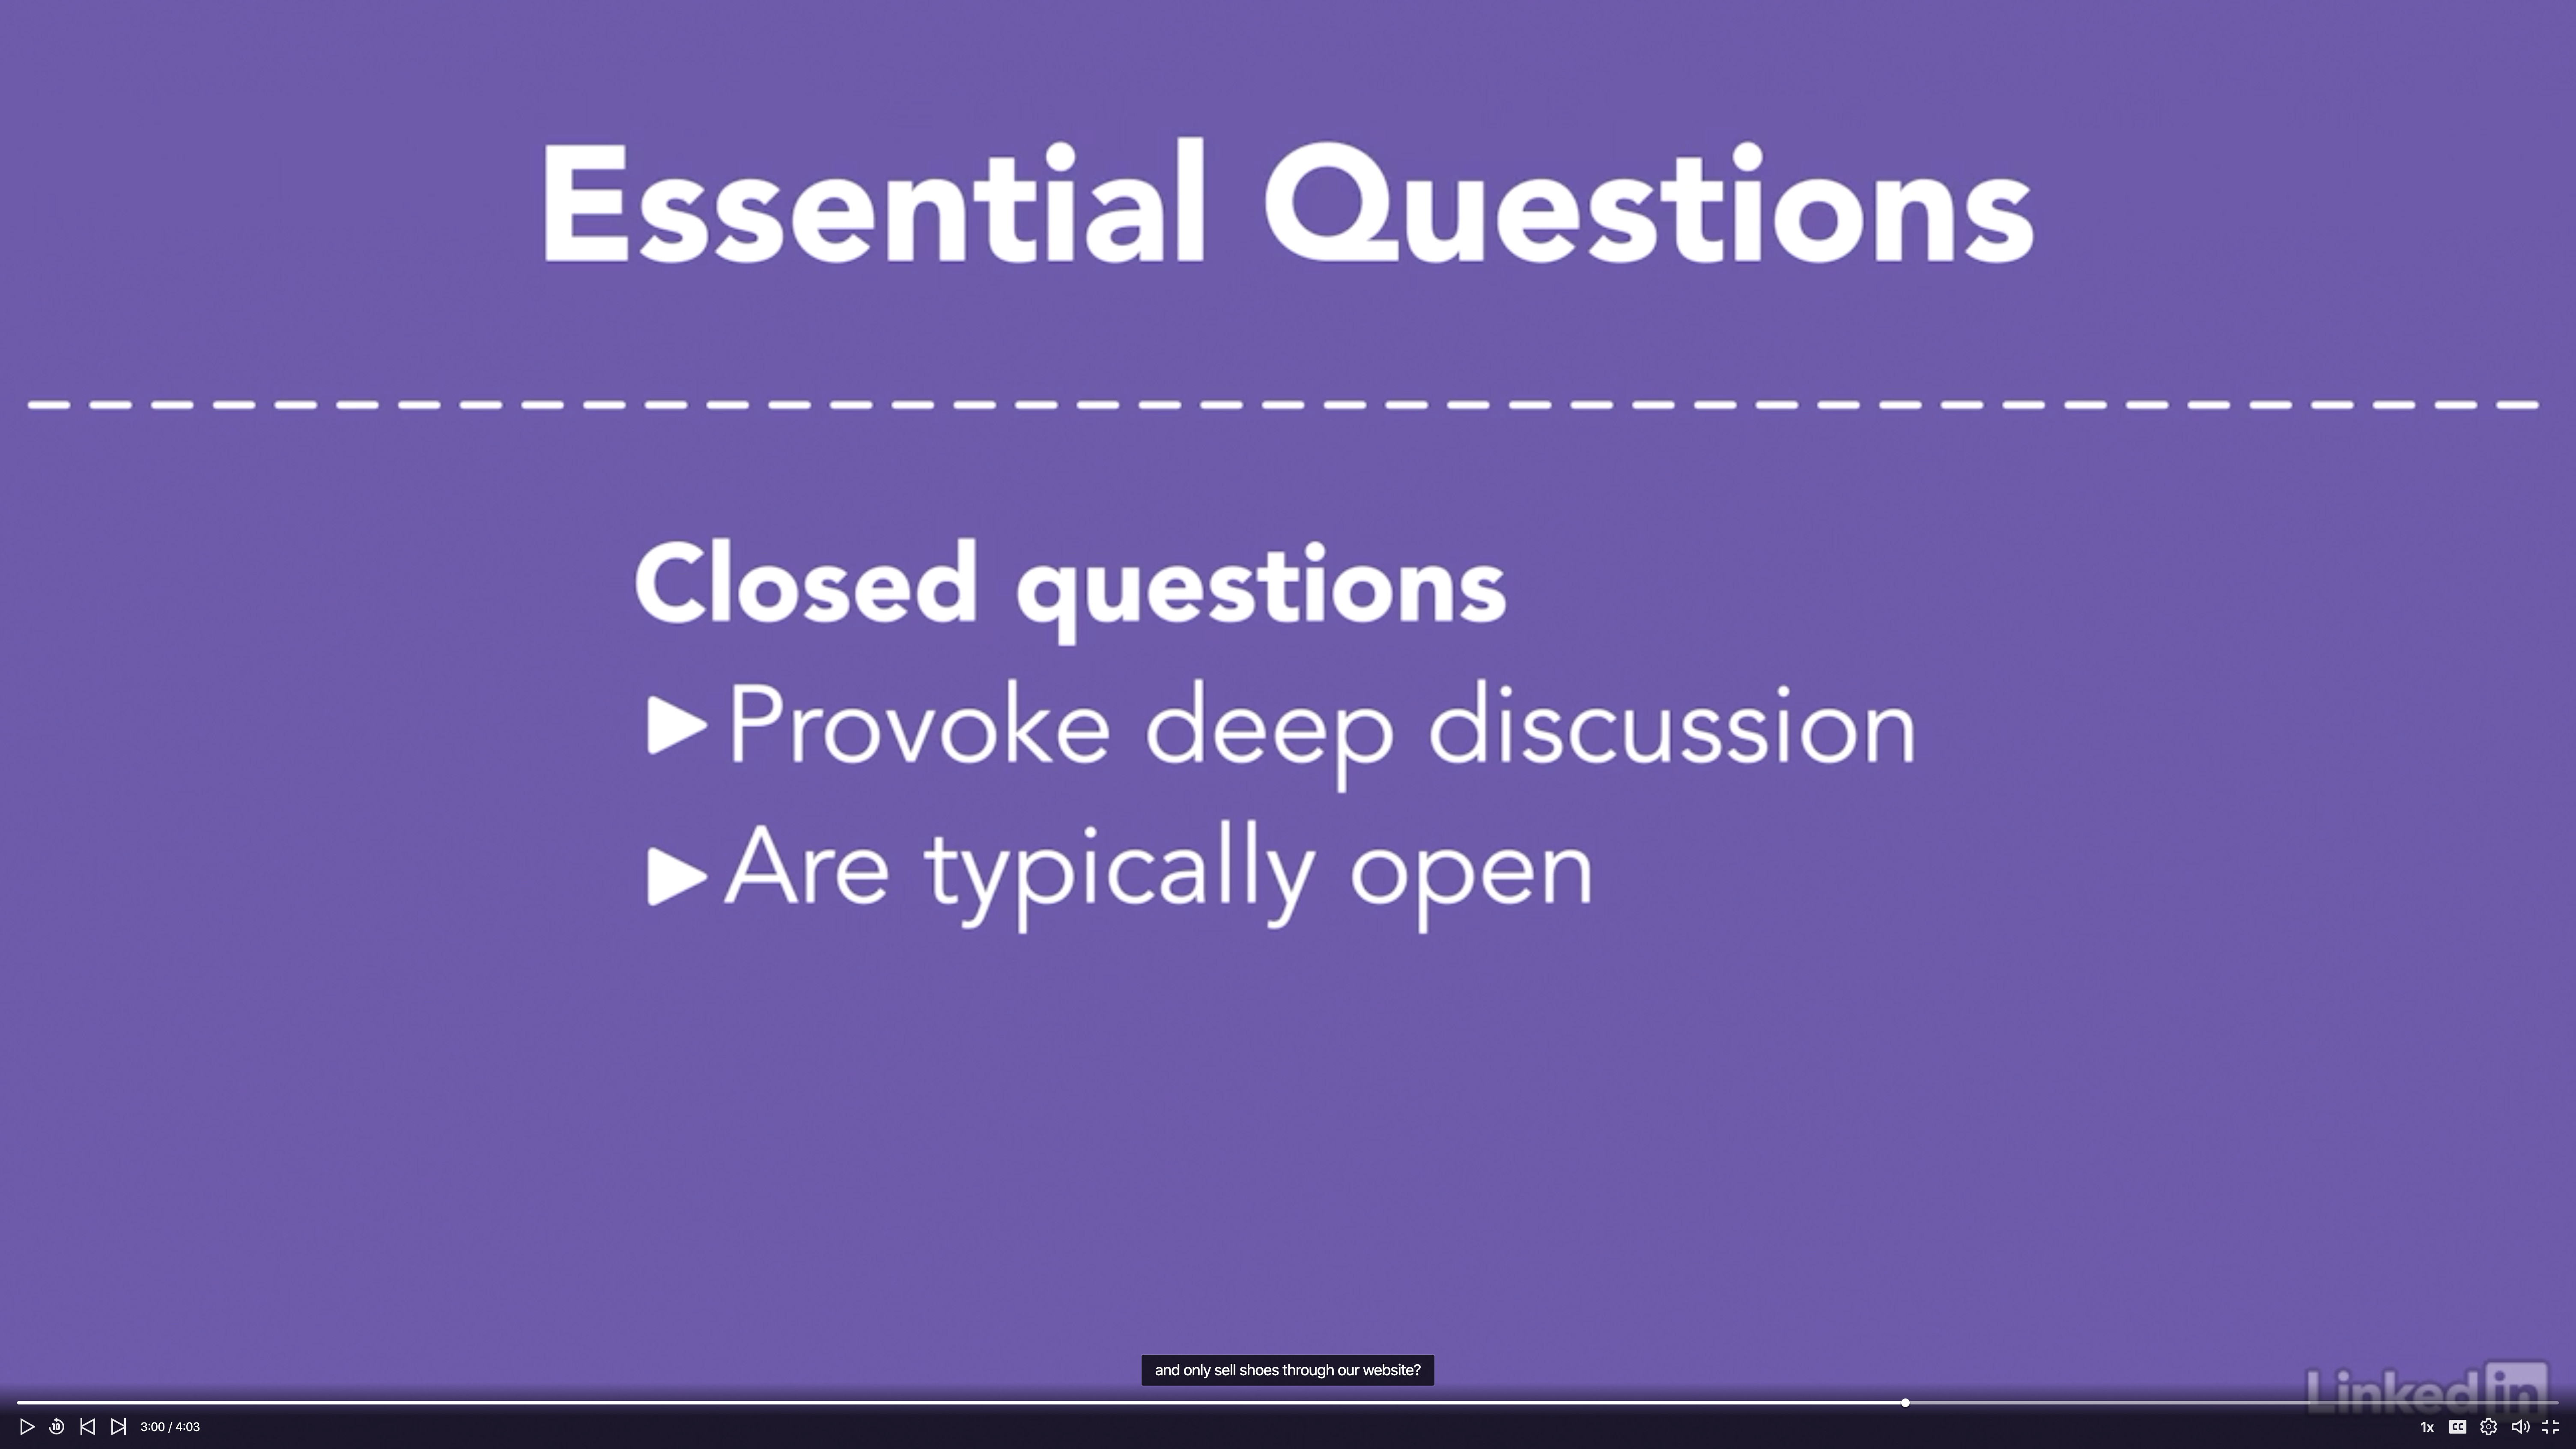
- Essential Questions: designed to provoke the team into deep discussion.
- Usually open
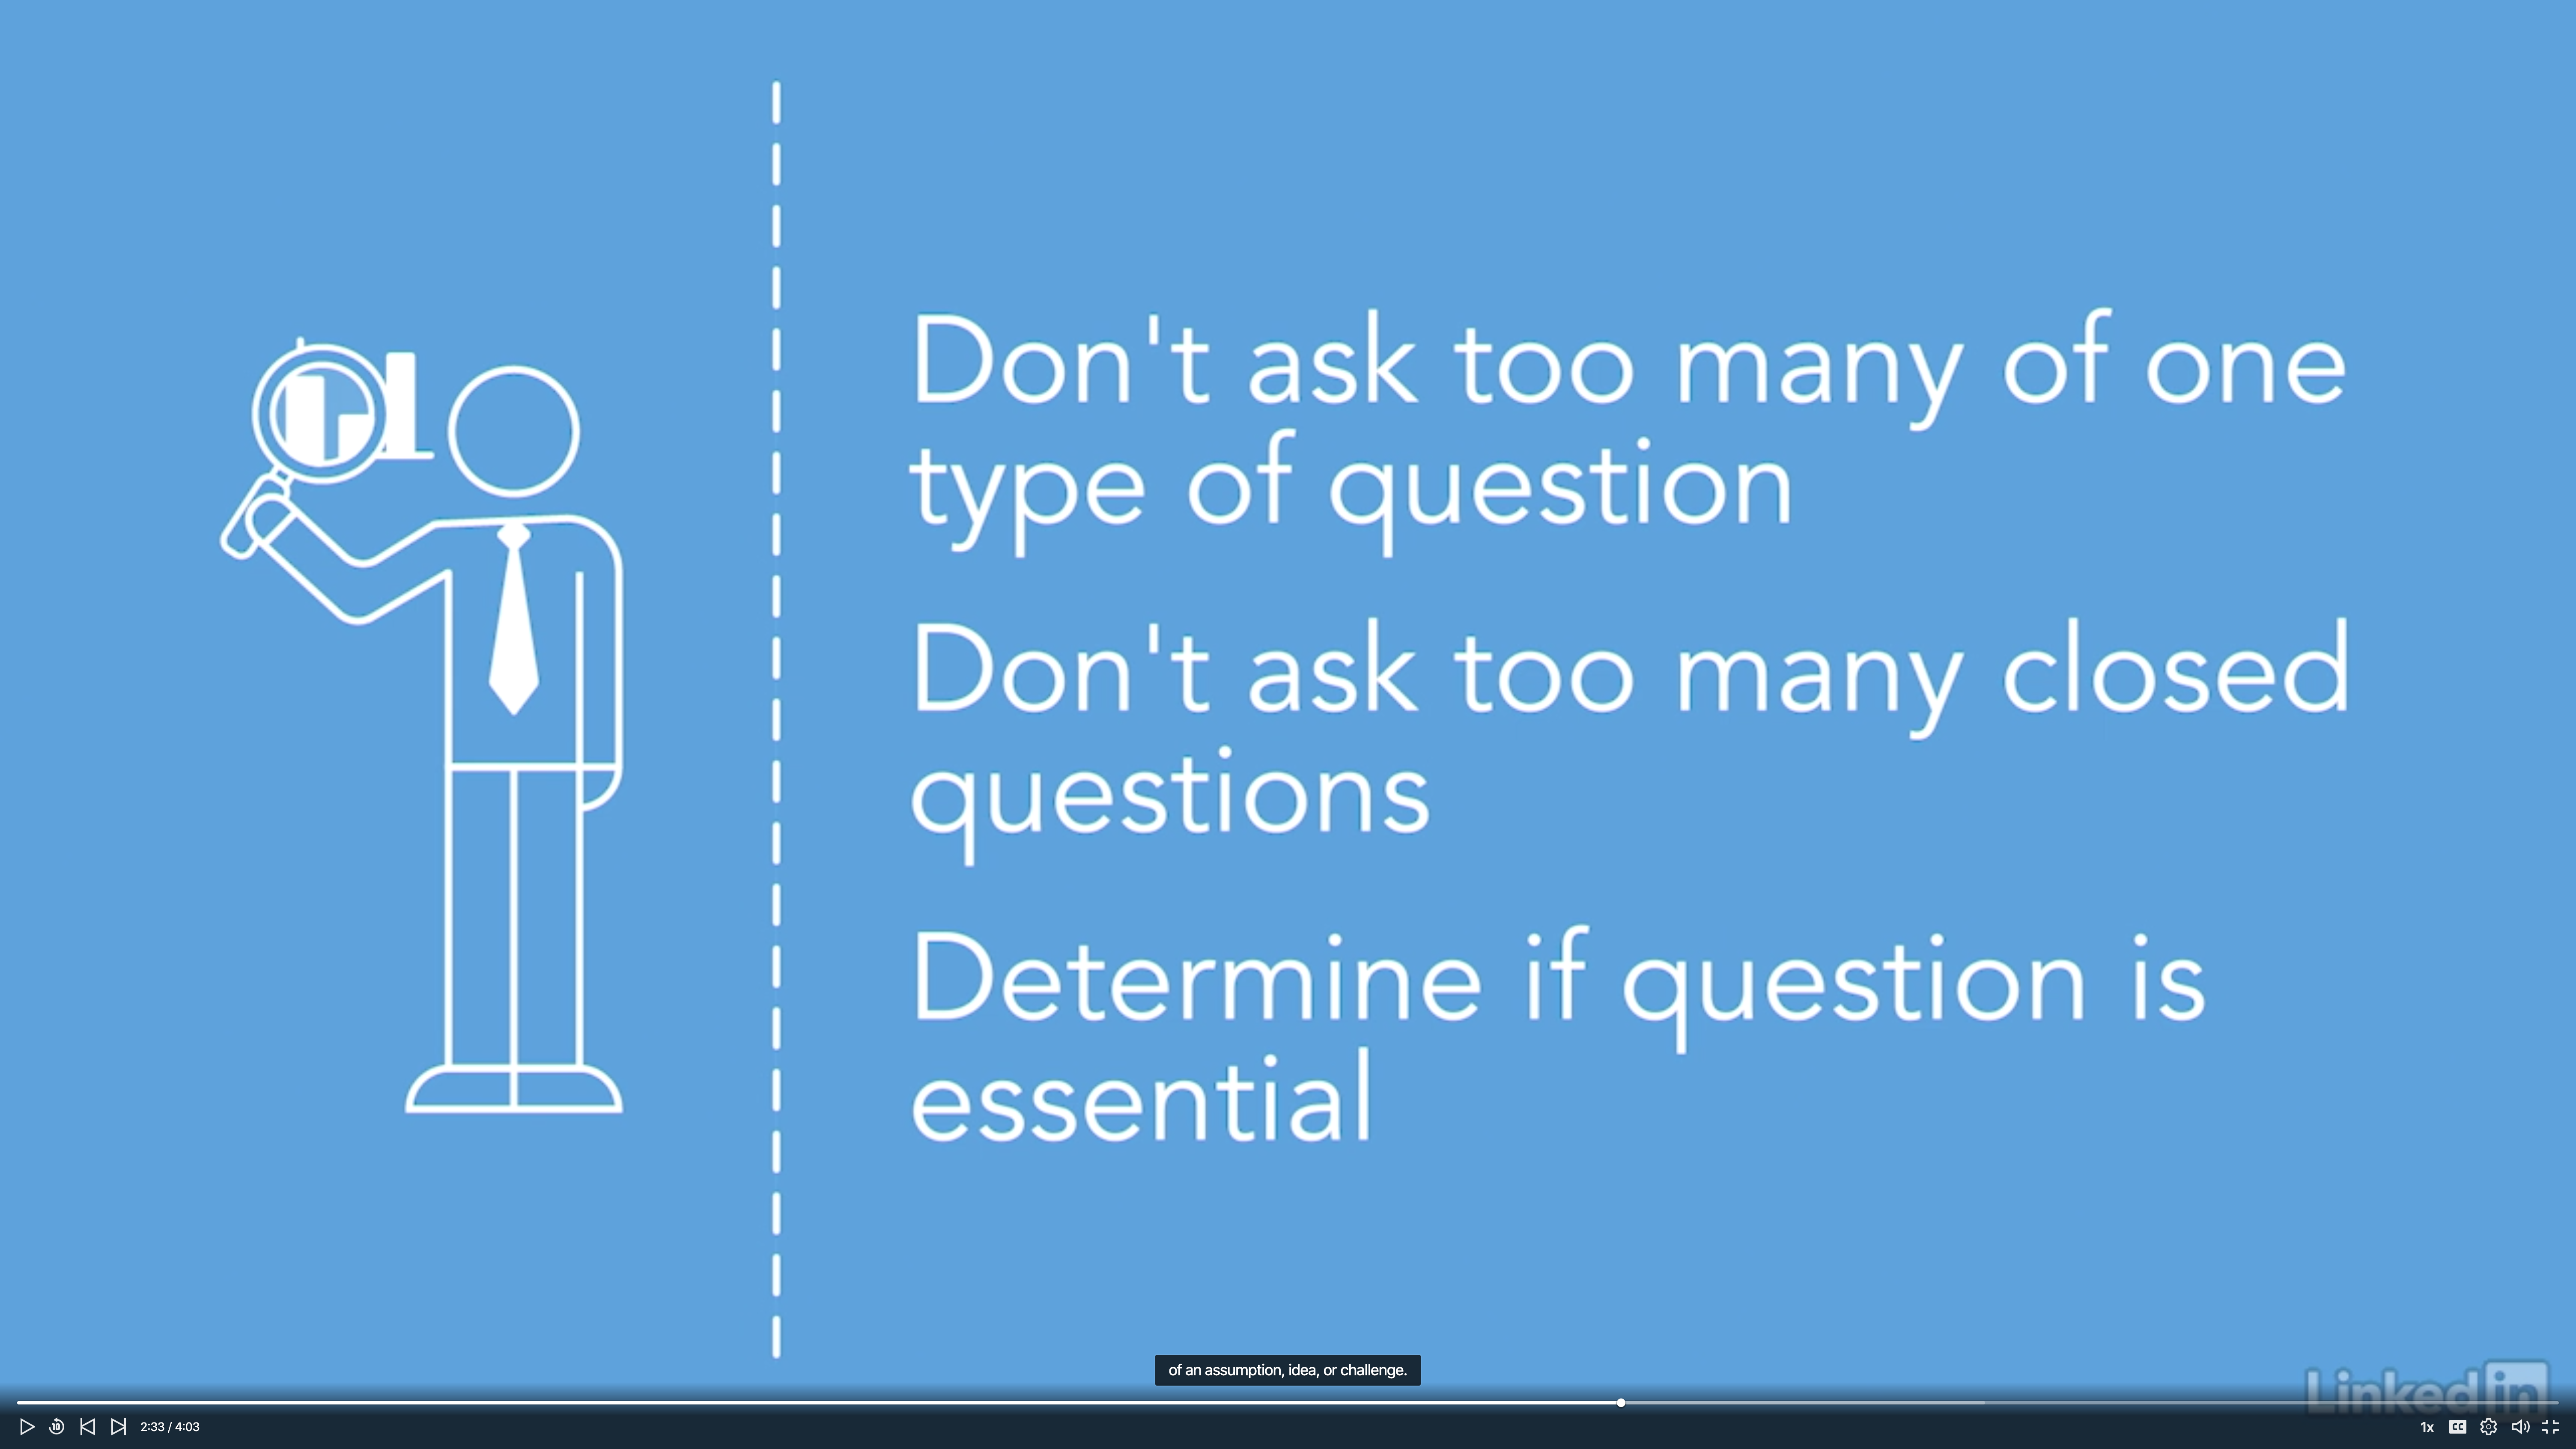
- Nonessential Questions: are not bad thing
- Sometimes you have to run through some nonessential questions before you start asking ones that are essential.
- A good strategy is to ask many nonessential questions as a way to build up ideas to ask larger essential questions.
Example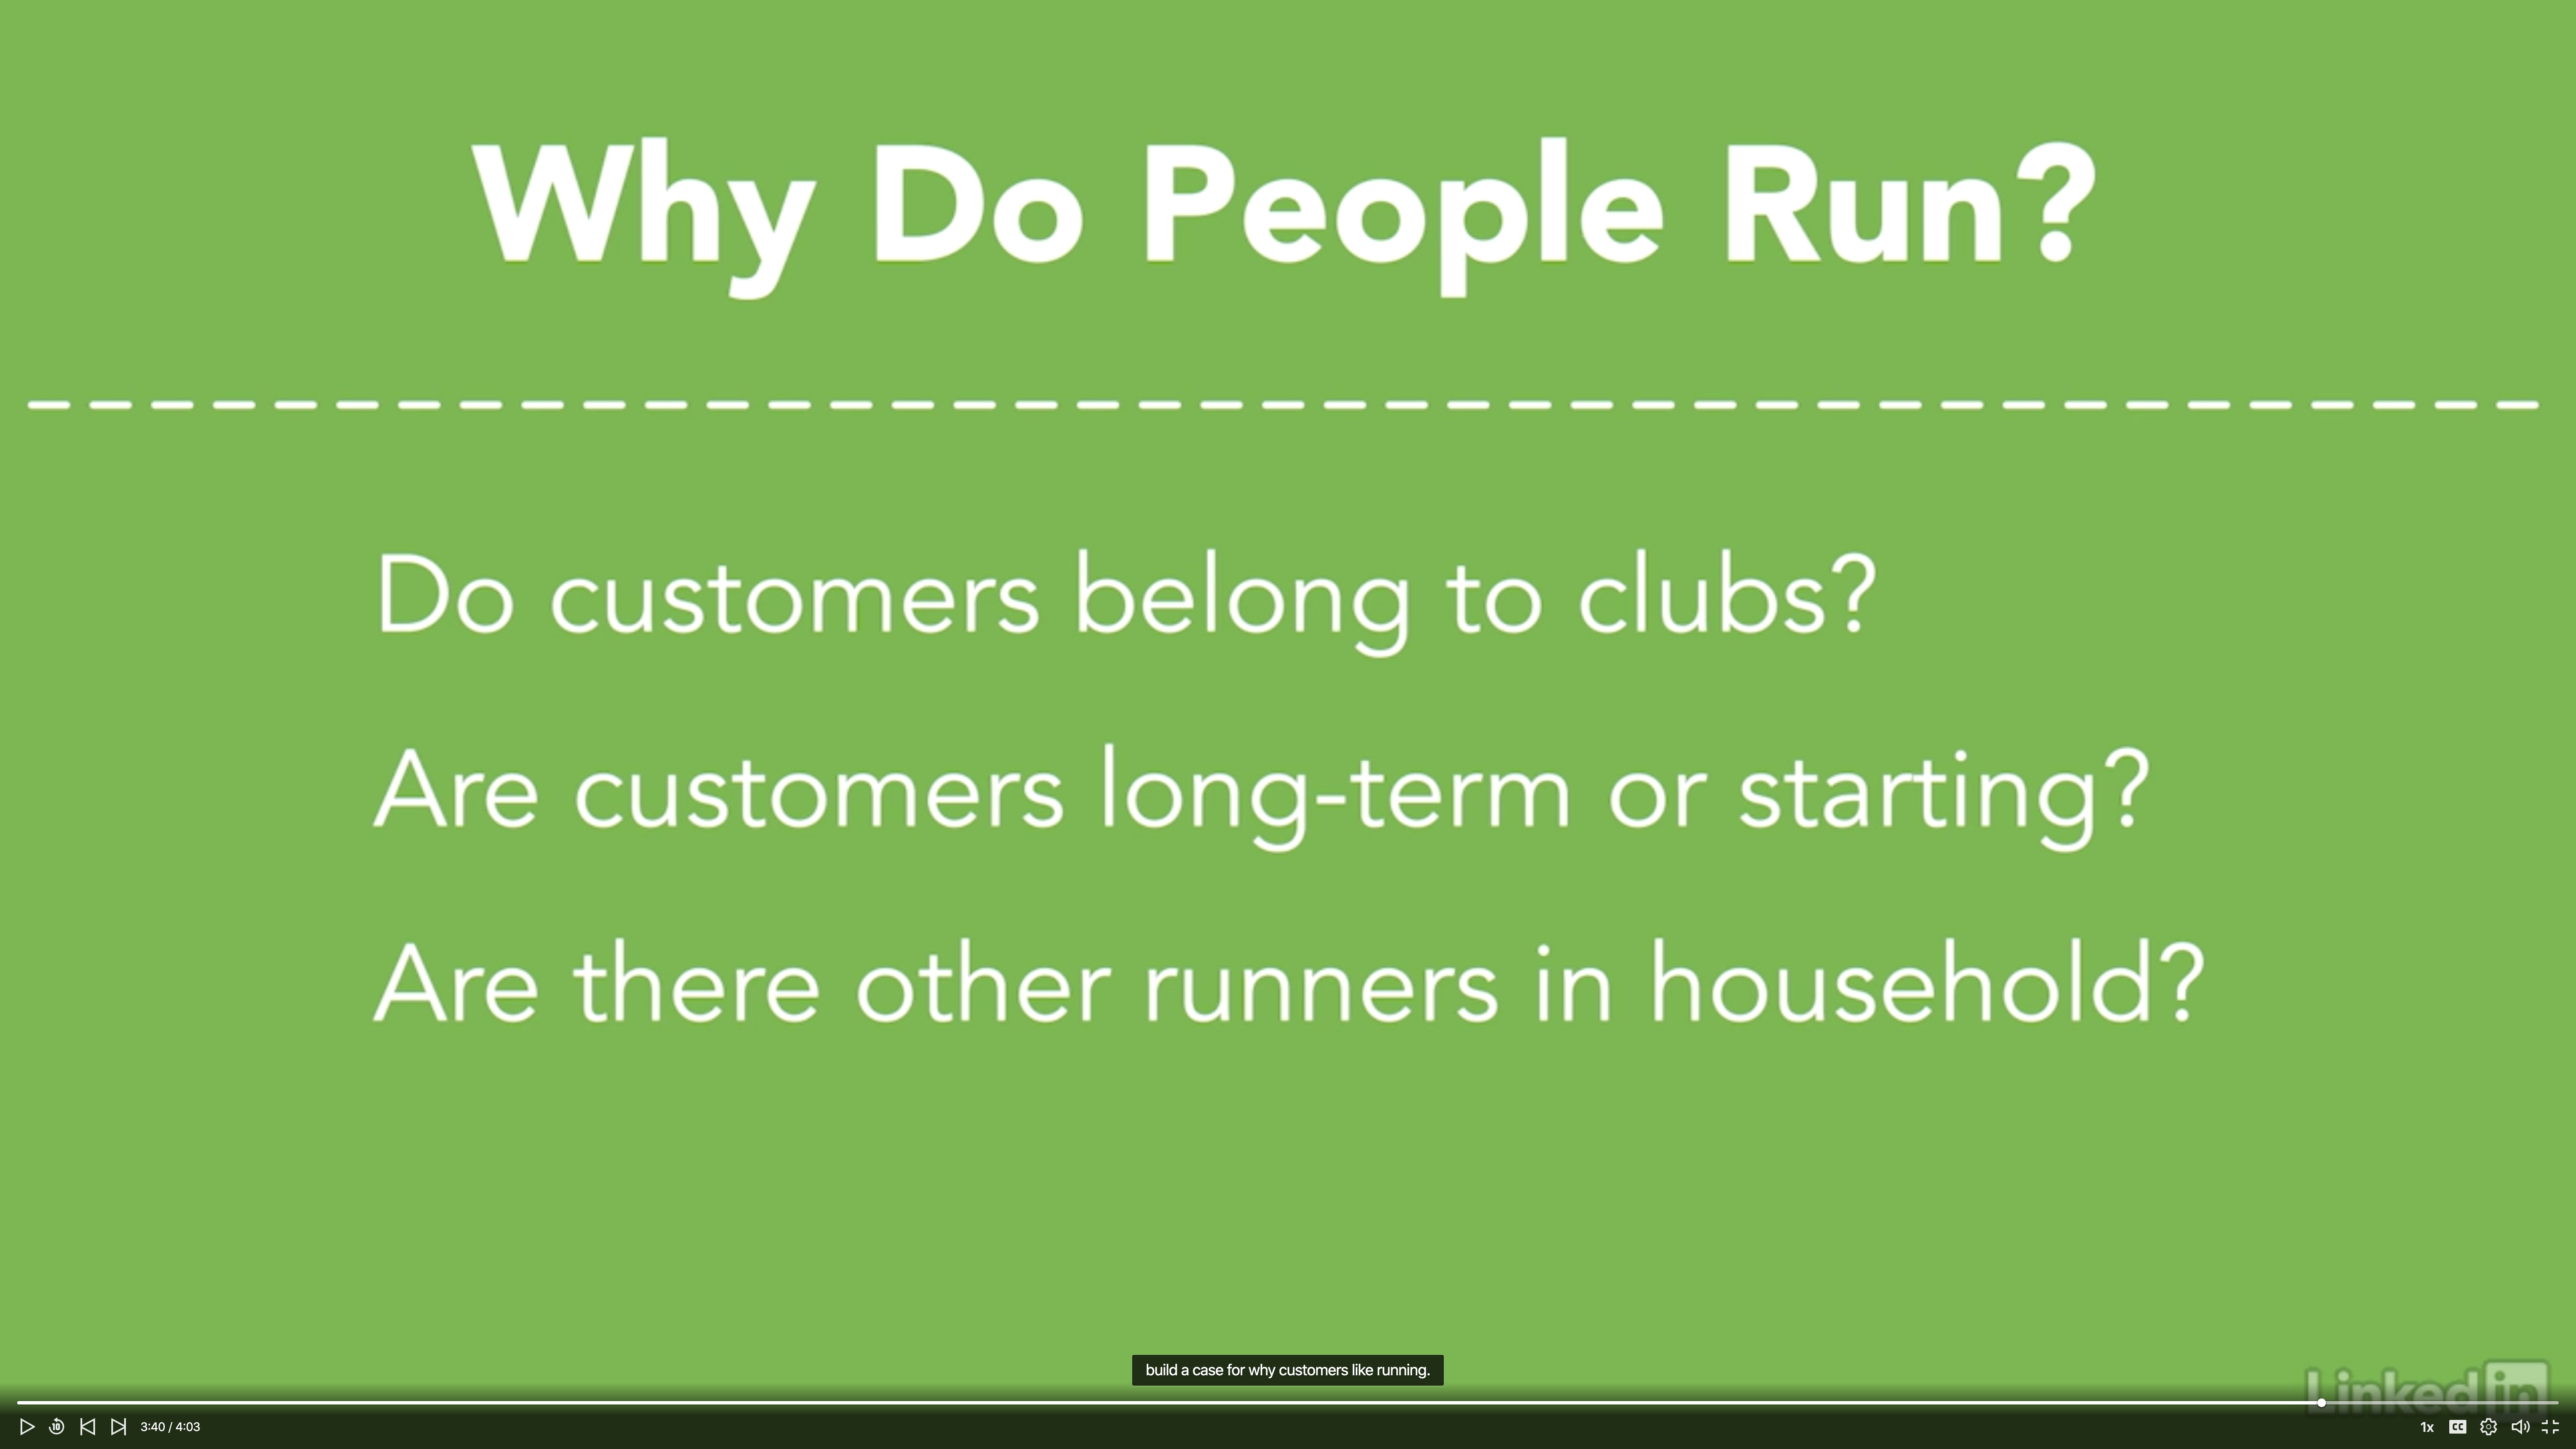
Organize your questions
- Usually the best way to organize your wall is to have sticky notes on a large whiteboard.
- Question wall is a clear way to communicate and organize questions in one place.
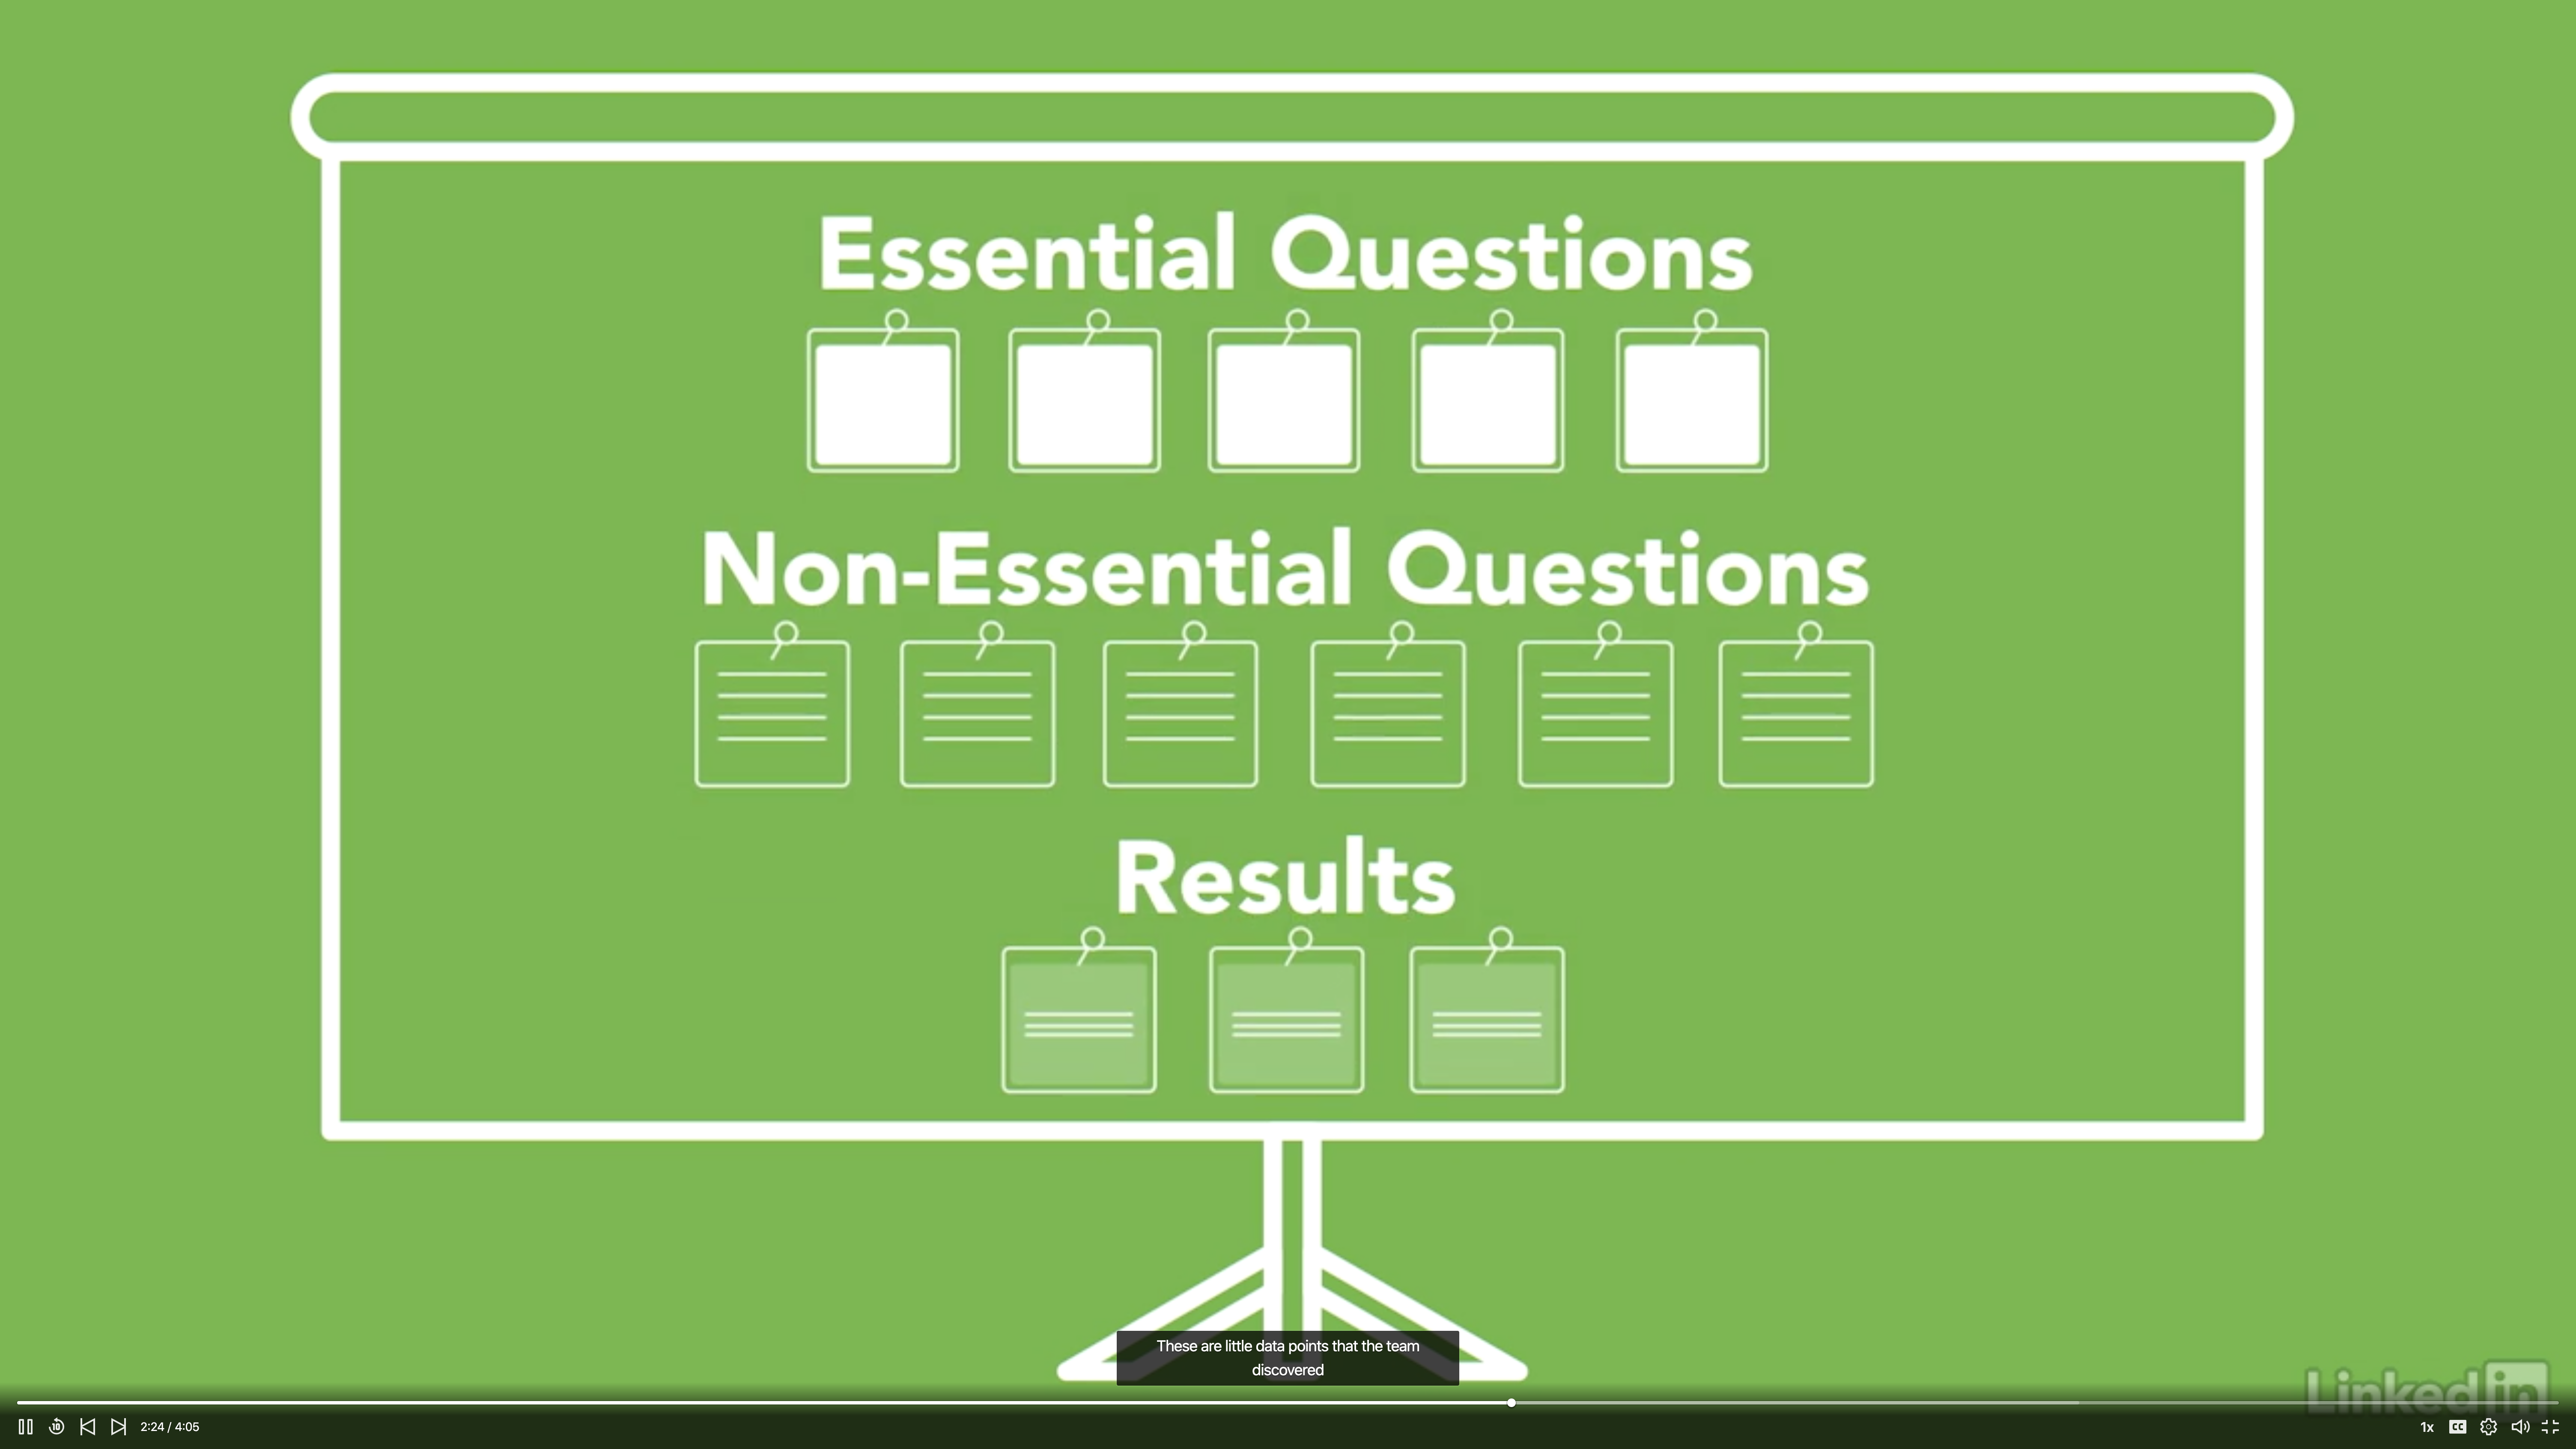
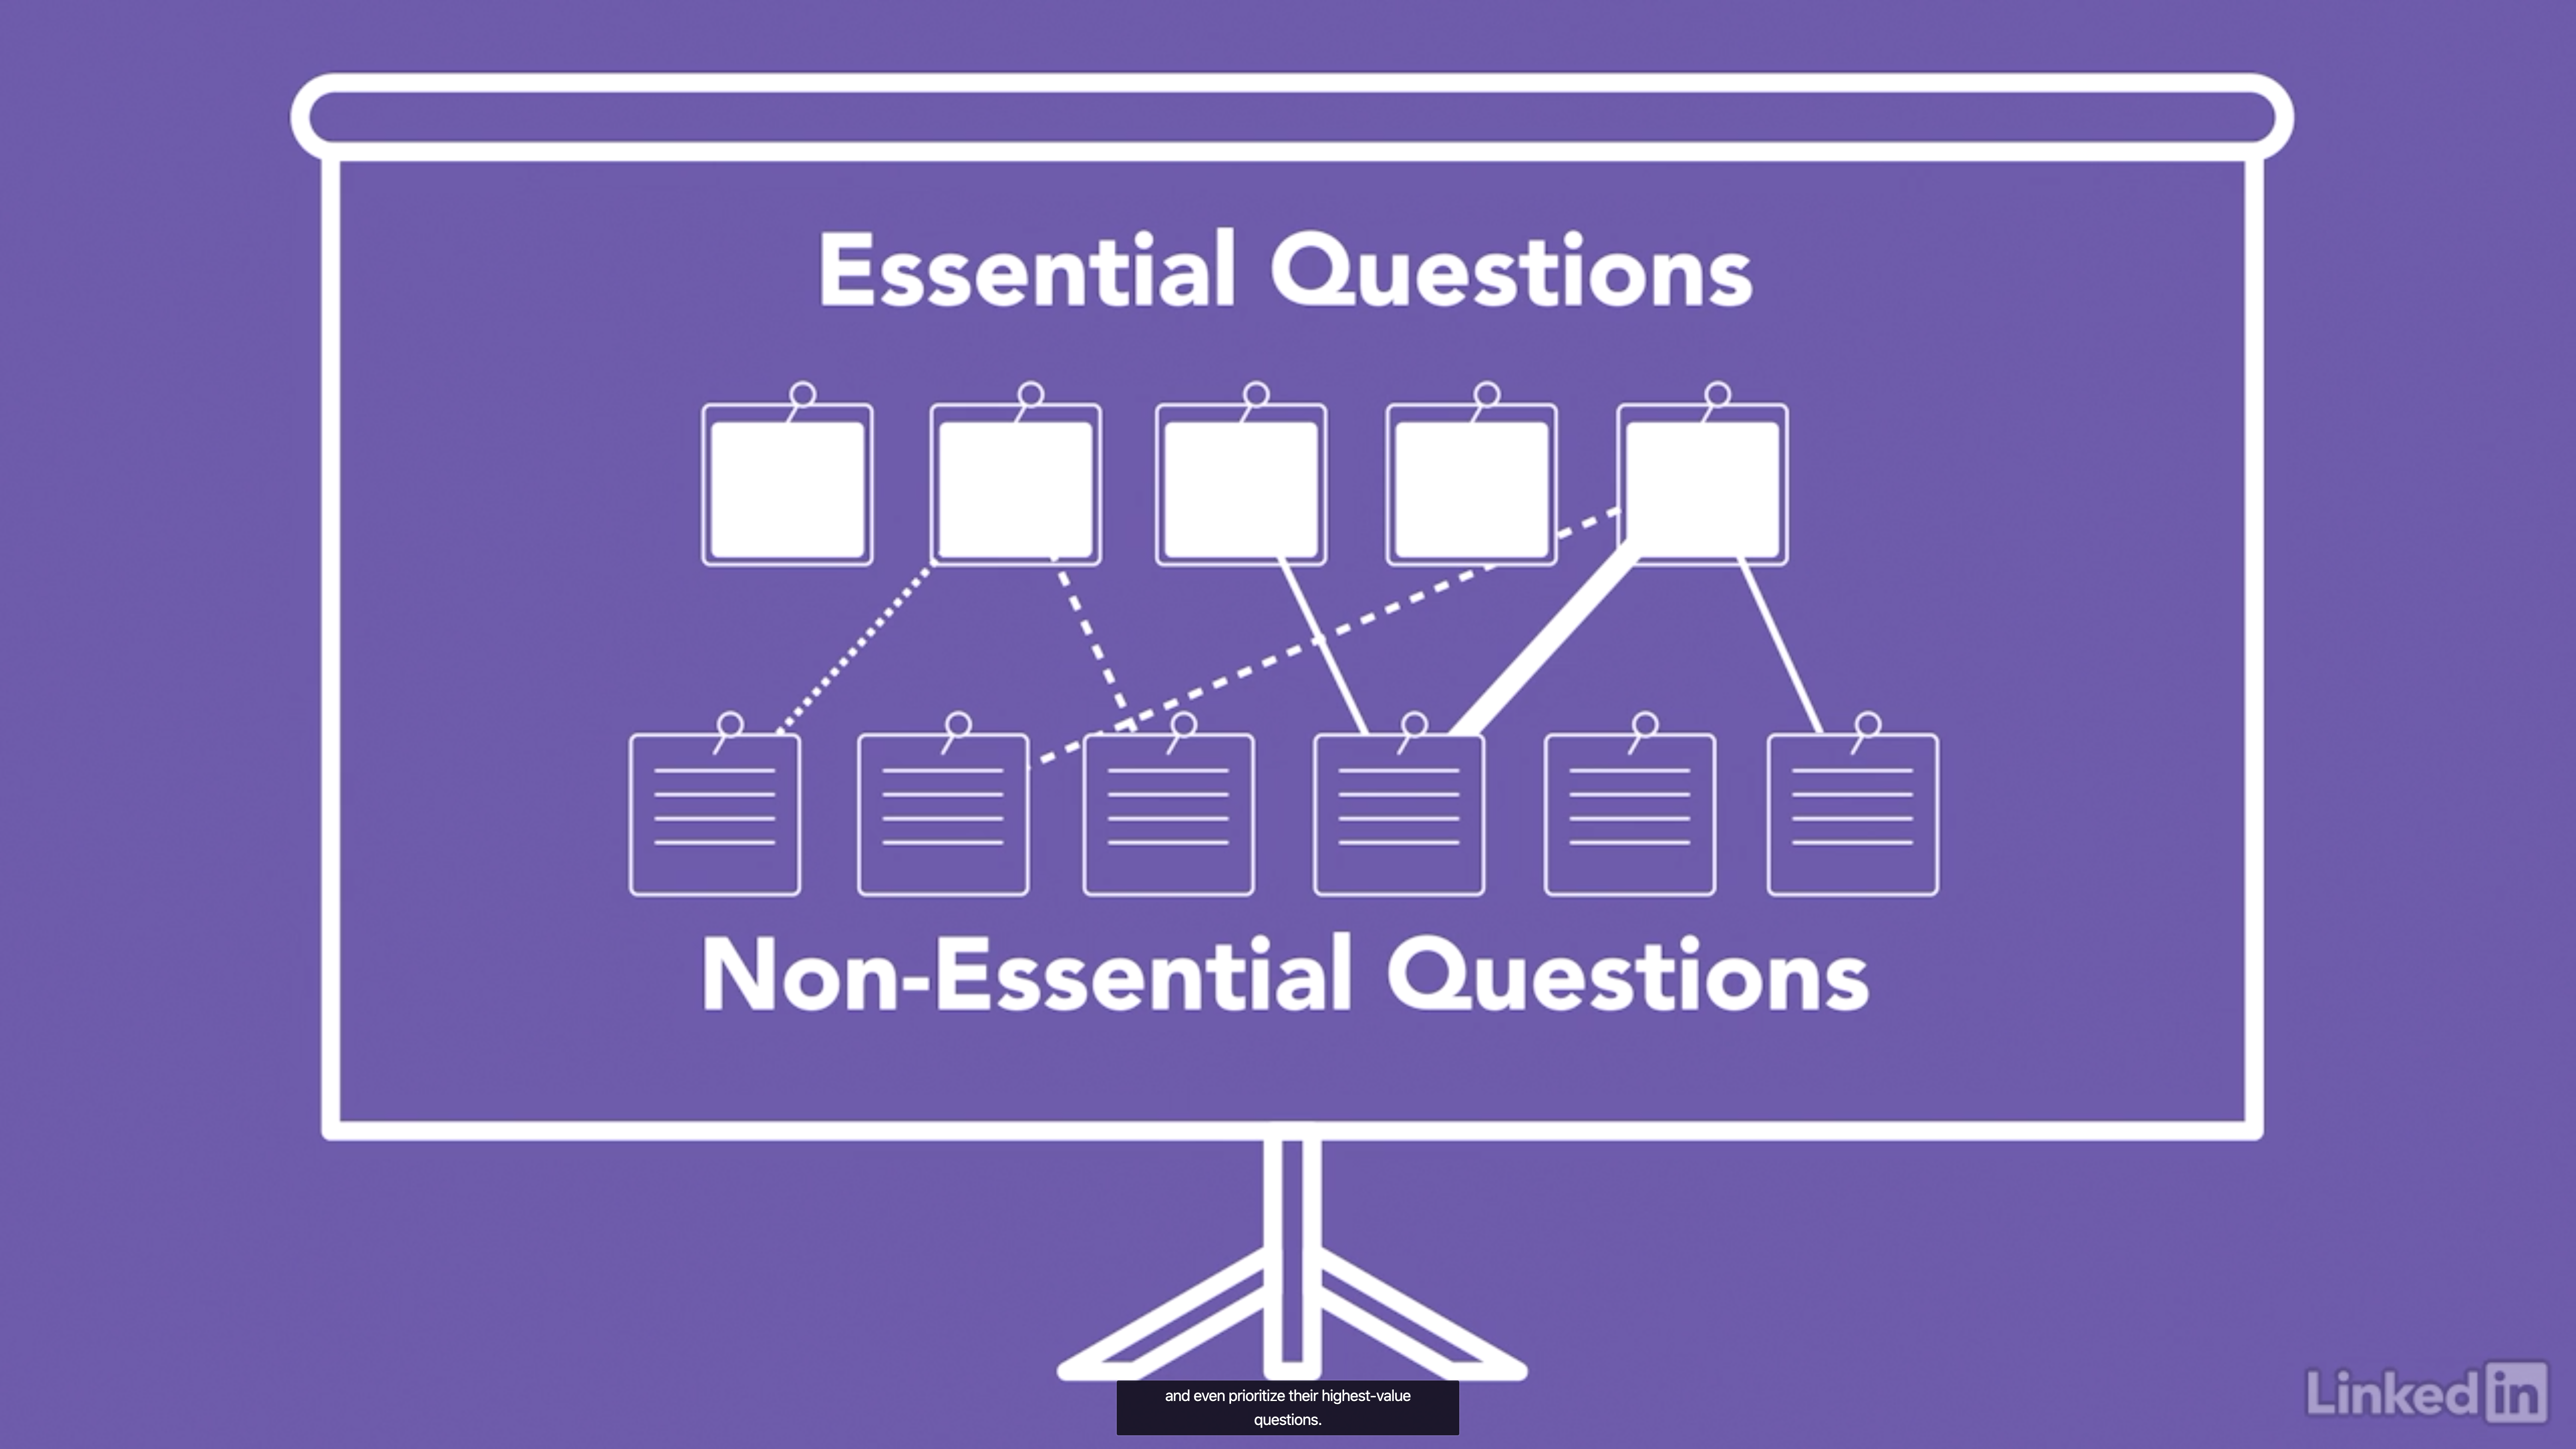
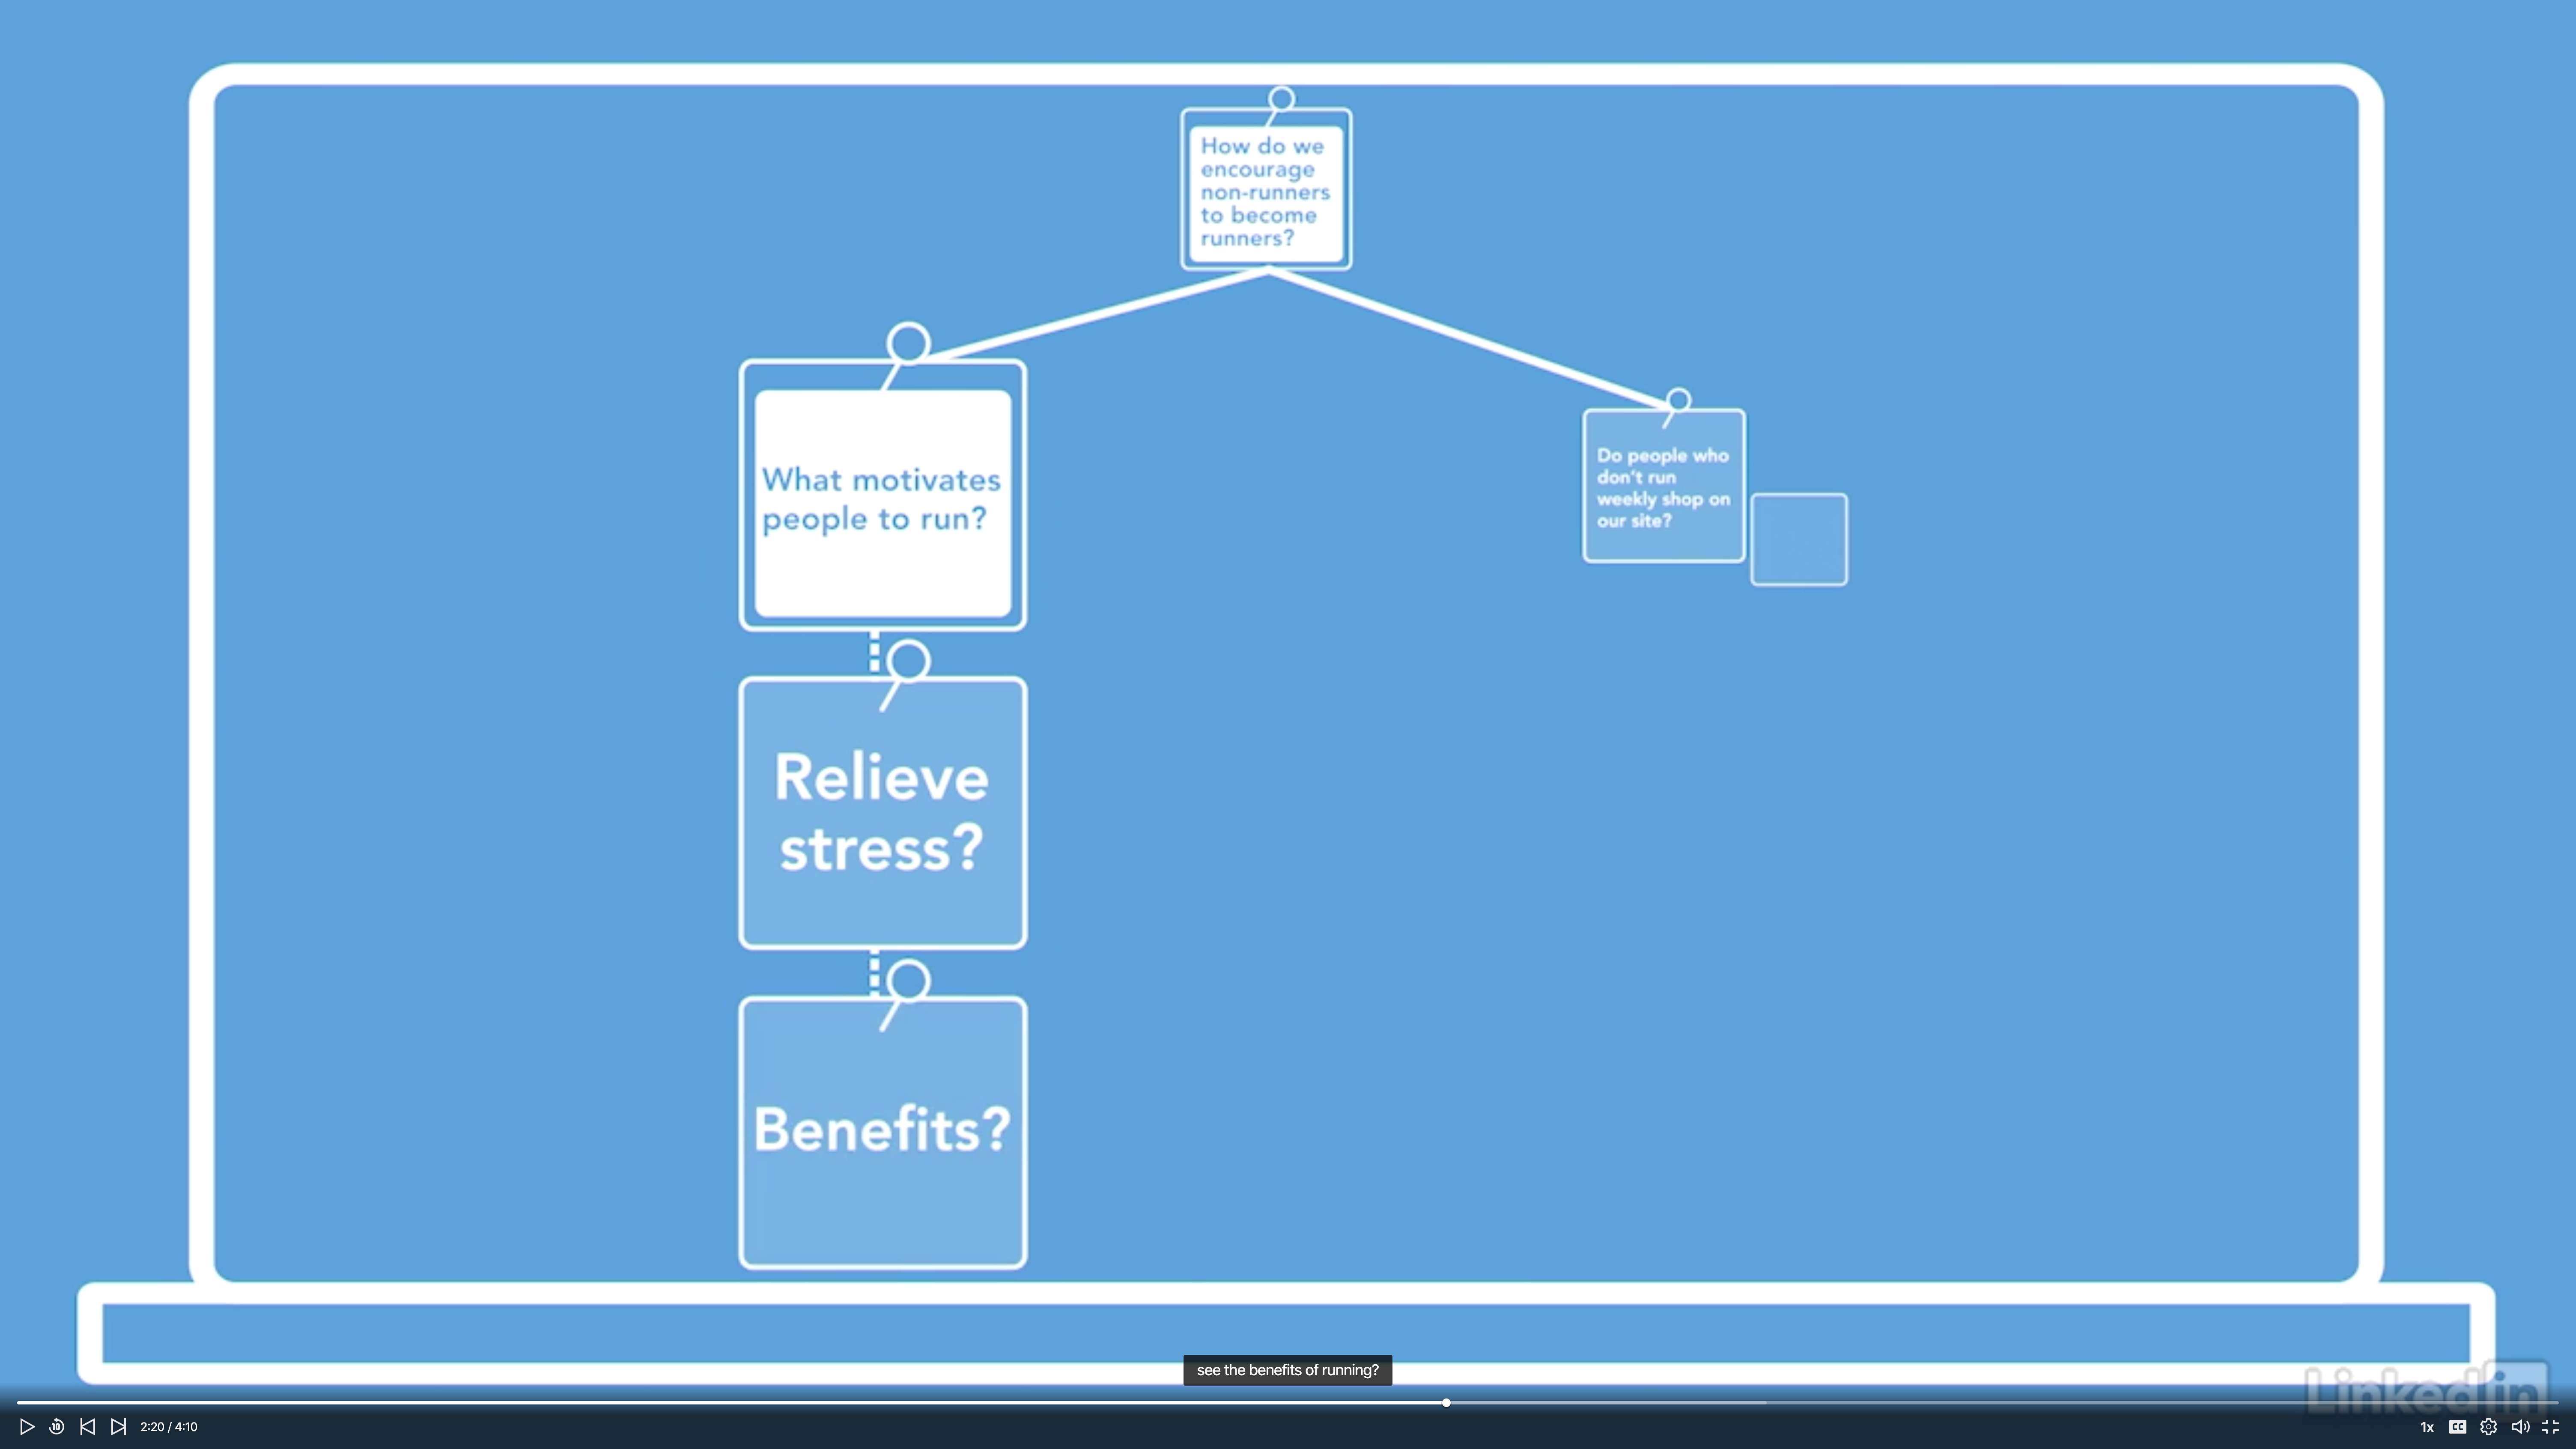
Create question trees
- One of the challenges is to have the wall filled with questions and at the same time keep it well organized.
- All of questions should be organized using the same system.
- A question tree a group of stickies that are related to one essential question.


Example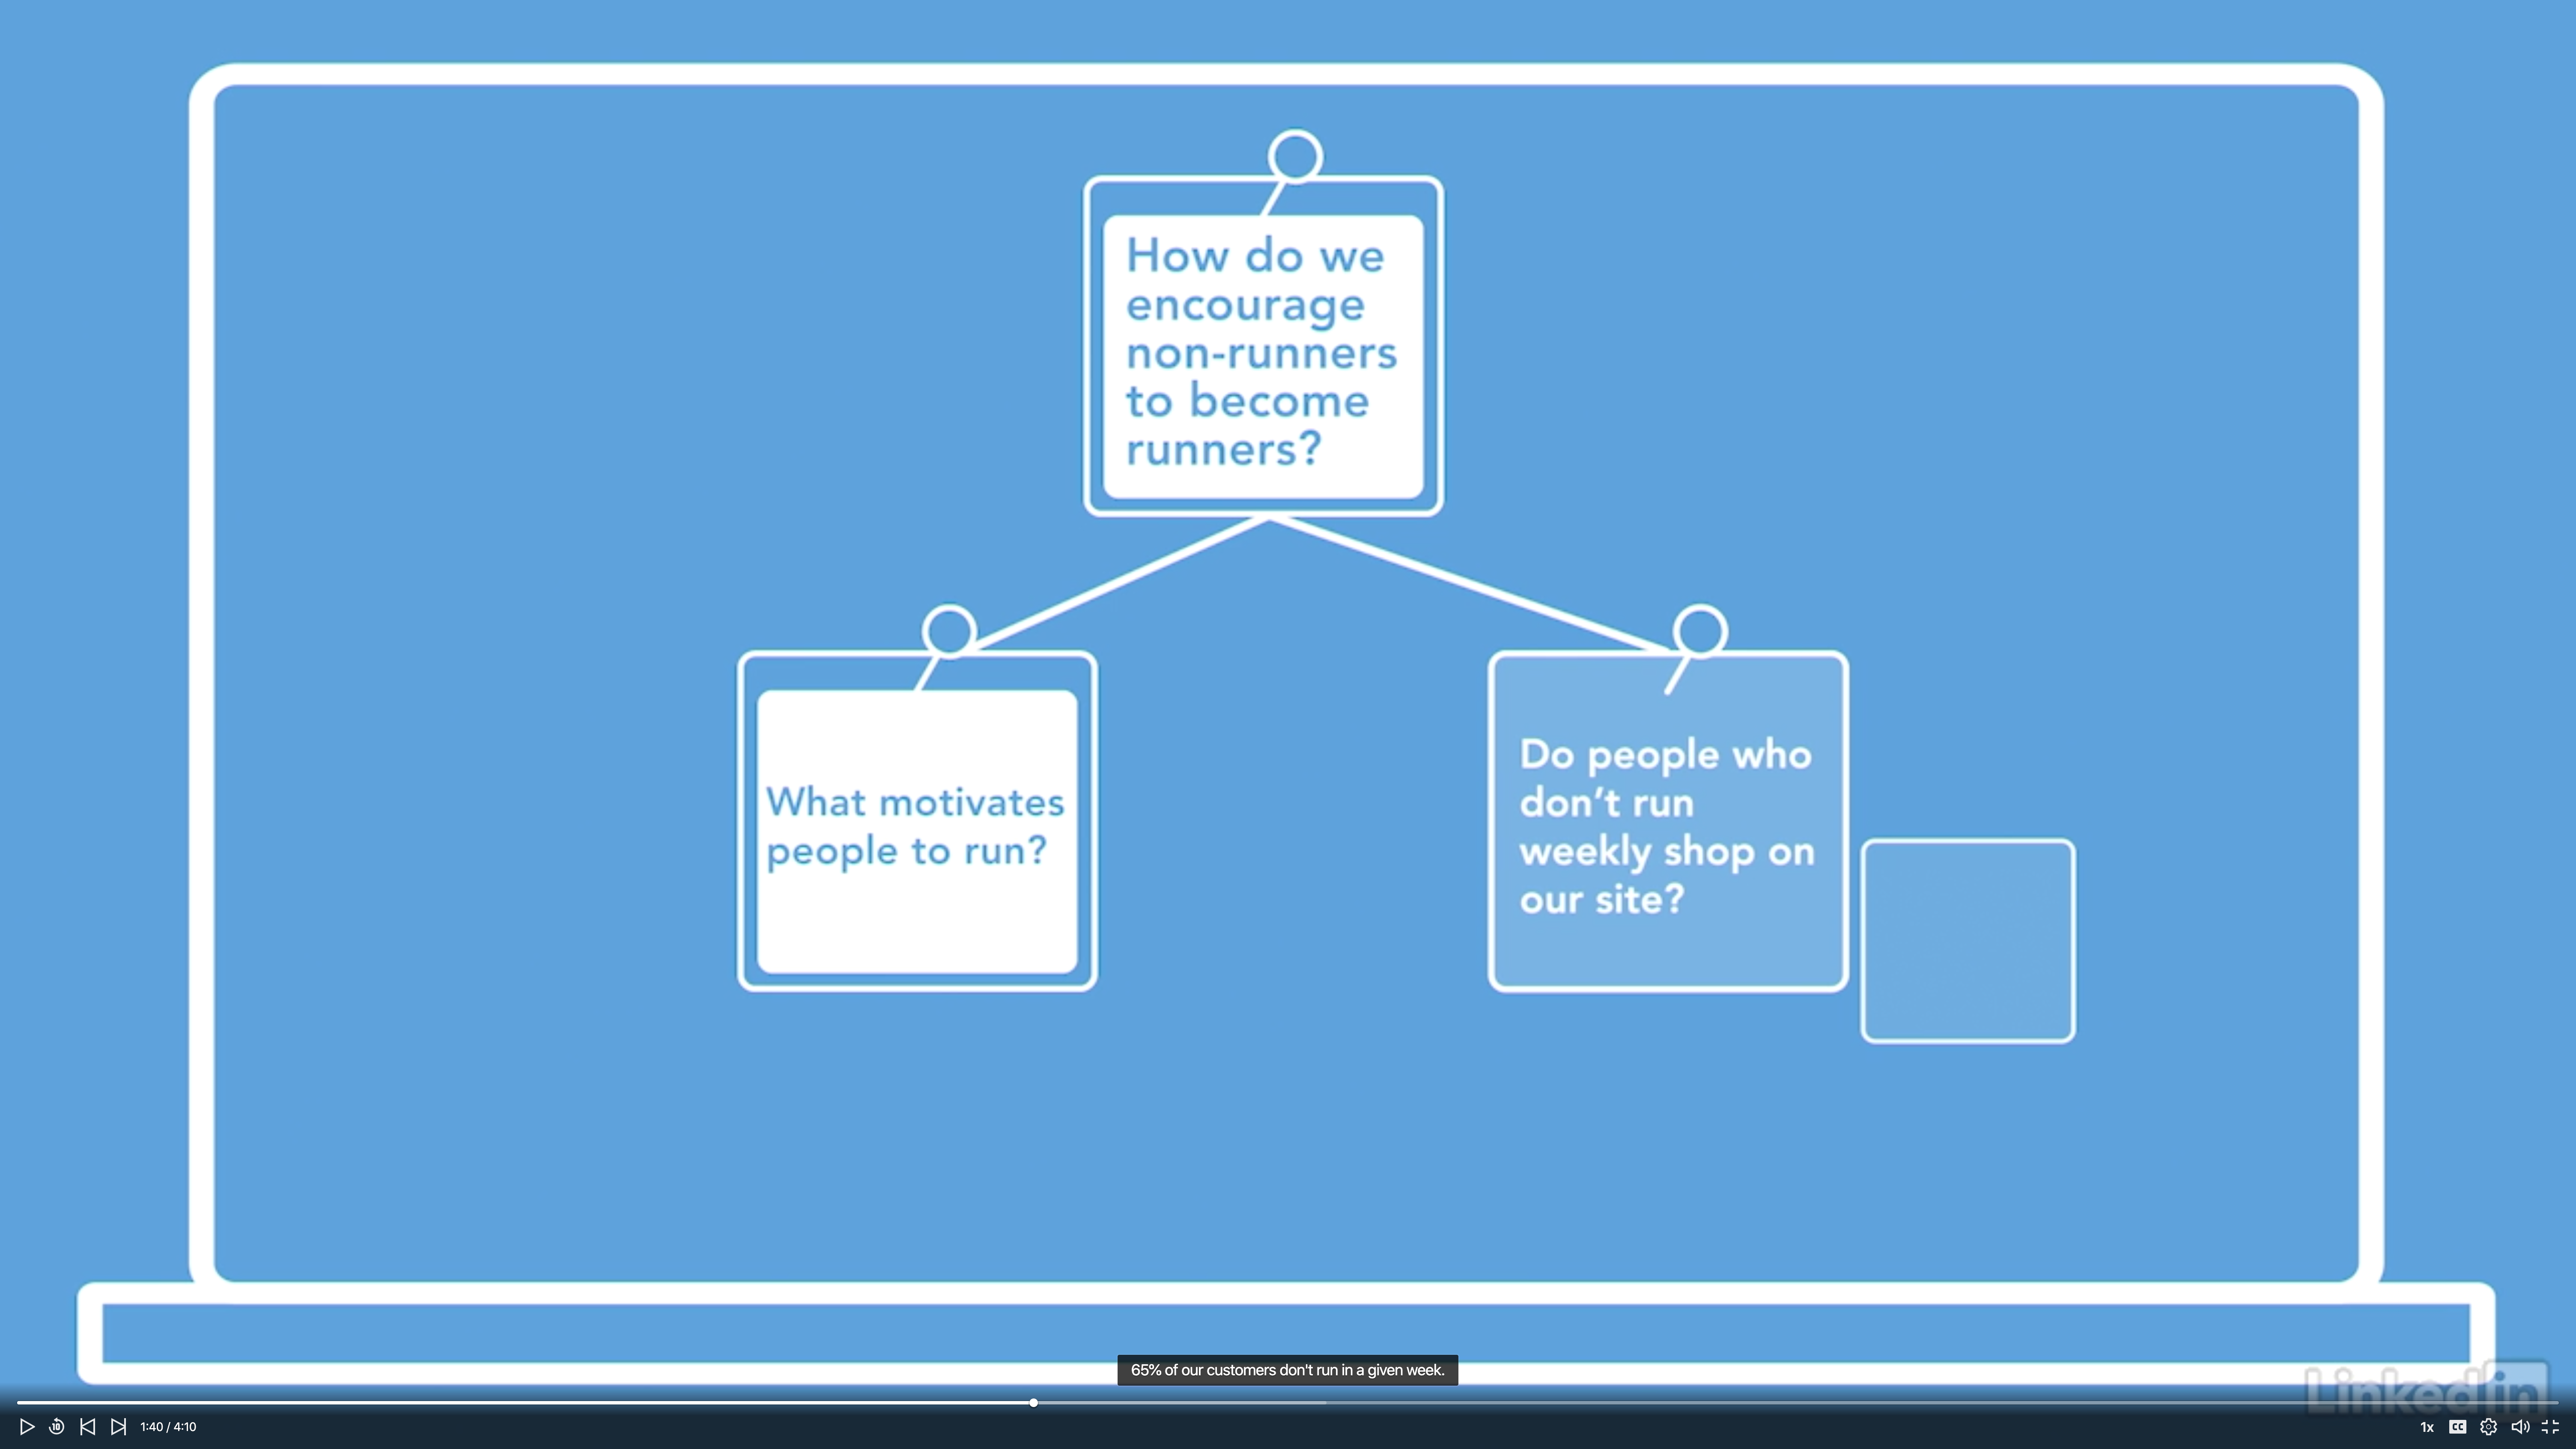
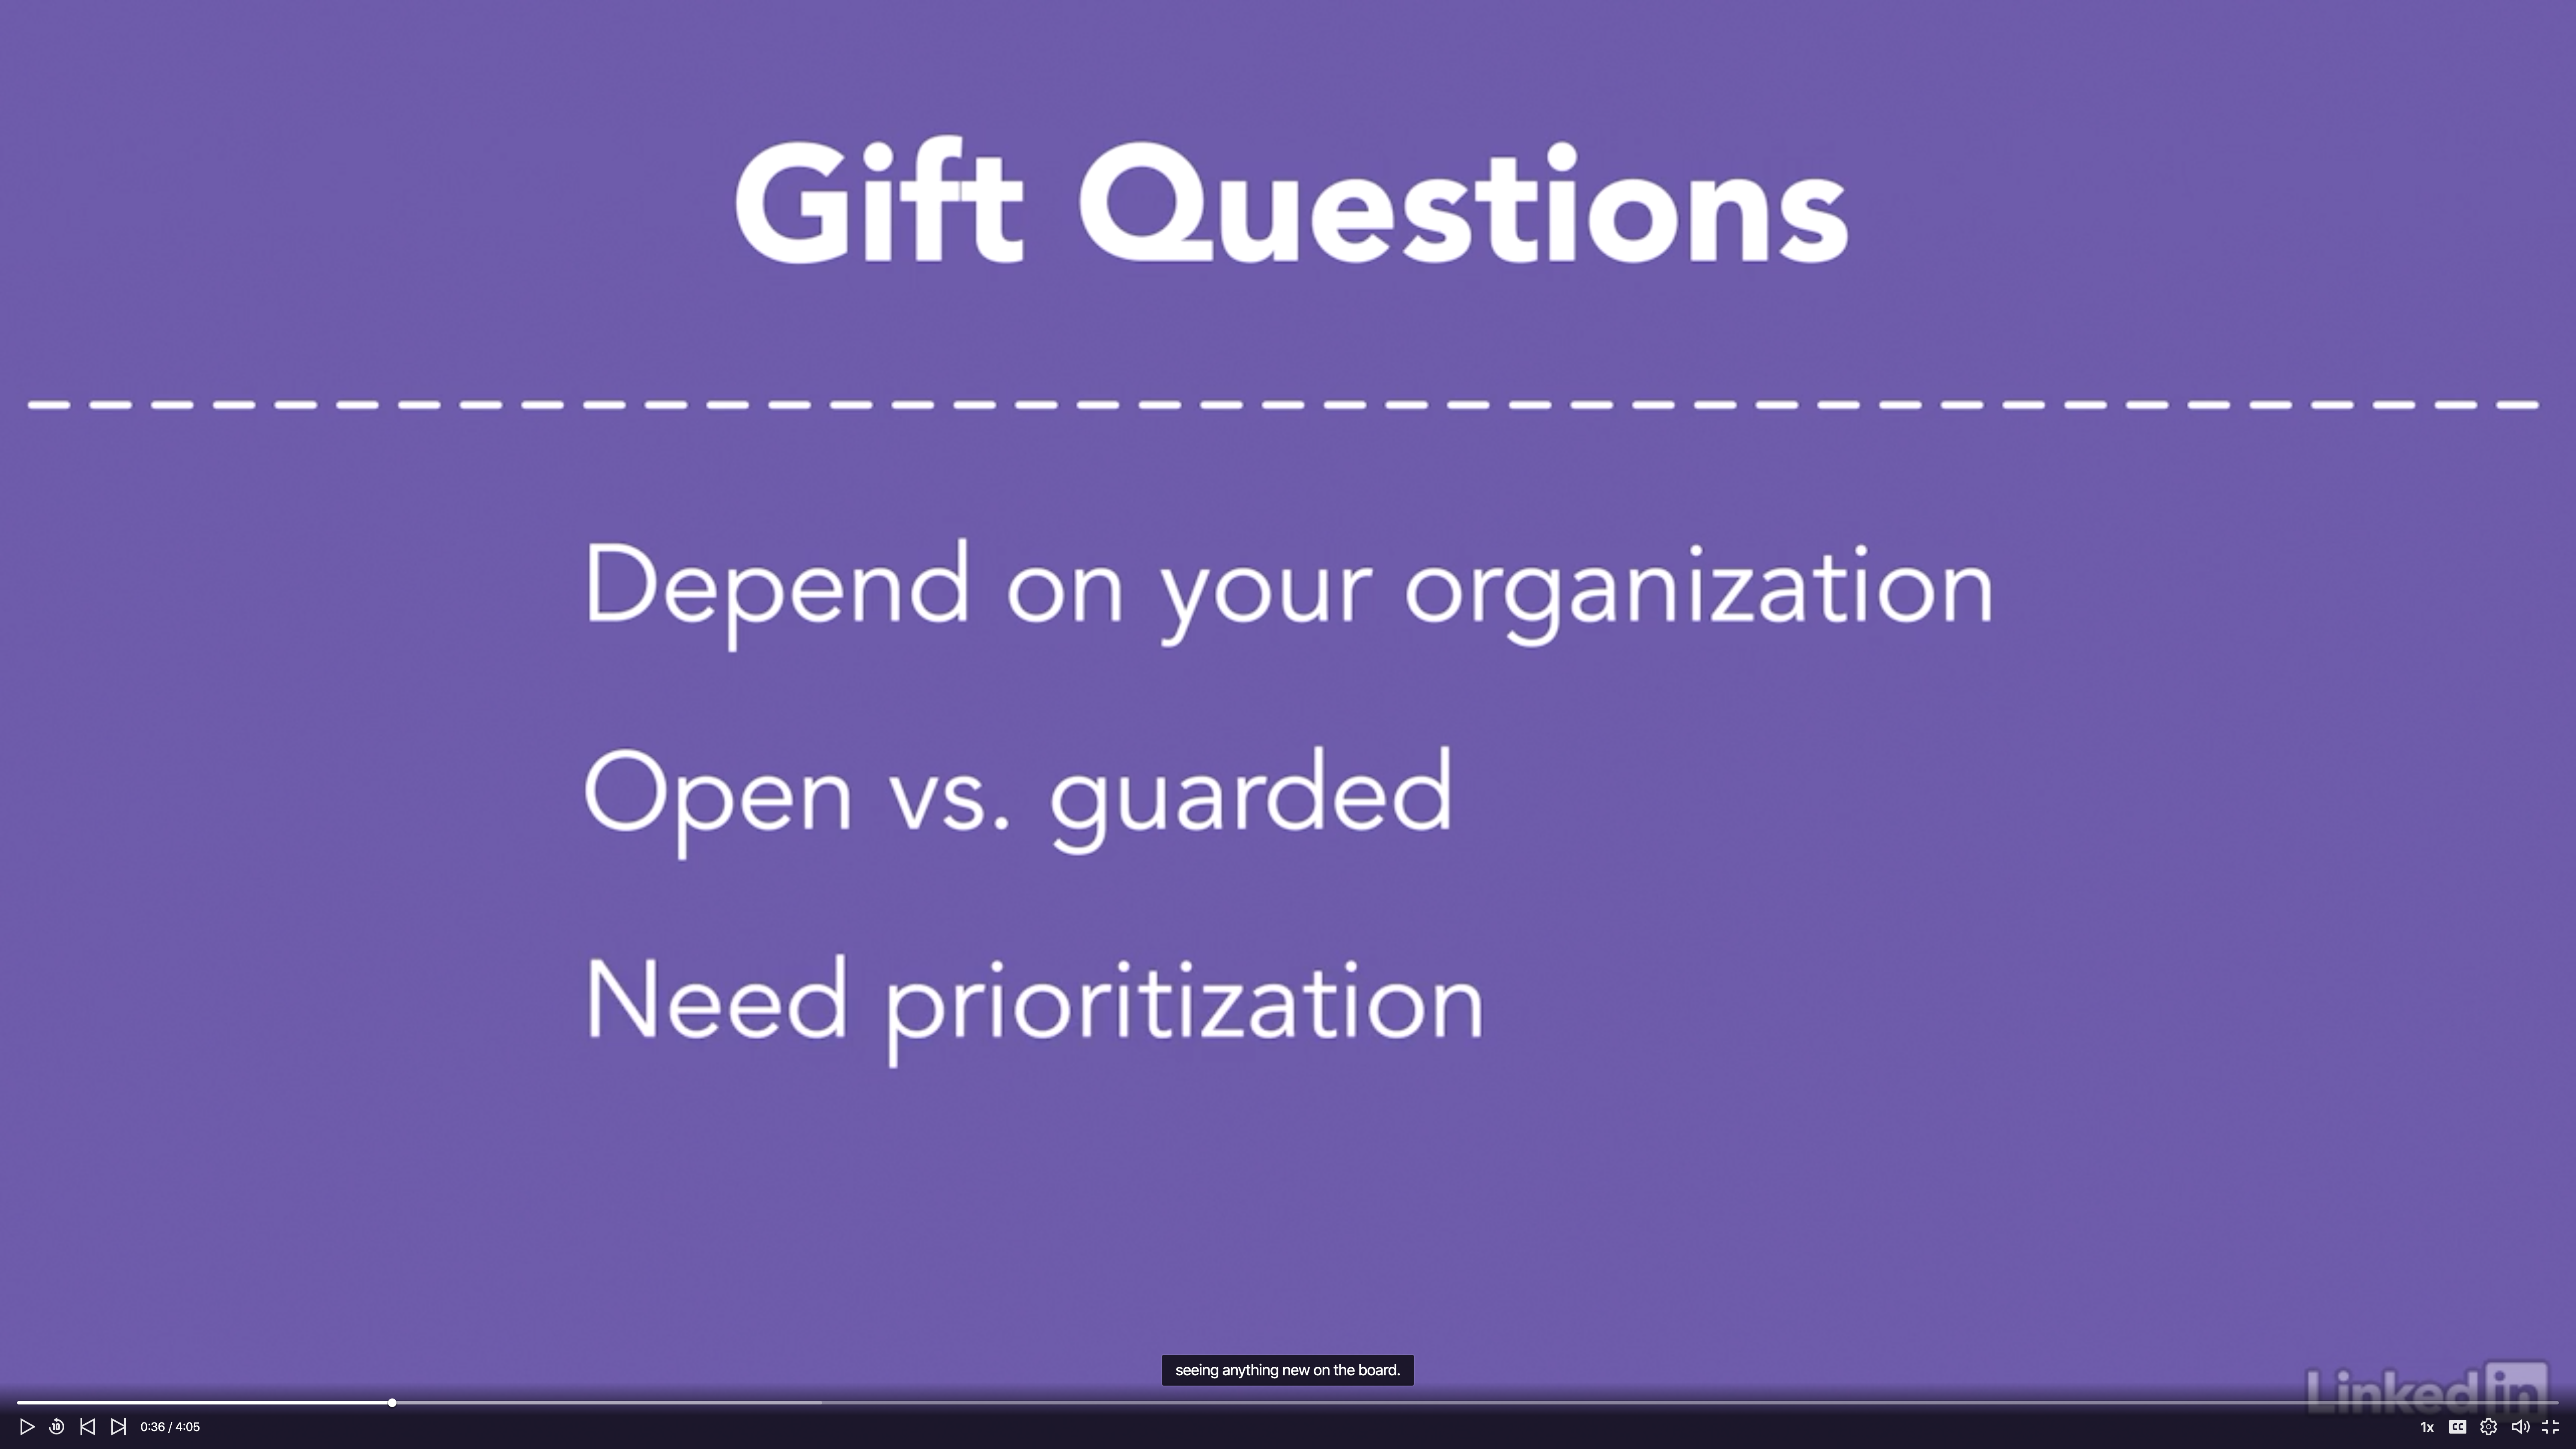
Find your questions
- Gift Questions: getting question from someone in your organization.
- Questions from outside the team are a great way to gain insights.
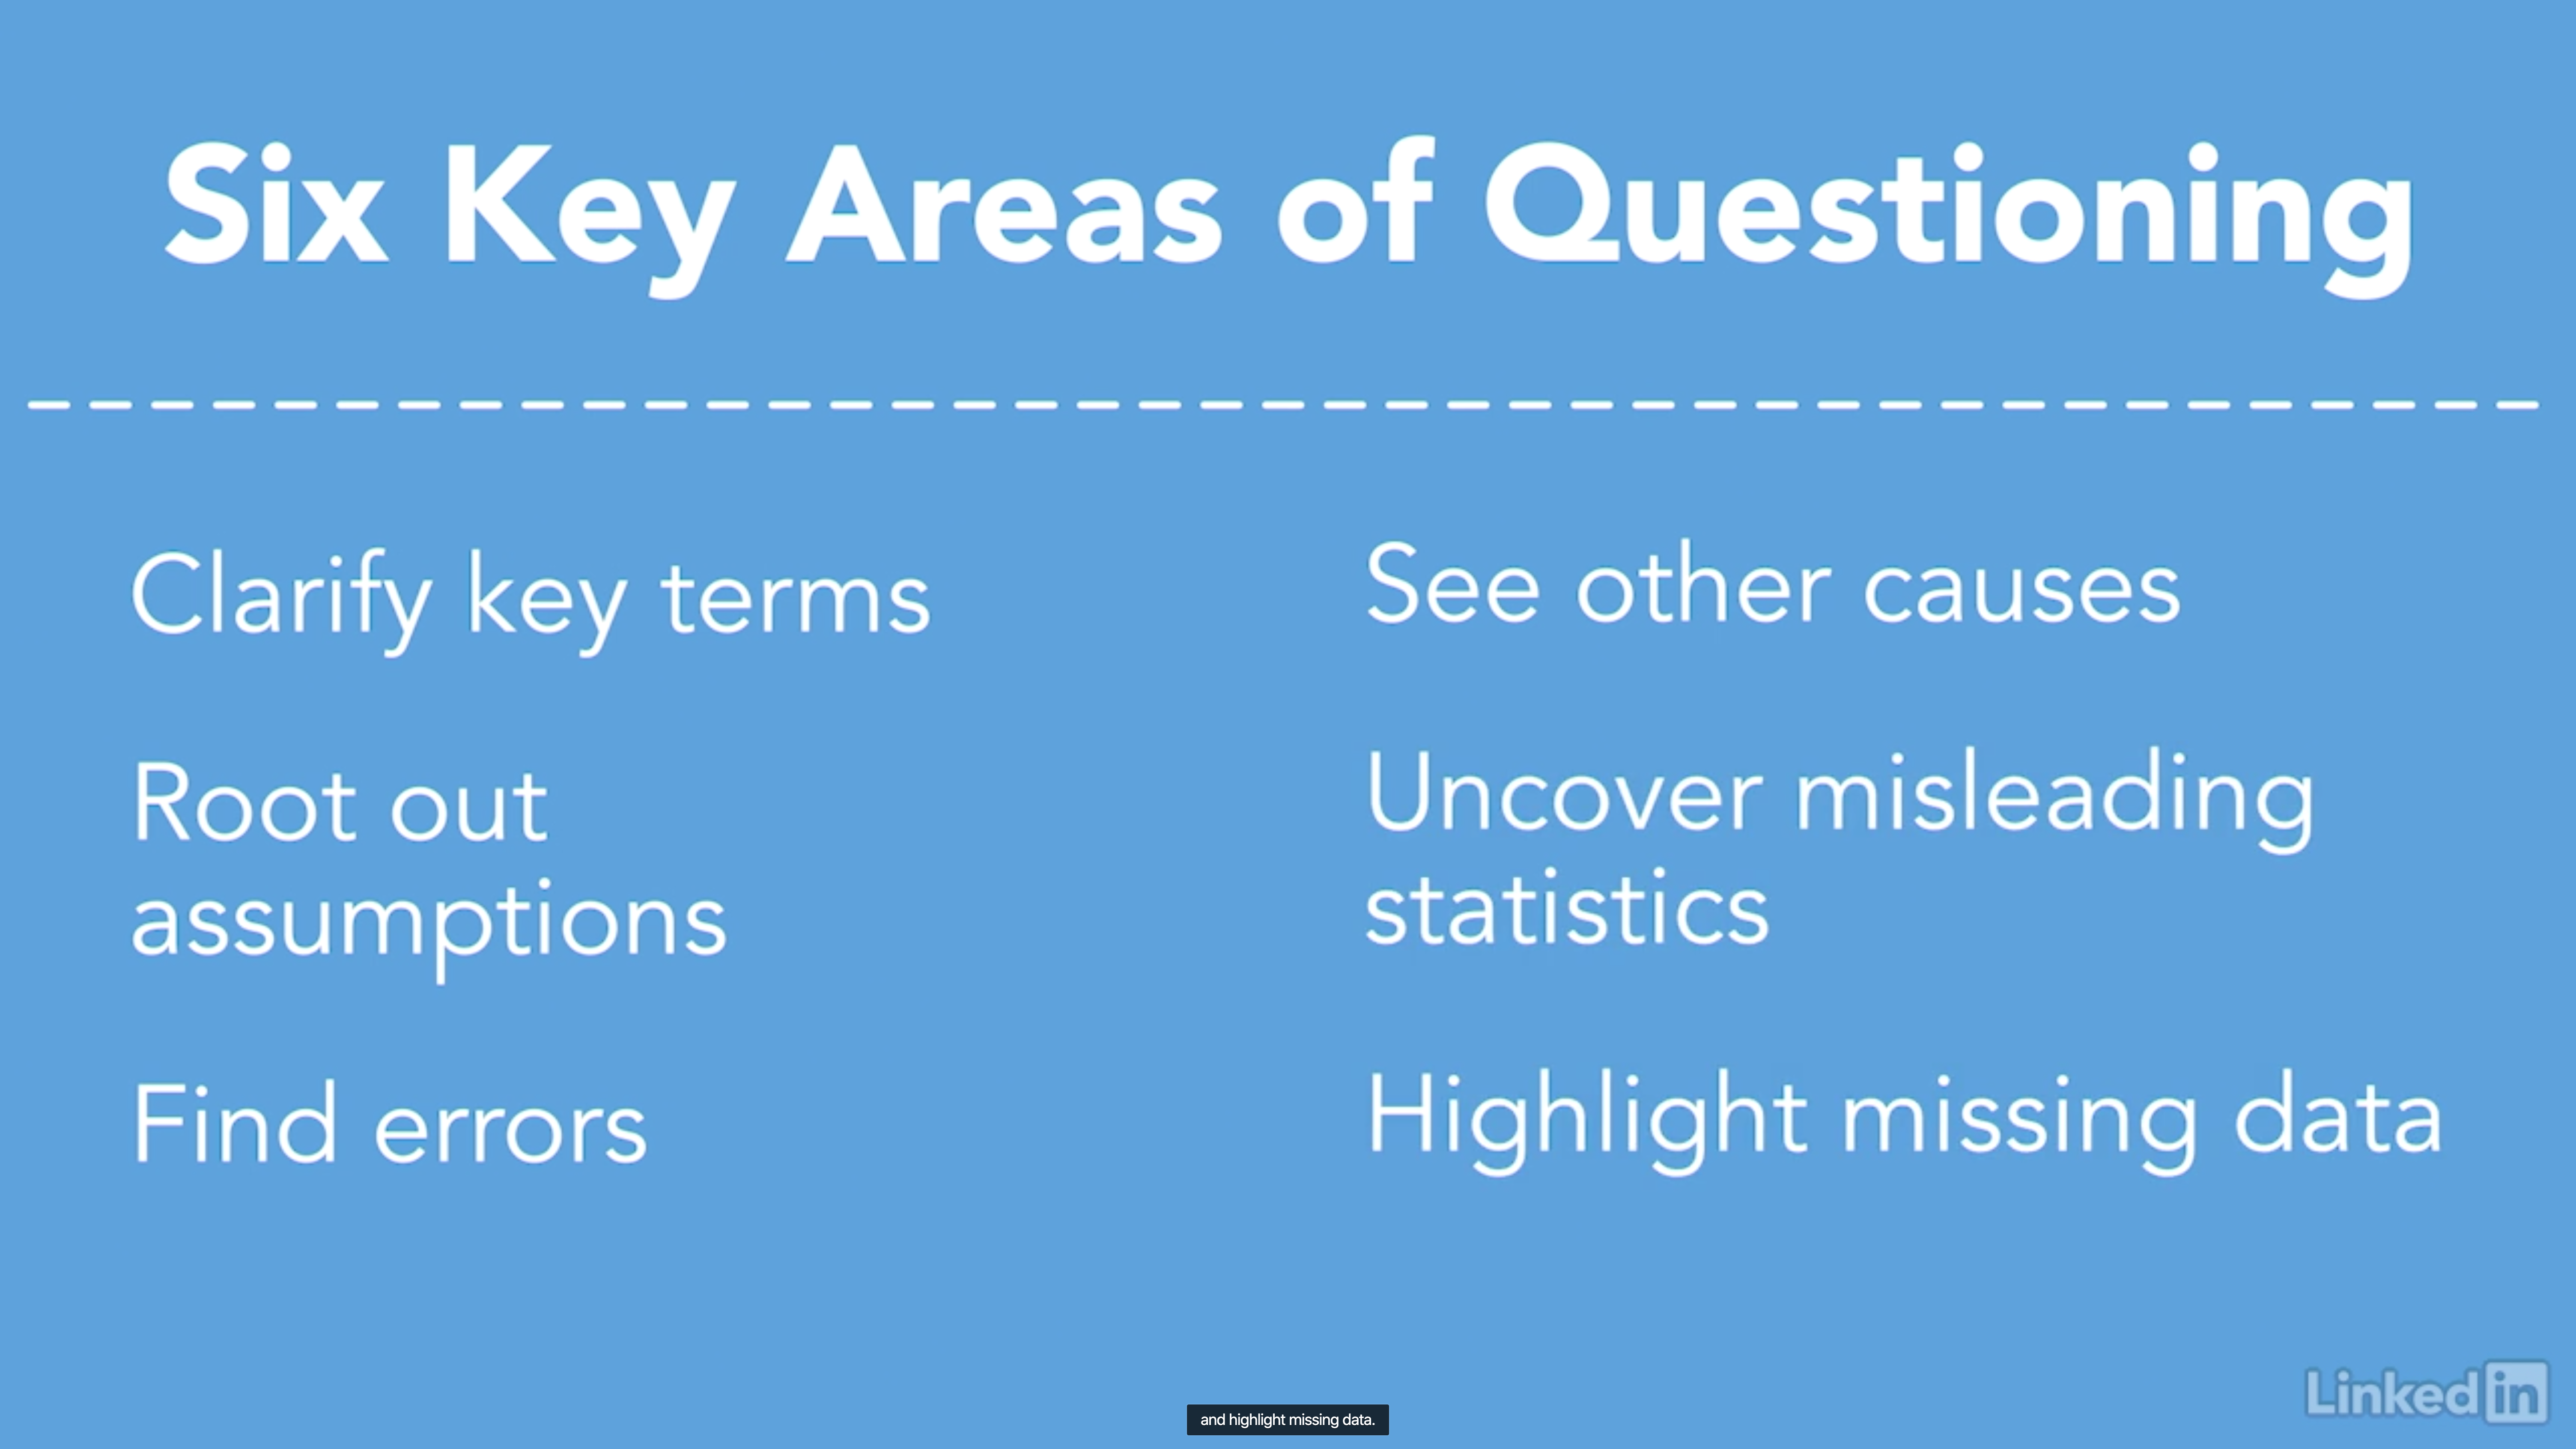
3. Challenge the Team
Clarify key terms
- The context in which we use words impacts their meaning.
- Some words are often abstract and need to interpreted.
- e.g., what does the often mean in the above sentence?
- Asking questions about key words and phrases can quickly produce more questions.
Example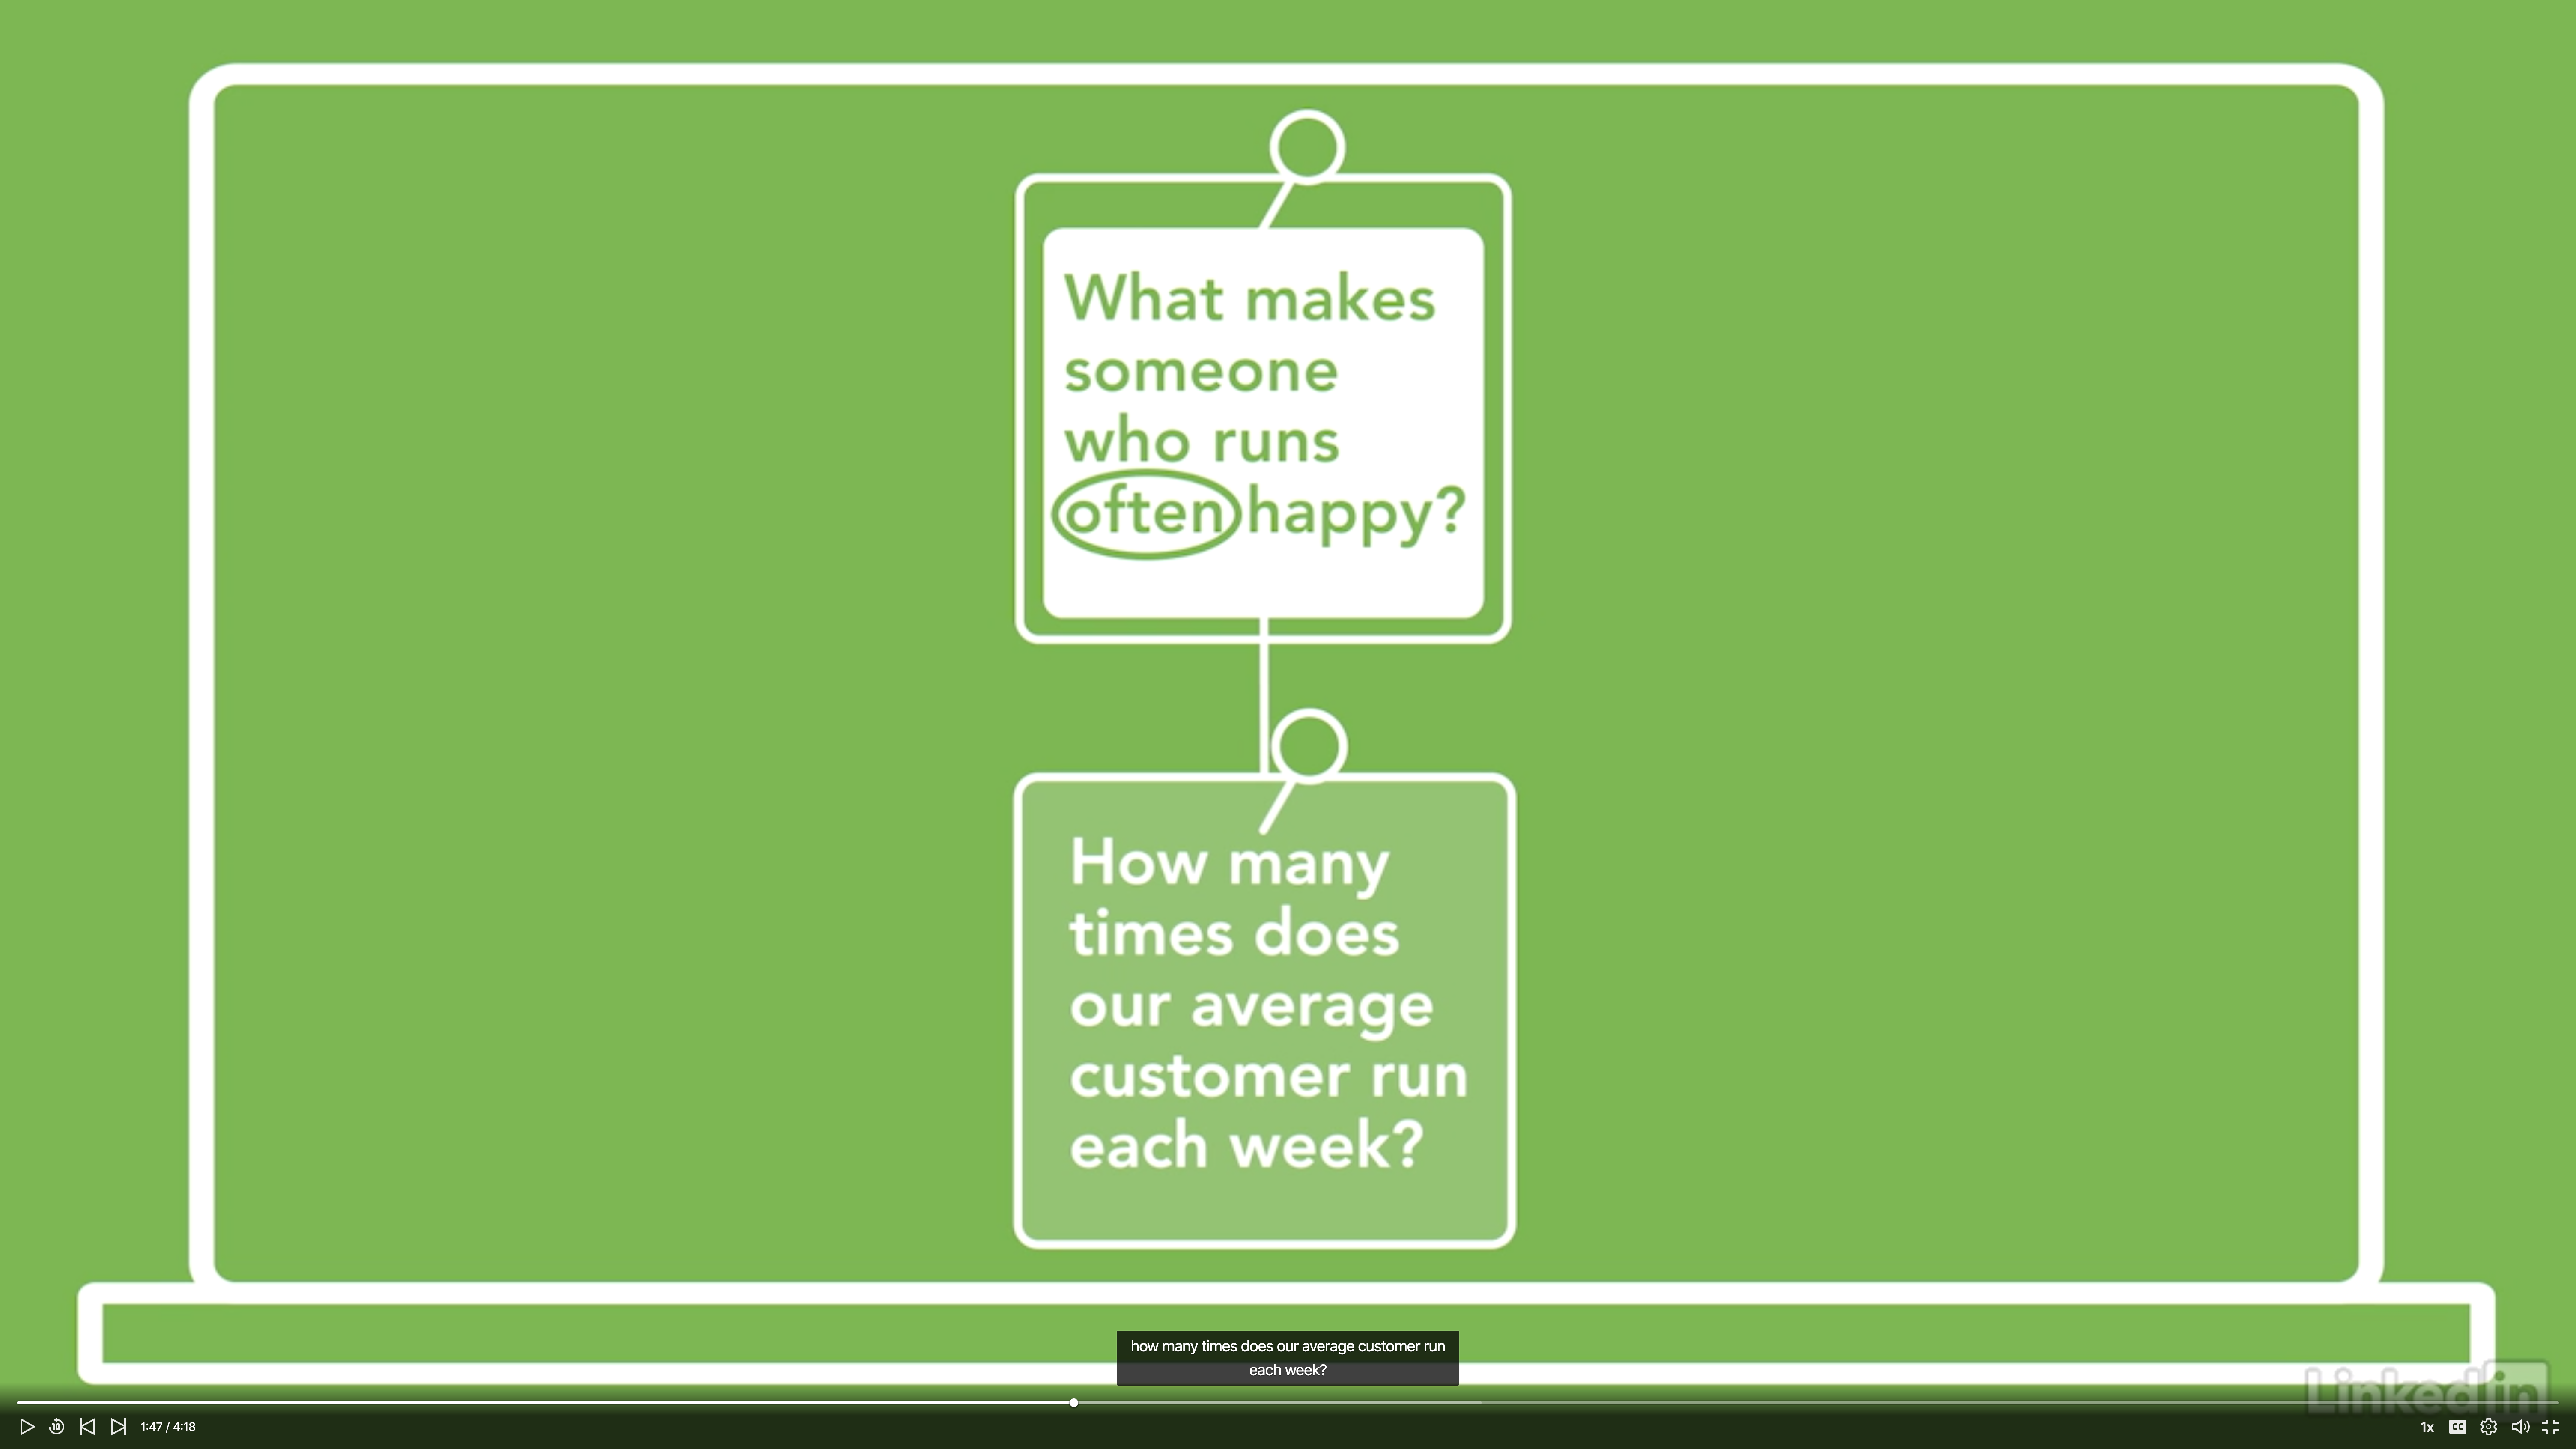
Example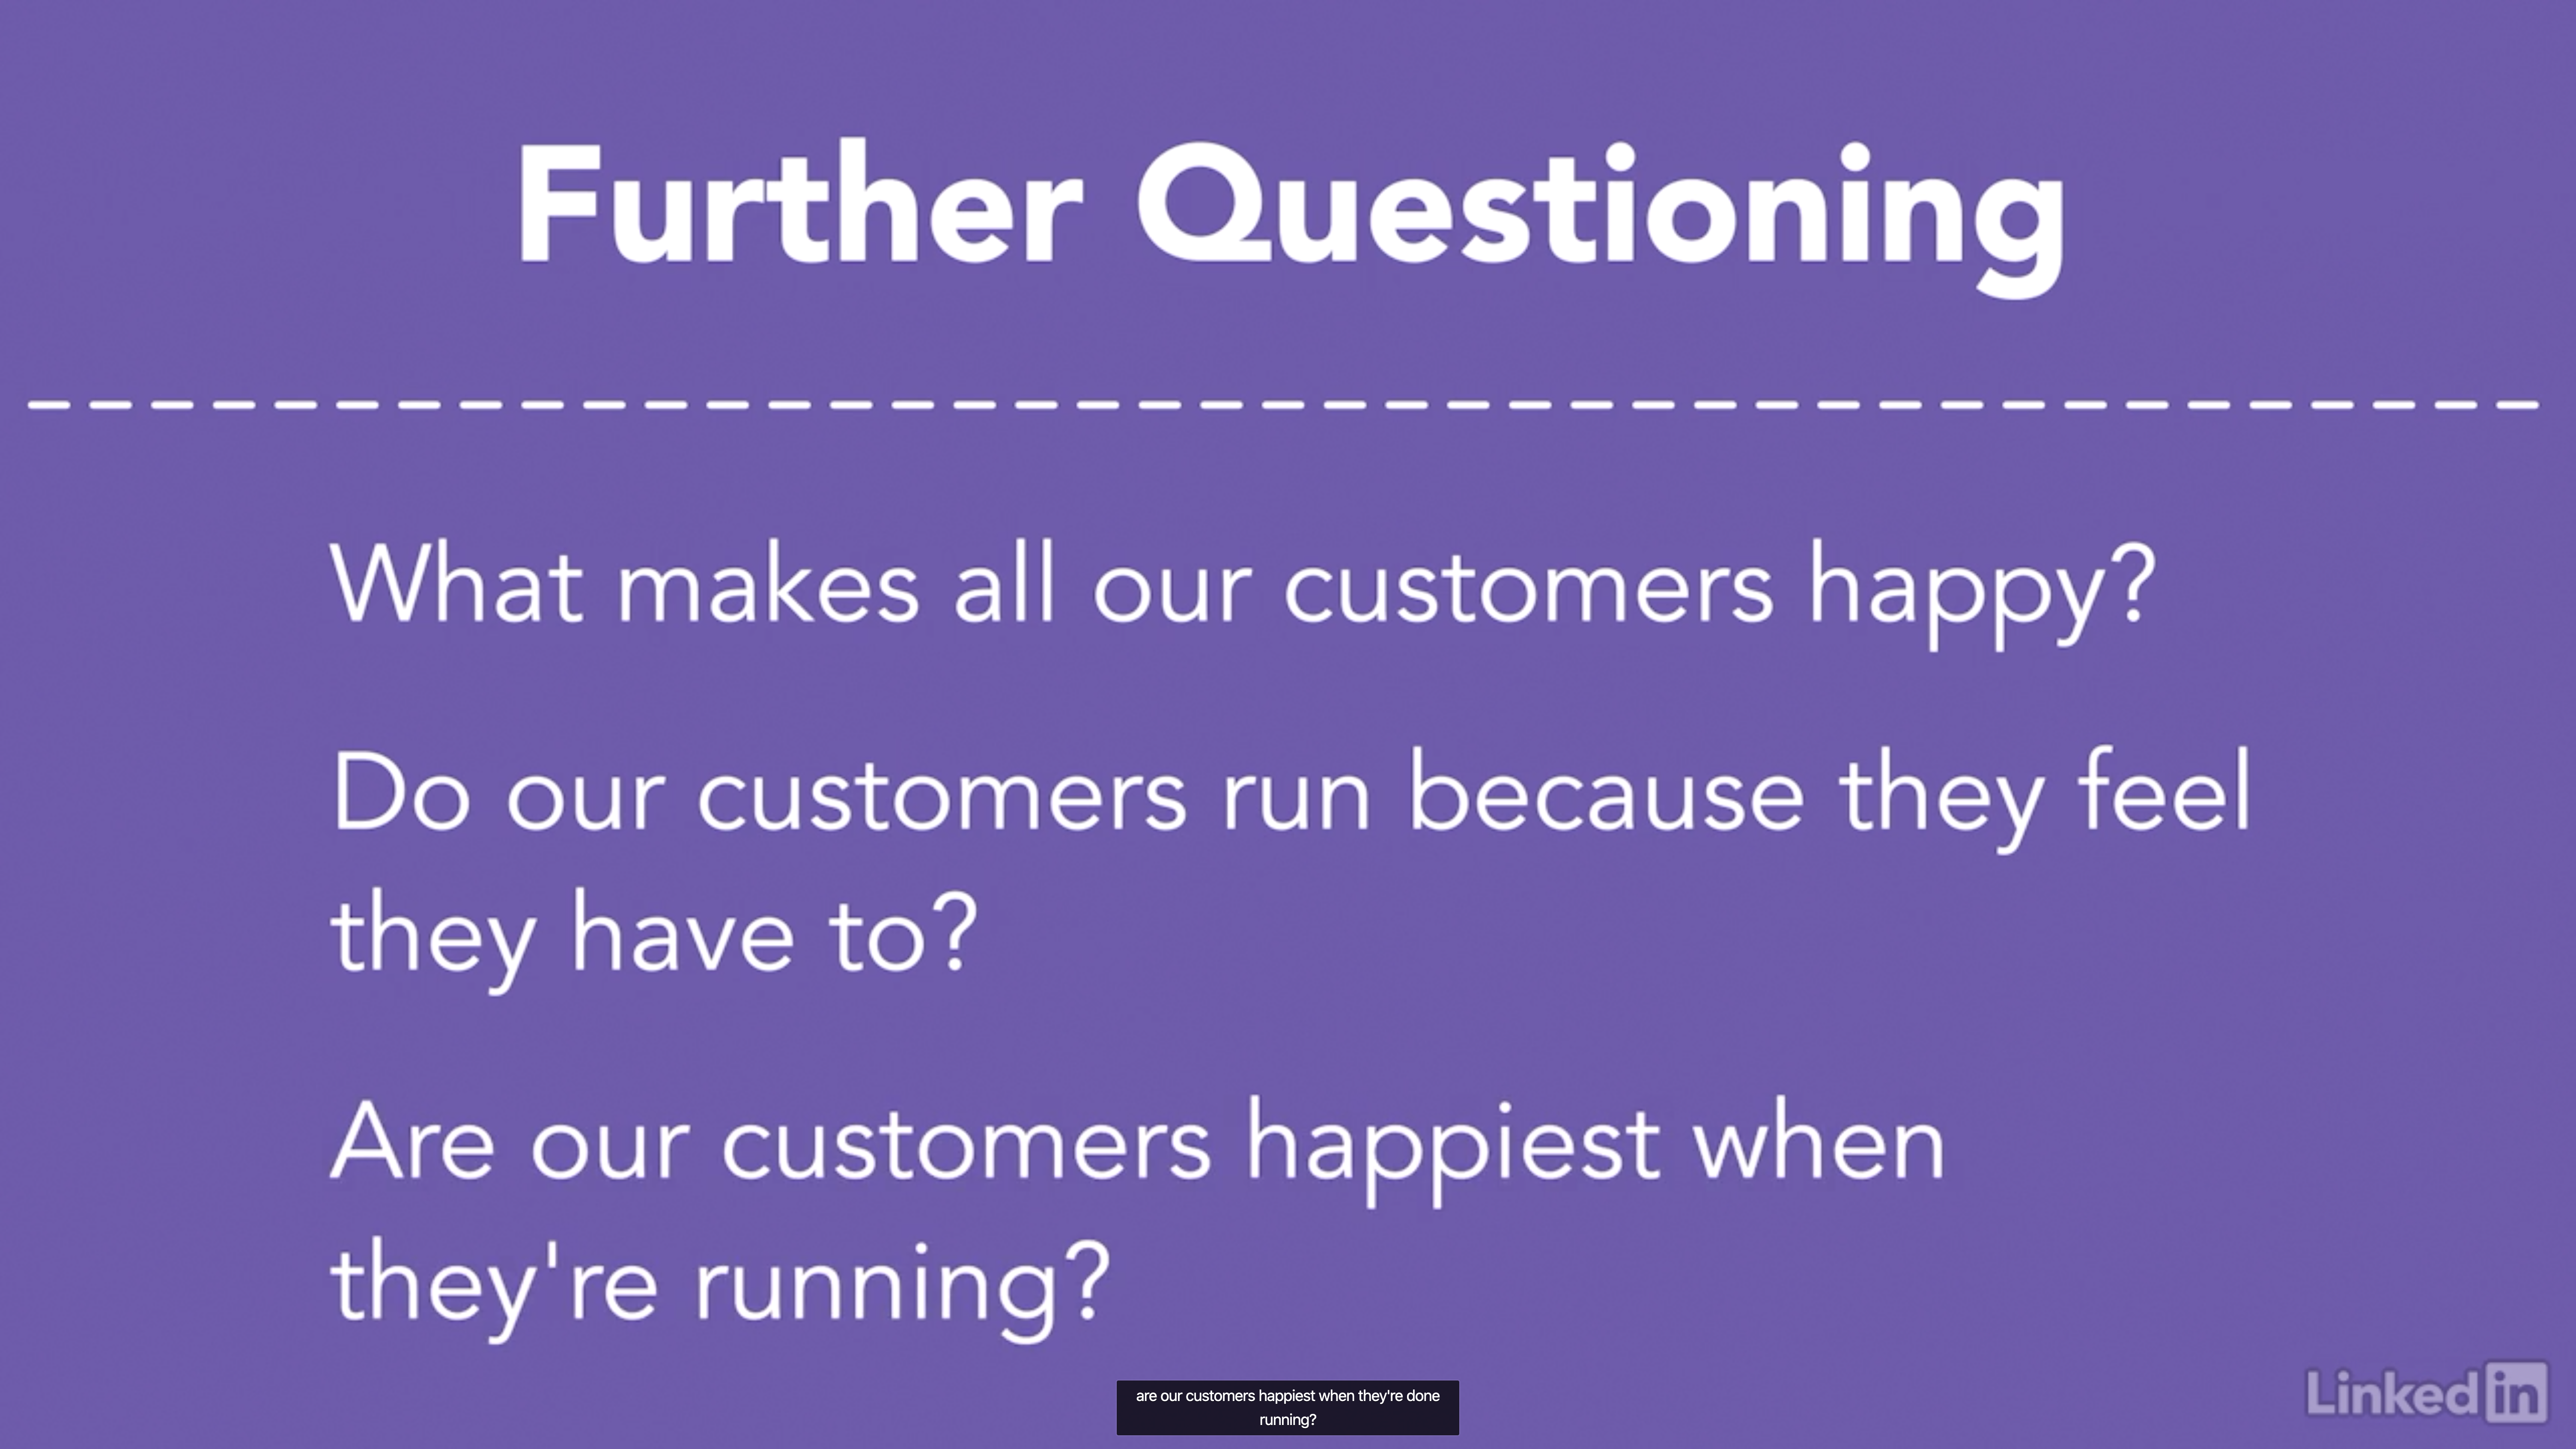
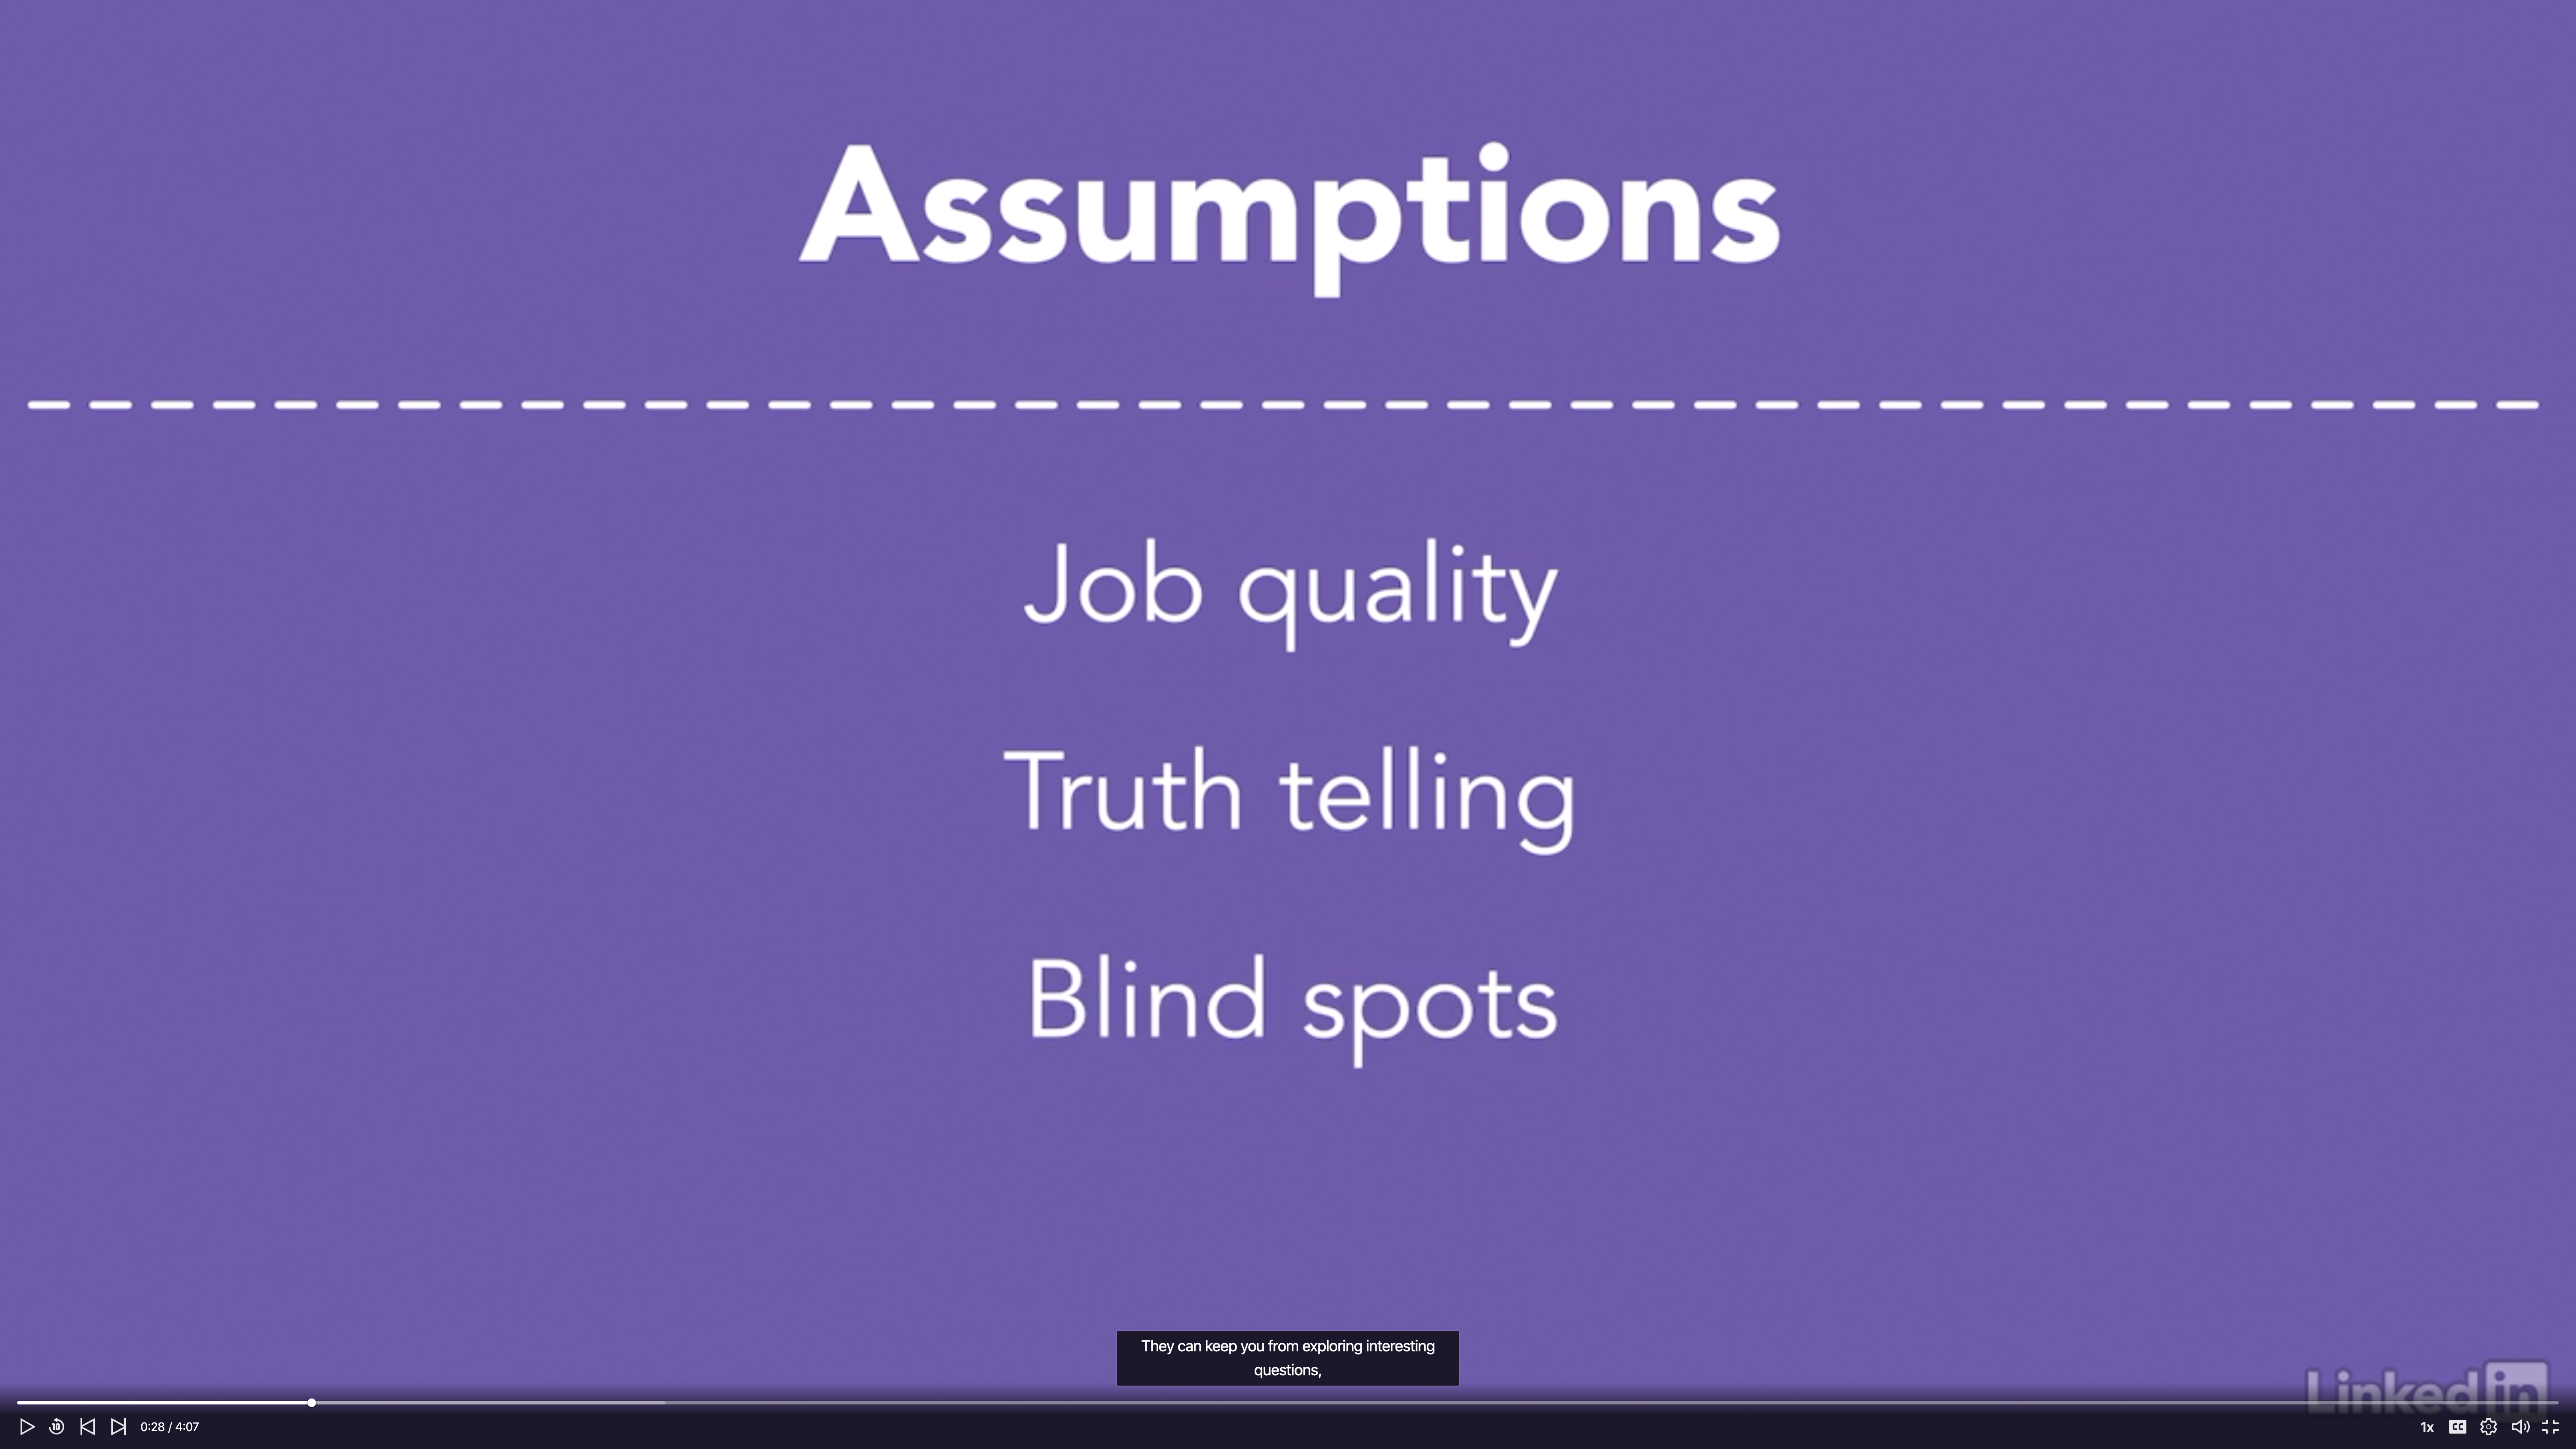
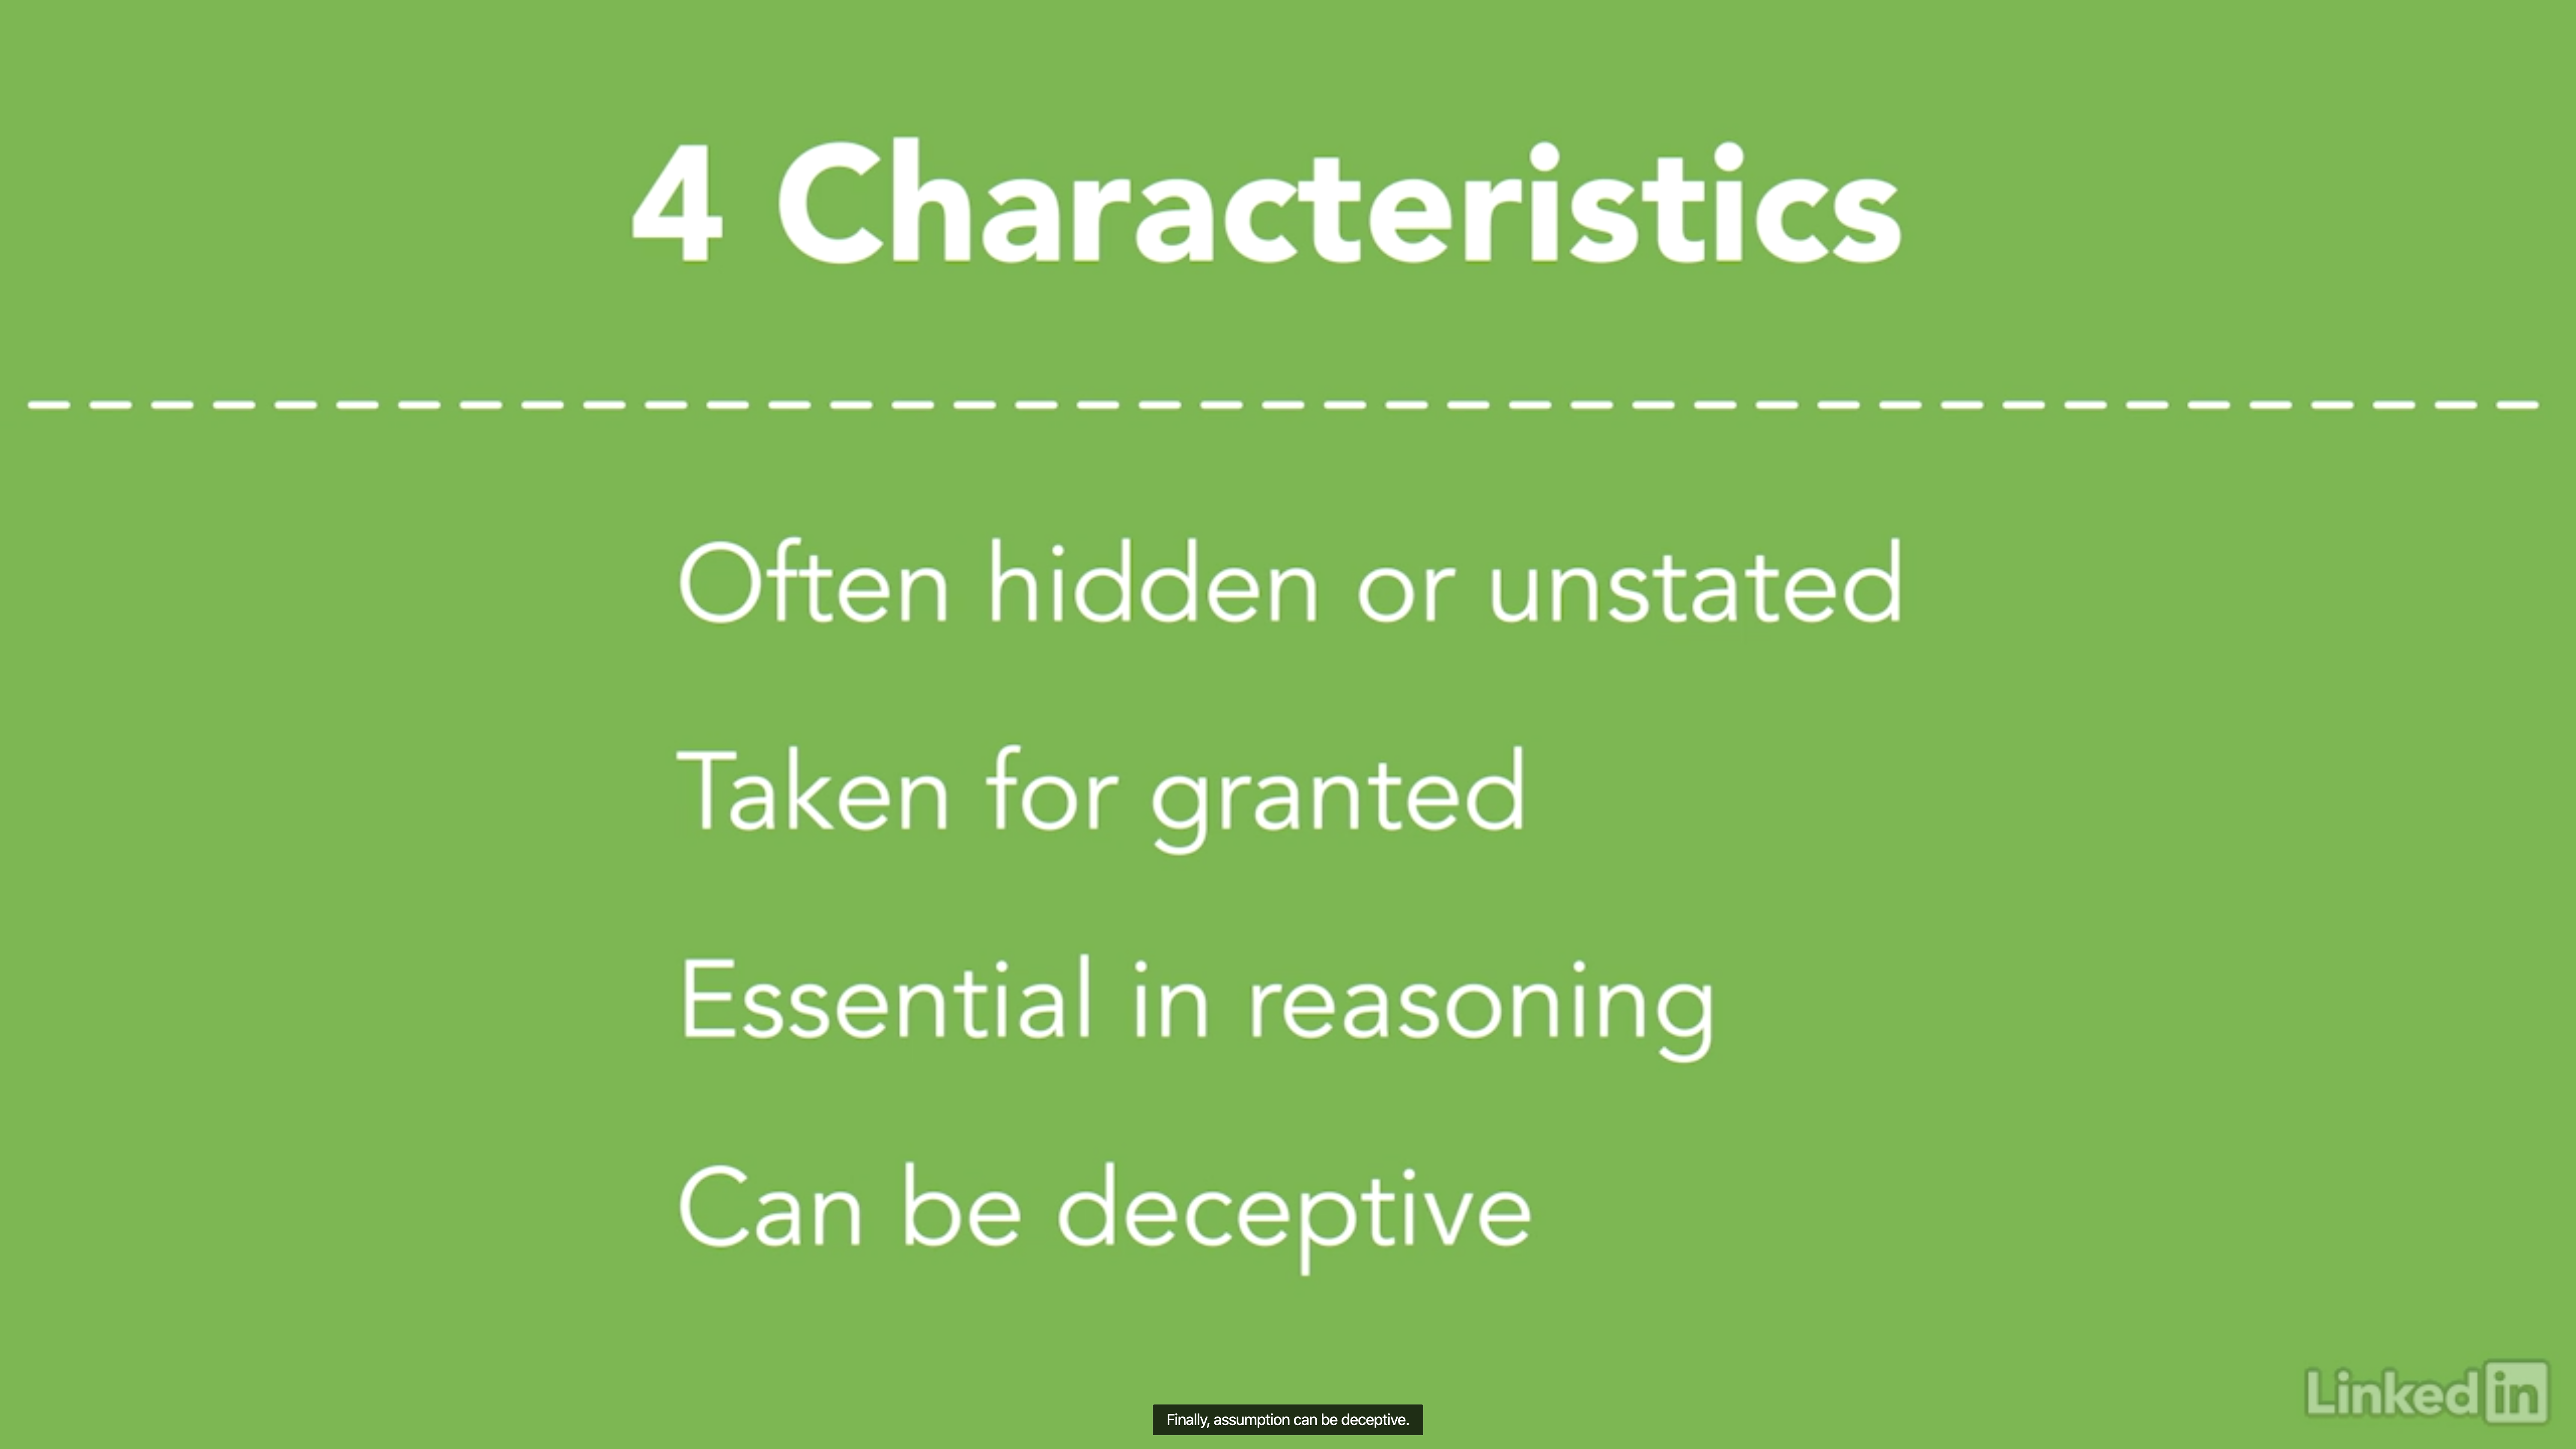
Root out assumptions
- Remember that some assumptions are wrong result in a wrong reasoning.
Example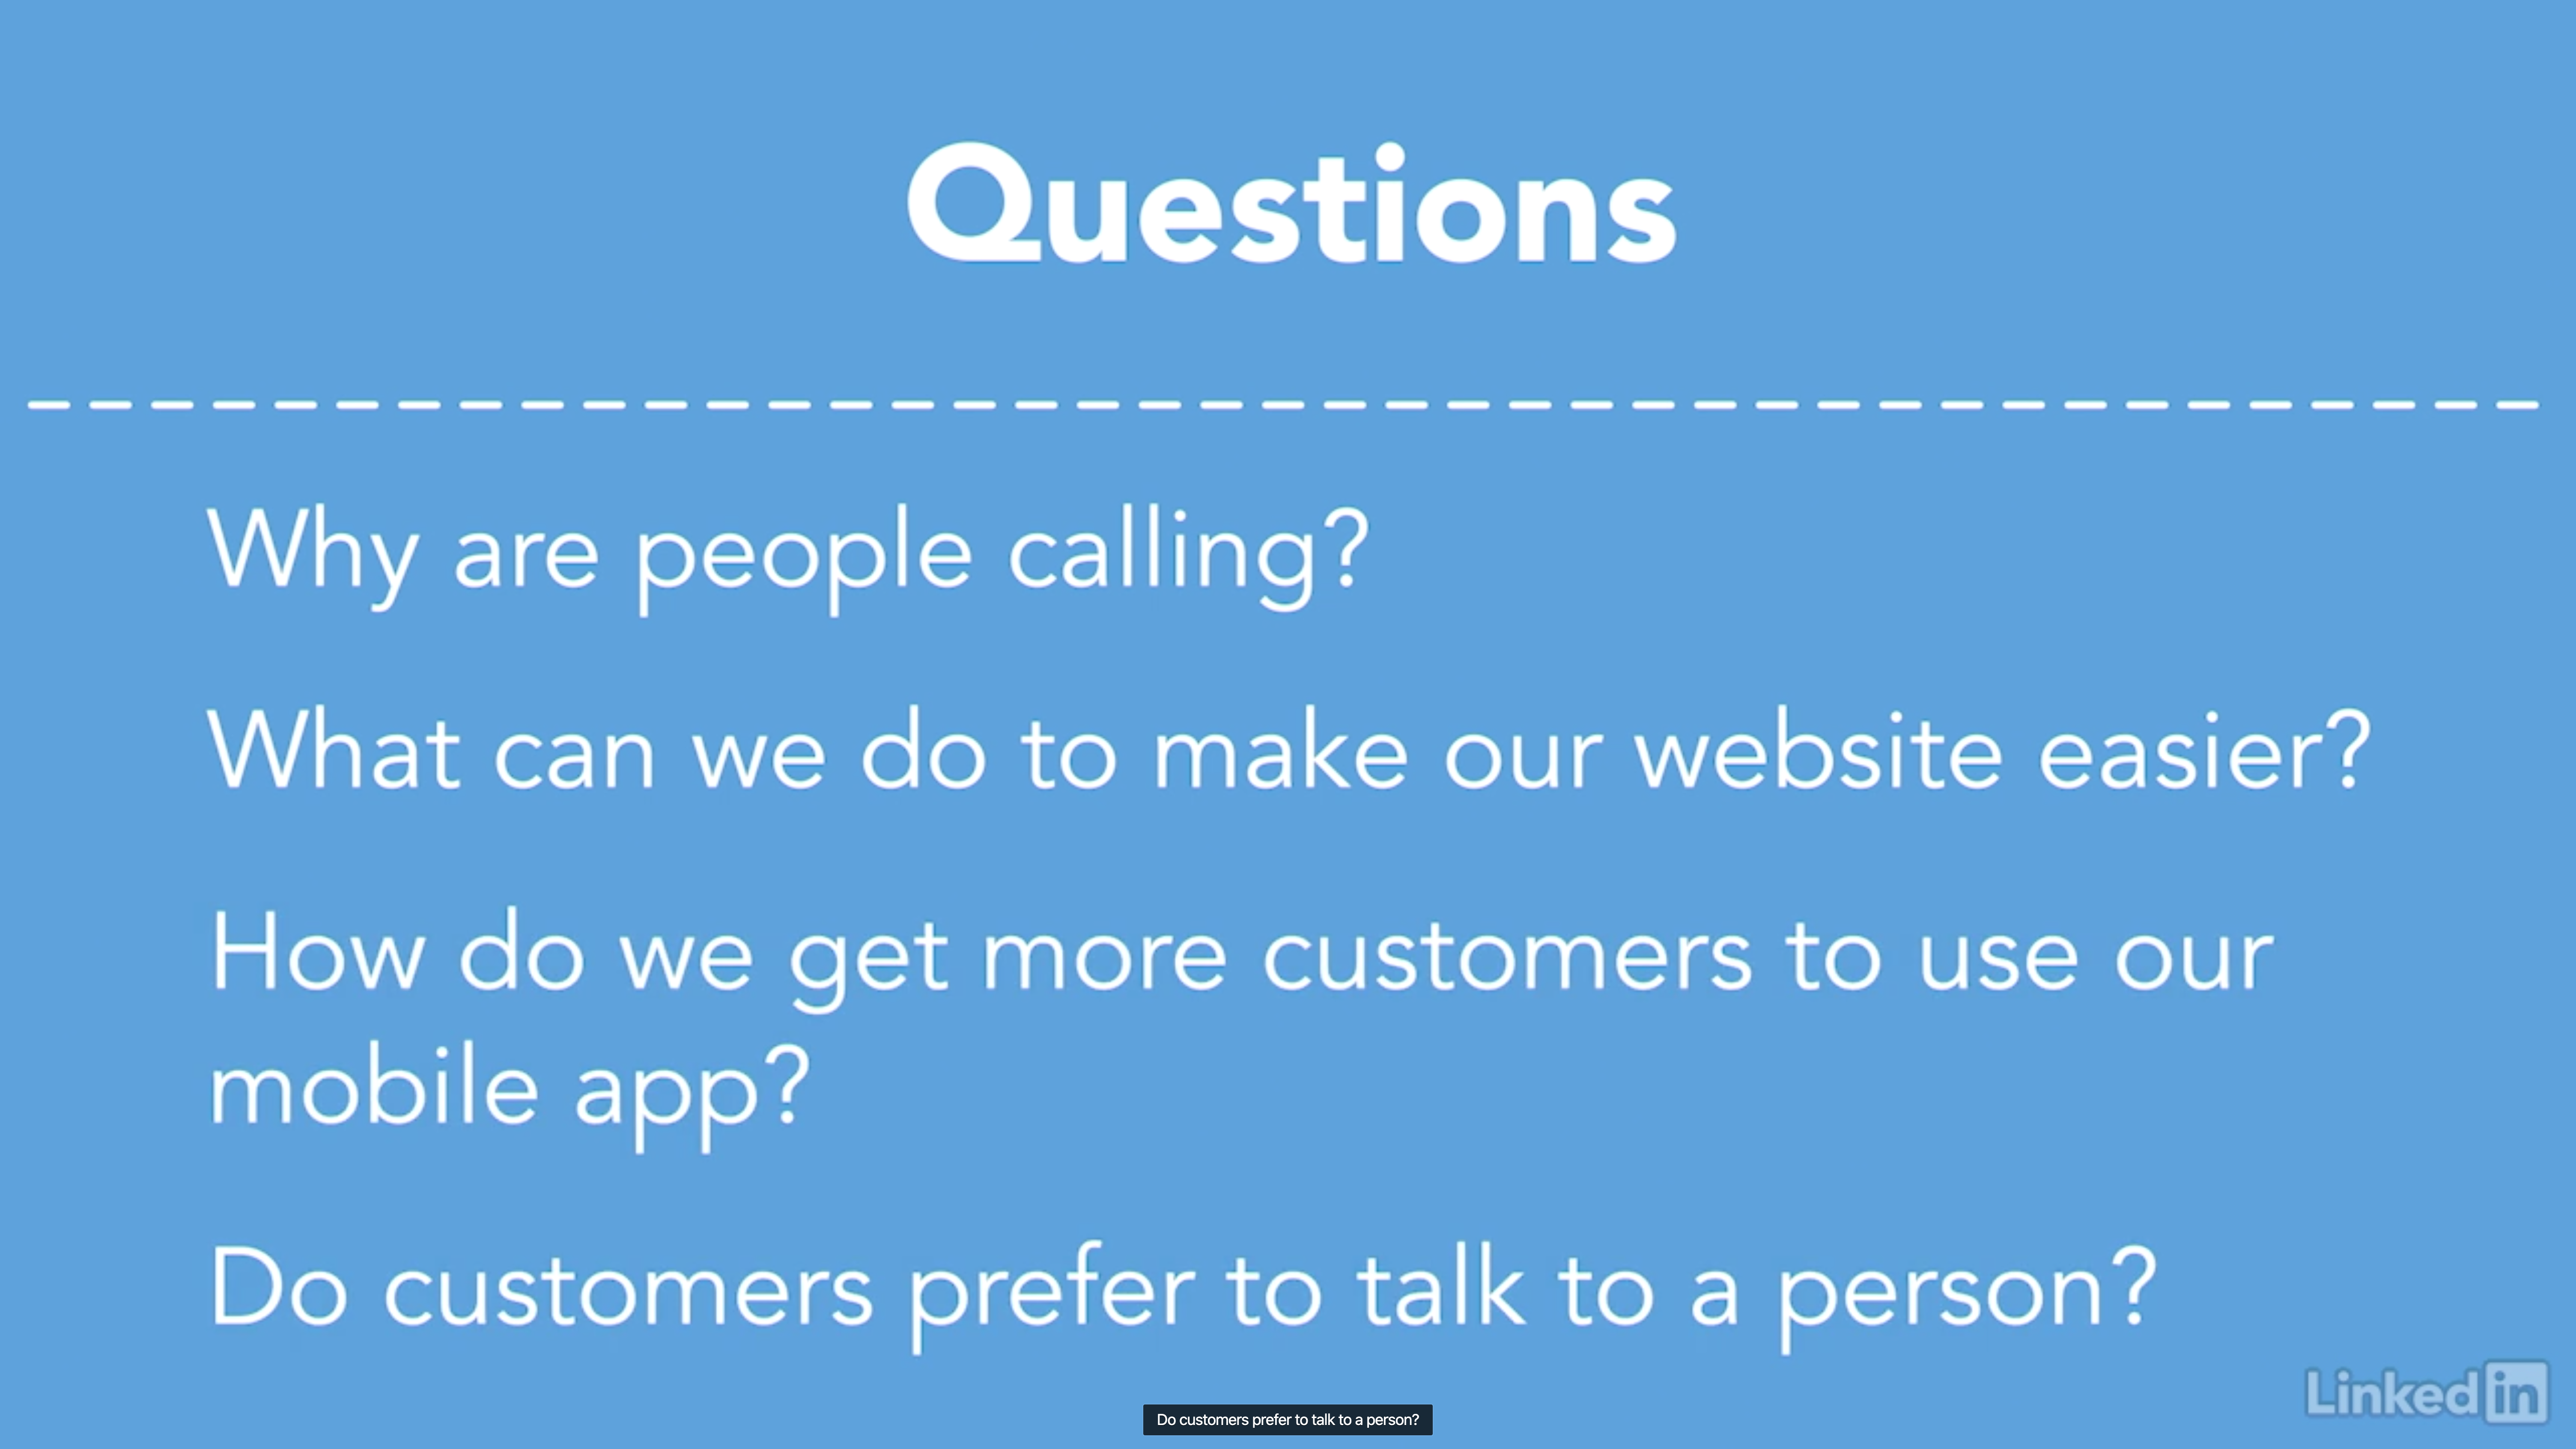
Example

Find errors
Seven Dangers in questions, reasoning, and assumptions
- Ad hominem or personal attacks
- Dismissing someone’s questions
- Quick consensus
- Reliance on questionable authority
- Sleight of hand reasoning
- Straw person reasoning
- False dichotomy
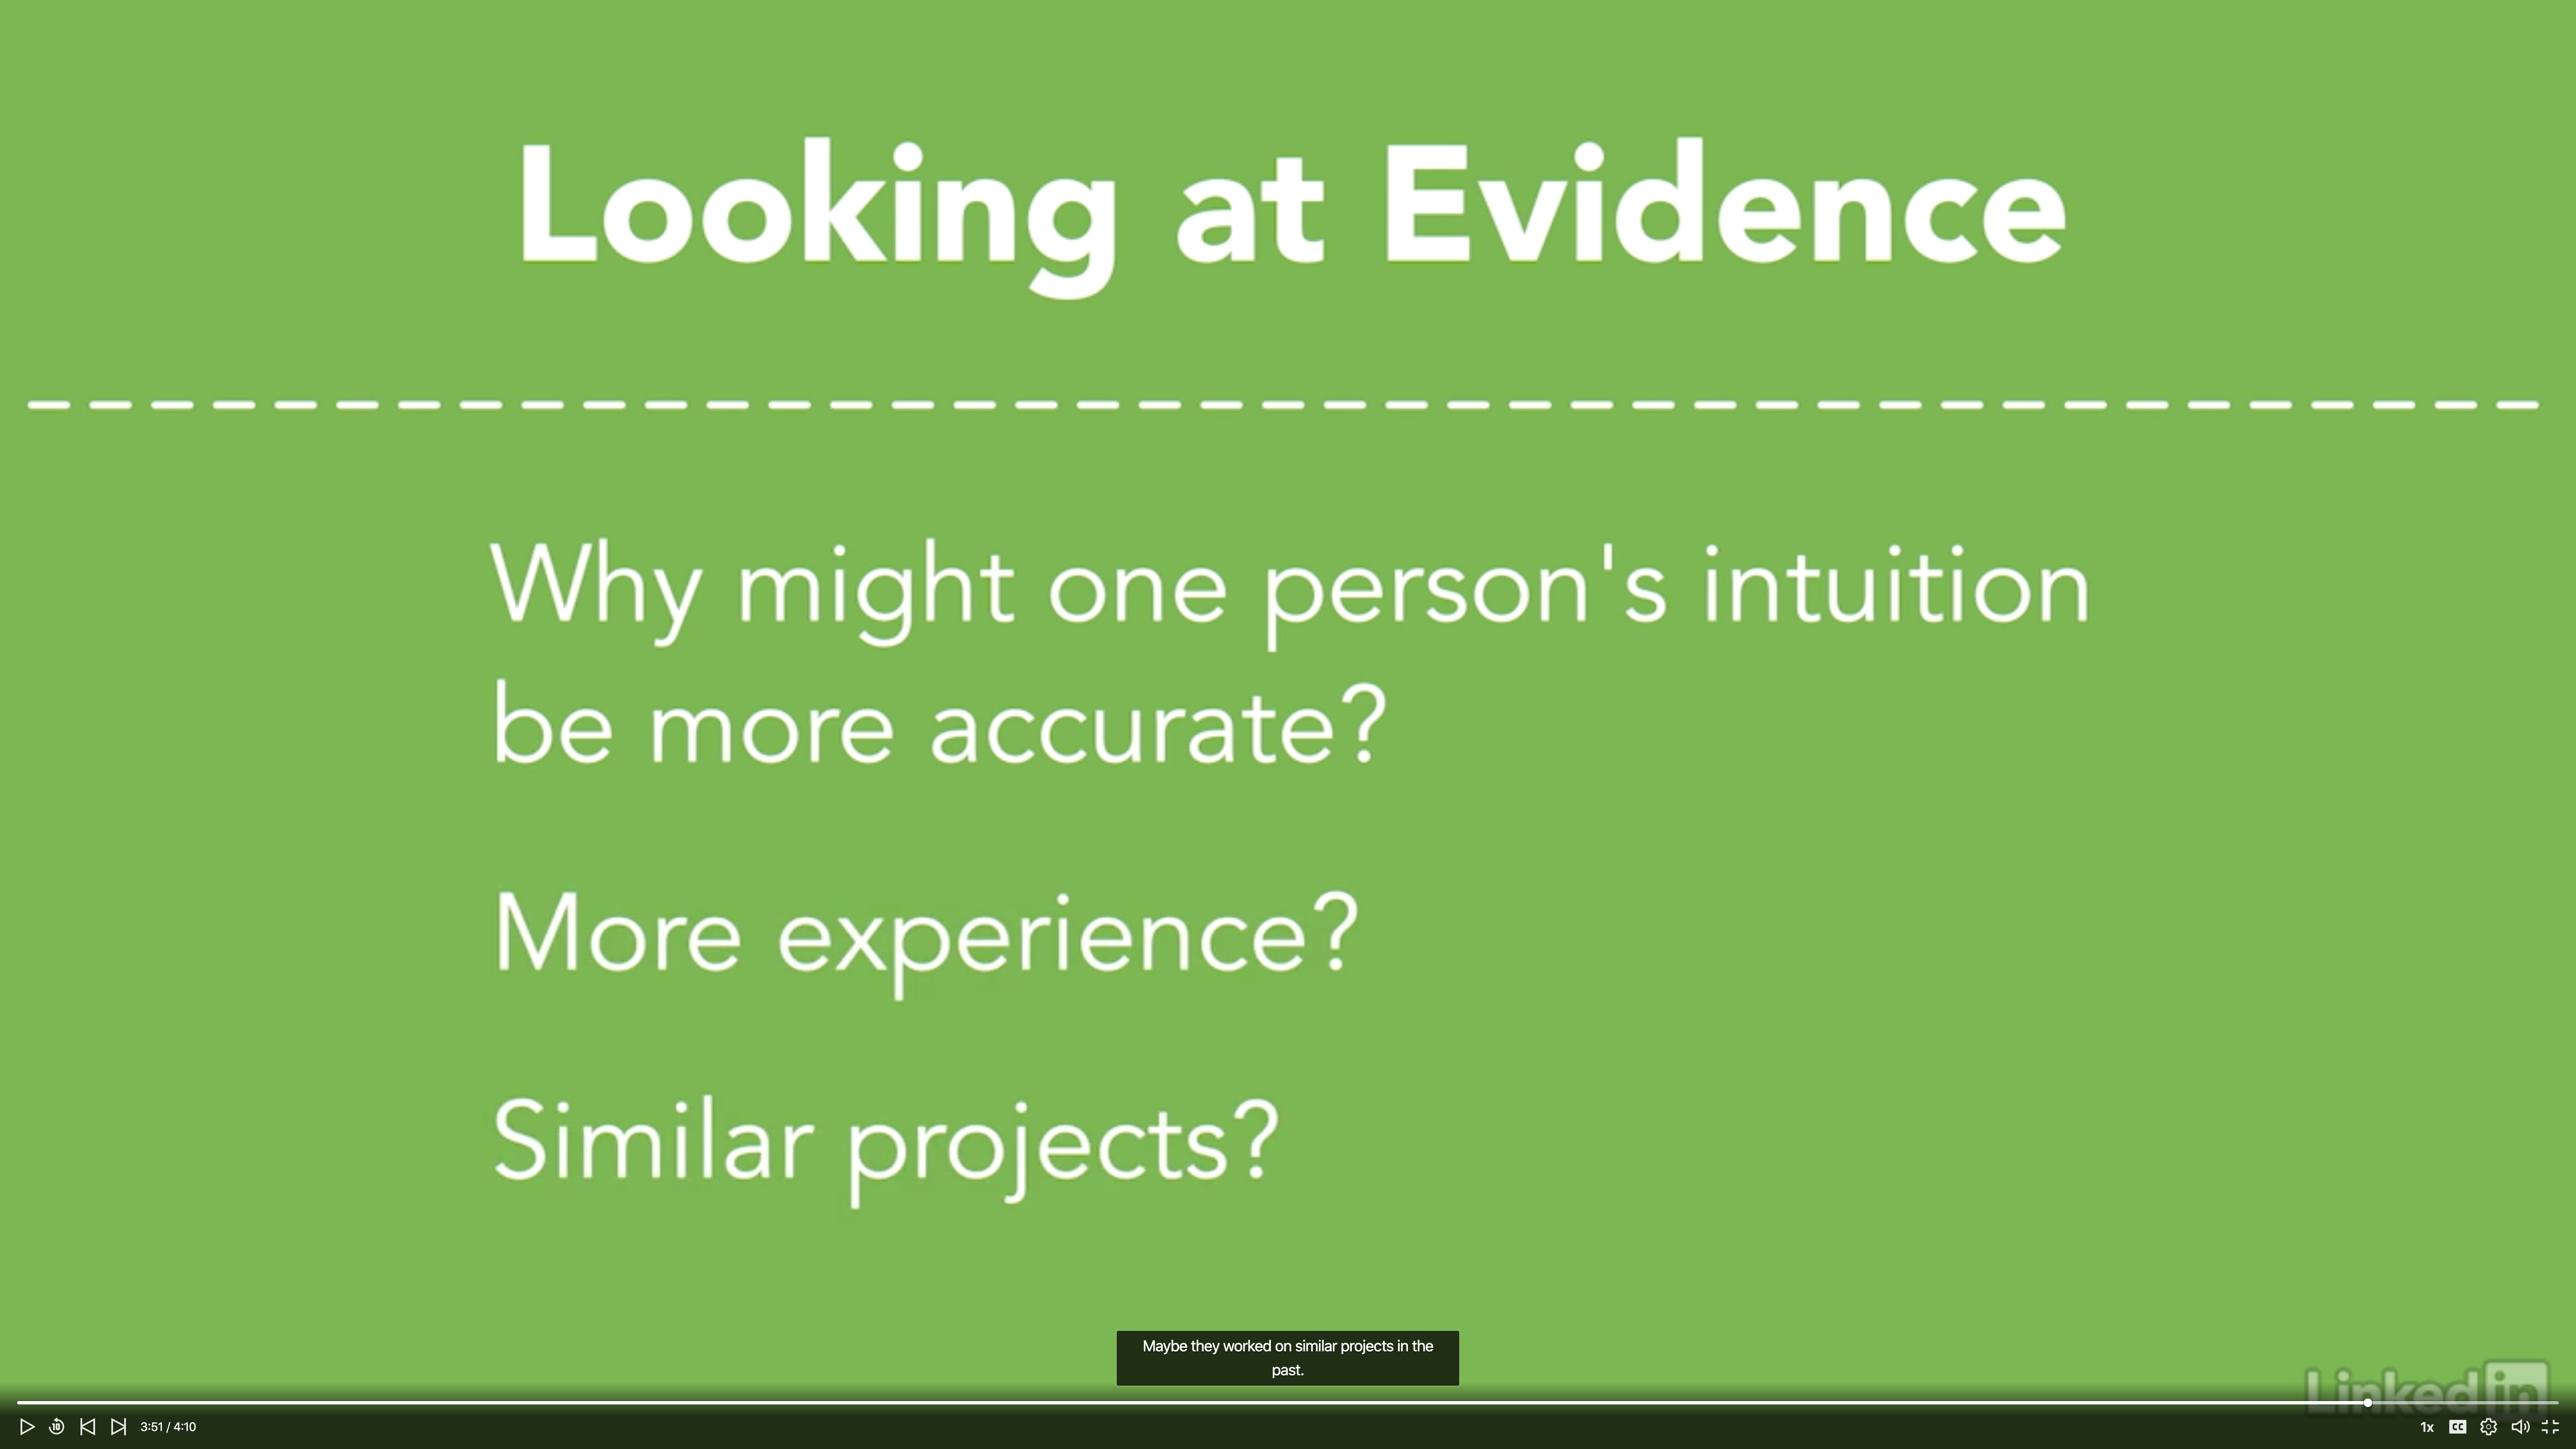
Challenge evidence
- Three questions before encounter a fact
- Should we believe it?
- Is there evidence to support it?
- How good is the evidence?
- Intuition and experience are not bad, but need to be proved.
Example
Strong evidence: Eat too much sugar is bad for your health.
Weak evidence: Honey is healthier than sugar.
See other causes
- Three rival causes
- Does the cause makes sense?
- Is the cause consistent with other effects?
- Can an event by explained by rival causes?
- Don’t afraid to question the connection between the cause and effect.
Uncover misleading statistics
- Question the data source or statistical model since the result depends on how the storyteller wants to show, e.g., mean and median salary.
- Be careful not to accept statistics as facts. There many ways to make statistics seem like a different and misleading story.
Example: sleight of hand

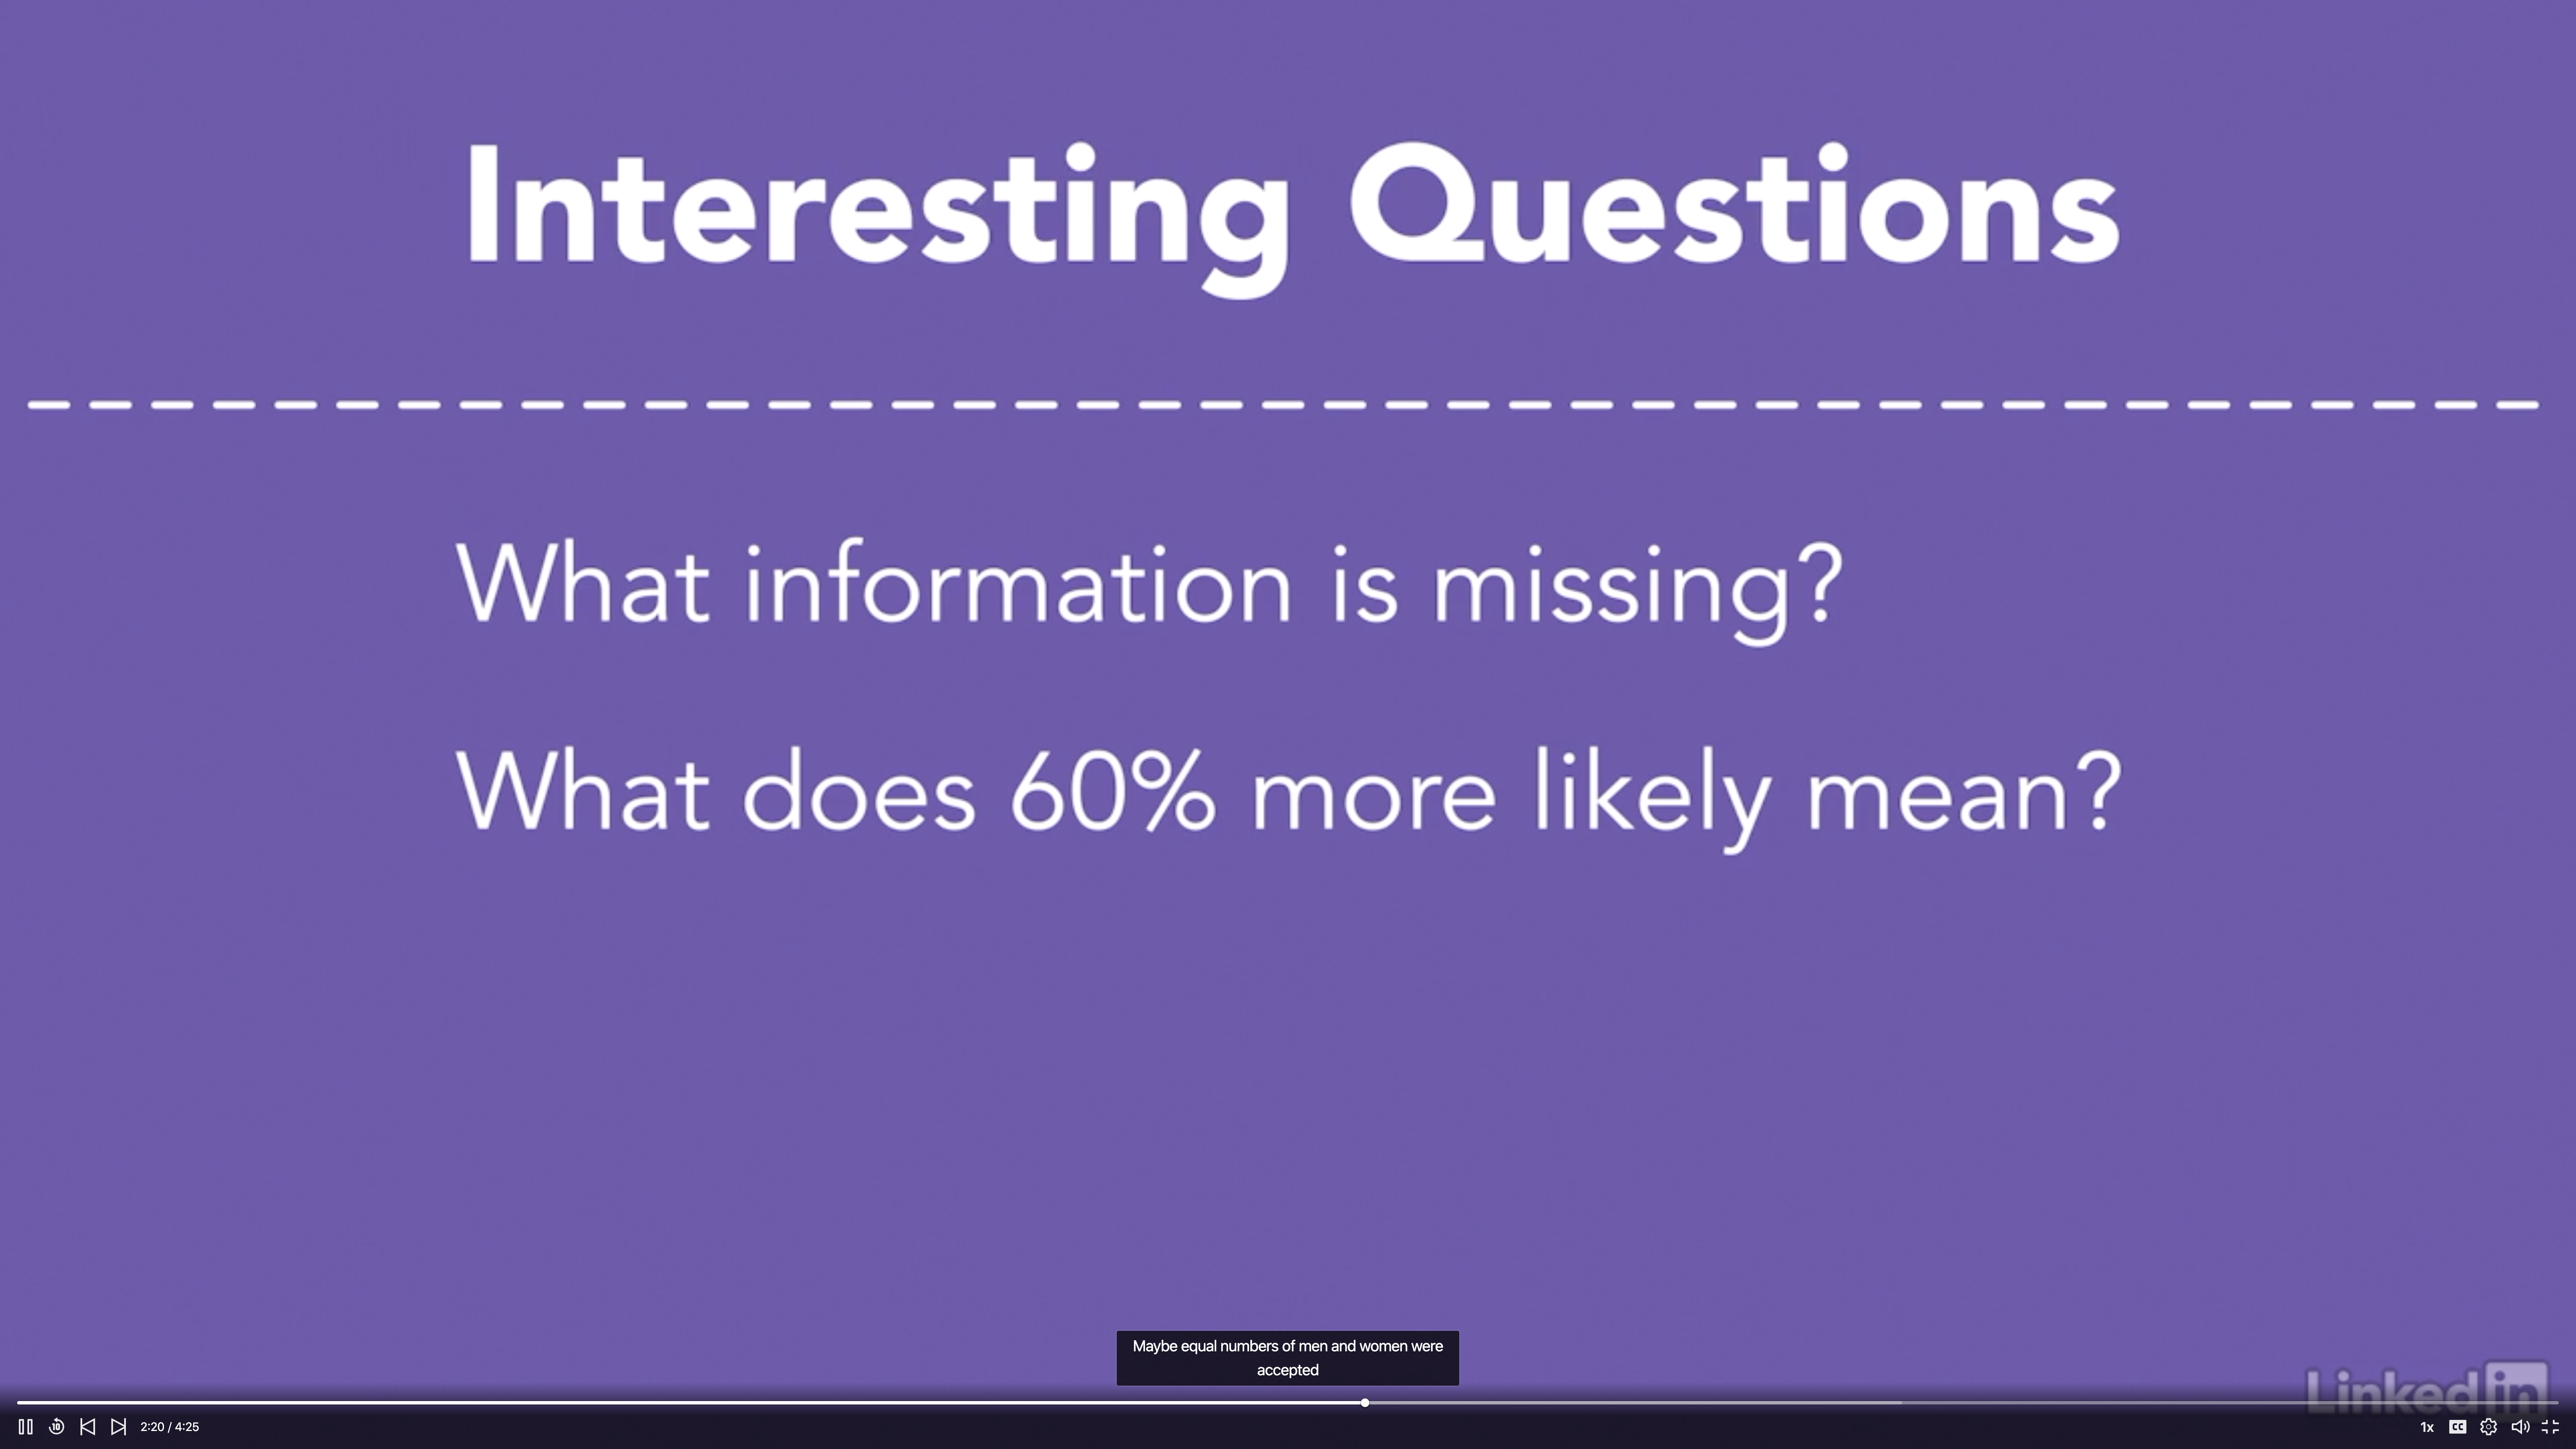
Highlighting missing data
- Always be hunting for missing information.
- Understand the reason
- Limited time and space
- Lack of knowledge
- Motivation
- Look for numbers surrounded by adverbs
- “Faster”, “greater”, “thinner”
- Missing Important information
- Take the negative view
- Why does it matter?
- What is the benefit?
- Understand the reason
Example
80% dentists recommend to chew sugarless gum. However, it may not be the entire version: If you insist on chewing gum, then at least make sure it’s sugarless.
Example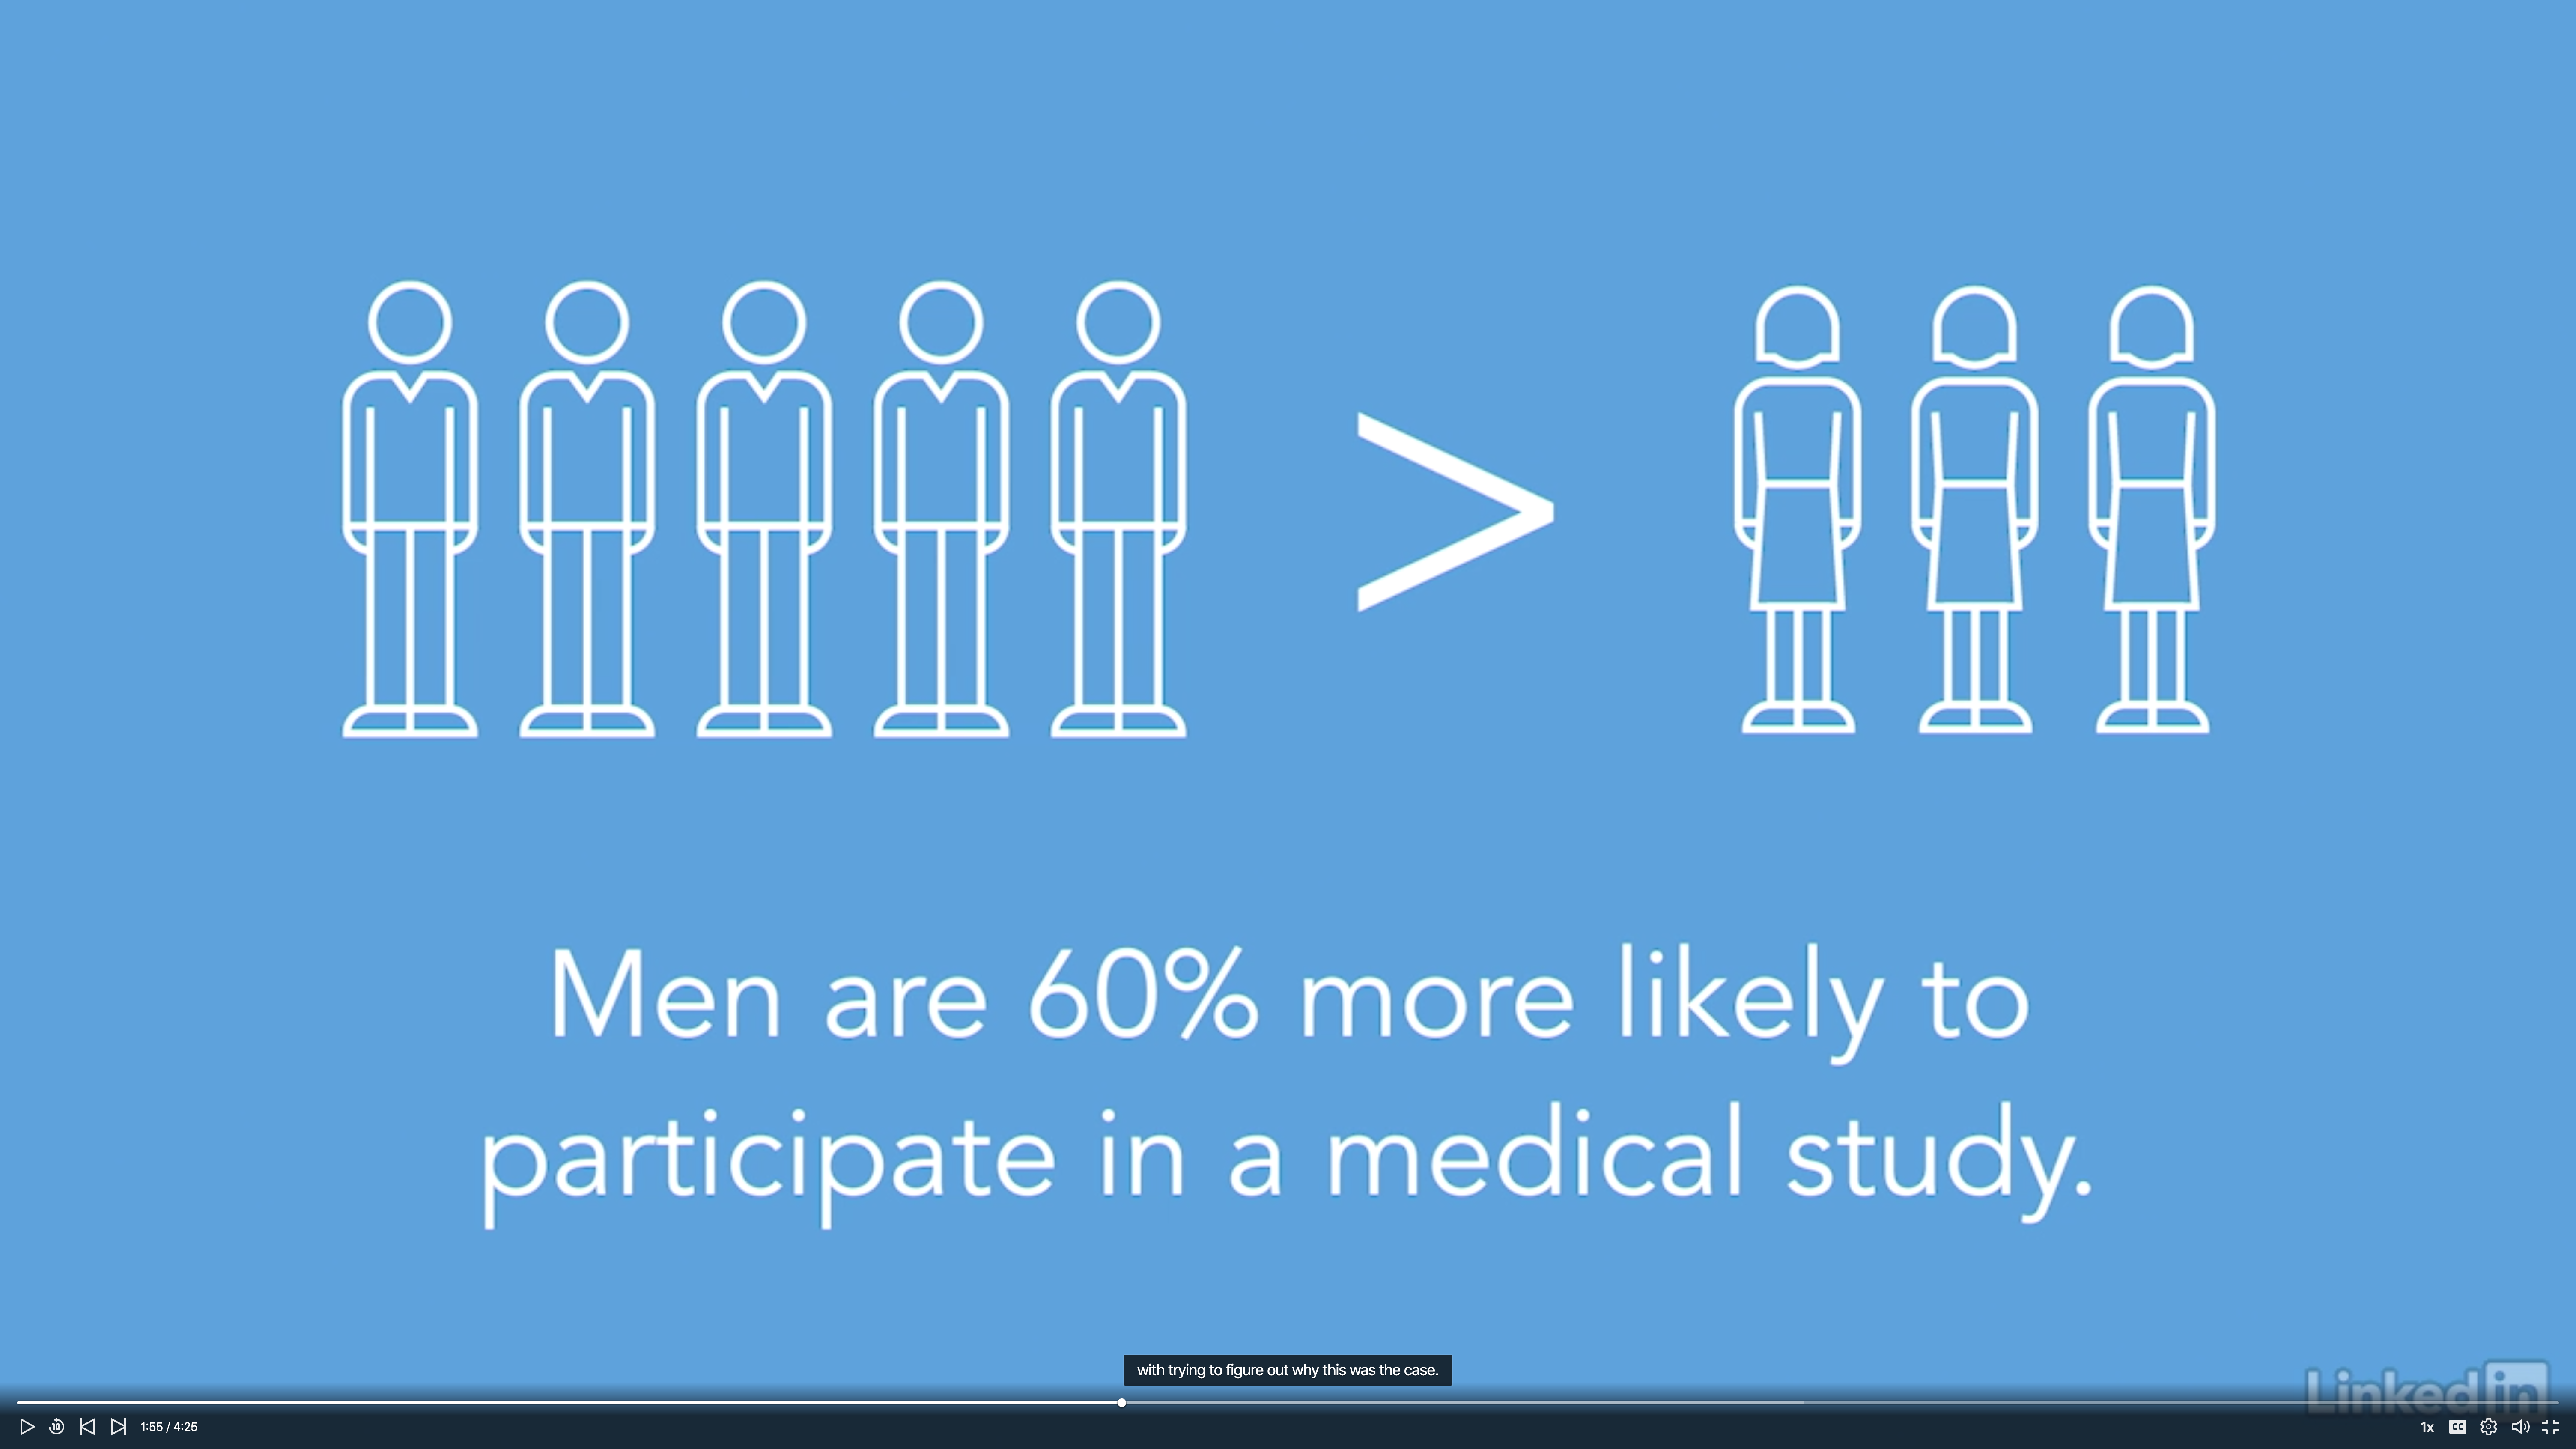
4. Avoid Obstacles
Overcome question bias
- Difficulties with asking questions
- Team members have a natural desire to protect themselves.
- Not enough time.
- Not enough experience.
- Data Science team exists in a culture that discourages questioning.