Crime Rate in Boston
Tableau Process
Introduction
America is one of the freest countries in the world. I like the United States. However, there is one problem that always bothers me: Is America safe? Or to be more specific, is the area safe where I active? China’s mainland is not a free country but safe because of the harsh law, full of policemen and security cameras, and gun control. But America is lack of security cameras and hard to control guns. Lots of people concern about the security issue. A high crime rate may cause low human traffic leading to lost potential customers. For example, students will choose a comparatively safe university when they are in close rank; businessmen may choose a safe area as their new trade area; the Police Department could also distribute budget to the dangerous area leading to reduce cost. Therefore, safety is a tremendous issue for everyone.
Data Sets
All data sets from ANALYZE BOSTON (https://data.boston.gov/).
Data Source: CRIME INCIDENT REPORTS (AUGUST 2015 - TO DATE) (SOURCE: NEW SYSTEM)
(https://data.boston.gov/dataset/crime-incident-reports-august-2015-to-date-source-new-system)
Data Description
| Field Name, Data Type, Required | Description |
|---|---|
| [incident_num] [varchar](20) NOT NULL, | Internal BPD report number |
| [offense_code][varchar](25) NULL, | Numerical code of offense description |
| [Offense_Code_Group_Description][varchar](80) NULL, | Internal categorization of [offense_description] |
| [Offense_Description][varchar](80) NULL, | Primary descriptor of incident |
| [district] [varchar](10) NULL, | What district the crime was reported in |
| [reporting_area] [varchar](10) NULL, | RA number associated with the where the crime was reported from. |
| [shooting][char](1) NULL, | Indicated a shooting took place. |
| [occurred_on] [datetime2](7) NULL, | Earliest date and time the incident could have taken place |
| [UCR_Part] [varchar](25) NULL, | Universal Crime Reporting Part number (1,2, 3) |
| [street] [varchar](50) NULL, | Street name the incident took place |
Total Offense Duration
As a NEU student, I would like to set NEU as a specific area to analyze. It is also possible for other areas in Boston to analyze in the same data set and Tableau process.
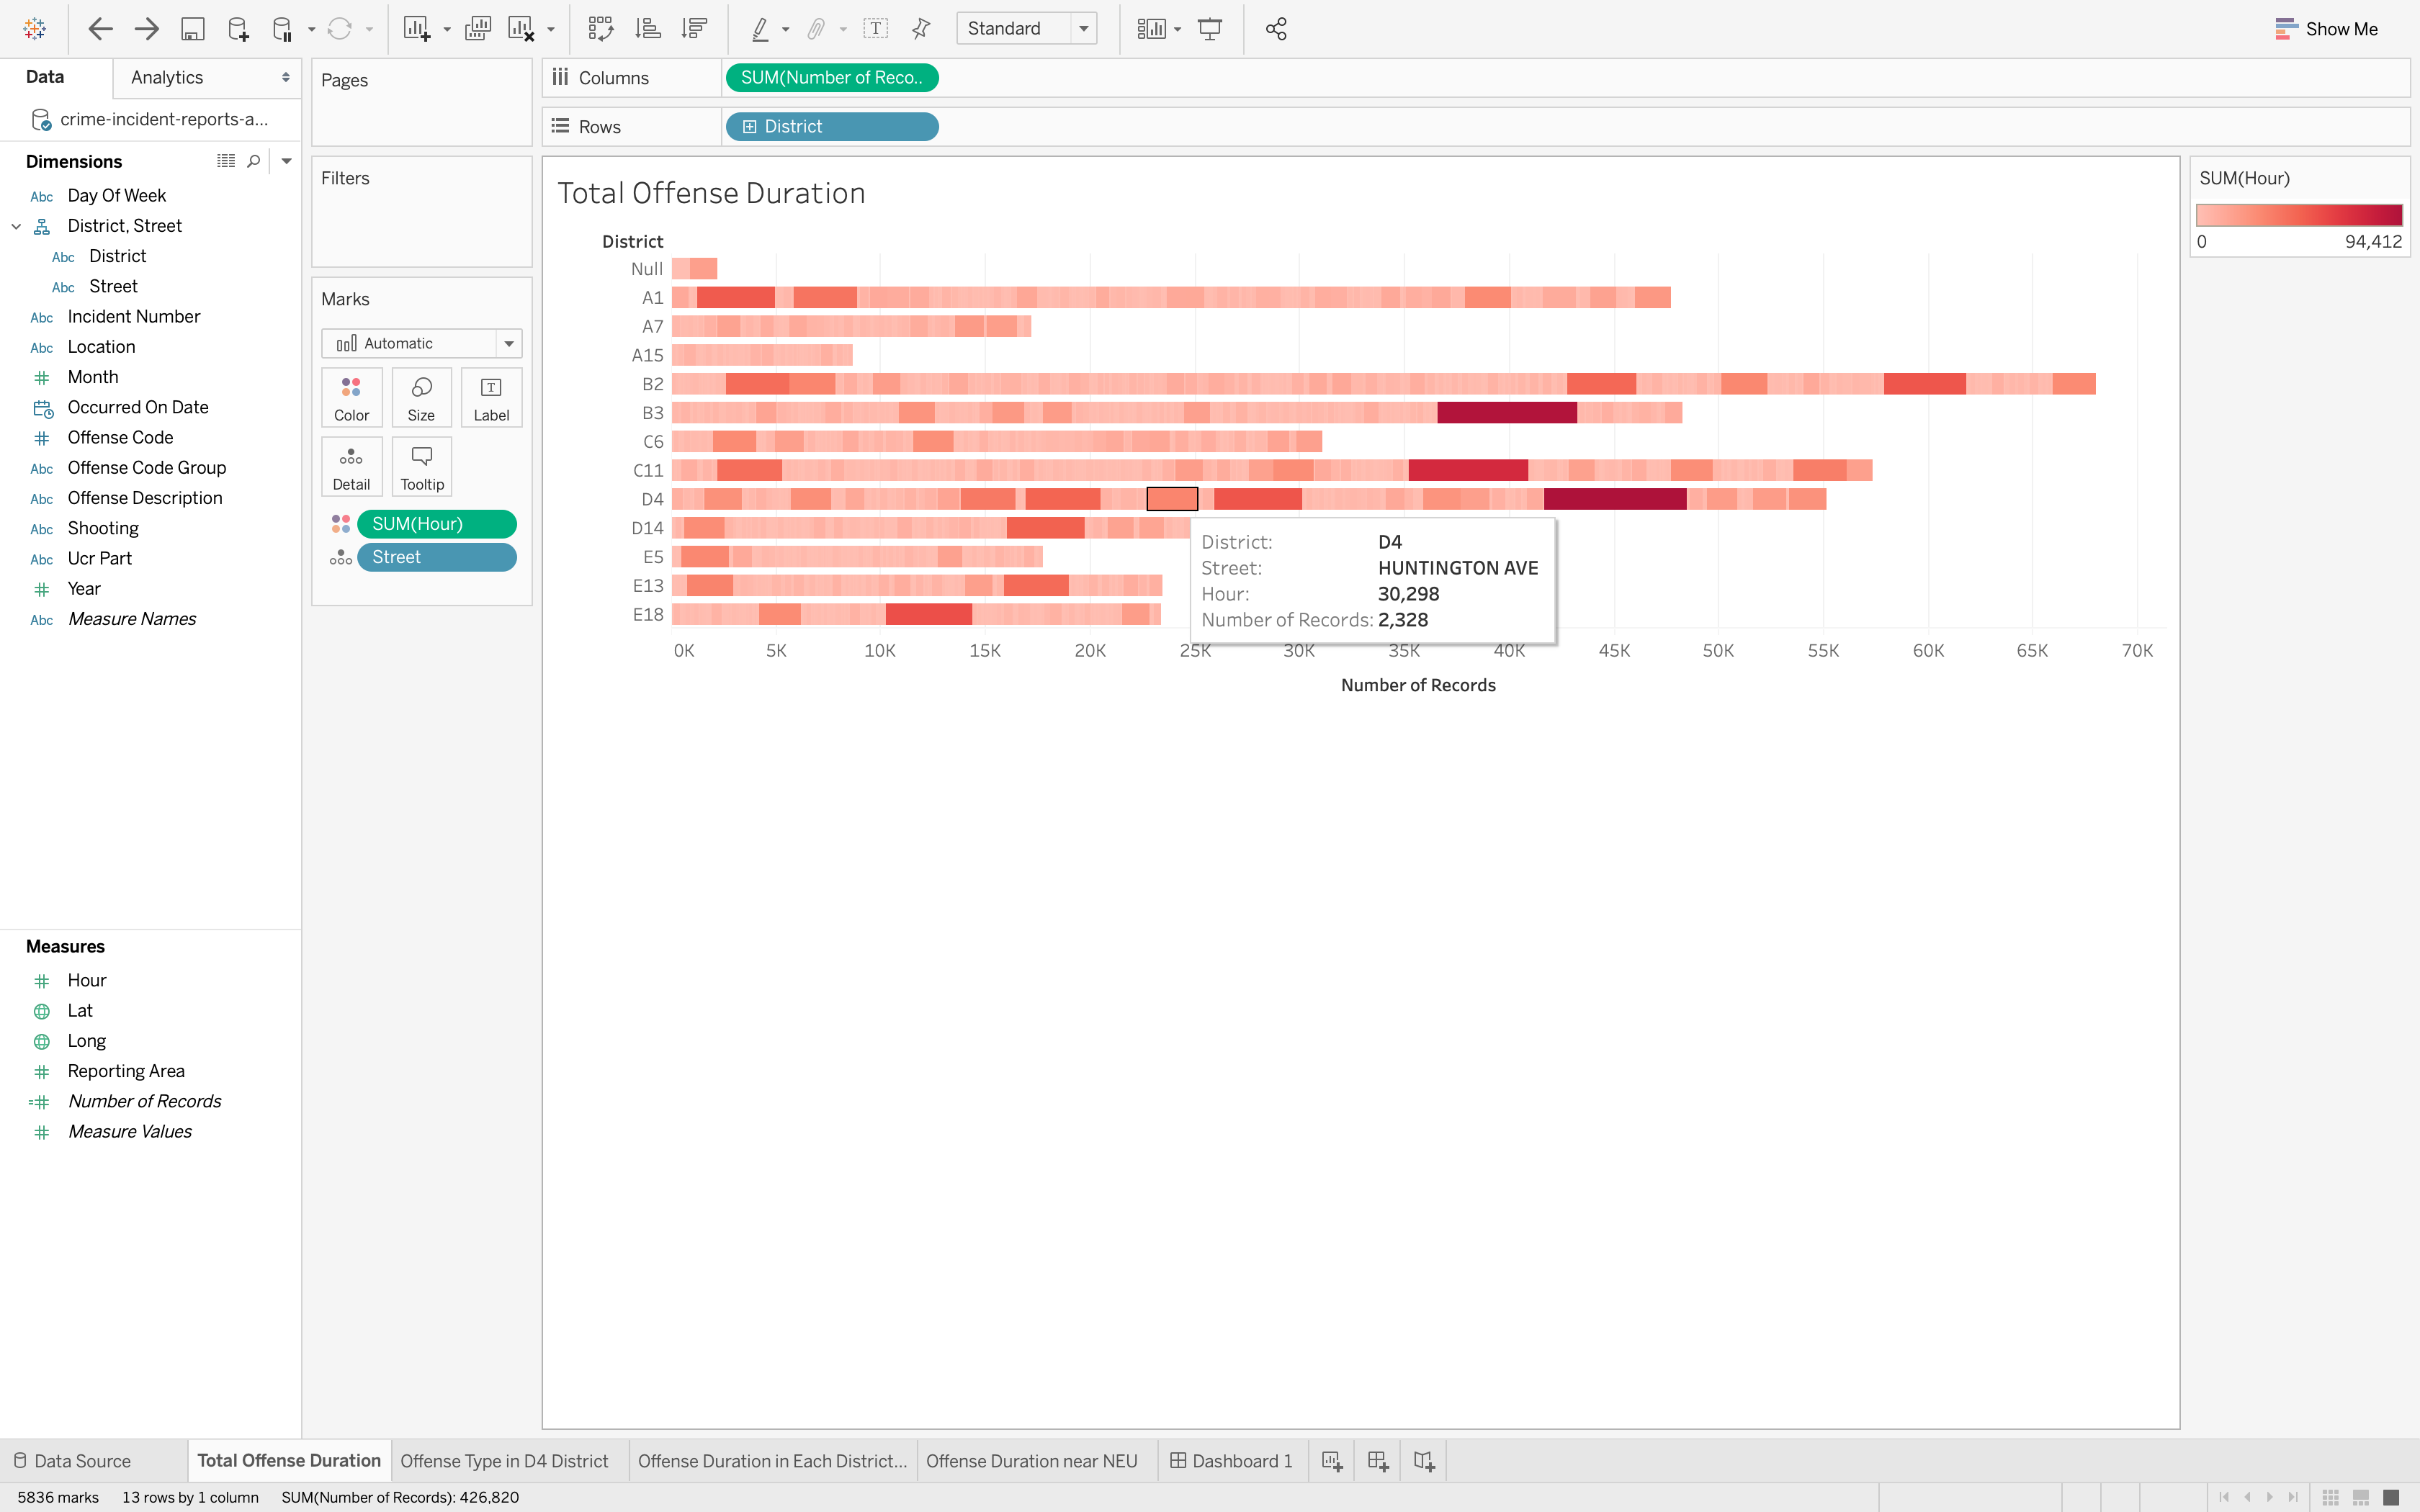
After set Street as District‘s sub-category, we can get a bar chart of total offense duration. And how safe my school is? According to this issue, I try to develop a visualization to show the security level of a specific area. Not only can this Tableau worksheet show offense records near NEU but it also can show offense records of every area in Boston.
NEU is located at 360 Huntington Ave, Boston, MA 02115. Therefore, I searched for Huntington as keyword and I find out Huntington Ave is a street of D4 district.
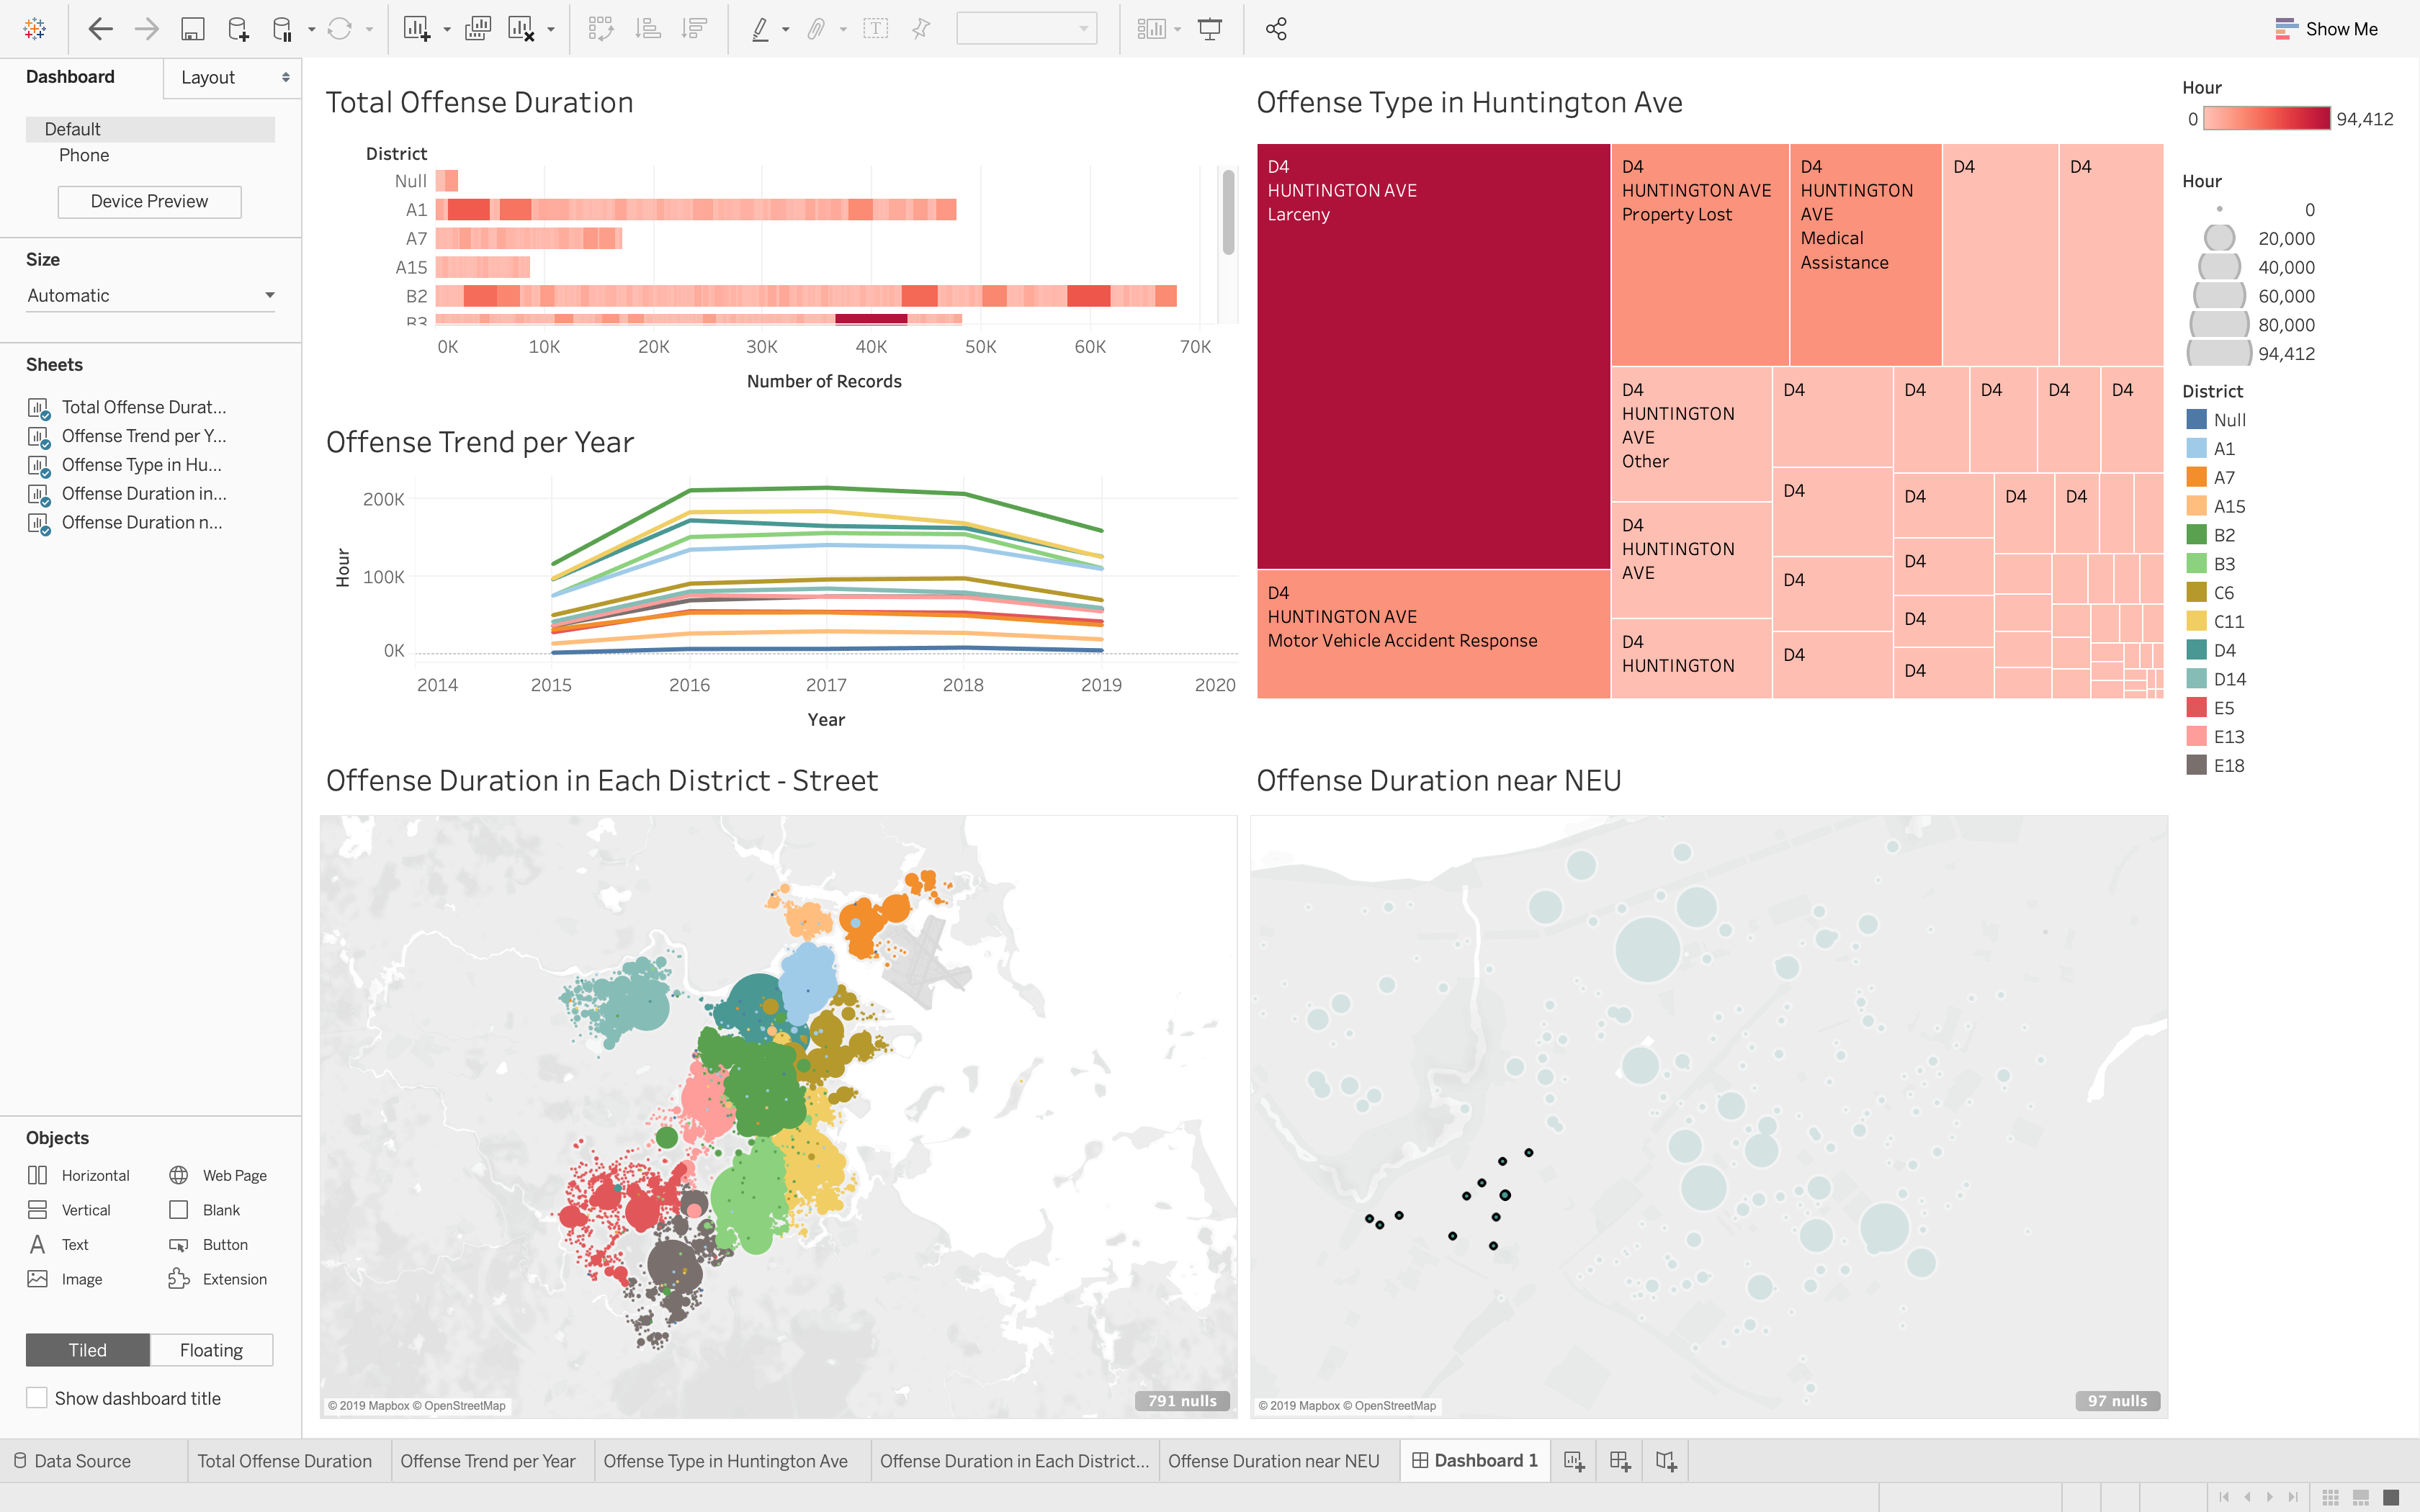
As the bar chart shows, Huntington Ave is not a safe street since the counterpart bar is a little long. And D4 district is the third-longest offense district. Therefore, I will deep analyze what kind of offense type happen in this district.
Offense Trend per Year
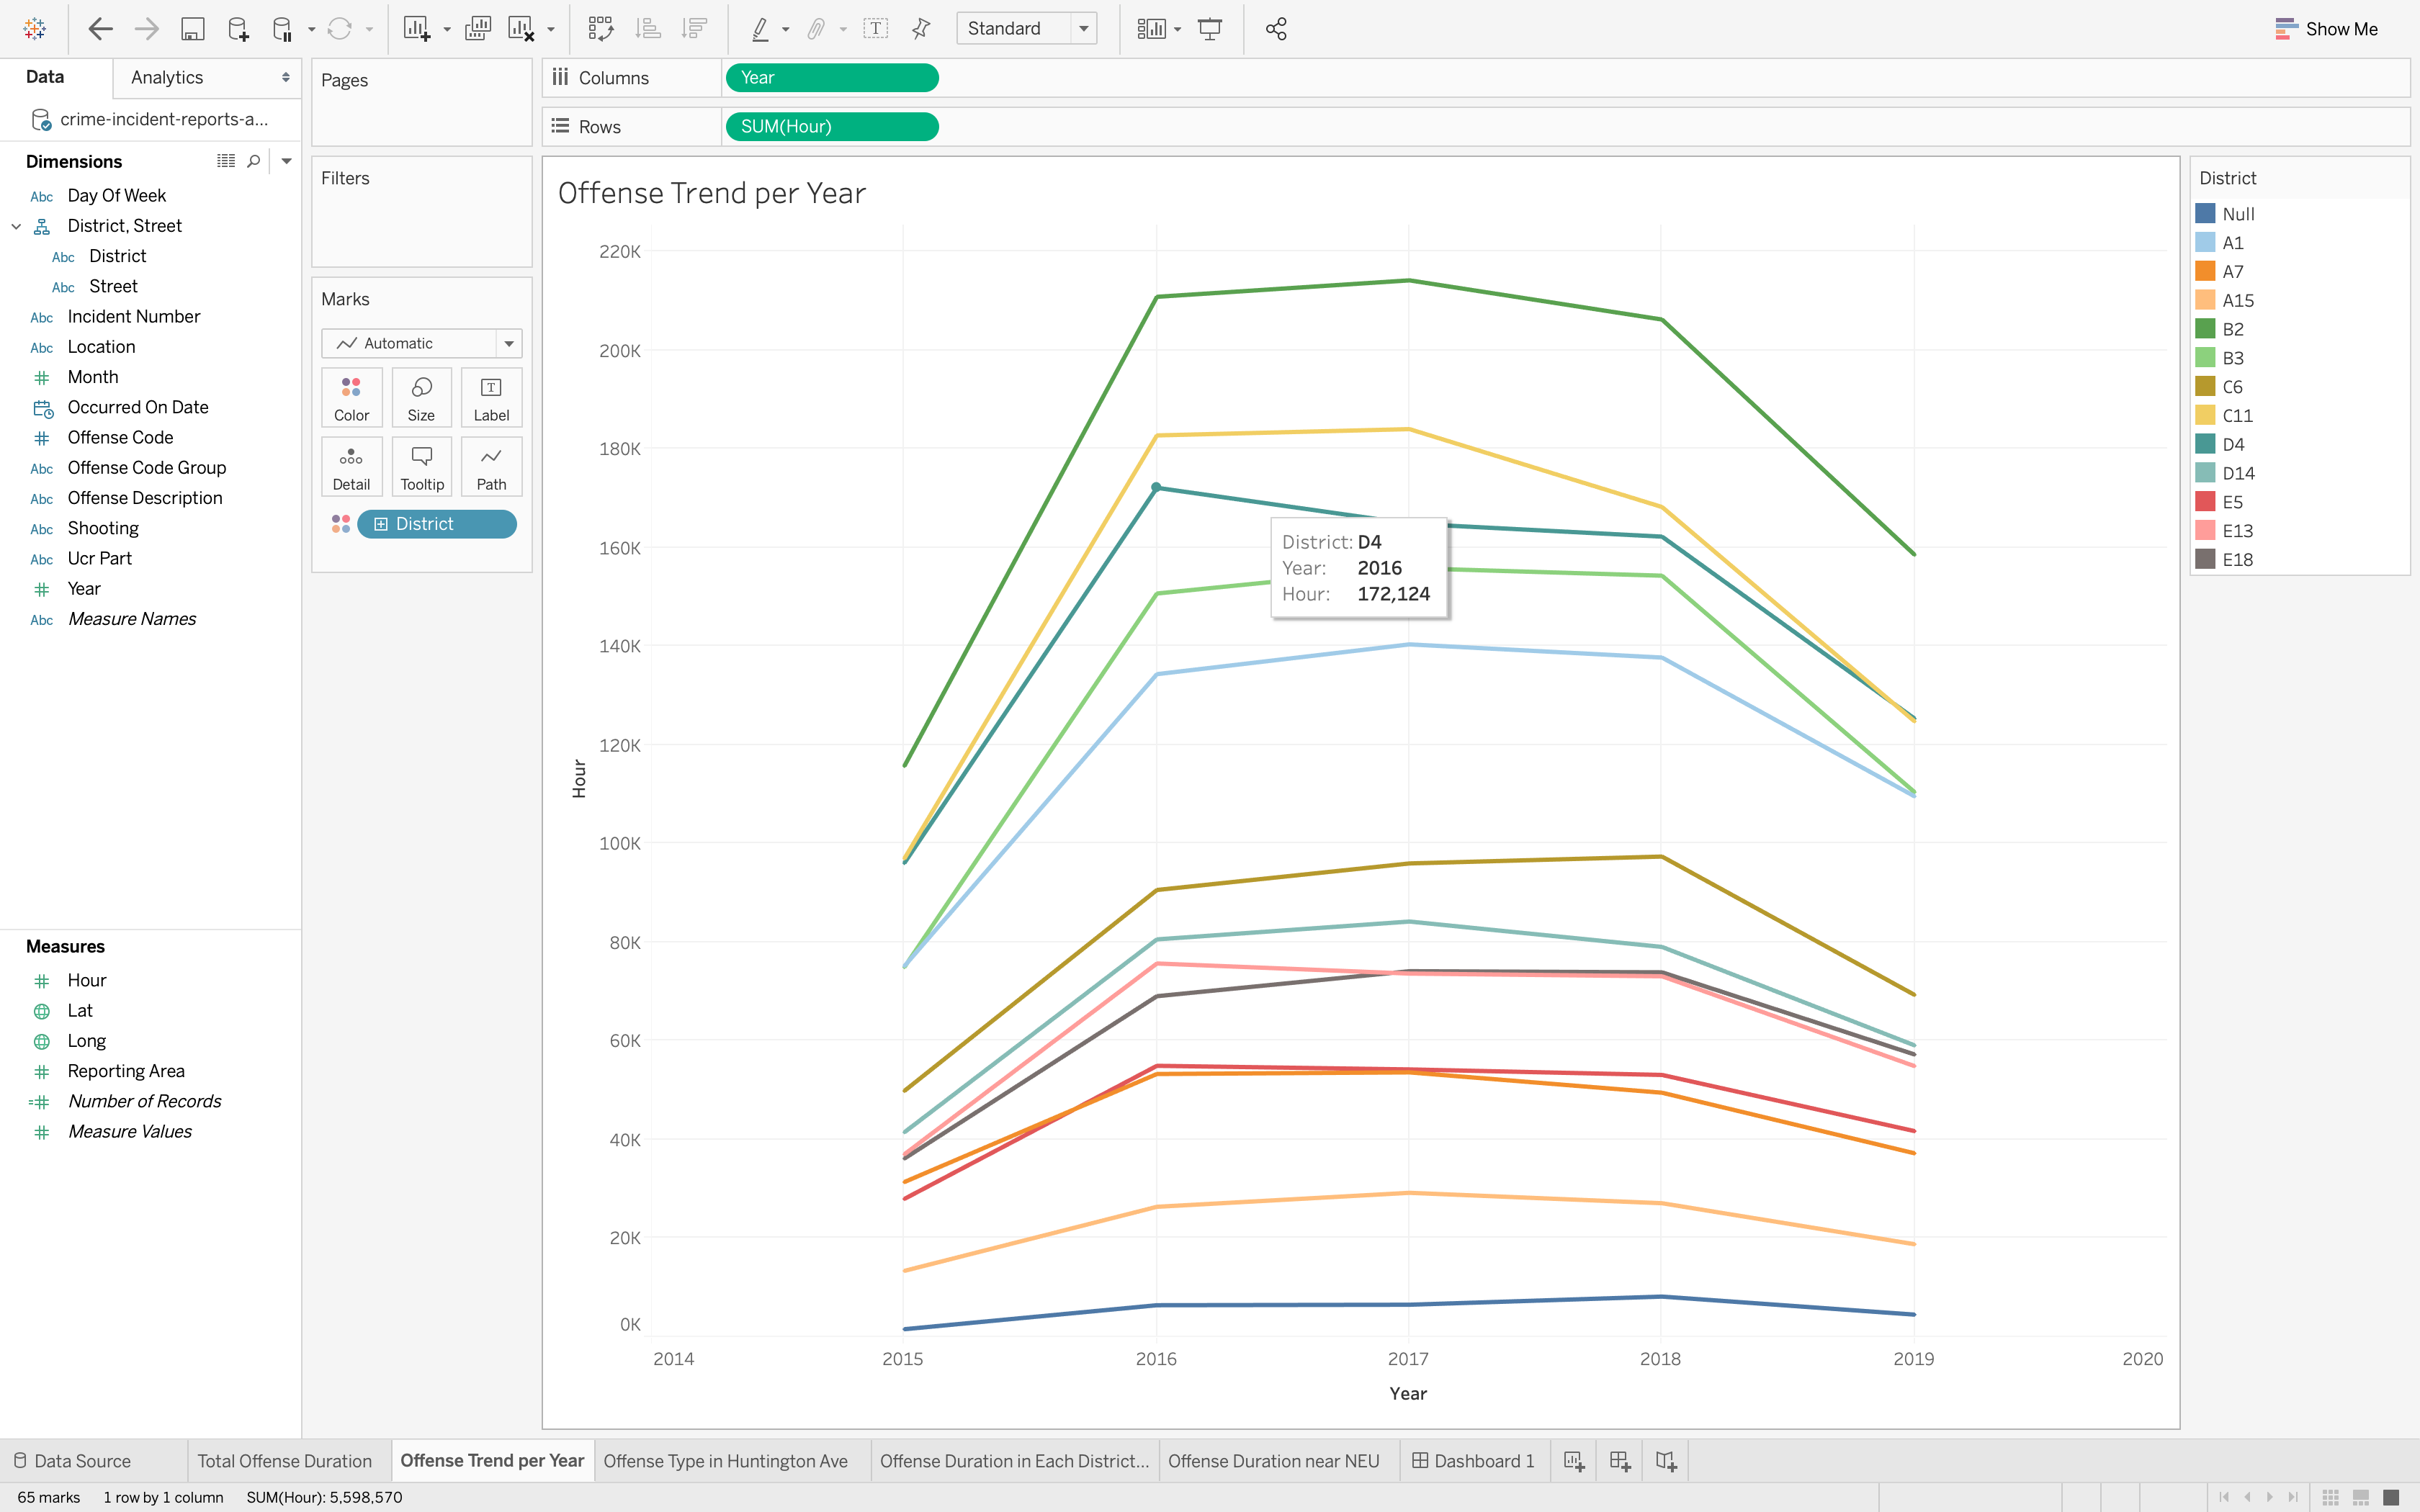
We cannot simply make a conclusion since the offense report is based on the sum of hours, which means we cannot ignore the population base. However, the offense trend could tell us whether or not an area is becoming better(please ignore the population fluctuation in the short-range).
Offense Type in Huntington Avenue
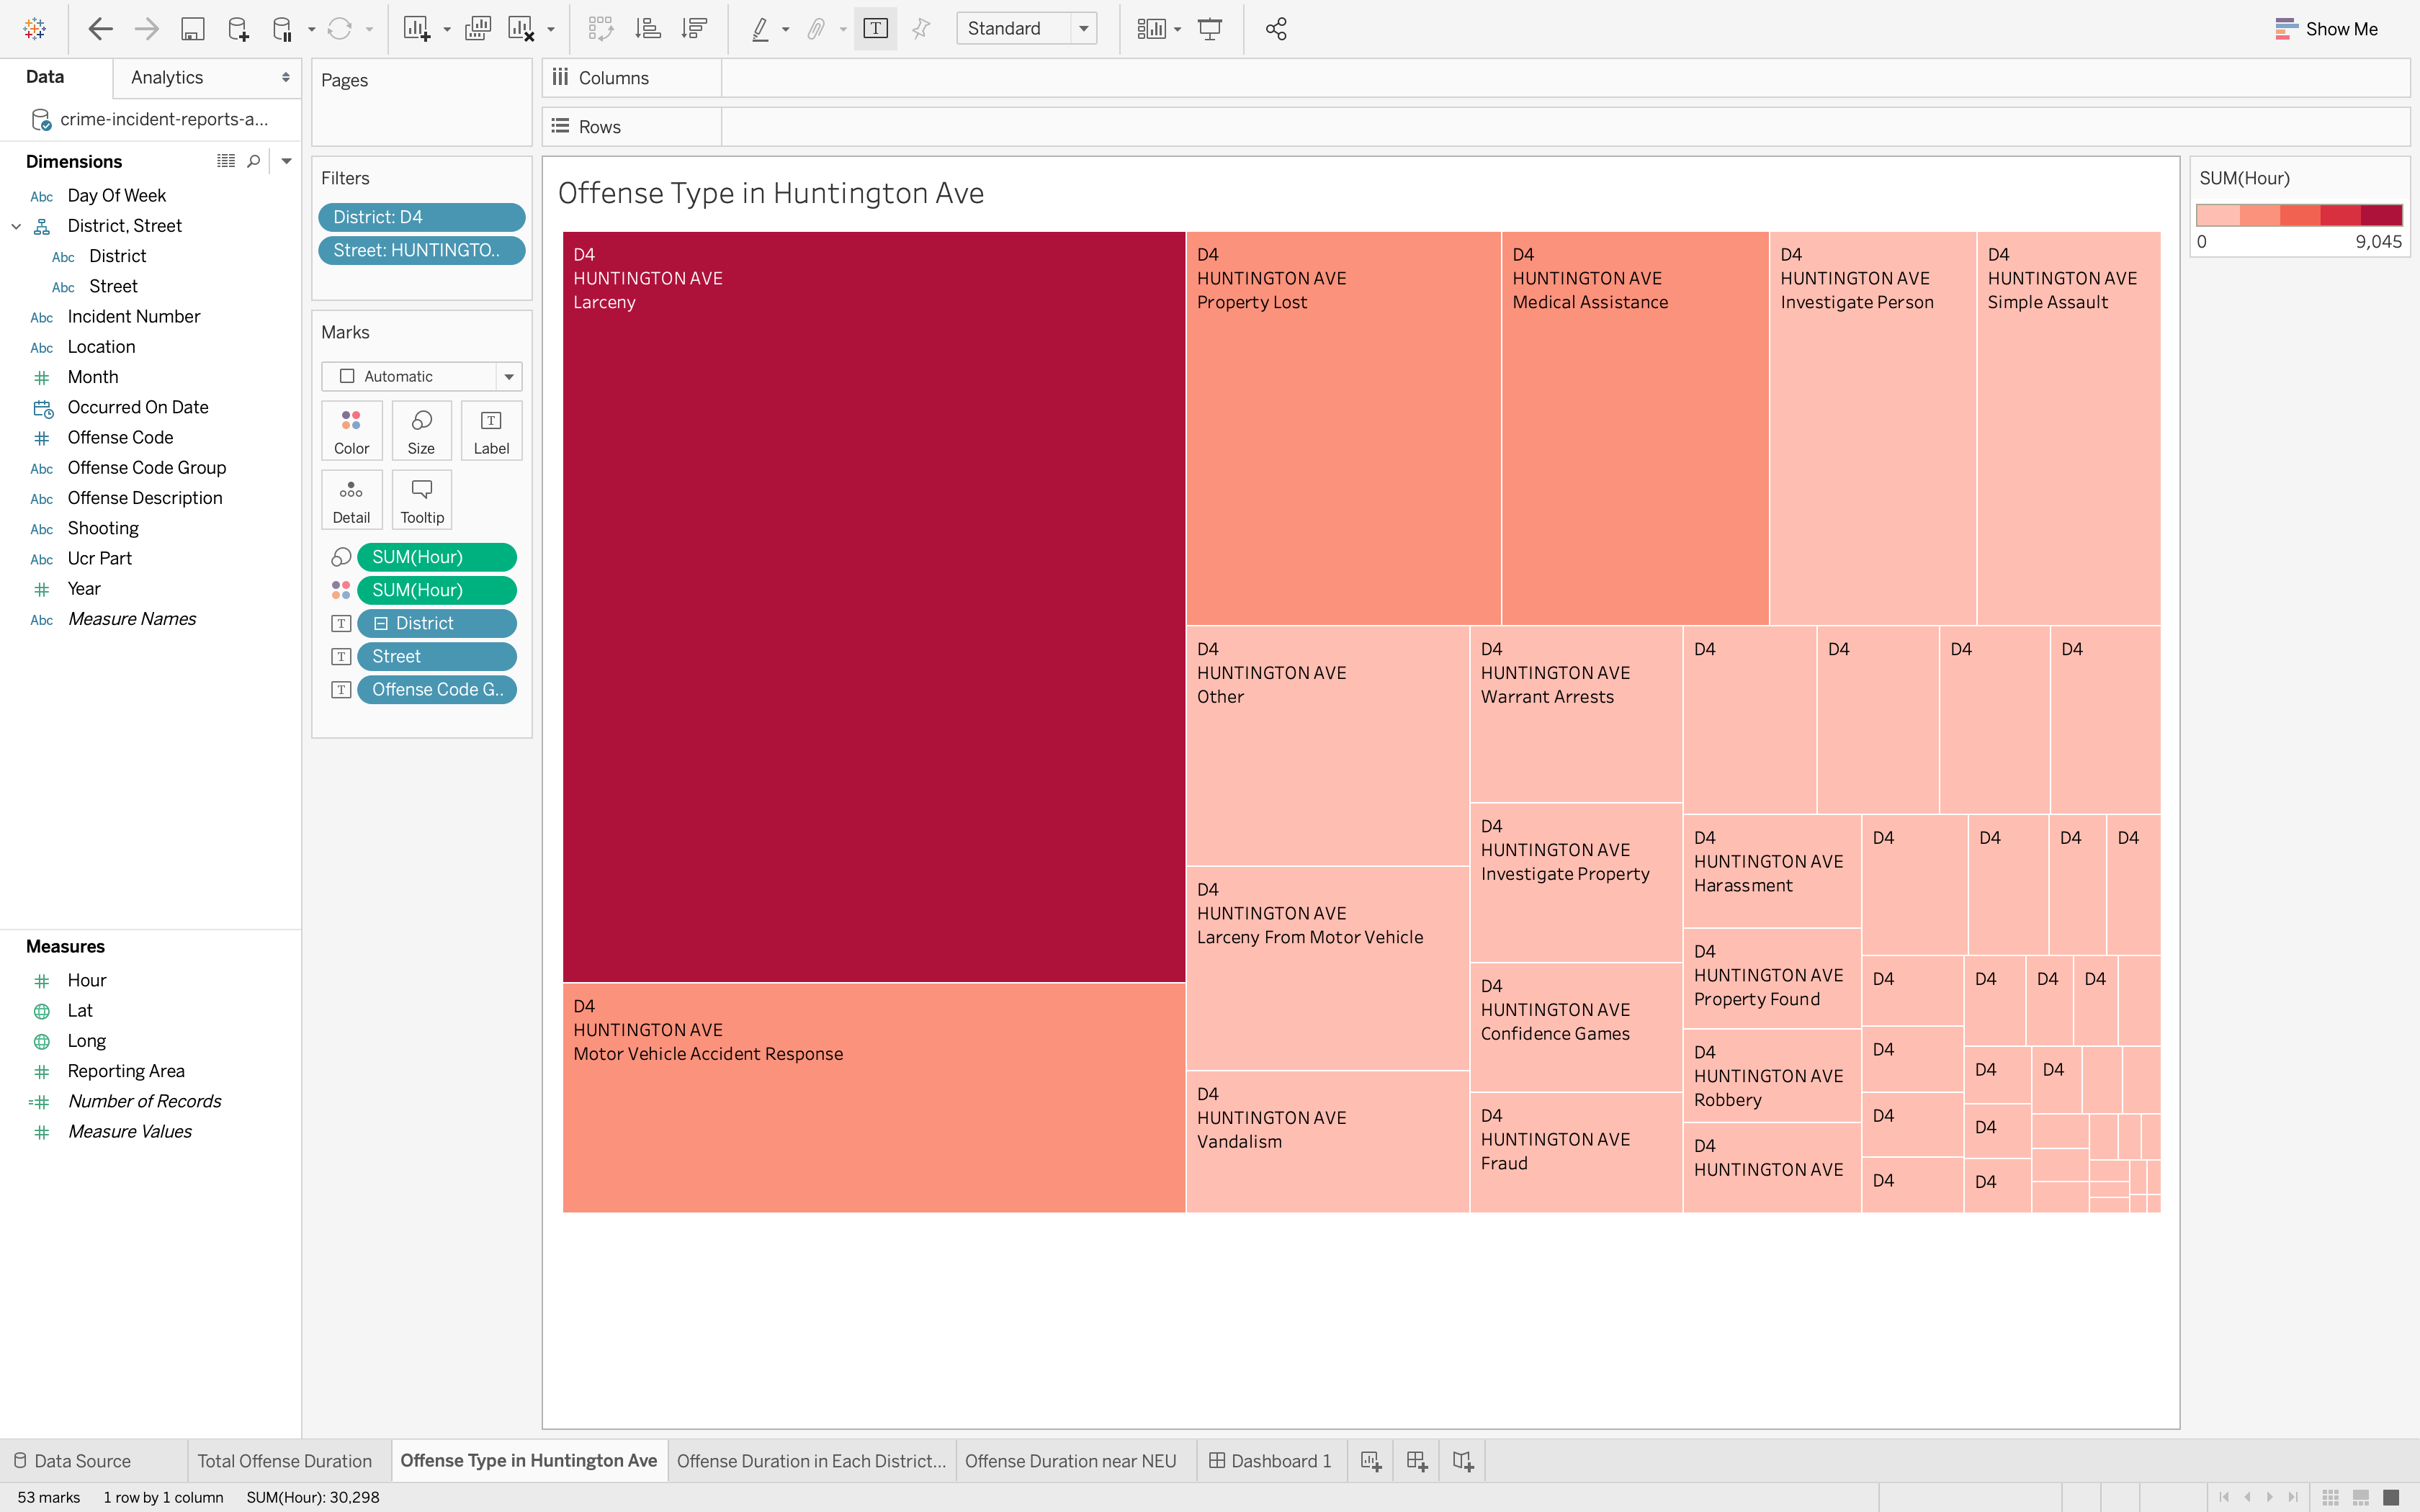
Treemap is a wonderful chart to show the offense type and frequency. We can see that larceny, property lost, and larceny from motor cycle are the most frequent offense reports. What they have in common is all about property. A great suggestion to reduce the crime rate at Huntington Avenue for the Police Department is to increase some public security cameras especially for the high offense rate areas and key intersections. And for ordinary people, please hide your valuable things and do not leave them in the vehicles.
Offense Duration in Each District
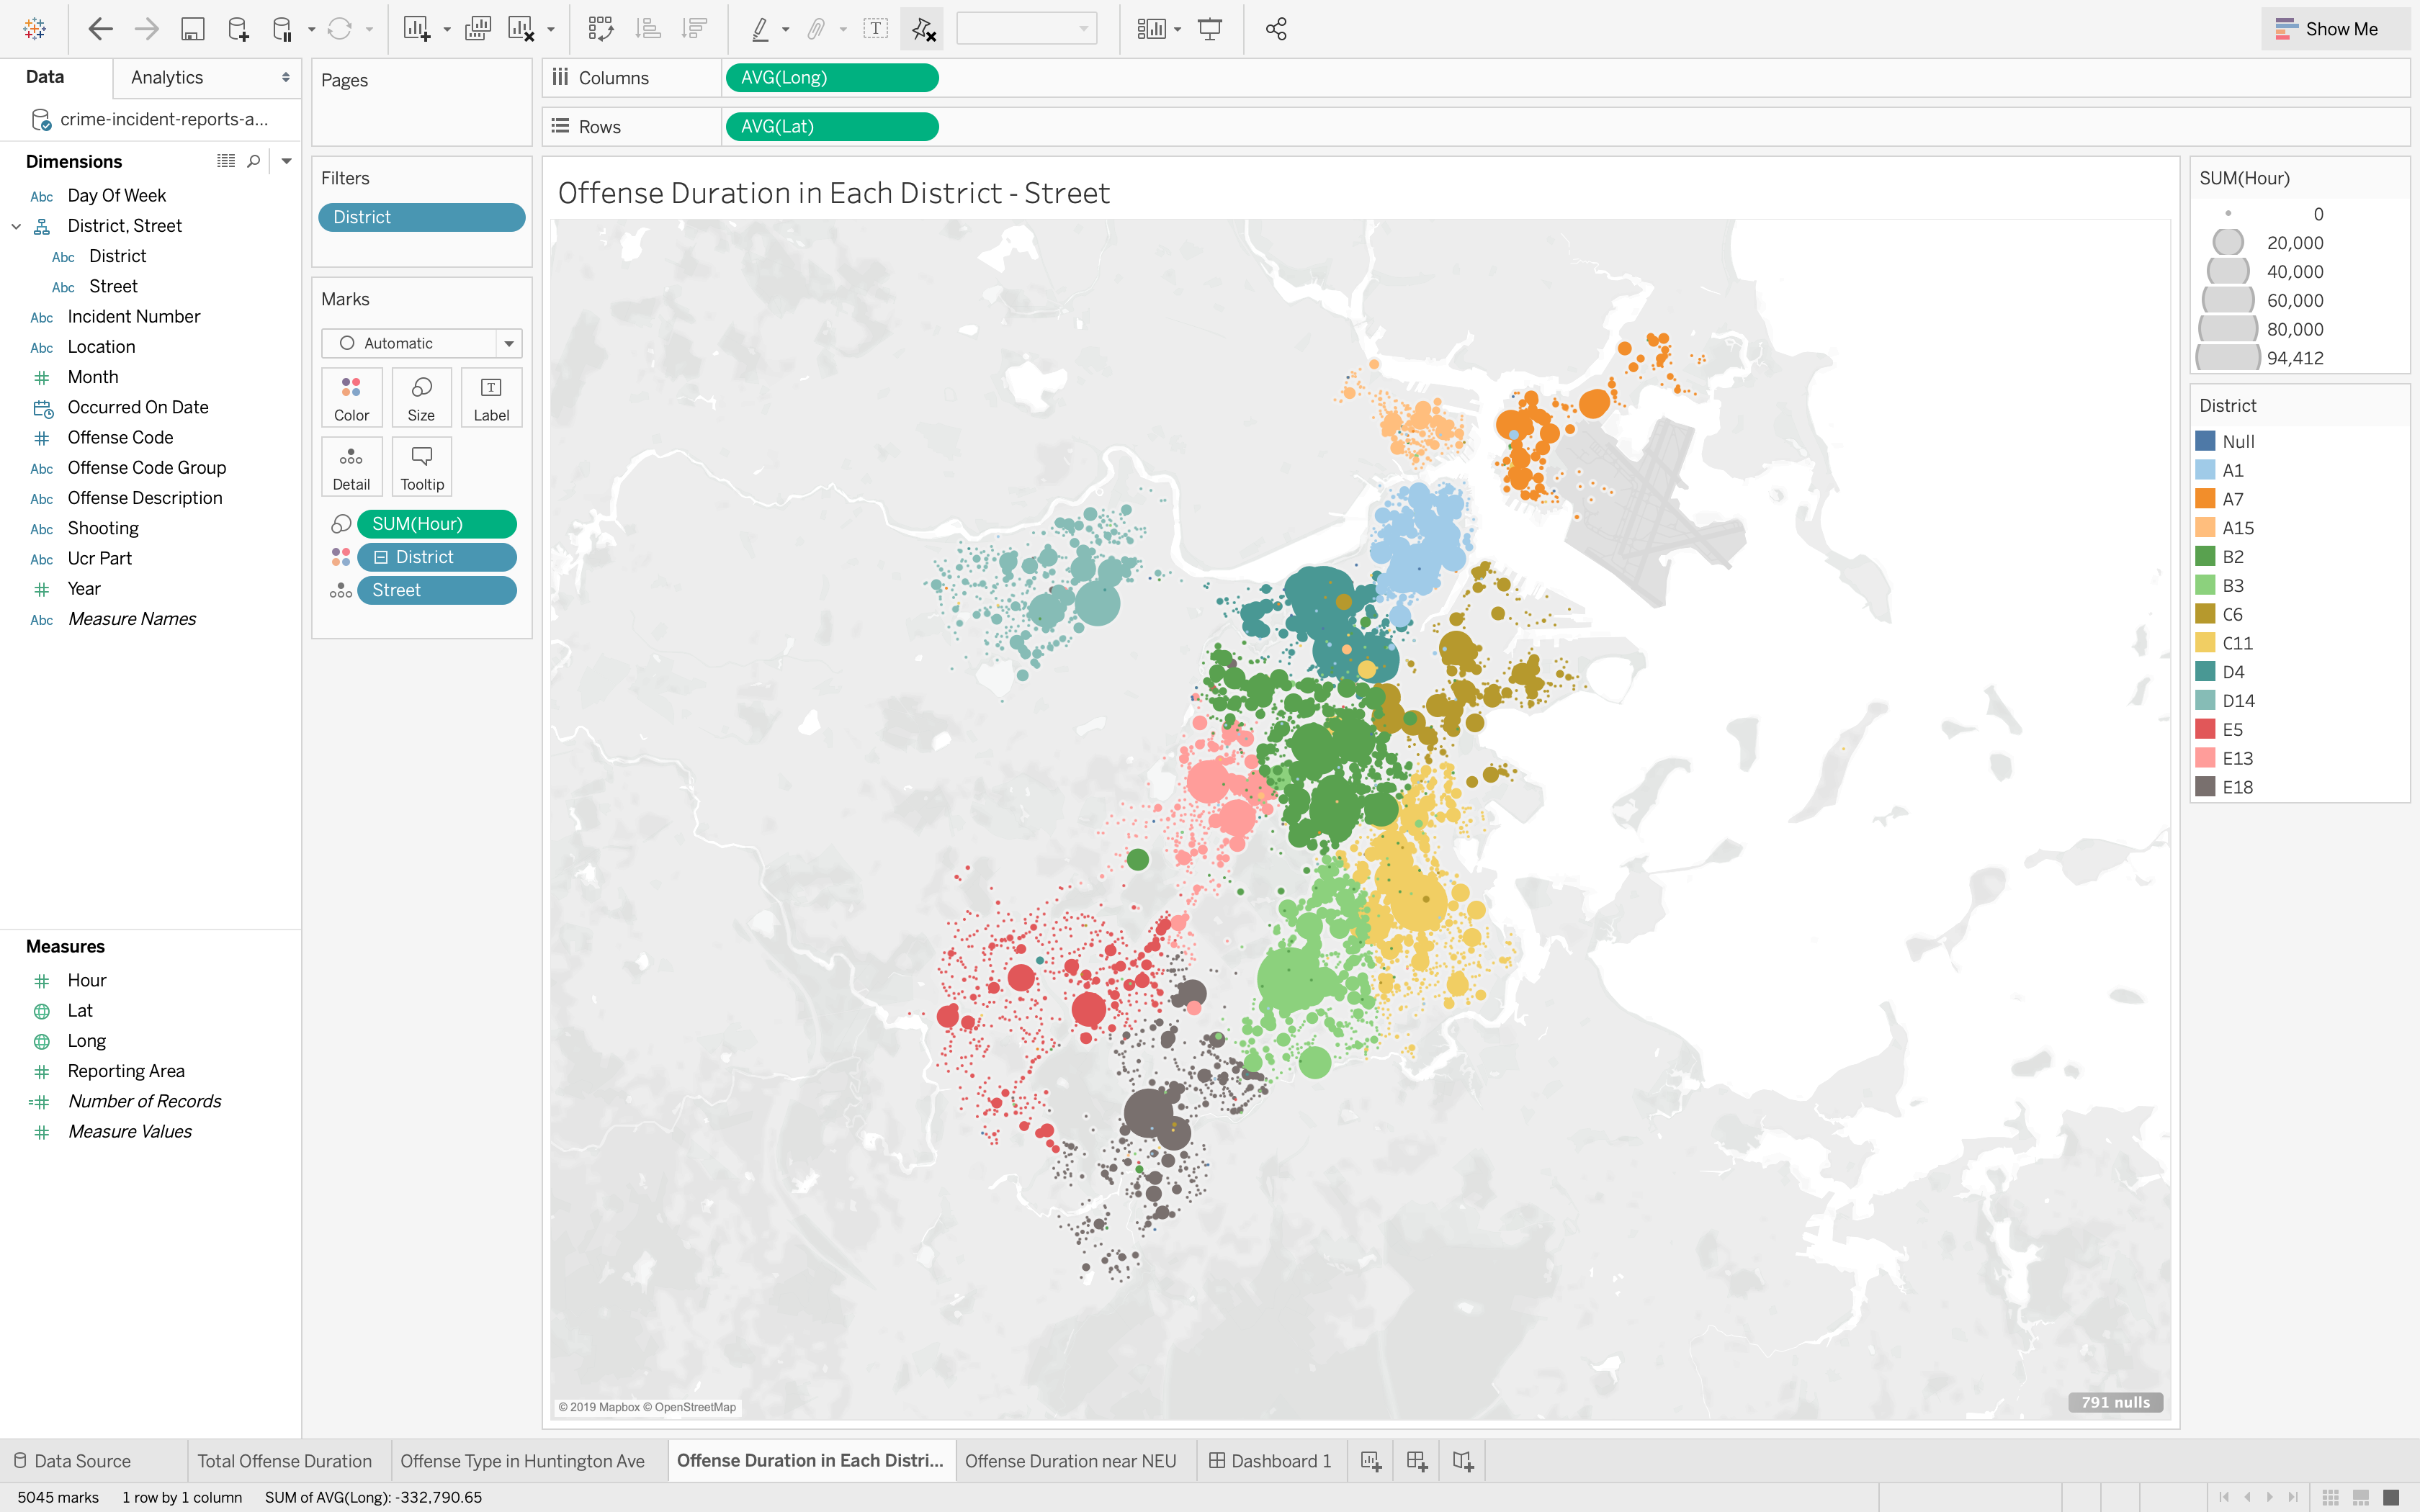
Let’s have an overall view of the offense duration in the Boston area. It looks terrible since almost all of the areas are covered by different colored and sized circles. However, do not forget the data sets are collected from August 2015 to date. Therefore, do not be so worried. Just focus on the area you most active.
Offense Duration near NEU
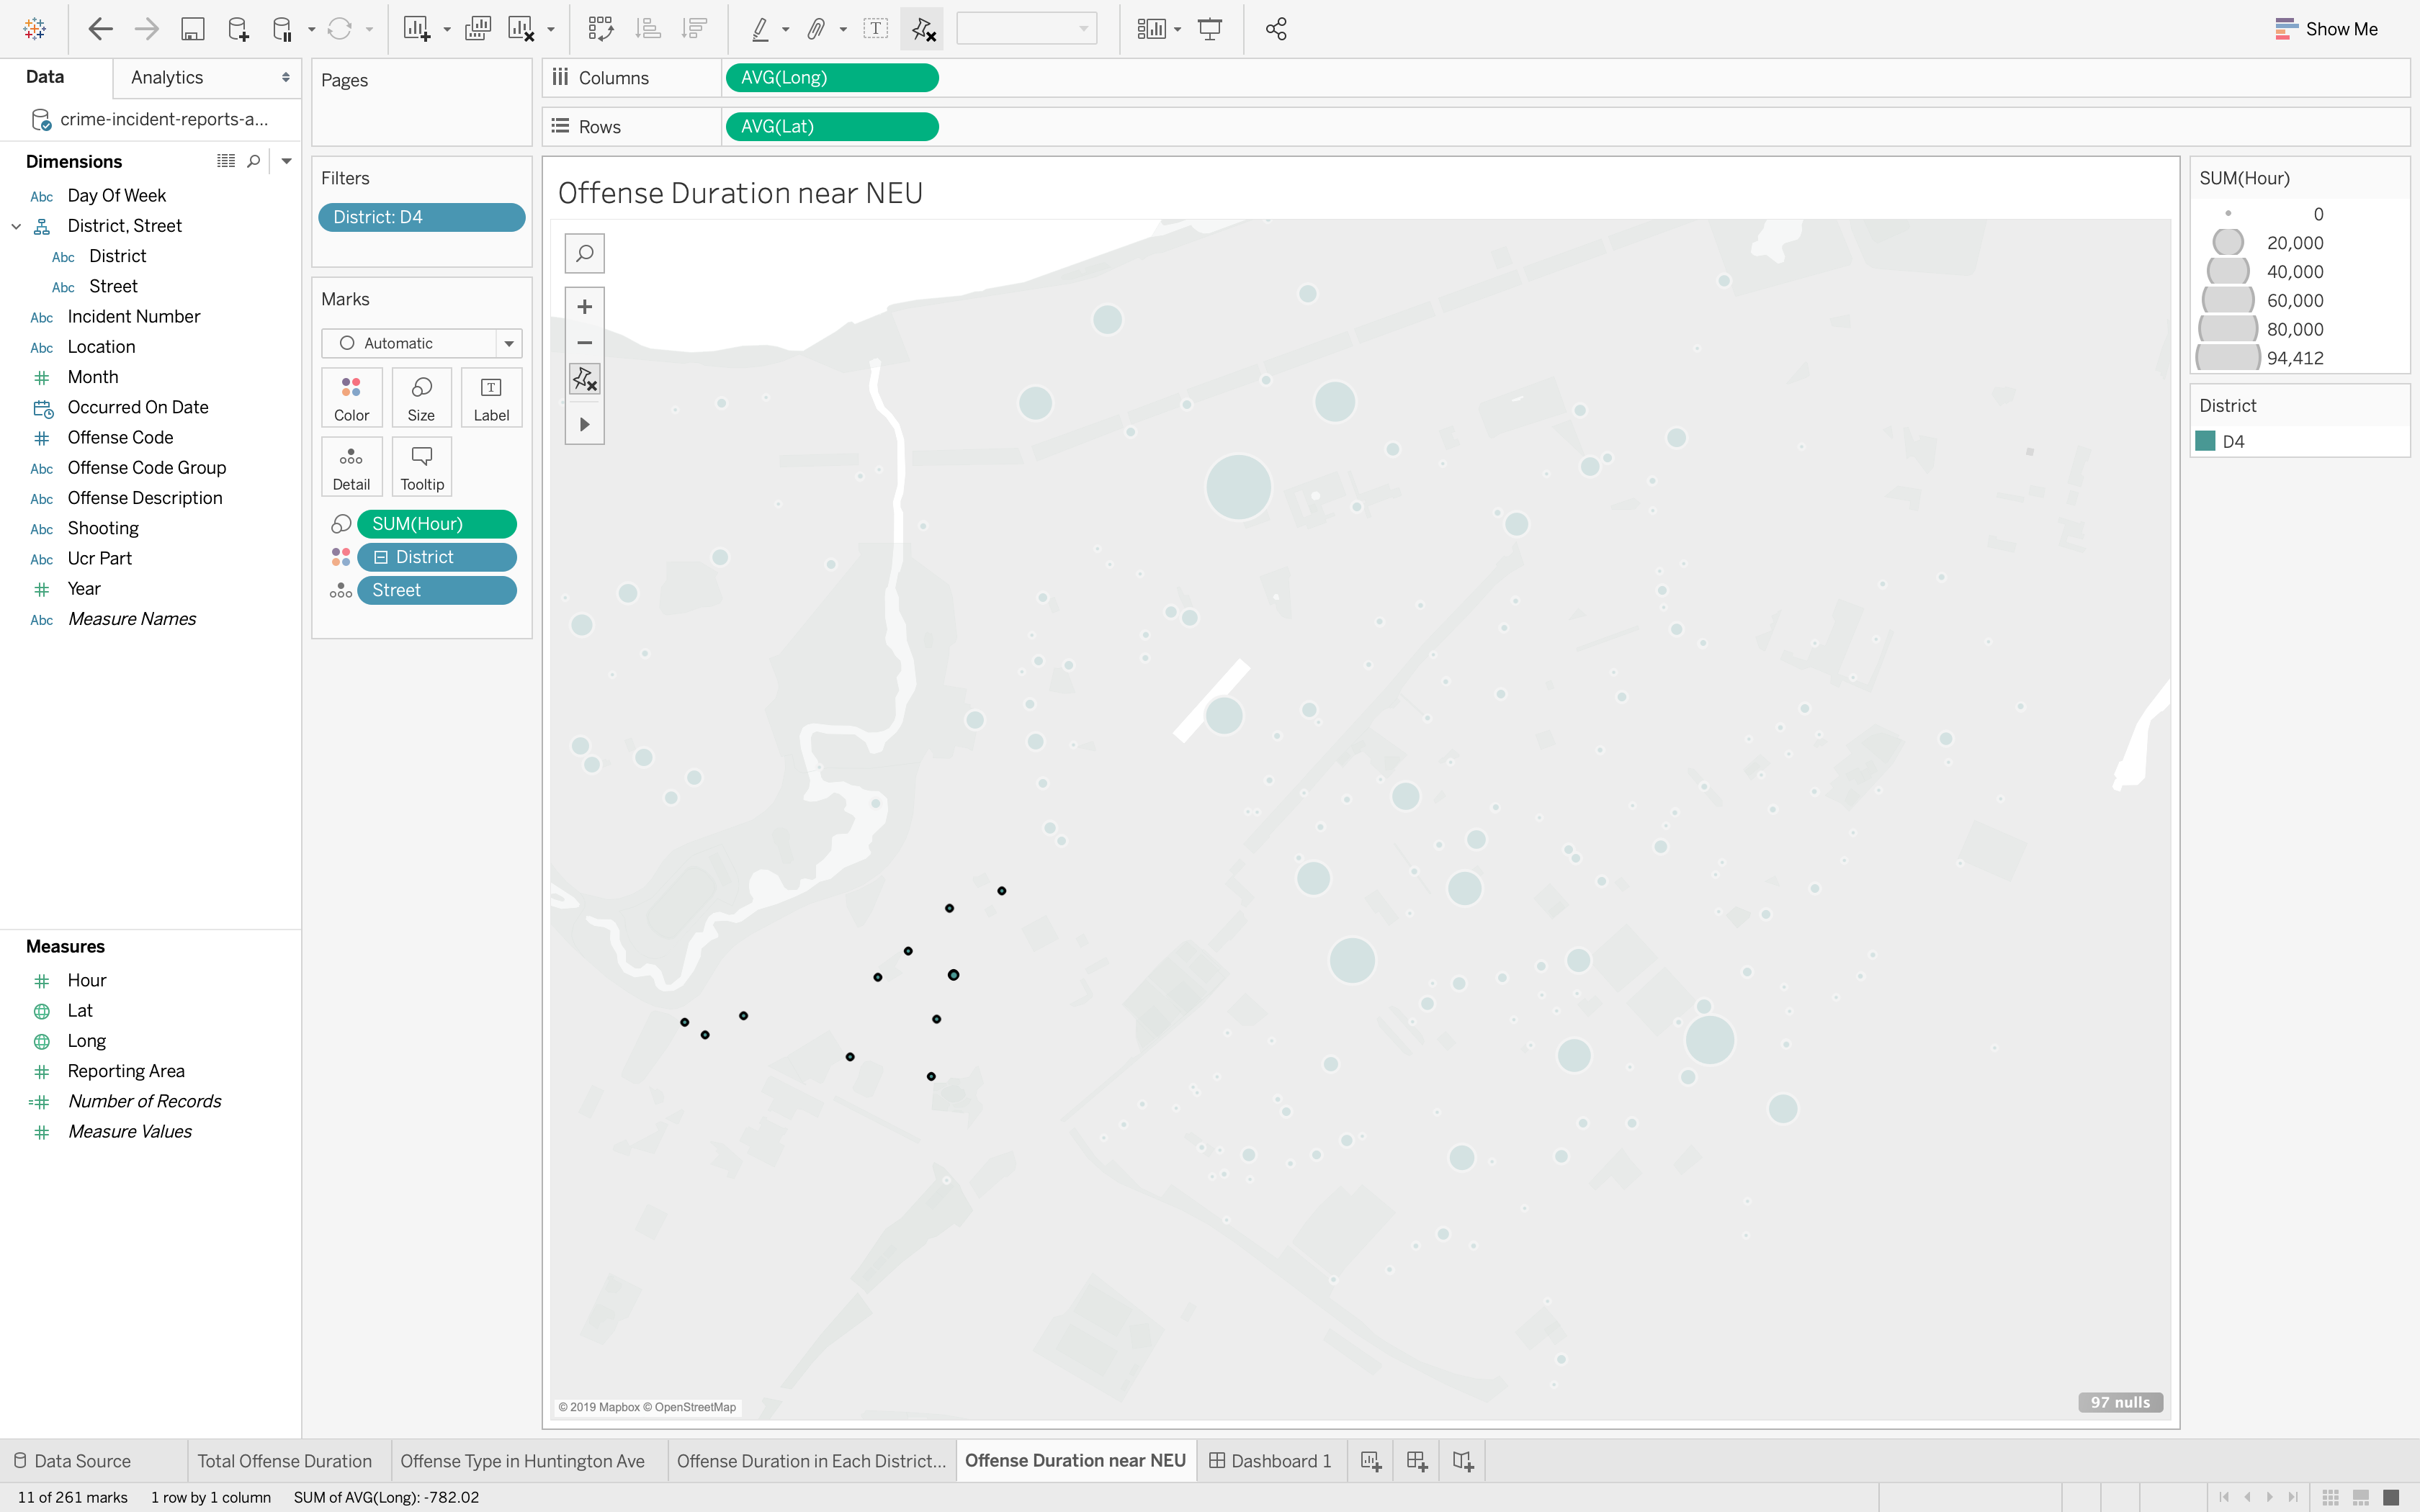
If we zoom in the symbol map and filter the D4 district and move the window to Northeastern University. NEU is not big enough to fill out the whole Huntington Ave. So we NEU students or faculties only need to focus on the area of NEU. Fortunately, compared to other areas in the D4 district, our school is very safe.
Conclusion
Analyzing and presenting the offense reports in good visualization is a good way to remind people to avoid potential crimes. It could also help the Police Department to reduce the crime rate. Do not forget, the above process showing the security situation of the area near NEU could be also applying in any area you are interested in Boston.
Answers
In the written portion of the final project, I would like for you to discuss:
The specific business case and objectives of your dashboard.
- Safety issue
How does visualizing your data and interacting with your dashboard aide the intended audience in decision support and/or meeting desired objectives?
- Visualization and interaction could help the audience easily understand dataset and deeper information. Additionally, it could also help people to track the trend and forecast.
What are the Key Metrics that you identified and selected to display? How did you decide to develop them, and why are they important? Please classify them as either driver metrics or outcome metrics.
- The key metrics in my research are Street and District. They are all important information for me to locate the offense. I set the Street as the sub-category of District. And I use the Hour, Latitude, and Longitude to describe the offense. Street and District are driver metrics.
While performing an exploratory data analysis and developing your dashboard, what are the interesting trends and insights you discovered? What types of strategy would you recommend to your stakeholders based upon the dashboard findings?
- One interesting insight is that the overall data may cheat the analysts. We should deep analyze the data and focus on the detail to uncover the truth. I will recommend to the stakeholders to select low offense reports area to develop a business. According to the “Offense Trend per Year” lines chart, I highly recommend the stakeholders to invest the areas with high offense slop which means it’s land price may increase.
Requirements
Final Paper: 750-1000 words, not including references
In this first milestone of this project, you submitted a project proposal that captured the “who, what, why and how” of your project, plus any challenges that you would foresee along the way.
In the written portion of the final project, I would like for you to discuss:
• The specific business case and objectives of your dashboard.
• How does visualizing your data and interacting with your dashboard aide the intended audience in decision support and/or meeting desired objectives?
• What are the Key Metrics that you identified and selected to display? How did you decide to develop them, and why are they important? Please classify them as either driver metrics or outcome metrics.
• While performing an exploratory data analysis and developing your dashboard, what are the interesting trends and insights you discovered? What types of strategy would you recommend to your stakeholders based upon the dashboard findings?
Dashboard Requirements:
Create one dashboard with the following:
• At least three panes in one dashboard.
• At least three different visualization types in the dashboard. (e.g. bar chart, scatter plot, map, etc.)
• Each visualization should illustrate different relationships (e.g., don’t just make a pie chart and a bar chart from the same data).
• One pane should interactively drive all of the others (see hints below).
• Every visualization should be relevant and useful for your organization.
Hints:
• Sometimes, categories are represented as numbers. Tableau will automatically process these attributes as numeric, which is not something we want! To change a numeric attribute to a category, drag it from Measures to Dimensions.
• Please use abundant Tableau documentation. Tableau has a wealth of tutorials, like this one on Building a Dashboard that can help you learn how to fulfill the requirements above.
NOTE: you may have to create an account again when trying to view these tutorials.
Reference
Crime Rate By Country 2019. Retrieved from http://worldpopulationreview.com/countries/crime-rate-by-country/